
Create successful ePaper yourself
Turn your PDF publications into a flip-book with our unique Google optimized e-Paper software.
PRESS RELEASE<br />
19 October <strong>2006</strong> 1 (15)<br />
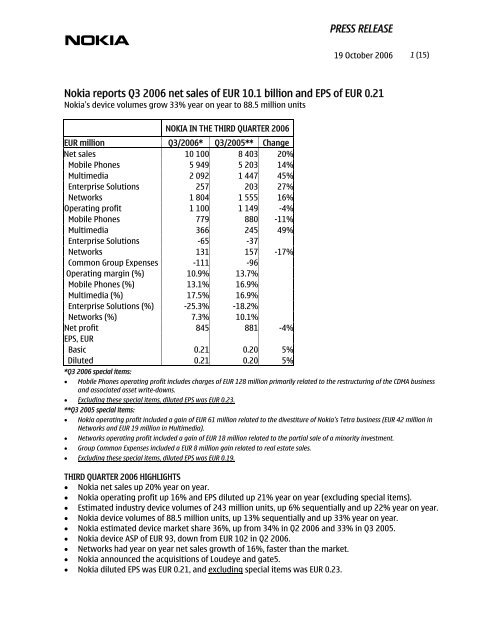
<strong>Nokia</strong> reports Q3 <strong>2006</strong> net sales of EUR 10.1 billion and EPS of EUR 0.21<br />
<strong>Nokia</strong>’s device volumes grow 33% year on year to 88.5 million units<br />
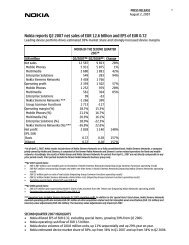
NOKIA IN THE THIRD QUARTER <strong>2006</strong><br />
EUR million Q3/<strong>2006</strong>* Q3/2005** Change<br />
Net sales 10 100 8 403 20%<br />
Mobile Phones 5 949 5 203 14%<br />
Multimedia 2 092 1 447 45%<br />
Enterprise Solutions 257 203 27%<br />
Networks 1 804 1 555 16%<br />
Operating profit 1 100 1 149 -4%<br />
Mobile Phones 779 880 -11%<br />
Multimedia 366 245 49%<br />
Enterprise Solutions -65 -37<br />
Networks 131 157 -17%<br />
Common Group Expenses -111 -96<br />
Operating margin (%) 10.9% 13.7%<br />
Mobile Phones (%) 13.1% 16.9%<br />
Multimedia (%) 17.5% 16.9%<br />
Enterprise Solutions (%) -25.3% -18.2%<br />
Networks (%) 7.3% 10.1%<br />
Net profit<br />
EPS, EUR<br />
845 881 -4%<br />
Basic 0.21 0.20 5%<br />
Diluted<br />
*Q3 <strong>2006</strong> special items:<br />
0.21 0.20 5%<br />
• Mobile Phones operating profit includes charges of EUR 128 million primarily related to the restructuring of the CDMA business<br />
and associated asset write-downs.<br />
• Excluding these special items, diluted EPS was EUR 0.23.<br />
**Q3 2005 special items:<br />
• <strong>Nokia</strong> operating profit included a gain of EUR 61 million related to the divestiture of <strong>Nokia</strong>’s Tetra business (EUR 42 million in<br />
Networks and EUR 19 million in Multimedia).<br />
• Networks operating profit included a gain of EUR 18 million related to the partial sale of a minority investment.<br />
• Group Common Expenses included a EUR 8 million gain related to real estate sales.<br />
• Excluding these special items, diluted EPS was EUR 0.19.<br />
THIRD QUARTER <strong>2006</strong> HIGHLIGHTS<br />
• <strong>Nokia</strong> net sales up 20% year on year.<br />
• <strong>Nokia</strong> operating profit up 16% and EPS diluted up 21% year on year (excluding special items).<br />
• Estimated industry device volumes of 243 million units, up 6% sequentially and up 22% year on year.<br />
• <strong>Nokia</strong> device volumes of 88.5 million units, up 13% sequentially and up 33% year on year.<br />
• <strong>Nokia</strong> estimated device market share 36%, up from 34% in Q2 <strong>2006</strong> and 33% in Q3 2005.<br />
• <strong>Nokia</strong> device ASP of EUR 93, down from EUR 102 in Q2 <strong>2006</strong>.<br />
• Networks had year on year net sales growth of 16%, faster than the market.<br />
• <strong>Nokia</strong> announced the acquisitions of Loudeye and gate5.<br />
• <strong>Nokia</strong> diluted EPS was EUR 0.21, and excluding special items was EUR 0.23.
PRESS RELEASE<br />
19 October <strong>2006</strong> 2 (15)<br />
OLLI-PEKKA KALLASVUO, NOKIA CEO:<br />
“<strong>Nokia</strong> delivered 20% net sales growth year on year, with excellent market share gains in our device<br />
business. We saw impressive share gains in the fast growing emerging markets, where we continued to<br />
build on our clear number one position. Catering mostly to the emerging markets, our entry-level device<br />
business performed extremely well, driven by outstanding volume growth and a solid product portfolio. The<br />
strong growth in the entry-level coupled with a lower percentage of sales in higher end products impacted<br />
our margins.<br />
In our multimedia business, we continued to perform well, with 45% year on year net sales growth in the<br />
third quarter. In infrastructure, Networks net sales grew faster than the market and we remain focused on<br />
improving profitability. <strong>Nokia</strong> and Siemens have made good progress toward the merger of <strong>Nokia</strong>’s<br />
Networks business group and Siemens’ carrier-related operations and continue to expect that operations<br />
will start in January.”<br />
INDUSTRY AND NOKIA OUTLOOK FOR THE FOURTH QUARTER AND FULL YEAR <strong>2006</strong><br />
• <strong>Nokia</strong> expects industry mobile device volumes in the fourth quarter <strong>2006</strong> to grow by 15% or more<br />
sequentially.<br />
• We expect <strong>Nokia</strong>’s device market share in the fourth quarter <strong>2006</strong> to be approximately at the same level<br />
sequentially.<br />
• Sales in our networks business are expected to grow sequentially in the fourth quarter, but at a rate less<br />
than previous years.<br />
• <strong>Nokia</strong> expects that the mobile device market volume will be approximately 970 million units in <strong>2006</strong>, while<br />
our estimate for 2005 was approximately 795 million units.<br />
• We continue to expect the device industry to experience value growth in <strong>2006</strong>, but expect some decline in<br />
industry ASPs, primarily reflecting the increasing impact of the emerging markets and competitive factors<br />
in general.<br />
• <strong>Nokia</strong> continues to expect moderate growth in the mobile infrastructure market in euro terms in <strong>2006</strong>.<br />
• <strong>Nokia</strong> continues to target an increase in its <strong>2006</strong> market share in mobile devices and infrastructure.<br />
Q3 <strong>2006</strong> FINANCIAL HIGHLIGHTS<br />
(Comparisons are given to the third quarter 2005 results, unless otherwise indicated.)<br />
<strong>Nokia</strong> Group<br />
<strong>Nokia</strong>'s third quarter <strong>2006</strong> net sales increased 20% to EUR 10.1 billion, compared with EUR 8.4 billion in the<br />
third quarter 2005. At constant currency, group net sales would have increased 18%.<br />
<strong>Nokia</strong>'s third quarter <strong>2006</strong> operating profit decreased 4% to EUR 1 100 million (including the negative<br />
impact of EUR 128 million in special items), compared with EUR 1 149 million in the third quarter 2005<br />
(including the positive impact of EUR 87 million in special items). <strong>Nokia</strong>’s third quarter <strong>2006</strong> operating<br />
margin was 10.9% (13.7%), including the impact of the respective special items, and 12.2% (12.6%)<br />
excluding the special items.<br />
Operating cash flow for the third quarter <strong>2006</strong> was EUR 1.0 billion, compared with EUR 1.2 billion for the<br />
third quarter 2005, and total combined cash and other liquid assets were EUR 7.9 billion, compared with<br />
EUR 9.9 billion at December 31, 2005. As of September 30, <strong>2006</strong>, our net debt-equity ratio (gearing) was<br />
-67%, compared with -77% at December 31, 2005.
PRESS RELEASE<br />
19 October <strong>2006</strong> 3 (15)<br />
Mobile devices<br />
In the third quarter <strong>2006</strong>, the total mobile device volume achieved by our Mobile Phones, Multimedia and<br />
Enterprise Solutions business groups reached 88.5 million units, representing 33% year on year growth and<br />
a 13% sequential increase. The overall industry volume for the same period reached an estimated 243 million<br />
units, representing 22% year on year growth and a 6% sequential increase.<br />
Converged device (smartphone) industry volumes increased to an estimated 19.9 million units, compared<br />
with an estimated 14 million units in Q3 2005. <strong>Nokia</strong>'s own converged device volumes rose to 10.4 million<br />
units, compared with 7.1 million units in Q3 2005. The converged device segment continued to be one of the<br />
fastest growing areas in mobile device volumes globally. <strong>Nokia</strong> Nseries volumes grew strongly, shipping<br />
more than 4 million units during the quarter.<br />
The following chart sets out <strong>Nokia</strong>'s mobile device volumes for the periods indicated, as well as the year<br />
on year and sequential growth rates by geographic area.<br />
NOKIA MOBILE DEVICE VOLUME BY GEOGRAPHIC AREA<br />
YoY Change<br />
QoQ Change<br />
(million units) Q3 <strong>2006</strong> Q3 2005 (%) Q2 <strong>2006</strong> (%)<br />
Europe 24.8 22.3 11.2 21.1 17.5<br />
Middle East & Africa 13.3 9.9 34.3 12.5 6.4<br />
China 13.8 8.5 62.4 11.7 17.9<br />
Asia-Pacific 20.9 12.6 65.9 18.8 11.2<br />
North America 5.8 5.8 0.0 5.2 11.5<br />
Latin America 9.9 7.5 32.0 9.1 8.8<br />
Total 88.5 66.6 33.0 78.4 12.9<br />
Based on our preliminary market estimate, <strong>Nokia</strong>’s market share for the third quarter <strong>2006</strong> was 36%,<br />
compared with 33% in the third quarter 2005 and 34% in the second quarter <strong>2006</strong>. <strong>Nokia</strong>’s year on year<br />
market share increase was driven primarily by strong gains in the emerging markets, particularly Latin<br />
America, China and Asia-Pacific, that more than offset market share declines in Middle East & Africa and<br />
to a lesser extent in Europe and North America. Sequentially, <strong>Nokia</strong> grew its market share most notably<br />
in Latin America and Asia-Pacific, followed by Middle East & Africa, Europe, North America and mainland<br />
China.<br />
<strong>Nokia</strong>’s average selling price in the third quarter <strong>2006</strong> was EUR 93, down from EUR 102 in the third quarter<br />
2005 and EUR 102 in the second quarter <strong>2006</strong>. Our lower ASP in the third quarter <strong>2006</strong> was primarily the<br />
result of a significantly higher proportion of entry-level device sales. Sequentially, ASPs were also<br />
impacted by a lower percentage of sales in higher end products. The higher proportion of entry-level<br />
device sales was driven by stronger than expected market growth in the emerging markets and<br />
significant <strong>Nokia</strong> share gains in those same markets.<br />
Business Groups<br />
Mobile Phones: Third quarter <strong>2006</strong> net sales increased 14% to EUR 5.9 billion, compared with EUR 5.2<br />
billion in the third quarter 2005, driven by strong volume growth, especially in the entry level, and<br />
<strong>Nokia</strong>’s ability to capture incremental volumes with its competitive entry-level product portfolio and<br />
strong logistics. Net sales increased in all regions year on year, with growth strongest in Latin America,<br />
China and Asia-Pacific.<br />
Mobile Phones operating profit decreased 11% and totaled EUR 779 million, compared with EUR 880<br />
million in the third quarter 2005, with an operating margin of 13.1% (16.9%). Reported third quarter
PRESS RELEASE<br />
19 October <strong>2006</strong> 4 (15)<br />
<strong>2006</strong> operating profit included charges of EUR 128 million primarily related to the restructuring of<br />
<strong>Nokia</strong>’s CDMA business and associated asset write-downs. Operating profit excluding these charges for<br />
the third quarter <strong>2006</strong> was EUR 907 million, with an operating margin of 15.3%. The slight increase in<br />
operating profit, excluding these charges, for the third quarter <strong>2006</strong> was the result of strong sales.<br />
Multimedia: Third quarter <strong>2006</strong> net sales increased 45% to EUR 2.1 billion, compared with EUR 1.4 billion in<br />
the third quarter 2005. Net sales increased year on year in all regions except North America and Latin<br />
America, where sales decreased. Multimedia net sales more than doubled year on year in China and Asia-<br />
Pacific. Net sales growth was driven by high volumes of <strong>Nokia</strong> Nseries multimedia computers.<br />
Multimedia third quarter operating profit grew 49% to EUR 366 million, compared with EUR 245 million<br />
in the third quarter 2005, with an operating margin of 17.5% (16.9%). Operating profit growth in the<br />
third quarter <strong>2006</strong> was driven by strong net sales growth and positive operating leverage compared to<br />
the third quarter 2005.<br />
Enterprise Solutions: Third quarter <strong>2006</strong> net sales increased 27% to EUR 257 million, compared with<br />
EUR 203 million in the third quarter 2005. Net sales increased year on year in all regions except Middle<br />
East & Africa and Latin America, where sales decreased. Net sales were positively impacted by strong<br />
year on year volume growth of mobile devices, especially the <strong>Nokia</strong> Eseries.<br />
In the third quarter <strong>2006</strong>, Enterprise Solutions had an operating loss of EUR 65 million, compared with<br />
an operating loss of EUR 37 million in the third quarter 2005. The increase in the operating loss was<br />
caused primarily by a higher marketing expense than in the third quarter 2005.<br />
Networks: Third quarter <strong>2006</strong> net sales increased 16% to EUR 1.8 billion, compared with EUR 1.6 billion<br />
in the third quarter 2005. The increase in Networks year on year net sales was primarily driven by<br />
strong growth in the emerging markets, especially in Middle East & Africa where sales more than<br />
doubled. Net sales declined year on year in North America and to a lesser extent in Latin America.<br />
Networks third quarter operating profit decreased 17% to EUR 131 million, compared with EUR 157<br />
million in the third quarter 2005, with an operating margin of 7.3% (10.1%). The operating profit in the<br />
third quarter <strong>2006</strong> increased, in comparison to the third quarter 2005 excluding the special items<br />
during that quarter, as a result of strong sales.<br />
Q3 <strong>2006</strong> OPERATING HIGHLIGHTS<br />
Mobile Phones<br />
• <strong>Nokia</strong> expanded its music device offering by introducing the <strong>Nokia</strong> 5300 XpressMusic, the <strong>Nokia</strong><br />
3250 XpressMusic, and the <strong>Nokia</strong> 5200.<br />
• <strong>Nokia</strong> unveiled three new mobile phones from the L’Amour Collection: the <strong>Nokia</strong> 7373, the <strong>Nokia</strong><br />
7360 and <strong>Nokia</strong>’s first 3G fashion product, the <strong>Nokia</strong> 7390.<br />
• <strong>Nokia</strong> unveiled its latest premium mobile phone, the <strong>Nokia</strong> 8800 Sirocco Edition.<br />
• Further strengthening its portfolio of 3G devices, <strong>Nokia</strong> unveiled the <strong>Nokia</strong> 6288, a 3G slide phone<br />
that adds high-quality video playing capabilities to its mix of features.<br />
• Expanding its portfolio of clamshell mobile phones, <strong>Nokia</strong> introduced the <strong>Nokia</strong> 6085 camera phone<br />
at a very competitive price.
PRESS RELEASE<br />
19 October <strong>2006</strong> 5 (15)<br />
Multimedia<br />
• <strong>Nokia</strong> announced three new <strong>Nokia</strong> Nseries products: the <strong>Nokia</strong> N75 clamshell, the <strong>Nokia</strong> N80 Internet<br />
Edition and the HSDPA <strong>Nokia</strong> N95.<br />
• <strong>Nokia</strong> announced music editions of three <strong>Nokia</strong> Nseries devices: the <strong>Nokia</strong> N70 Music Edition, the <strong>Nokia</strong><br />
N73 Music Edition and the <strong>Nokia</strong> N91 8GB.<br />
• <strong>Nokia</strong> announced the acquisitions of Loudeye, a global leader in digital music platforms, and gate5, a<br />
leading supplier of mapping and navigation software.<br />
• The <strong>Nokia</strong> N73 (SoftBank 705NK) was chosen for Softbank Mobile’s line-up in Japan.<br />
• <strong>Nokia</strong> announced cooperation with Microsoft and Yahoo! to bring Windows Live and Yahoo! Search into<br />
the <strong>Nokia</strong> Mobile Search platform.<br />
• <strong>Nokia</strong> launched the Music Recommenders community.<br />
• <strong>Nokia</strong> and Motorola announced a mobile TV cooperation in DVB-H enabled handsets and network<br />
compatibility testing.<br />
Enterprise Solutions<br />
• <strong>Nokia</strong> surpassed one million licenses sold to date in wireless email.<br />
• <strong>Nokia</strong> saw a 33% sequential increase in licenses sold and some new operator wins in the third<br />
quarter.<br />
• We announced that TietoEnator, a Scandinavian ICT company, will resell Intellisync Wireless Email<br />
and Intellisync Device Management.<br />
• NTT DoCoMo launched a consumer PIM back-up and restore service using our Intellisync SyncML<br />
platform, signing up 100,000 subscribers during the quarter.<br />
• Launched and started shipments of the <strong>Nokia</strong> E62 in the Americas with Cingular.<br />
• Launched the <strong>Nokia</strong> for Business Channel Program to expand the routes to market for corporate<br />
mobility solutions.<br />
Networks<br />
• <strong>Nokia</strong> announced several contracts in the Chinese market, including a EUR 580 million GSM/GPRS<br />
network expansion frame agreement with China Mobile; a USD 150 million GSM/GPRS expansion<br />
contract with Henan MCC; and GSM network expansion deals with Jiangxi MCC and Yunnan MCC.<br />
• <strong>Nokia</strong> won HSDPA contracts with customers including mobily and STC in Saudi Arabia, Singapore’s<br />
MobileOne, Taiwan Mobile, Greece’s TIM Hellas, Indonesia’s Telkomsel, and LMT in Latvia. Altogether<br />
<strong>Nokia</strong> has over 30 HSDPA references globally.<br />
• <strong>Nokia</strong> announced Managed Services contracts with mobily and Telkomsel. To date, <strong>Nokia</strong> has won<br />
close to 60 Managed Service contracts globally.<br />
• <strong>Nokia</strong> unveiled the first public deals for its Flexi WCDMA Base Station, winning contracts with TIM<br />
Hellas, Telkomsel, and Bulgaria’s Vivatel.<br />
• <strong>Nokia</strong> announced its 100 th mobile softswitch customer, France’s SFR. <strong>Nokia</strong> also announced it will<br />
host the world’s first commercial OMA Push-to-Talk over Cellular (PoC) and Presence services for<br />
3 Scandinavia in Sweden and Denmark.<br />
• <strong>Nokia</strong> announced a USD 150 million contract with Canada’s TELUS to deploy a next-generation IP<br />
broadband access network.<br />
For more information on the operating highlights mentioned above, please refer to related press<br />
announcements, which can be accessed at the following link: http://www.nokia.com/press.
PRESS RELEASE<br />
19 October <strong>2006</strong> 6 (15)<br />
NOKIA IN THE THIRD QUARTER <strong>2006</strong><br />
(International Financial Reporting Standards (IFRS) comparisons given to the third quarter 2005 results,<br />
unless otherwise indicated.)<br />
<strong>Nokia</strong>’s net sales increased 20% to EUR 10 100 million (EUR 8 403 million). Sales of Mobile Phones increased<br />
14% to EUR 5 949 million (EUR 5 203 million). Sales of Multimedia increased 45% to EUR 2 092 million<br />
(EUR 1 447 million). Sales of Enterprise Solutions increased 27% to EUR 257 million (EUR 203 million). Sales of<br />
Networks increased 16% to EUR 1 804 million (EUR 1 555 million).<br />
Operating profit decreased to EUR 1 100 million (EUR 1 149 million), representing an operating margin of<br />
10.9% (13.7%). Operating profit in Mobile Phones decreased 11% to EUR 779 million, including charges of<br />
EUR 128 million primarily related to the restructuring of the CDMA business and associated asset writedowns<br />
(EUR 880 million), representing an operating margin of 13.1% (16.9%). Operating profit in<br />
Multimedia increased 49% to EUR 366 million (EUR 245 million, including a gain of EUR 19 million related to<br />
the divestiture of <strong>Nokia</strong>’s Tetra business), representing an operating margin of 17.5% (16.9%). Enterprise<br />
Solutions reported an operating loss of EUR 65 million (operating loss of EUR 37 million). Operating profit in<br />
Networks decreased 17% to EUR 131 million (EUR 157 million, including a gain of EUR 42 million related to<br />
the divestiture of <strong>Nokia</strong>’s Tetra business and a gain of EUR 18 million related to the partial sale of a minority<br />
investment), representing an operating margin of 7.3% (10.1%). Common Group expenses totaled EUR 111<br />
million (EUR 96 million, including a EUR 8 million gain related to real estate sales).<br />
Financial income was EUR 34 million (EUR 63 million). Profit before tax and minority interests was EUR 1 145<br />
million (EUR 1 218 million). Net profit totaled EUR 845 million (EUR 881 million). Earnings per share increased<br />
to EUR 0.21 (basic) and to EUR 0.21 (diluted), compared with EUR 0.20 (basic) and EUR 0.20 (diluted) in the<br />
third quarter of 2005.<br />
NOKIA IN JANUARY – SEPTEMBER <strong>2006</strong><br />
(International Financial Reporting Standards (IFRS) comparisons given to the January – September 2005<br />
results, unless otherwise indicated.)<br />
<strong>Nokia</strong>’s net sales increased 23% to EUR 29 420 million (EUR 23 858 million). Sales of Mobile Phones increased<br />
21% to EUR 17 693 million (EUR 14 594 million). Sales of Multimedia increased 45% to EUR 5 741 million<br />
(EUR 3 957 million). Sales of Enterprise Solutions increased 3% to EUR 726 million (EUR 708 million). Sales of<br />
Networks increased 14% to EUR 5 269 million (EUR 4 606 million).<br />
Operating profit increased to EUR 3 969 million (EUR 3 271 million), representing an operating margin of<br />
13.5% (13.7%). Operating profit in Mobile Phones increased 12% to EUR 2 843 million (EUR 2 538 million),<br />
representing an operating margin of 16.1% (17.4%). Operating profit in Multimedia increased 89% to<br />
EUR 993 million (EUR 526 million), representing an operating margin of 17.3% (13.3%). Enterprise Solutions<br />
reported an operating loss of EUR 194 million (operating loss of EUR 122 million). Operating profit in<br />
Networks increased 16% to EUR 680 million (EUR 587 million), representing an operating margin of 12.9%<br />
(12.7%). Common Group expenses totaled EUR 353 million (EUR 258 million).<br />
In the period from January to September <strong>2006</strong>, net financial income was EUR 163 million (EUR 244 million).<br />
Profit before tax and minority interests was EUR 4 155 million (EUR 3 518 million). Net profit totaled<br />
EUR 3 033 million (EUR 2 543 million). Earnings per share increased to EUR 0.74 (basic) and to EUR 0.74<br />
(diluted), compared with EUR 0.58 (basic) and EUR 0.58 (diluted).
PRESS RELEASE<br />
19 October <strong>2006</strong> 7 (15)<br />
PERSONNEL<br />
The average number of employees from January to September <strong>2006</strong> was 64 342. At September 30, <strong>2006</strong>,<br />
<strong>Nokia</strong> employed a total of 67 693 people (58 874 people at December 31, 2005).<br />
SHARES AND SHARE CAPITAL<br />
<strong>Nokia</strong> repurchased through its share repurchase plan a total of 46 010 000 <strong>Nokia</strong> shares on the Helsinki<br />
Stock Exchange at an aggregate price of approximately EUR 719.9 million, and an average price of EUR 15.65<br />
per share, during the period from July 21, <strong>2006</strong> to September 22, <strong>2006</strong>. The price paid was based on the<br />
market price at the time of repurchase. The shares were repurchased to be used for the purposes specified<br />
in the authorization held by the Board. The aggregate par value of the shares purchased was EUR 2 760 600,<br />
representing approximately 1.1% of the share capital of the company and of the total voting rights. These<br />
new holdings did not have any significant effect on the relative holdings of the other shareholders of the<br />
company, nor on their voting power.<br />
<strong>Nokia</strong> was informed that the holdings of The Capital Group Companies, Inc. had fallen below 5% of the share<br />
capital of <strong>Nokia</strong> on September 15, <strong>2006</strong>, when it and its subsidiaries held through their clients a total of<br />
200 020 102 <strong>Nokia</strong> shares, corresponding to approximately 4.89% of the share capital of <strong>Nokia</strong>. Further,<br />
<strong>Nokia</strong> was informed that the holdings of the Capital Group Companies, Inc. had again exceeded 5% of the<br />
share capital of <strong>Nokia</strong> on September 21, <strong>2006</strong>. Then, it and its subsidiaries held through their clients a total<br />
of 204 960 602 <strong>Nokia</strong> shares, which corresponded to approximately 5.01% of the share capital of <strong>Nokia</strong>. The<br />
Capital Group Companies, Inc. is a holding company for several subsidiary companies engaged in investment<br />
management activities. Its holding in <strong>Nokia</strong> shares consists of both ADRs and ordinary shares.<br />
On September 30, <strong>2006</strong>, <strong>Nokia</strong> and its subsidiary companies owned 84 463 993 <strong>Nokia</strong> shares. The shares had<br />
an aggregate par value of EUR 5 067 839.58, representing approximately 2.1% of the share capital of the<br />
company and of the total voting rights. The total number of shares on September 30, <strong>2006</strong> was<br />
4 094 368 651 and the share capital was EUR 245 662 119.06.
Q3 <strong>2006</strong> BY BUSINESS GROUP, EUR million (unaudited)<br />
Mobile<br />
Phones Multimedia<br />
Enterprise<br />
Solutions Networks<br />
PRESS RELEASE<br />
19 October <strong>2006</strong> 8 (15)<br />
Common<br />
Group<br />
Functions<br />
Eliminations<br />
Group<br />
Net sales 5 949 2 092 257 1 804 - -2 10 100<br />
Gross profit 1 630 784 108 594 6 - 3 122<br />
Gross margin, % 27.4 37.5 42.0 32.9 30.9<br />
Research and<br />
development expenses -296 -213 -74 -262 -60 - -905<br />
% of net sales 5.0 10.2 28.8 14.5 9.0<br />
Selling and marketing<br />
expenses -373 -186 -75 -128 -6 - -768<br />
% of net sales 6.3 8.9 29.2 7.1 7.6<br />
Administrative and<br />
general expenses -20 -11 -20 -54 -46 - -151<br />
% of net sales 0.3 0.5 7.8 3.0 1.5<br />
Other operating income<br />
and expenses -162 -8 -4 -19 -5 - -198<br />
Operating profit 779 366 -65 131 -111 - 1 100<br />
Operating margin, % 13.1 17.5 -25.3 7.3 10.9<br />
Q3 2005 BY BUSINESS GROUP, EUR million (unaudited)<br />
Mobile<br />
Phones Multimedia<br />
Enterprise<br />
Solutions Networks<br />
Common<br />
Group<br />
Functions<br />
Eliminations<br />
Group<br />
Net sales 5 203 1 447 203 1 555 - -5 8 403<br />
Gross profit 1 590 582 103 552 6 - 2 833<br />
Gross margin, % 30.6 40.2 50.7 35.5 33.7<br />
Research and<br />
development expenses -292 -189 -76 -276 -52 - -885<br />
% of net sales 5.6 13.1 37.4 17.7 10.5<br />
Selling and marketing<br />
expenses -375 -145 -46 -121 -5 - -692<br />
% of net sales 7.2 10.0 22.7 7.8 8.2<br />
Administrative and<br />
general expenses -19 -10 -16 -49 -52 - -146<br />
% of net sales 0.4 0.7 7.9 3.2 1.7<br />
Other operating income<br />
and expenses -24 7 -2 51 7 39<br />
Operating profit 880 245 -37 157 -96 - 1 149<br />
Operating margin, % 16.9 16.9 -18.2 10.1 13.7
NOKIA NET SALES BY GEOGRAPHIC AREA, EUR million (unaudited)<br />
7-9/<strong>2006</strong> Y-o-Y change, % 7-9/2005 1-12/2005<br />
Europe 3 771 8 3 480 14 297<br />
Middle-East & Africa 1 318 17 1 124 4 554<br />
China 1 444 47 984 3 846<br />
Asia-Pacific 2 125 37 1 548 6 007<br />
North America 679 1 672 2 841<br />
Latin America 763 28 595 2 646<br />
Total 10 100 20 8 403 34 191<br />
NOKIA PERSONNEL BY GEOGRAPHIC AREA<br />
30.09.<strong>2006</strong> Y-o-Y change, % 30.09.2005 31.12.2005<br />
Europe 38 971 6 36 888 37 053<br />
Middle-East & Africa 922 248 265 355<br />
China 7 277 30 5 613 6 119<br />
Asia-Pacific 9 420 151 3 750 4 518<br />
North America 5 918 -8 6 405 6 369<br />
Latin America 5 185 14 4 556 4 460<br />
Total 67 693 18 57 477 58 874<br />
PRESS RELEASE<br />
19 October <strong>2006</strong> 9 (15)
CONSOLIDATED PROFIT AND LOSS ACCOUNT, IFRS, EUR million (unaudited)<br />
PRESS RELEASE<br />
19 October <strong>2006</strong> 10 (15)<br />
7-9/<strong>2006</strong> 7-9/2005 1-9/<strong>2006</strong> 1-9/2005 1-12/2005<br />
Net sales 10 100 8 403 29 420 23 858 34 191<br />
Cost of sales -6 978 -5 570 -19 834 -15 399 -22 209<br />
Gross profit 3 122 2 833 9 586 8 459 11 982<br />
Research and development expenses -905 -885 -2 832 -2 775 -3 825<br />
Selling and marketing expenses -768 -692 -2 307 -2 074 -2 961<br />
Administrative and general expenses -151 -146 -484 -438 -609<br />
Other income 59 123 446 267 285<br />
Other expenses -257 -84 -440 -168 -233<br />
Operating profit 1 100 1 149 3 969 3 271 4 639<br />
Share of results of associated companies 11 6 23 3 10<br />
Financial income and expenses 34 63 163 244 322<br />
Profit before tax 1 145 1 218 4 155 3 518 4 971<br />
Tax -289 -316 -1 071 -933 -1 281<br />
Profit before minority interests 856 902 3 084 2 585 3 690<br />
Minority interests -11 -21 -51 -42 -74<br />
Profit attributable to equity holders of the parent 845 881 3 033 2 543 3 616<br />
Earnings per share, EUR<br />
(for profit attributable to the equity holders<br />
of the parent)<br />
Basic 0.21 0.20 0.74 0.58 0.83<br />
Diluted 0.21 0.20 0.74 0.58 0.83<br />
Average number of shares (1 000 shares)<br />
Basic 4 037 146 4 346 264 4 087 308 4 406 569 4 365 547<br />
Diluted 4 048 306 4 351 389 4 099 655 4 411 043 4 371 239<br />
Depreciation and amortization, total 181 172 533 523 712<br />
Share-based compensation expense, total 42 21 100 47 104
CONSOLIDATED BALANCE SHEET, IFRS, EUR million (unaudited)<br />
PRESS RELEASE<br />
19 October <strong>2006</strong> 11 (15)<br />
ASSETS 30.09.<strong>2006</strong> 30.09.2005 31.12.2005<br />
Non-current assets<br />
Capitalized development costs 236 260 260<br />
Goodwill 450 90 90<br />
Other intangible assets 254 213 211<br />
Property, plant and equipment 1 584 1 537 1 585<br />
Investments in associated companies 211 183 193<br />
Available-for-sale investments 284 235 246<br />
Deferred tax assets 661 698 692<br />
Long-term loans receivable 19 7 63<br />
Other non-current assets 7 15 7<br />
3 706 3 238 3 347<br />
Current assets<br />
Inventories 2 275 1 730 1 668<br />
Accounts receivable 5 777 4 687 5 346<br />
Prepaid expenses and accrued income 1 910 1 515 1 938<br />
Other financial assets 58 124 89<br />
Available-for-sale investments, liquid assets 5 501 7 710 6 852<br />
Available-for-sale investments, cash equivalents 1 310 1 741 1 493<br />
Bank and cash 1 115 1 545 1 565<br />
17 946 19 052 18 951<br />
Total assets 21 652 22 290 22 298<br />
SHAREHOLDERS' EQUITY AND LIABILITIES<br />
Capital and reserves attributable to equity holders of the parent<br />
Share capital 246 266 266<br />
Share issue premium 2 593 2 408 2 458<br />
Treasury shares -1 365 -1 853 -3 616<br />
Translation differences 7 41 69<br />
Fair value and other reserves -49 -101 -176<br />
Retained earnings 9 752 12 093 13 154<br />
11 184 12 854 12 155<br />
Minority interests 86 186 205<br />
Total equity 11 270 13 040 12 360<br />
Non-current liabilities<br />
Long-term interest-bearing liabilities 70 20 21<br />
Deferred tax liabilities 140 140 151<br />
Other long-term liabilities 119 97 96<br />
329 257 268<br />
Current liabilities<br />
Short-term borrowing 266 333 377<br />
Accounts payable 4 264 3 570 3 494<br />
Accrued expenses 3 206 2 655 3 320<br />
Provisions 2 317 2 435 2 479<br />
10 053 8 993 9 670<br />
Total shareholders' equity and liabilities 21 652 22 290 22 298<br />
Interest-bearing liabilities 336 353 398<br />
Shareholders' equity per share, EUR 2.79 2.99 2.91<br />
Number of shares (1 000 shares) 1) 4 009 905 4 292 782 4 172 376<br />
1) Shares owned by Group companies are excluded.
CONSOLIDATED CASH FLOW STATEMENT, IFRS, EUR million (unaudited)<br />
PRESS RELEASE<br />
19 October <strong>2006</strong> 12 (15)<br />
1-9/<strong>2006</strong> 1-9/2005 1-12/2005<br />
Cash flow from operating activities<br />
Profit attributable to equity holders of the parent 3 033 2 543 3 616<br />
Adjustments, total<br />
Profit attributable to equity holders of the parent before change in net working<br />
1 338 1 237 1 774<br />
capital 4 371 3 780 5 390<br />
Change in net working capital -801 -15 -366<br />
Cash generated from operations 3 570 3 765 5 024<br />
Interest received 175 263 353<br />
Interest paid -7 -22 -26<br />
Other financial income and expenses, net received 44 9 47<br />
Income taxes paid -963 -934 -1 254<br />
Net cash from operating activities 2 819 3 081 4 144<br />
Cash flow from investing activities<br />
Acquisition of Group companies, net of acquired cash -388 - -92<br />
Purchase of current available-for-sale investments, liquid assets -2 879 -5 858 -7 277<br />
Purchase of non-current available-for-sale investments -66 -67 -89<br />
Purchase of shares in associated companies -8 -20 -16<br />
Additions to capitalized development costs -82 -114 -153<br />
Long-term loans made to customers -12 - -56<br />
Proceeds from repayment and sale of long-term loans receivable 56 - -<br />
Recovery of impaired long-term loans made to customers 276 - -<br />
Proceeds from (+), payment of (-) other long-term loans receivable -2 7 14<br />
Proceeds from (+), payment of (-) short-term loans receivable 235 184 182<br />
Capital expenditures -462 -424 -607<br />
Proceeds from disposal of shares in Group companies, net of disposed cash - 5 5<br />
Proceeds from disposal of shares in associated companies 1 - 18<br />
Proceeds from disposal of businesses - 95 95<br />
Proceeds from maturities and sale of current available-for-sale investments, liquid<br />
assets 4 124 7 194 9 402<br />
Proceeds from sale of current available-for-sale investments - 247 247<br />
Proceeds from sale of non-current available-for-sale investments 20 2 3<br />
Proceeds from sale of fixed assets 24 166 167<br />
Dividends received - - 1<br />
Net cash from investing activities 837 1 417 1 844<br />
Cash flow from financing activities<br />
Proceeds from stock option exercises 34 - 2<br />
Purchase of treasury shares -2 675 -2 495 -4 258<br />
Proceeds from long-term borrowings 57 2 5<br />
Repayment of long-term borrowings -7 -1 -<br />
Proceeds from (+), payment of (-) short-term borrowings -106 177 212<br />
Dividends paid -1 553 -1 514 -1 531<br />
Net cash used in financing activities -4 250 -3 831 -5 570<br />
Foreign exchange adjustment -39 162 183<br />
Net increase (+)/decrease (-) in cash and cash equivalents -633 829 601<br />
Cash and cash equivalents at beginning of period 3 058 2 457 2 457<br />
Cash and cash equivalents at end of period 2 425 3 286 3 058<br />
NB: The figures in the consolidated cash flow statement cannot be directly traced from the balance sheet<br />
without additional information as a result of acquisitions and disposals of subsidiaries and net foreign<br />
exchange differences arising on consolidation.
PRESS RELEASE<br />
CONSOLIDATED STATEMENT OF CHANGES IN SHAREHOLDERS' EQUITY, IFRS, EUR million (unaudited)<br />
Share<br />
issue<br />
premium<br />
Fair value<br />
and<br />
other<br />
reserves<br />
19 October <strong>2006</strong> 13 (15)<br />
Share<br />
Treasury Translation<br />
Retained Before Minority Total<br />
capital<br />
shares difference<br />
earnings minority interest equity<br />
Balance at December 31, 2004 280 2 272 -2 022 -126 69 13 765 14 238 168 14 406<br />
Impact of implementing IFRS 2 94 -101 -7 -7<br />
Impact of implementing IAS 39R<br />
Revised balance at December 31,<br />
-56 56 - -<br />
2004<br />
Tax benefit on stock options<br />
280 2 366 -2 022 -126 13 13 720 14 231 168 14 399<br />
exercised -5 -5 -5<br />
Translation differences 339 339 26 365<br />
Net investment hedge losses -172 -172 -172<br />
Cash flow hedges, net of tax<br />
Available-for-sale investments,<br />
-93 -93 -93<br />
net of tax -21 -21 -21<br />
Other decrease, net -43 -43 1 -42<br />
Profit<br />
Total recognized income and<br />
2 543 2 543 42 2 585<br />
expense<br />
Stock options exercised related<br />
- -5 - 167 -114 2 500 2 548 69 2 617<br />
to acquisitions -2 -2 -2<br />
Share-based compensation 35 35 35<br />
Acquisition of treasury shares -2 504 -2 504 -2 504<br />
Reissuance of treasury shares 9 9 9<br />
Cancellation of treasury shares -14 14 2 664 -2 664 - -<br />
Dividend -1 463 -1 463 -51 -1 514<br />
Total other equity movements -14 47 169 - - -4 127 -3 925 -51 -3 976<br />
Balance at September 30, 2005 266 2 408 -1 853 41 -101 12 093 12 854 186 13 040<br />
Balance at December 31, 2005 266 2 458 -3 616 69 -176 13 154 12 155 205 12 360<br />
Tax benefit on stock options<br />
exercised 17 17 17<br />
Translation differences -115 -115 -9 -124<br />
Net investment hedge gains 53 53 53<br />
Cash flow hedges, net of tax 127 127 127<br />
Available-for-sale investments,<br />
net of tax 0 0 0<br />
Other increase, net 4 4 -1 3<br />
Profit 3 033 3 033 51 3 084<br />
Total recognized income and<br />
expense - 17 - -62 127 3 037 3 119 41 3 160<br />
Stock options exercised 34 34 34<br />
Stock options exercised related<br />
to acquisitions -1 -1 -1<br />
Share-based compensation 62 62 62<br />
Settlement of performance shares 3 34 37 37<br />
Acquisition of treasury shares -2 713 -2 713 -2 713<br />
Reissuance of treasury shares 3 3 3<br />
Cancellation of treasury shares -20 20 4 927 -4 927 - -<br />
Dividend -1 512 -1 512 -41 -1 553<br />
Acquisition of minority interests - -119 -119<br />
Total of other equity movements -20 118 2 251 - - -6 439 -4 090 -160 -4 250<br />
Balance at September 30, <strong>2006</strong> 246 2 593 -1 365 7 -49 9 752 11 184 86 11 270
COMMITMENTS AND CONTINGENCIES, EUR million (unaudited)<br />
PRESS RELEASE<br />
19 October <strong>2006</strong> 14 (15)<br />
GROUP<br />
30.09.<strong>2006</strong> 30.09.2005 31.12.2005<br />
Collateral for own commitments<br />
Property under mortgages 18 18 18<br />
Assets pledged 27 11 10<br />
Contingent liabilities on behalf of Group companies<br />
Other guarantees 407 253 276<br />
Contingent liabilities on behalf of other companies<br />
Guarantees for loans 28 6 -<br />
Other guarantees 2 3 2<br />
Leasing obligations 605 619 664<br />
Financing commitments<br />
Customer finance commitments 214 56 13<br />
NOTIONAL AMOUNTS OF DERIVATIVE FINANCIAL INSTRUMENTS, EUR million 1) (unaudited)<br />
30.09.<strong>2006</strong> 30.09.2005 31.12.2005<br />
Foreign exchange forward contracts 2) 32 843 29 077 29 991<br />
Currency options bought 2) 380 318 284<br />
Currency options sold 2) 189 177 165<br />
Interest rate swaps and futures 3 211 2 607 50<br />
Cash settled equity options 3) 133 150 150<br />
1) Includes the gross amount of all notional values for contracts that have not yet been settled or cancelled. The<br />
amount of notional value outstanding is not necessarily a measure or indication of market risk, as the exposure of<br />
certain contracts may be offset by that of other contracts.<br />
2) Notional amounts include contracts used to hedge the shareholders' equity of foreign subsidiaries.<br />
3) Cash settled equity options can be used to hedge risks relating to incentive programs and investment activities.<br />
1 EUR = 1.268 USD
PRESS RELEASE<br />
19 October <strong>2006</strong> 15 (15)<br />
It should be noted that certain statements herein which are not historical facts, including, without limitation, those regarding: A) the<br />
timing of product and solution deliveries; B) our ability to develop, implement and commercialize new products, solutions and<br />
technologies; C) expectations regarding market growth, developments and structural changes; D) expectations regarding our mobile<br />
device volume growth, market share, prices and margins; E) expectations and targets for our results of operations; F) the outcome of<br />
pending and threatened litigation; G) expected timing, scope and effects of the merger of <strong>Nokia</strong>'s and Siemens' communications service<br />
provider businesses; and H) statements preceded by "believe," "expect," "anticipate," "foresee," "target," "estimate," "designed," "plans,"<br />
"will” or similar expressions are forward-looking statements. Because these statements involve risks and uncertainties, actual results<br />
may differ materially from the results that we currently expect. Factors that could cause these differences include, but are not limited to:<br />
1) the extent of the growth of the mobile communications industry, as well as the growth and profitability of the new market segments<br />
within that industry which we target; 2) the availability of new products and services by network operators and other market<br />
participants; 3) our ability to identify key market trends and to respond timely and successfully to the needs of our customers; 4) the<br />
impact of changes in technology and our ability to develop or otherwise acquire complex technologies as required by the market, with<br />
full rights needed to use; 5) competitiveness of our product portfolio; 6) timely and successful commercialization of new advanced<br />
products and solutions; 7) price erosion and cost management; 8) the intensity of competition in the mobile communications industry<br />
and our ability to maintain or improve our market position and respond to changes in the competitive landscape; 9) our ability to<br />
manage efficiently our manufacturing and logistics, as well as to ensure the quality, safety, security and timely delivery of our products<br />
and solutions; 10) inventory management risks resulting from shifts in market demand; 11) our ability to source quality components<br />
without interruption and at acceptable prices; 12) our success in collaboration arrangements relating to development of technologies or<br />
new products and solutions; 13) the success, financial condition and performance of our collaboration partners, suppliers and<br />
customers; 14) any disruption to information technology systems and networks that our operations rely on; 15) our ability to protect the<br />
complex technologies that we or others develop or that we license from claims that we have infringed third parties' intellectual property<br />
rights, as well as our unrestricted use on commercially acceptable terms of certain technologies in our products and solution offerings;<br />
16) general economic conditions globally and, in particular, economic or political turmoil in emerging market countries where we do<br />
business; 17) developments under large, multi-year contracts or in relation to major customers; 18) exchange rate fluctuations,<br />
including, in particular, fluctuations between the euro, which is our reporting currency, and the US dollar, the Chinese yuan, the UK<br />
pound sterling and the Japanese yen; 19) the management of our customer financing exposure; 20) our ability to recruit, retain and<br />
develop appropriately skilled employees; 21) the impact of changes in government policies, laws or regulations; and 22) satisfaction of<br />
the conditions to the merger of <strong>Nokia</strong>'s and Siemens' communications service provider businesses, and closing of transaction, and<br />
<strong>Nokia</strong>'s and Siemens' ability to successfully integrate the operations and employees of their respective businesses; as well as 23) the risk<br />
factors specified on pages 12 - 22 of the company's annual report on Form 20-F for the year ended December 31, 2005 under "Item 3.D<br />
Risk Factors.” Other unknown or unpredictable factors or underlying assumptions subsequently proving to be incorrect could cause<br />
actual results to differ materially from those in the forward-looking statements. <strong>Nokia</strong> does not undertake any obligation to update<br />
publicly or revise forward-looking statements, whether as a result of new information, future events or otherwise, except to the extent<br />
legally required.<br />
<strong>Nokia</strong>, Helsinki – October 19, <strong>2006</strong><br />
Media and Investor Contacts:<br />
Corporate Communications, tel. +358 7180 34495 or +358 7180 34900<br />
Investor Relations Europe, tel. +358 7180 34289<br />
Investor Relations US, tel. +1 914 368 0555<br />
www.nokia.com<br />
- <strong>Nokia</strong> plans to report Q4 and full-year <strong>2006</strong> results on January 25, 2007.<br />
- <strong>Nokia</strong> will publish four interim reports in 2007.<br />
- The Annual General Meeting is scheduled to be held on May 3, 2007.