IUCN Red List Index - Guidance for National and Regional Use
IUCN Red List Index - Guidance for National and Regional Use
IUCN Red List Index - Guidance for National and Regional Use

Create successful ePaper yourself
Turn your PDF publications into a flip-book with our unique Google optimized e-Paper software.
<strong>IUCN</strong> <strong>Red</strong> <strong>List</strong> <strong>Index</strong><br />
<strong>Guidance</strong> <strong>for</strong> national <strong>and</strong> regional use<br />
Version 1.1<br />
The <strong>IUCN</strong> <strong>Red</strong> <strong>List</strong> of Threatened Species
<strong>Guidance</strong> <strong>for</strong> national <strong>and</strong> regional use<br />
This guidance document to support national <strong>and</strong> regional use of<br />
the <strong>IUCN</strong> <strong>Red</strong> <strong>List</strong> <strong>Index</strong> is a product of the <strong>IUCN</strong> <strong>Red</strong> <strong>List</strong> of<br />
Threatened Species. It has been developed by <strong>IUCN</strong> <strong>and</strong> its<br />
partner organizations. Support <strong>for</strong> the production of this document<br />
has been provided by the 2010 Biodiversity Indicators Partnership<br />
(www.twentyten.net). It has been written by:<br />
Philip Bubb, UNEP-WCMC<br />
Stuart Butchart, BirdLife International<br />
Ben Collen, Institute of Zoology, London<br />
Holly Dublin, Chair, <strong>IUCN</strong> Species Survival Commission,<br />
2004-2008<br />
Val Kapos, UNEP-WCMC<br />
Caroline Pollock, <strong>IUCN</strong> Species Programme<br />
Simon Stuart, Chair, <strong>IUCN</strong> Species Survival Commission,<br />
Jean-Christophe Vié, <strong>IUCN</strong> Species Programme<br />
<strong>IUCN</strong> intends these guidelines to be a “living document” similar to<br />
the Guidelines <strong>for</strong> using the <strong>IUCN</strong> <strong>Red</strong> <strong>List</strong> Categories <strong>and</strong> Criteria<br />
(http://www.iucnredlist.org/static/categories_criteria).<br />
Please send feedback, suggestions <strong>for</strong> improvement of the<br />
guidelines, examples of their use <strong>and</strong> requests <strong>for</strong> technical<br />
advice in using the RLI to: redlist@iucn.org<br />
This <strong>and</strong> other indicator guidance documents supported by the<br />
2010 Biodiversity Indicators Partnership are available from the<br />
website www.twentyten.net<br />
Citation: Bubb, P.J., Butchart, S.H.M., Collen, B., Dublin, H.,<br />
Kapos, V., Pollock, C., Stuart, S. N., Vié, J-C. (2009). <strong>IUCN</strong><br />
<strong>Red</strong> <strong>List</strong> <strong>Index</strong> - <strong>Guidance</strong> <strong>for</strong> <strong>National</strong> <strong>and</strong> <strong>Regional</strong> <strong>Use</strong>. Gl<strong>and</strong>,<br />
Switzerl<strong>and</strong>: <strong>IUCN</strong>.<br />
Disclaimer: The designation of geographical entities in this<br />
book, <strong>and</strong> the presentation of the material, do not imply<br />
the expression of any opinion whatsoever on the part of<br />
<strong>IUCN</strong>, Biodiversity Indicators Partnership or UNEP-WCMC<br />
concerning the legal status of any country, territory, or area,<br />
or of its authorities, or concerning the delimitation of its<br />
frontiers or boundaries.<br />
The views expressed in this publication do not necessarily<br />
reflect those of <strong>IUCN</strong>, Biodiversity Indicators Partnership or<br />
UNEP-WCMC.<br />
© 2009 International Union <strong>for</strong> Conservation of Nature <strong>and</strong><br />
Natural Resources<br />
© 2008 <strong>Red</strong> <strong>List</strong> logo<br />
Reproduction of this publication <strong>for</strong> educational or other<br />
non-commercial purposes is authorized without prior written<br />
permission from the copyright holder provided the source is<br />
fully acknowledged.<br />
Reproduction of this publication <strong>for</strong> resale or other commercial<br />
purposes is prohibited without prior written permission of the<br />
copyright holder.<br />
ISBN 978-2-8317-1061-7<br />
2
<strong>IUCN</strong> <strong>Red</strong> <strong>List</strong> <strong>Index</strong><br />
Purpose <strong>and</strong> use<br />
PURPOSE<br />
The <strong>IUCN</strong> <strong>Red</strong> <strong>List</strong> <strong>Index</strong> (RLI) measures trends in the overall<br />
extinction risk (‘conservation status’) of sets of species, as an<br />
indicator of trends in the status of biodiversity. Extinction is a<br />
key measure of biodiversity loss that has resonance with the<br />
public <strong>and</strong> decision makers, <strong>and</strong> that has clear relevance to<br />
ecological processes <strong>and</strong> ecosystem function. The RLI is based<br />
on movement of species status through the <strong>IUCN</strong> <strong>Red</strong> <strong>List</strong><br />
Categories, <strong>and</strong> so requires a good knowledge of these<br />
Categories <strong>and</strong> Criteria <strong>for</strong> assessment of extinction risk.<br />
The RLI can be disaggregated <strong>for</strong> subsets of data to:<br />
• show trends in extinction risk <strong>for</strong> particular taxonomic<br />
groups;<br />
• show trends in extinction risk <strong>for</strong> species relevant to<br />
particular policy mechanisms;<br />
• identify continents, regions or biogeographic realms where<br />
the extinction risk of species is changing most rapidly;<br />
• identify ecosystems <strong>and</strong> habitats where the extinction<br />
risk of species is changing most rapidly;<br />
• explore trends in the importance <strong>and</strong> impacts of specific<br />
threats.<br />
PLACE IN THE 2010 BIODIVERSITY TARGET<br />
FRAMEWORK<br />
The RLI falls under the CBD Biodiversity 2010 Target focal area:<br />
Status <strong>and</strong> Trends of the Components of Biological Diversity. It is<br />
the only indicator that has been adopted <strong>for</strong> immediate testing<br />
under the CBD headline indicator: Change in status of threatened<br />
species. It complements directly two other headline indicators<br />
within this focal area:<br />
1: Trends in extent of selected biomes, ecosystems, <strong>and</strong><br />
habitats;<br />
2: Trends in abundance <strong>and</strong> distribution of selected species.<br />
The RLI can show trends in the status of all species worldwide<br />
(within taxonomic groups <strong>for</strong> which extinction risk has been<br />
assessed at least twice), <strong>and</strong> hence is considerably more<br />
representative geographically than trends in abundance<br />
<strong>and</strong> distribution of selected species. However, it is a less<br />
sensitive measure of status as it is based on the movement of<br />
species through <strong>IUCN</strong> <strong>Red</strong> <strong>List</strong> categories (which are broad<br />
measures of population size, population trend <strong>and</strong> range size).<br />
In addition, the RLI does not show the population reductions<br />
experienced by broad-ranging slowly declining species;<br />
however the <strong>Red</strong> <strong>List</strong> contains a lot of detailed in<strong>for</strong>mation that<br />
can in<strong>for</strong>m this.<br />
Disaggregations of the RLI are also relevant to three other CBD<br />
2010 target focal areas:<br />
1 Under Threats to biodiversity <strong>and</strong> the headline indicator<br />
Trends in Invasive Alien Species, an RLI can be calculated<br />
to show trends in the impacts of invasive species <strong>and</strong><br />
their management on biodiversity;<br />
2 Under the focal area Sustainable <strong>Use</strong>, RLIs showing<br />
trends in the impacts of use <strong>and</strong> its management provide<br />
a useful measure;<br />
3 Under the focal area Ecosystem integrity <strong>and</strong> ecosystem<br />
goods <strong>and</strong> services <strong>and</strong> the headline indicator Biodiversity<br />
<strong>for</strong> food <strong>and</strong> medicine, an RLI showing trends in the status<br />
of species used <strong>for</strong> food <strong>and</strong> medicine is relevant.<br />
The RLI also helps to track progress towards Target 7b under<br />
Millennium Development Goal 7 by providing the in<strong>for</strong>mation<br />
required <strong>for</strong> indicator 7.7 (‘proportion of species threatened with<br />
extinction’). Subsets of the RLI can also provide a basis <strong>for</strong><br />
tracking progress under various agreements such as the Ramsar<br />
Convention <strong>and</strong> the Convention on Migratory Species (<strong>and</strong> its<br />
subsidiary agreements), as well as assessing the effectiveness of<br />
CITES in reducing the impacts of trade on endangered species.<br />
At a regional scale it has also been adopted as an indicator within<br />
Europe under the SEBI-2010 process.<br />
3
<strong>Guidance</strong> <strong>for</strong> national <strong>and</strong> regional use<br />
Data requirements<br />
The RLI uses data from the <strong>IUCN</strong> <strong>Red</strong> <strong>List</strong> of Threatened<br />
Species TM (<strong>IUCN</strong> <strong>Red</strong> <strong>List</strong>, http://www.iucnredlist.org), widely<br />
recognized as the most authoritative, objective <strong>and</strong> compre -<br />
hensive approach <strong>for</strong> evaluating the global conservation status of<br />
species <strong>and</strong> categorising them according to their risk of extinction.<br />
The <strong>IUCN</strong> <strong>Red</strong> <strong>List</strong> uses quantitative criteria based on population<br />
size, rate of decline, <strong>and</strong> area of distribution to assign species to<br />
one of seven categories of relative extinction risk, ranging from<br />
‘Extinct’ to ‘Least Concern’ (or to a ‘Data Deficient’ category <strong>for</strong><br />
species that are very poorly known).<br />
In 2008, the <strong>IUCN</strong> <strong>Red</strong> <strong>List</strong> (<strong>IUCN</strong> 2008) included assessments<br />
<strong>for</strong> 44,838 species, spanning every country of the world, of which<br />
16,928 species were threatened with extinction. This includes<br />
species from a broad range of taxonomic groups spanning<br />
vertebrates, invertebrates, plants <strong>and</strong> fungi. At present, it<br />
is possible to calculate a RLI <strong>for</strong> several groups in which all<br />
species have been assessed <strong>for</strong> the <strong>IUCN</strong> <strong>Red</strong> <strong>List</strong>: birds (9,956<br />
species, 12 per cent threatened), mammals (5,416 species, 23<br />
per cent threatened), amphibians (6,119 species, 31 per cent<br />
threatened), corals (845 species, 33 per cent threatened) <strong>and</strong><br />
gymnosperms (primarily conifers <strong>and</strong> cycads, 980 species, 35<br />
per cent threatened). Further groups will be globally assessed<br />
over the next few years. To address the challenge of assessing<br />
taxonomic groups which have extremely large numbers of<br />
species <strong>and</strong>/or that are poorly known, a sampled approach has<br />
been developed in which 1,500 species are r<strong>and</strong>omly selected<br />
<strong>and</strong> assessed (see Baillie et al. 2008). By 2010 this will exp<strong>and</strong><br />
considerably the breadth of taxonomic groups <strong>for</strong> which complete<br />
or representative RLIs can be calculated.<br />
To calculate the RLI, all species in a group must have been<br />
assessed <strong>for</strong> the <strong>IUCN</strong> <strong>Red</strong> <strong>List</strong> at least twice. By the release of<br />
the 2008 <strong>IUCN</strong> <strong>Red</strong> <strong>List</strong>, birds will have been assessed five times<br />
(1988-2008) <strong>and</strong> mammals twice (1996-2008). Amphibians were<br />
comprehensively assessed <strong>for</strong> the first time in 2004 <strong>and</strong> will be<br />
reassessed in 2009. Cycads were assessed <strong>for</strong> the first time in<br />
2000 <strong>and</strong> will be reassessed in 2009. Reef building corals have<br />
also been assessed comprehensively in 2008 <strong>and</strong> it will be<br />
possible to calculate a RLI. Once groups have been completely<br />
assessed, ideally (depending on available resources) they will be<br />
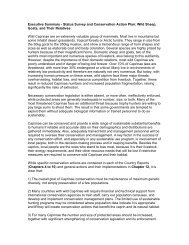
reassessed at four-yearly intervals thereafter. The example <strong>for</strong><br />
birds (Figure 1) shows a steady deterioration in their status over<br />
the last 20 years.<br />
Better<br />
<strong>Red</strong> <strong>List</strong> <strong>Index</strong> of<br />
species survival<br />
0.925<br />
0.920<br />
Figure 1: <strong>IUCN</strong> <strong>Red</strong> <strong>List</strong> <strong>Index</strong> of species survival<br />
<strong>for</strong> all bird species <strong>for</strong> 1988-2008, showing trends<br />
in the proportion of species expected to remain<br />
extant in the near future without additional<br />
conservation action. An RLI value of 1.0 equates to<br />
all species being categorised as Least Concern, <strong>and</strong><br />
hence that none are expected to go extinct in the<br />
near future. An RLI value of zero indicates that all<br />
species have gone Extinct. N = 9,922 non-Data<br />
Deficient species.<br />
Worse<br />
4<br />
0.915<br />
1988 1992 1996 2000 2004 2008
<strong>IUCN</strong> <strong>Red</strong> <strong>List</strong> <strong>Index</strong><br />
<strong>Use</strong> at geographical scales<br />
The RLI can in principle be applied at regional, national <strong>and</strong>, in some<br />
cases, sub-national scales. Application of the RLI at national scale<br />
is just beginning, <strong>and</strong> many countries will need to overcome limit -<br />
ations in data <strong>and</strong> other resources be<strong>for</strong>e it can be fully implemented.<br />
Application at national scale can be achieved in two ways.<br />
RLI BASED ON GLOBAL EXTINCTION RISK<br />
Global RLIs (i.e. those based on repeated assessments of the<br />
global extinction risk of all species within a group) can be<br />
disaggregated to show trends at finer scales. An advantage of<br />
this approach is that such data are already available <strong>for</strong> some<br />
taxonomic groups (<strong>and</strong> will be available <strong>for</strong> others in the near<br />
future). <strong>National</strong> or sub-national indices can there<strong>for</strong>e be<br />
calculated without further data-gathering. To produce an RLI <strong>for</strong><br />
a country necessitates assessing <strong>for</strong> each species in the country<br />
that underwent a genuine change in its status at the global scale<br />
(as measured by movement into a higher or lower <strong>IUCN</strong> <strong>Red</strong> <strong>List</strong><br />
category) whether the processes driving the change from one<br />
category to another also occurred within that country. For<br />
example, an RLI <strong>for</strong> a country in the wintering range of a migrant<br />
species should not incorporate a genuine category change <strong>for</strong><br />
that species caused by changes in the conditions in its breeding<br />
range elsewhere. Similarly, seabirds may be impacted by invasive<br />
species or habitat loss at their breeding colonies, or by fisheries<br />
bycatch in their marine range. Producing RLIs <strong>for</strong> countries falling<br />
within one or other of these cases there<strong>for</strong>e requires careful<br />
scrutiny of each genuine status change <strong>and</strong> the drivers of that<br />
change. Freely available documentation associated with the<br />
global assessments on the <strong>IUCN</strong> <strong>Red</strong> <strong>List</strong> should be adequate to<br />
facilitate such analyses (see below).<br />
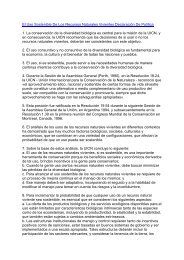
This approach works better <strong>for</strong> large countries or sub-national<br />
units <strong>and</strong> <strong>for</strong> those with relatively high levels of endemism (e.g.<br />
Madagascar, see Figure 2). However, <strong>for</strong> smaller countries that<br />
share many species with their neighbours, it may be difficult to<br />
determine whether a species’ global status changed because of<br />
factors operating within any one country. Furthermore, the<br />
RLI becomes less robust with fewer species driving the index<br />
trends. Hence, it is important to consider these limitations when<br />
interpreting a national disaggregation of a global RLI.<br />
If a country has many endemic taxa (<strong>for</strong> which the global <strong>and</strong><br />
national assessments of extinction risk will be identical), a national<br />
RLI can be calculated from the global <strong>Red</strong> <strong>List</strong> categories <strong>for</strong> the<br />
endemic species only. This will show national trends in extinction<br />
risk <strong>for</strong> the species in a country that are particularly significant at<br />
a global scale.<br />
RLI BASED ON NATIONAL OR REGIONAL<br />
EXTINCTION RISK<br />
<strong>IUCN</strong> have developed guidelines on how to apply the <strong>IUCN</strong> <strong>Red</strong><br />
<strong>List</strong> Categories <strong>and</strong> Criteria at regional or national scales (<strong>IUCN</strong><br />
2003; see http://www.iucnredlist.org/static/categories_criteria.<br />
These guidelines explain how to take into account the possibility<br />
of ‘rescue effects’ by surrounding or adjacent populations of a<br />
Better<br />
<strong>Red</strong> <strong>List</strong> <strong>Index</strong> of<br />
species survival<br />
1.0<br />
0.9<br />
0.8<br />
Amphibians<br />
Birds<br />
Figure 2: <strong>IUCN</strong> <strong>Red</strong> <strong>List</strong> <strong>Index</strong> of species survival <strong>for</strong> bird,<br />
mammal <strong>and</strong> amphibian species in Madagascar, based on<br />
appropriate disaggregations of the global RLI showing trends<br />
in the proportion of species expected to remain extant in the<br />
near future without additional conservation action. An RLI<br />
value of 1.0 equates to all species being categorised as Least<br />
Concern, <strong>and</strong> hence that none are expected to go extinct in<br />
the near future. An RLI value of zero indicates that all species<br />
have gone Extinct. N = 243 bird, 136 mammal <strong>and</strong> 341<br />
amphibian non-Data Deficient species. Source:<br />
R<strong>and</strong>rianasolo et al. unpublished data.<br />
Worse<br />
Mammals<br />
0.7<br />
1980 1985 1990 1995 2000 2005 2008<br />
5
<strong>Guidance</strong> <strong>for</strong> national <strong>and</strong> regional use<br />
taxon. If all species within a particular region or country have<br />
been assessed at least twice using this approach, an RLI can<br />
be calculated using these data. For example, an RLI based on<br />
the regional extinction risk of birds at the European scale <strong>for</strong><br />
1990-2000 has been developed. In some cases, it is possible<br />
to apply the RLI method at a sub-national scale, e.g. Quayle et<br />
al. (2007) present an RLI <strong>for</strong> the Canadian Province of British<br />
Columbia. Note that the RLI should not be calculated from<br />
national red lists in which only a subset of species in a particular<br />
taxonomic group within the country have been assessed. This<br />
is because such a subset is likely to be biased, e.g. in its status,<br />
trends or distribution.<br />
Potential data sources<br />
For a national RLI based on global extinction risk, the necessary<br />
data can be obtained from the <strong>IUCN</strong> <strong>Red</strong> <strong>List</strong> (http://www.<br />
iucnredlist.org/), which has an on-line database that can be<br />
searched to give the current <strong>and</strong> past <strong>Red</strong> <strong>List</strong> categories <strong>for</strong><br />
all species that have been assessed in a given country. At<br />
present, the data identifying those species that have undergone<br />
genuine changes in their conservation status is not available<br />
online, <strong>and</strong> should be requested by contacting the <strong>IUCN</strong> Species<br />
programme. In future, this will be freely accessible through the<br />
website, <strong>and</strong> an online facility is planned <strong>for</strong> automatically out -<br />
putting the appropriate data <strong>and</strong> RLI graph.<br />
Data <strong>for</strong> developing national or regional RLIs based on national<br />
or regional extinction risk will need to come from the groups<br />
generating <strong>and</strong> maintaining these lists. Many countries have<br />
initiated programmes to assess the conservation status of their<br />
species (or subsets of them), <strong>and</strong> 122 countries have published<br />
one or more national <strong>Red</strong> Data Books or <strong>Red</strong> <strong>List</strong>s. Of these, 77<br />
countries are using the <strong>IUCN</strong> <strong>Red</strong> <strong>List</strong> Categories <strong>and</strong> Criteria,<br />
<strong>and</strong> hence their lists may be appropriate <strong>for</strong> developing RLIs.<br />
Other lists may be less suitable <strong>for</strong> the RLI approach as they may<br />
not be based on robust <strong>and</strong> repeatable criteria, or have categories<br />
that can be ranked in terms of relative extinction risk. The results<br />
<strong>and</strong> in<strong>for</strong>mation about ongoing assessment ef<strong>for</strong>ts are often<br />
available through national wildlife or conservation authorities,<br />
universities <strong>and</strong> other research organisations, or national<br />
conservation NGOs such as those in the BirdLife International<br />
Partnership (contact details available at http://www.birdlife.org/<br />
worldwide/national/index.html) as well as through the <strong>IUCN</strong><br />
Species Survival Commission Specialist Groups (contact details<br />
available at: http://www. iucn.org/themes/ssc/sgs/sgs.htm).<br />
A database of those national <strong>and</strong> regional red lists using the<br />
<strong>IUCN</strong> <strong>Regional</strong> Guidelines <strong>for</strong> Application of the <strong>IUCN</strong> <strong>Red</strong><br />
<strong>List</strong> Categories <strong>and</strong> Criteria is being developed (www.<br />
regionalredlist.org). <strong>IUCN</strong> continues to support regional <strong>and</strong><br />
national assessments through the <strong>National</strong> <strong>Red</strong> <strong>List</strong> Working<br />
Group of the Species Survival Commission <strong>and</strong> through <strong>IUCN</strong><br />
regional programmes. It should be noted, however, that few<br />
countries have yet assessed species using the <strong>IUCN</strong> <strong>Regional</strong><br />
Guidelines more than once: a minimum of two assessments is<br />
required in order to permit an RLI to be calculated.<br />
In principle, <strong>for</strong> taxonomic groups <strong>for</strong> which only a subset of<br />
species occurring in a country have had their national extinction<br />
risk assessed, a sampled approach could be applied. For<br />
guidelines on selecting species, stratification, sample size etc,<br />
Baillie et al. (2008) should be consulted.<br />
Data quality <strong>and</strong> sample size considerations<br />
For RLIs developed using the sampled approach, analysis of<br />
global data indicate that a sample of 1,500 species should<br />
be assessed in order to provide sufficiently robust trends. Similar<br />
analyses to those presented in Baillie et al. (2008) should<br />
be carried out if this approach is applied at the regional or<br />
national scale.<br />
As with most indicators, the RLI is less robust when it is based on<br />
only a few species. Careful consideration needs to be given to the<br />
total number of species contributing to the index, <strong>and</strong> the number<br />
that have undergone genuine changes in status (<strong>and</strong> hence<br />
driving trends in the index). With fewer numbers of species, trends<br />
are less likely to be representative of individual populations or of<br />
other taxonomic groups.<br />
6
<strong>IUCN</strong> <strong>Red</strong> <strong>List</strong> <strong>Index</strong><br />
Calculation<br />
The <strong>for</strong>mula <strong>for</strong> calculating earlier versions of the <strong>IUCN</strong> RLI<br />
(Butchart, S.H.M. et al. 2004, 2005) has recently been improved<br />
<strong>and</strong> revised (Butchart, S.H.M. et al. 2007). Mathematically the<br />
calculation of the RLI can be expressed as:<br />
RLI t<br />
=1−<br />
∑<br />
where Wc(t,s) is the weight of category c <strong>for</strong> species s at time t,<br />
(W EX ) is the weight <strong>for</strong> Extinct, <strong>and</strong> N is the number of assessed<br />
species excluding those considered Data Deficient in the current<br />
time period <strong>and</strong> those considered to be Extinct in the year the<br />
set of species was first assessed.<br />
The RLI is calculated from the number of species in each <strong>Red</strong><br />
<strong>List</strong> Category (Least Concern, Near Threatened, Vulnerable,<br />
Endangered, Critically Endangered), <strong>and</strong> the number changing<br />
Categories between assessments as a result of genuine<br />
improvement or deterioration in status (Category changes owing<br />
to improved knowledge or revised taxonomy are excluded).<br />
Put simply, the number of species in each <strong>Red</strong> <strong>List</strong> Category<br />
is multiplied by the Category weight (which ranges from 0 <strong>for</strong><br />
Least Concern, 1 <strong>for</strong> Near Threatened, 2 <strong>for</strong> Vulnerable, 3 <strong>for</strong><br />
Endangered, 4 <strong>for</strong> Critically Endangered <strong>and</strong> 5 <strong>for</strong> Extinct in the<br />
Wild <strong>and</strong> Extinct). These products are summed, divided by the<br />
maximum possible product (the number of species multiplied by<br />
s<br />
W c( t,s)<br />
W EX<br />
⋅ N<br />
the maximum weight), <strong>and</strong> subtracted from one. This produces<br />
an index that ranges from 0 to 1 (see below).<br />
The <strong>for</strong>mula <strong>for</strong> calculating the RLI requires that (a) exactly the<br />
same set of species is included in all time steps, <strong>and</strong> (b) the only<br />
category changes are those resulting from genuine improvement<br />
or deterioration in status (i.e. excluding changes resulting from<br />
improved knowledge or taxonomic revisions). In practice, species<br />
lists will often change slightly from one assessment to the next<br />
(e.g. owing to taxonomic revisions), <strong>and</strong> many species change<br />
category between assessments owing to improved knowledge<br />
of their population size, trends, distribution, threats etc. The<br />
conditions can there<strong>for</strong>e be met by retrospectively correcting<br />
earlier <strong>Red</strong> <strong>List</strong> categorizations using current in<strong>for</strong>mation <strong>and</strong><br />
taxonomy. This is achieved through assuming that the current<br />
<strong>Red</strong> <strong>List</strong> Categories <strong>for</strong> the taxa have applied since the set of<br />
species was first assessed, unless there is in<strong>for</strong>mation to the<br />
contrary that genuine status changes have occurred. Such<br />
in<strong>for</strong>mation is often contextual, e.g. relating to the known history<br />
of habitat loss within the range of the species (see Butchart,<br />
S.H.M. et al. 2007 <strong>for</strong> further details).<br />
In general, a conservative approach should be adopted, <strong>and</strong><br />
genuine status changes should only be identified if adequate<br />
supporting evidence <strong>and</strong> justification can be provided. If there is<br />
insufficient in<strong>for</strong>mation available to determine whether a newly<br />
assessed species has undergone a genuine status change since<br />
the first assessment, it is not incorporated into the <strong>IUCN</strong> RLI until<br />
it is assessed subsequently <strong>for</strong> a second time, at which point<br />
categories <strong>for</strong> earlier assessments are assigned by extrapolating<br />
recent trends in population, range, habitat <strong>and</strong> threats, supported<br />
by additional in<strong>for</strong>mation.<br />
7
<strong>Guidance</strong> <strong>for</strong> national <strong>and</strong> regional use<br />
Presentation <strong>and</strong> interpretation<br />
PRESENTATION<br />
Options <strong>for</strong> visual representation (graphs, maps,<br />
statistics)<br />
The most appropriate presentation of RLIs is through line<br />
graphs representing change in the index values over time.<br />
These will tend to show inflection points at each assessment<br />
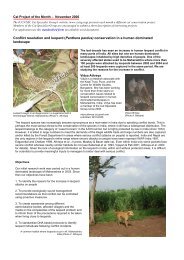
time. The indices can usefully be disaggregated to show trends<br />
that are geographically representative (Figure 3), relevant to<br />
particular policy sectors or agreements, or representative of<br />
particular ecosystems (Figure 4) or habitat types.<br />
Narratives (<strong>and</strong> relation to other indicators)<br />
Presentation of national or regional scale RLIs should be part<br />
of a wider narrative examining trends in biodiversity according<br />
to several different measures. Changes in extinction risk should<br />
be discussed in the context of changes in extent of eco -<br />
systems <strong>and</strong> habitats <strong>and</strong> trends in species populations (e.g.<br />
Living Planet <strong>Index</strong>, Wild Bird <strong>Index</strong>, <strong>IUCN</strong> <strong>Red</strong> <strong>List</strong>).<br />
MEANING AND CAUSES OF TRENDS:<br />
It is important to present such illustrations with sufficient<br />
contextual in<strong>for</strong>mation to enable users to interpret them. They<br />
should be accompanied by analysis of the drivers of change,<br />
i.e. which threatening processes have caused most species to<br />
be uplisted to higher categories of threat, <strong>and</strong> which threats<br />
have been most effectively mitigated <strong>and</strong> allowed species to be<br />
downlisted to lower categories of threat.<br />
This may come from other biodiversity indicators, such as<br />
trends in the extent of different ecosystem types or be<br />
made part of the narrative surrounding the indicator. Thus, <strong>for</strong><br />
example, the steep decline in birds of the Indomalayan realm<br />
during the 1990s shown in Figure 2 has been linked to<br />
intensifying de<strong>for</strong>estation in the Sundaic lowl<strong>and</strong>s of Indonesia.<br />
The steep decline in marine bird species in Figure 3 is linked<br />
to high rates of incidental mortality arising from the expansion<br />
of commercial longline fisheries.<br />
It is also important to recognise the time lags which may occur<br />
between changes in habitats <strong>and</strong> changes in the status of<br />
species. There<strong>for</strong>e, interpretation needs to take account<br />
of changes that may have happened sometime be<strong>for</strong>e the<br />
calculation of the index.<br />
It is further important to consider the sensitivity of the index<br />
<strong>and</strong> to recognise that if it includes an appropriate number of<br />
species to make it a robust reflection of overall biodiversity<br />
trends, it may not be sensitive to changes in the status of<br />
species that have particular national importance, e.g. <strong>for</strong><br />
cultural or economic reasons.<br />
IMPLICATIONS FOR POLICY AND MANAGEMENT:<br />
RLIs provide a key measure of the rate of biodiversity loss, <strong>and</strong><br />
whether this is being reduced or is intensifying. RLI values relate<br />
to the proportion of species expected to remain extant in the<br />
near future without additional conservation action. An RLI value<br />
of 1.0 equates to all species being categorised as Least<br />
Concern, <strong>and</strong> hence that none are expected to go extinct in<br />
the near future. An RLI value of zero indicates that all species<br />
Better<br />
<strong>Red</strong> <strong>List</strong> <strong>Index</strong> of<br />
species survival<br />
0.98<br />
0.95<br />
0.92<br />
0.89<br />
Palearctic<br />
Afrotropical<br />
Indomalayan<br />
Nearctic<br />
Neotropical<br />
Australasian<br />
Figure 3: <strong>IUCN</strong> <strong>Red</strong> <strong>List</strong> <strong>Index</strong> of species survival <strong>for</strong> bird<br />
species in different biogeographic realms <strong>for</strong> 1988-2008,<br />
showing trends in the proportion of species expected to<br />
remain extant in the near future without additional<br />
conservation action. An RLI value of 1.0 equates to all<br />
species being categorised as Least Concern, <strong>and</strong> hence that<br />
none are expected to go extinct in the near future. An RLI<br />
value of zero indicates that all species have gone Extinct. N =<br />
1,706 Palearctic, 2,211 Afrotropical, 2,144 Indomalayan, 999<br />
Nearctic, 3,977 Neotropical, 1,765 Australasian <strong>and</strong> 1,555<br />
Oceanic non-Data Deficient species.<br />
Worse<br />
0.86<br />
0.83<br />
Oceanic<br />
1988 1992 1996 2000 2004 2008<br />
8
<strong>IUCN</strong> <strong>Red</strong> <strong>List</strong> <strong>Index</strong><br />
have gone Extinct. A downwards trend in the graph line (i.e.<br />
decreasing RLI values) means that the expected rate of<br />
species extinctions is increasing i.e. that the rate of biodiversity<br />
loss is increasing. A horizontal graph line (i.e. unchanging RLI<br />
values) means that the expected rate of species extinctions is<br />
unchanged. An upward trend in the graph line (i.e. increasing<br />
RLI values) means that there is a decrease in expected future<br />
rate of species extinctions (i.e. a reduction in the rate of<br />
biodiversity loss).<br />
RLIs provide both a general indication of how effectively policies<br />
are reducing the loss of biodiversity, <strong>and</strong>, in disaggregated<br />
<strong>for</strong>m, show more specifically where additional policy or targeted<br />
intervention may be needed.<br />
must be considered a relatively coarse measure of changes in<br />
the status of biodiversity. Its sensitivity may also be limited by<br />
the inherent time lags between changes on the ground <strong>and</strong><br />
their detection <strong>and</strong> incorporation into the evaluation of a<br />
species’ status. Although the RLI is geographically repres -<br />
entative (because it is based on assessments of all species at<br />
the relevant scale), trends shown by the taxa included may not<br />
be representative of trends in other taxonomic groups.<br />
Additionally, applying the <strong>IUCN</strong> <strong>Red</strong> <strong>List</strong> Categories <strong>and</strong> Criteria<br />
to assess species at the national level requires the building of<br />
capacity through dedicated training.<br />
LIMITATIONS:<br />
As with other indicators, the RLI <strong>and</strong> the trends it shows are<br />
only as good as the data that go into them. They are subject<br />
to changes in knowledge regarding the status <strong>and</strong> biology of<br />
species, which can affect the estimation of their extinction risk.<br />
Owing to the broad nature of the <strong>Red</strong> <strong>List</strong> categories, the RLI<br />
Better<br />
<strong>Red</strong> <strong>List</strong> <strong>Index</strong> of<br />
species survival<br />
0.95<br />
0.90<br />
0.85<br />
Freshwater<br />
Terrestrial<br />
Figure 4: <strong>IUCN</strong> <strong>Red</strong> <strong>List</strong> <strong>Index</strong> of species survival <strong>for</strong> bird<br />
species in different ecosystems <strong>for</strong> 1988-2008, showing<br />
trends in the proportion of species expected to remain extant<br />
in the near future without additional conservation action. An<br />
RLI value of 1.0 equates to all species being categorised as<br />
Least Concern, <strong>and</strong> hence that none are expected to go<br />
extinct in the near future. An RLI value of zero indicates that all<br />
species have gone Extinct. N = 1,308 freshwater, 336 marine<br />
<strong>and</strong> 9,687 terrestrial non-Data Deficient species.<br />
Worse<br />
Marine<br />
0.80<br />
1988 1992 1996 2000 2004 2008<br />
9
<strong>Guidance</strong> <strong>for</strong> national <strong>and</strong> regional use<br />
Elements of good practice<br />
• Collaboration <strong>and</strong> engagement/building support<br />
<strong>and</strong> sustainability<br />
It is important to engage fully with the global organisations,<br />
groups <strong>and</strong> programmes responsible <strong>for</strong> assessing the<br />
status of species <strong>for</strong> the <strong>IUCN</strong> <strong>Red</strong> <strong>List</strong>. These involve<br />
thous<strong>and</strong>s of scientists, conservationists <strong>and</strong> species<br />
experts some of whom will be outside the country <strong>and</strong><br />
may be able to help with repatriation of relevant data <strong>for</strong><br />
species assessments at the national level.<br />
• Data quality st<strong>and</strong>ards<br />
Assessments of national or regional extinction risk should if<br />
at all possible be based on the <strong>IUCN</strong> <strong>Red</strong> <strong>List</strong> Categories<br />
<strong>and</strong> Criteria <strong>and</strong> meet the appropriate documentation<br />
st<strong>and</strong>ards (see <strong>IUCN</strong> 2001, 2003).<br />
• Metadata<br />
It is vital to document thoroughly the species included,<br />
dates of assessments, the species undergoing genuine<br />
status changes, <strong>and</strong> the drivers of these changes.<br />
• Methodological documentation <strong>and</strong> consistency<br />
(cross-calibration)<br />
Full details should be documented of how the <strong>IUCN</strong> <strong>Red</strong><br />
<strong>List</strong> Categories <strong>and</strong> Criteria are applied at the national or<br />
regional scale, including adjustments to higher or lower<br />
categories of threat as a consequence of judgements<br />
about rescue effects.<br />
• Frequency of updating<br />
A primary constraint on creating <strong>and</strong> updating RLIs is the<br />
frequency of re-assessments. Regular assessments are<br />
recommended; as an example, all bird species are<br />
reassessed every four years. It is likely that assessments at<br />
the national level will be repeated less frequently in many<br />
countries because of the resources <strong>and</strong> capacity required,<br />
although this will reduce the utility of the indicator.<br />
10
<strong>IUCN</strong> <strong>Red</strong> <strong>List</strong> <strong>Index</strong><br />
References<br />
Baillie, J. E. M., Collen, B., Amin, R., Akçakaya, H. R.,<br />
Butchart, S. H. M., Brummitt, N., Meagher, T. R.,<br />
Ram, M., Hilton-Taylor, C. <strong>and</strong> Mace, G.M. 2008.<br />
Towards monitoring global biodiversity. Conservation<br />
Letters 1:18-26.<br />
Butchart, S.H.M., Stattersfield, A.J., Bennun, L.A., Shutes,<br />
S.M., Akçakaya, H.R., Baillie, J.E.M., Stuart, S.N.,<br />
Hilton-Taylor, C. <strong>and</strong> Mace, G.M. 2004. Measuring<br />
global trends in the status of biodiversity: <strong>Red</strong> <strong>List</strong> Indices<br />
<strong>for</strong> birds. Public Library of Science - Biology 2:<br />
2294–2304.<br />
Butchart, S.H.M., Stattersfield, A.J., Bennun, L.A.,<br />
Akçakaya, H.R., Baillie, J.E.M., Stuart, S.N., Hilton-<br />
Taylor, C. <strong>and</strong> Mace, G.M. 2005. Using <strong>Red</strong> <strong>List</strong> Indices<br />
to measure progress towards the 2010 target <strong>and</strong><br />
beyond. Philosophical Transcripts of the Royal Society –<br />
B 1454: 255–268.<br />
Butchart, S.H.M., Akçakaya, H.R., Kennedy, E. <strong>and</strong> Hilton-<br />
Taylor, C. 2006. Biodiversity indicators based on trends in<br />
conservation status: strengths of the <strong>IUCN</strong> <strong>Red</strong> <strong>List</strong> <strong>Index</strong>.<br />
Conservation Biology 20: 579–581.<br />
Butchart, S.H.M., Akçakaya, H.R., Chanson, J., Baillie,<br />
J.E.M., Collen, B., Quader, S., Turner, W.R., Amin, R.,<br />
Stuart, S.N., Hilton-Taylor, C. <strong>and</strong> Mace, G.M. 2007.<br />
Improvements to the <strong>Red</strong> <strong>List</strong> <strong>Index</strong>. Public Library of<br />
Science - ONE 2(1): e140. doi:10.1371/journal.pone.<br />
0000140<br />
<strong>IUCN</strong> 2001. <strong>IUCN</strong> <strong>Red</strong> <strong>List</strong> categories <strong>and</strong> criteria: version 3.1.<br />
Gl<strong>and</strong>, Switzerl<strong>and</strong> <strong>and</strong> Cambridge, U.K.: Species Survival<br />
Commission, <strong>IUCN</strong>.<br />
<strong>IUCN</strong> 2003. Guidelines <strong>for</strong> Application of <strong>IUCN</strong> <strong>Red</strong> <strong>List</strong> Criteria<br />
at <strong>Regional</strong> Levels: Version 3.0. <strong>IUCN</strong> Species Survival<br />
Commission. <strong>IUCN</strong>, Gl<strong>and</strong>, Switzerl<strong>and</strong> <strong>and</strong> Cambridge,<br />
UK. URL: http://www.iucnredlist.org/static/<br />
categories_criteria<br />
<strong>IUCN</strong> 2008. Guidelines <strong>for</strong> using the <strong>IUCN</strong> <strong>Red</strong> <strong>List</strong> categories<br />
<strong>and</strong> criteria. Available from http://www.iucnredlist.org/<br />
static/categories_criteria<br />
Quayle, J. F., Ramsay, L. R. <strong>and</strong> Fraser, D. F. 2007. Trend<br />
in the status of breeding bird fauna in British Columbia,<br />
Canada, based on the <strong>IUCN</strong> <strong>Red</strong> <strong>List</strong> <strong>Index</strong> method.<br />
Conservation. Biology. 21: 1241–1247.<br />
Cover photo (front <strong>and</strong> back) © T Hoepka/Magnum<br />
11
<strong>IUCN</strong><br />
Rue Mauverney 28<br />
1196 Gl<strong>and</strong><br />
Switzerl<strong>and</strong><br />
Tel: + 41 22 999 0000<br />
Fax: + 41 22 999 0015<br />
www.iucn.org/redlist<br />
www.iucnredlist.org