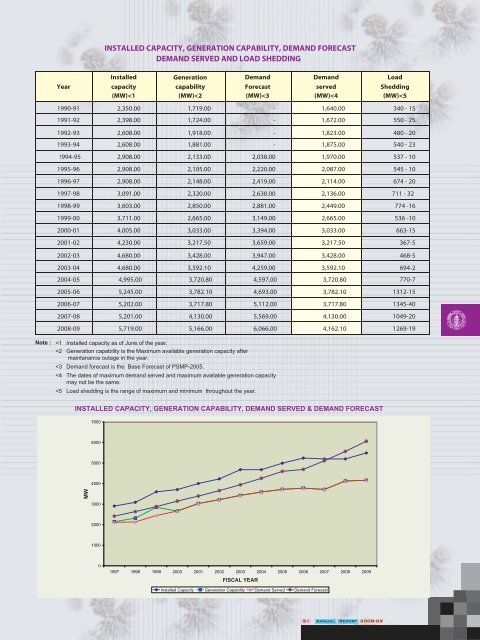
INSTALLED CAPACITY, GENERATION CAPABILITY, DEMAND FORECAST DEMAND SERVED AND LOAD SHEDDING Installed Generation Demand Demand Load Year capacity capability Forecast served Shedding (MW)
ELECTRIFICATION OF THANAS, VILLAGES AND PUMPS YEAR Upazila/Thana Village Hat/Bazar Deep, Shallow & (Nos.) (Nos.) (Nos.) Low Lift Pumps(Nos.) 1989-90 438 2,657 1,371 11,031 1990-91 438 2,717 1,391 12,331 1991-92 438 2,767 1,411 14,033 1992-93 438 2,807 1,431 16,023 1993-94 438 2,837 1,446 16,943 1994-95 443 2,867 1,466 17,193 1995-96 443 2,927 1,513 18,622 1996-97 443 3,017 1,581 19,774 1997-98 443 3,061 1,613 19,969 1998-99 443 3,111 1,668 20,157 1999-00 443 3,201 1,718 20,307 2000-01 443 3,292 1,768 20,467 2001-02 443 3,356 1,858 20,687 2002-03 443 3,400 1,958 20,812 2003-04 443 3,432 2,040 20,928 2004-05 443 3,478 2,080 20,993 2005-06 443 3,495 2,113 21,020 2006-07 443 3,495 2,113 21,020 2007-08 443 3,495 2,113 27,071 <strong>2008</strong>-09 *221 4,204 1,410 32,407 * Excluding WZPDCL, REB, DESCO, DPDC 30 ELECTRIFICATION OF THANA,VILLAGES, HAT/BAZAR AND PUMPS 28 4,000 26 24 3,500 22 20 3,000 No. In Thousands 18 16 14 12 10 2,500 2,000 1,500 Numbers 8 6 1,000 4 500 2 0 1996 1997 1998 1999 2000 2001 2002 2003 2004 2005 2006 2007 <strong>2008</strong> <strong>2009</strong> 0 FISCAL YEAR Pumps Thana Villages Hat/Baza Thana, Villages & Hat/Bazar In Y2 Axis <strong>Annual</strong> <strong>Report</strong> <strong>2008</strong>-09 52