Annual Report for 2008-2009 - BPDB
Annual Report for 2008-2009 - BPDB
Annual Report for 2008-2009 - BPDB

You also want an ePaper? Increase the reach of your titles
YUMPU automatically turns print PDFs into web optimized ePapers that Google loves.
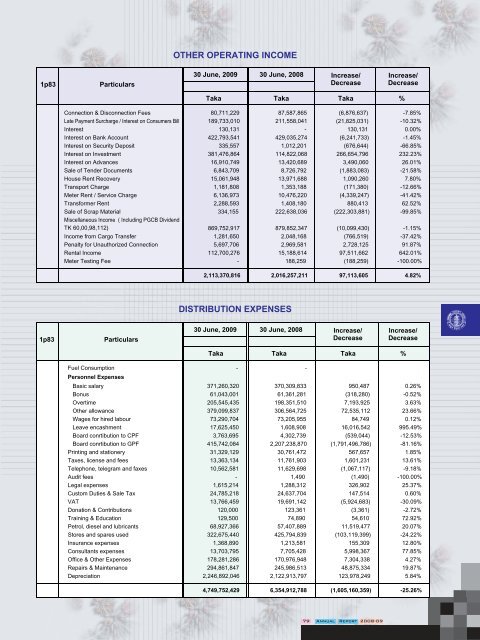
OTHER OPERATING INCOME<br />
30 June, <strong>2009</strong> 30 June, <strong>2008</strong> Increase/ Increase/<br />
1p83 Particulars Decrease Decrease<br />
Taka Taka Taka %<br />
Connection & Disconnection Fees 80,711,229 87,587,865 (6,876,637) -7.85%<br />
Late Payment Surcharge / Interest on Consumers Bill 189,733,010 211,558,041 (21,825,031) -10.32%<br />
Interest 130,131 - 130,131 0.00%<br />
Interest on Bank Account 422,793,541 429,035,274 (6,241,733) -1.45%<br />
Interest on Security Deposit 335,557 1,012,201 (676,644) -66.85%<br />
Interest on Investment 381,476,864 114,822,068 266,654,796 232.23%<br />
Interest on Advances 16,910,749 13,420,689 3,490,060 26.01%<br />
Sale of Tender Documents 6,843,709 8,726,792 (1,883,083) -21.58%<br />
House Rent Recovery 15,061,948 13,971,688 1,090,260 7.80%<br />
Transport Charge 1,181,808 1,353,188 (171,380) -12.66%<br />
Meter Rent / Service Charge 6,136,973 10,476,220 (4,339,247) -41.42%<br />
Trans<strong>for</strong>mer Rent 2,288,593 1,408,180 880,413 62.52%<br />
Sale of Scrap Material 334,155 222,638,036 (222,303,881) -99.85%<br />
Miscellaneous Income ( Including PGCB Dividend<br />
TK 60,00,98,112) 869,752,917 879,852,347 (10,099,430) -1.15%<br />
Income from Cargo Transfer 1,281,650 2,048,168 (766,519) -37.42%<br />
Penalty <strong>for</strong> Unauthorized Connection 5,697,706 2,969,581 2,728,125 91.87%<br />
Rental Income 112,700,276 15,188,614 97,511,662 642.01%<br />
Meter Testing Fee - 188,259 (188,259) -100.00%<br />
2,113,370,816 2,016,257,211 97,113,605 4.82%<br />
DISTRIBUTION EXPENSES<br />
30 June, <strong>2009</strong> 30 June, <strong>2008</strong> Increase/ Increase/<br />
1p83 Particulars Decrease Decrease<br />
Fuel Consumption - -<br />
Taka Taka Taka %<br />
Personnel Expenses<br />
Basic salary 371,260,320 370,309,833 950,487 0.26%<br />
Bonus 61,043,001 61,361,281 (318,280) -0.52%<br />
Overtime 205,545,435 198,351,510 7,193,925 3.63%<br />
Other allowance 379,099,837 306,564,725 72,535,112 23.66%<br />
Wages <strong>for</strong> hired labour 73,290,704 73,205,955 84,749 0.12%<br />
Leave encashment 17,625,450 1,608,908 16,016,542 995.49%<br />
Board conrtibution to CPF 3,763,695 4,302,739 (539,044) -12.53%<br />
Board conrtibution to GPF 415,742,084 2,207,238,870 (1,791,496,786) -81.16%<br />
Printing and stationery 31,329,129 30,761,472 567,657 1.85%<br />
Taxes, license and fees 13,363,134 11,761,903 1,601,231 13.61%<br />
Telephone, telegram and faxes 10,562,581 11,629,698 (1,067,117) -9.18%<br />
Audit fees - 1,490 (1,490) -100.00%<br />
Legal expenses 1,615,214 1,288,312 326,902 25.37%<br />
Custom Duties & Sale Tax 24,785,218 24,637,704 147,514 0.60%<br />
VAT 13,766,459 19,691,142 (5,924,683) -30.09%<br />
Donation & Contributions 120,000 123,361 (3,361) -2.72%<br />
Training & Education 129,500 74,890 54,610 72.92%<br />
Petrol, diesel and lubricants 68,927,366 57,407,889 11,519,477 20.07%<br />
Stores and spares used 322,675,440 425,794,839 (103,119,399) -24.22%<br />
Insurance expenses 1,368,890 1,213,581 155,309 12.80%<br />
Consultants expenses 13,703,795 7,705,428 5,998,367 77.85%<br />
Office & Other Expenses 178,281,286 170,976,948 7,304,338 4.27%<br />
Repairs & Maintenance 294,861,847 245,986,513 48,875,334 19.87%<br />
Depreciation 2,246,892,046 2,122,913,797 123,978,249 5.84%<br />
4,749,752,429 6,354,912,788 (1,605,160,359) -25.26%<br />
79 <strong>Annual</strong> <strong>Report</strong> <strong>2008</strong>-09