R plot layout cheat sheet - Stowers Institute for Medical Research
R plot layout cheat sheet - Stowers Institute for Medical Research
R plot layout cheat sheet - Stowers Institute for Medical Research

Create successful ePaper yourself
Turn your PDF publications into a flip-book with our unique Google optimized e-Paper software.
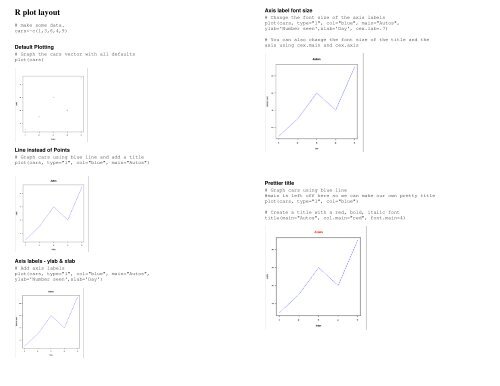
R <strong>plot</strong> <strong>layout</strong><br />
# make some data.<br />
cars
Plot another data set on same <strong>plot</strong><br />
#add another data vector called trucks<br />
trucks
Legends<br />
#locator(1) - the legend will be placed where you click<br />
the mouse<br />
legend(locator(1), c("cars","trucks"), cex=0.8,<br />
col=c("blue","red"), lty=c(1,3));<br />
#you can also assign the legend position with coordinates.<br />
legend(x=2,y=10, c("cars","trucks"), cex=0.8,<br />
col=c("blue","red"), lty=c(1,3));<br />
Same thing, different <strong>plot</strong> types<br />
#same <strong>layout</strong>, with all different types of <strong>plot</strong>s<br />
par(mfrow=c(2,3))<br />
<strong>plot</strong>(cars)<br />
bar<strong>plot</strong>(cars)<br />
<strong>plot</strong>(cars,type='l')<br />
<strong>plot</strong>(cars,type='h')<br />
hist(cars)<br />
<strong>plot</strong>(cars,pch=8,col=rainbow(5))<br />
Multiple <strong>plot</strong> <strong>layout</strong><br />
Simple example<br />
#make 2 rows, 3 columns, 6 <strong>plot</strong>s total, by row.<br />
par(mfrow=c(2,3))<br />
<strong>for</strong>(i in 1:6)<br />
{<br />
<strong>plot</strong>(cars)<br />
}<br />
Same thing, but <strong>plot</strong> by column instead of row.<br />
#fill down the column first<br />
par(mfcol=c(2,3))<br />
<strong>plot</strong>(cars);<br />
bar<strong>plot</strong>(cars);<br />
<strong>plot</strong>(cars,type='l');<br />
<strong>plot</strong>(cars,type='h');<br />
hist(cars)<br />
<strong>plot</strong>(cars,pch=8,col=rainbow(5))
Adjusting margins<br />
#mar is the margin around each individual <strong>plot</strong>, oma is the<br />
outer margin area around all the <strong>plot</strong>s.<br />
par(mfrow=c(2,3), mar=c(5,5,5,3), oma=c(3,3,5,3)) #Bottom,<br />
Left, Top, Right.<br />
<strong>for</strong>(i in 1:6)<br />
{<br />
<strong>plot</strong>(cars, main=i)<br />
}<br />
Put <strong>plot</strong>s in a file<br />
PDF<br />
Oftentimes it's nice to have each <strong>plot</strong> on a separate pdf page. This allows you to do<br />
things like print out <strong>plot</strong>s 20 per page. If you start writing output to a pdf file, each <strong>plot</strong><br />
you create will be on its own pdf page.<br />
pdf(file="H:/figures.pdf")<br />
<strong>plot</strong>(cars);<br />
bar<strong>plot</strong>(cars);<br />
<strong>plot</strong>(cars,type='l');<br />
<strong>plot</strong>(cars,type='h');<br />
hist(cars)<br />
<strong>plot</strong>(cars,pch=8,col=rainbow(5))<br />
dev.off()<br />
PNG<br />
You can write to a png or other types of image files (bmp, jpeg), but it doesn't create<br />
multiple images the same way as pdf. Each file is only one image. But that image could<br />
be a multiple figure <strong>plot</strong>.<br />
Adding title <strong>for</strong> multiple figure <strong>layout</strong><br />
#the "line" value tells how far away from the figures the<br />
title should be placed.<br />
mtext("All my <strong>plot</strong>s",outer=TRUE,line=1)<br />
png(filename="H:/figures.png", width=600, bg="white")<br />
par(mfrow=c(2,3))<br />
<strong>plot</strong>(cars);<br />
bar<strong>plot</strong>(cars);<br />
<strong>plot</strong>(cars,type='l');<br />
<strong>plot</strong>(cars,type='h');<br />
hist(cars)<br />
<strong>plot</strong>(cars,pch=8,col=rainbow(5))<br />
dev.off()