

here - CEOP-HE
here - CEOP-HE
here - CEOP-HE

You also want an ePaper? Increase the reach of your titles
YUMPU automatically turns print PDFs into web optimized ePapers that Google loves.
2. Science rationale<br />
2.1 Distribution of high elevation areas over the continents<br />
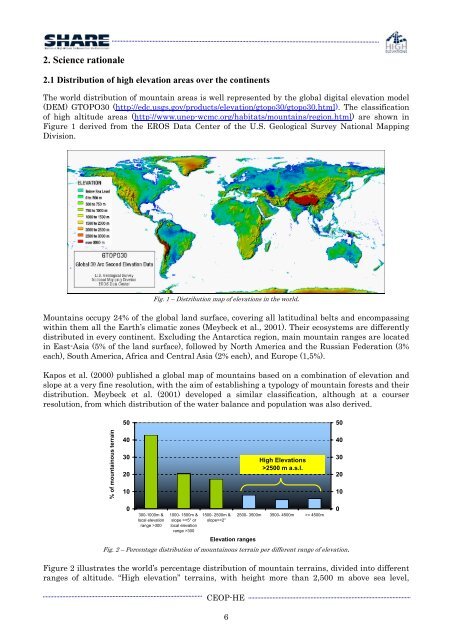
The world distribution of mountain areas is well represented by the global digital elevation model<br />
(DEM) GTOPO30 (http://edc.usgs.gov/products/elevation/gtopo30/gtopo30.html). The classification<br />
of high altitude areas (http://www.unep-wcmc.org/habitats/mountains/region.html) are shown in<br />
Figure 1 derived from the EROS Data Center of the U.S. Geological Survey National Mapping<br />
Division.<br />
Fig. 1 – Distribution map of elevations in the world.<br />
Mountains occupy 24% of the global land surface, covering all latitudinal belts and encompassing<br />
within them all the Earth’s climatic zones (Meybeck et al., 2001). Their ecosystems are differently<br />
distributed in every continent. Excluding the Antarctica region, main mountain ranges are located<br />
in East-Asia (5% of the land surface), followed by North America and the Russian Federation (3%<br />
each), South America, Africa and Central Asia (2% each), and Europe (1,5%).<br />
Kapos et al. (2000) published a global map of mountains based on a combination of elevation and<br />
slope at a very fine resolution, with the aim of establishing a typology of mountain forests and their<br />
distribution. Meybeck et al. (2001) developed a similar classification, although at a courser<br />
resolution, from which distribution of the water balance and population was also derived.<br />
50<br />
50<br />
% of mountainous terrain<br />
40<br />
30<br />
20<br />
10<br />
High Elevations<br />
>2500 m a.s.l.<br />
40<br />
30<br />
20<br />
10<br />
0<br />
300-1000m &<br />
local elevation<br />
range >300<br />
1000- 1500m &<br />
slope >=5° or<br />
local elevation<br />
range >300<br />
1500- 2500m &<br />
slope>=2°<br />
<strong>CEOP</strong>-<strong>HE</strong><br />
6<br />
2500- 3500m<br />
3500- 4500m<br />
>= 4500m<br />
Elevation ranges<br />
Fig. 2 – Percentage distribution of mountainous terrain per different range of elevation.<br />
Figure 2 illustrates the world’s percentage distribution of mountain terrains, divided into different<br />
ranges of altitude. “High elevation” terrains, with height more than 2,500 m above sea level,<br />
0