- Page 1 and 2: ADVANCESINNATURALORGANICMATTER ANDH
- Page 3 and 4: 15th IHSS Meeting- Vol. 2 Maquetaci
- Page 5 and 6: 15th IHSS Meeting- Vol. 2 Research
- Page 7 and 8: 15th IHSS Meeting- Vol. 2 CHA9 (119
- Page 9 and 10: 15th IHSS Meeting- Vol. 2 TER13 (12
- Page 11 and 12: 15th IHSS Meeting- Vol. 2 TER50 (32
- Page 13 and 14: 15th IHSS Meeting- Vol. 2 AGR23 (27
- Page 15 and 16: 15th IHSS Meeting- Vol. 2 Research
- Page 17 and 18: 15th IHSS Meeting- Vol. 2 3. Result
- Page 19 and 20: 15th IHSS Meeting- Vol. 2 Figure 3.
- Page 21 and 22: 15th IHSS Meeting- Vol. 2 to stabil
- Page 23 and 24: 15th IHSS Meeting- Vol. 2 the occlu
- Page 25 and 26: 1 2 3 4 5 6 7 8 9 10 11 12 13 14 15
- Page 27 and 28: 15th IHSS Meeting- Vol. 2 on kaolin
- Page 29 and 30: 15th IHSS Meeting- Vol. 2 fast-cycl
- Page 31 and 32: 15th IHSS Meeting- Vol. 2 Island, a
- Page 33 and 34: 15th IHSS Meeting- Vol. 2 4. Conclu
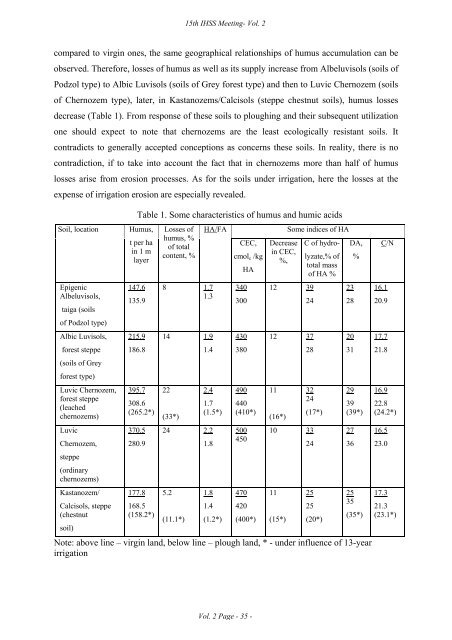
- Page 35: 15th IHSS Meeting- Vol. 2 Humus of
- Page 39 and 40: 15th IHSS Meeting- Vol. 2 Predictio
- Page 41 and 42: 15th IHSS Meeting- Vol. 2 Formation
- Page 43 and 44: 15th IHSS Meeting- Vol. 2 Assessmen
- Page 45 and 46: 15th IHSS Meeting- Vol. 2 and humin
- Page 47 and 48: 15th IHSS Meeting- Vol. 2 Organic M
- Page 49 and 50: 15th IHSS Meeting- Vol. 2 Research
- Page 51 and 52: 15th IHSS Meeting- Vol. 2 2A (conta
- Page 53 and 54: 15th IHSS Meeting- Vol. 2 Table 1 R
- Page 55 and 56: 15th IHSS Meeting- Vol. 2 2. Materi
- Page 57 and 58: 15th IHSS Meeting- Vol. 2 Long-term
- Page 59 and 60: 15th IHSS Meeting- Vol. 2 Compariso
- Page 61 and 62: 15th IHSS Meeting- Vol. 2 3. Result
- Page 63 and 64: 15th IHSS Meeting- Vol. 2 Similarit
- Page 65 and 66: 15th IHSS Meeting- Vol. 2 significa
- Page 67 and 68: 15th IHSS Meeting- Vol. 2 Research
- Page 69 and 70: 15th IHSS Meeting- Vol. 2 spectrome
- Page 71 and 72: 15th IHSS Meeting- Vol. 2 Allophani
- Page 73 and 74: 15th IHSS Meeting- Vol. 2 HCl (pH 1
- Page 75 and 76: 15th IHSS Meeting- Vol. 2 These lon
- Page 77 and 78: 15th IHSS Meeting- Vol. 2 reconstru
- Page 79 and 80: 15th IHSS Meeting- Vol. 2 Structura
- Page 81 and 82: 15th IHSS Meeting- Vol. 2 3. Result
- Page 83 and 84: 15th IHSS Meeting- Vol. 2 Influence
- Page 85 and 86: 15th IHSS Meeting- Vol. 2 deeper la
- Page 87 and 88:
15th IHSS Meeting- Vol. 2 Research
- Page 89 and 90:
15th IHSS Meeting- Vol. 2 Each ice
- Page 91 and 92:
15th IHSS Meeting- Vol. 2 Figure 3.
- Page 93 and 94:
15th IHSS Meeting- Vol. 2 gel, were
- Page 95 and 96:
15th IHSS Meeting- Vol. 2 of organi
- Page 97 and 98:
15th IHSS Meeting- Vol. 2 detector
- Page 99 and 100:
15th IHSS Meeting- Vol. 2 Acknowled
- Page 101 and 102:
15th IHSS Meeting- Vol. 2 Pyrolytic
- Page 103 and 104:
15th IHSS Meeting- Vol. 2 discussed
- Page 105 and 106:
15th IHSS Meeting- Vol. 2 Character
- Page 107 and 108:
15th IHSS Meeting- Vol. 2 HL NG NG
- Page 109 and 110:
15th IHSS Meeting- Vol. 2 Specific
- Page 111 and 112:
15th IHSS Meeting- Vol. 2 NH2O(mg .
- Page 113 and 114:
15th IHSS Meeting- Vol. 2 Spectrosc
- Page 115 and 116:
15th IHSS Meeting- Vol. 2 Reactivit
- Page 117 and 118:
15th IHSS Meeting- Vol. 2 formulae,
- Page 119 and 120:
15th IHSS Meeting- Vol. 2 Fluoresce
- Page 121 and 122:
15th IHSS Meeting- Vol. 2 transfer)
- Page 123 and 124:
15th IHSS Meeting- Vol. 2 Character
- Page 125 and 126:
15th IHSS Meeting- Vol. 2 p A − A
- Page 127 and 128:
15th IHSS Meeting- Vol. 2 Photochem
- Page 129 and 130:
15th IHSS Meeting- Vol. 2 Capillary
- Page 131 and 132:
15th IHSS Meeting- Vol. 2 The elect
- Page 133 and 134:
15th IHSS Meeting- Vol. 2 Potential
- Page 135 and 136:
15th IHSS Meeting- Vol. 2 unstable
- Page 137 and 138:
15th IHSS Meeting- Vol. 2 Analysis
- Page 139 and 140:
15th IHSS Meeting- Vol. 2 3. Result
- Page 141 and 142:
15th IHSS Meeting- Vol. 2 Structura
- Page 143 and 144:
15th IHSS Meeting- Vol. 2 informati
- Page 145 and 146:
15th IHSS Meeting- Vol. 2 A Novel A
- Page 147 and 148:
15th IHSS Meeting- Vol. 2 3. Result
- Page 149 and 150:
15th IHSS Meeting- Vol. 2 Study of
- Page 151 and 152:
15th IHSS Meeting- Vol. 2 Iontosorb
- Page 153 and 154:
15th IHSS Meeting- Vol. 2 The Basis
- Page 155 and 156:
15th IHSS Meeting- Vol. 2 4. Conclu
- Page 157 and 158:
15th IHSS Meeting- Vol. 2 vacuum sy
- Page 159 and 160:
15th IHSS Meeting- Vol. 2 Molecular
- Page 161 and 162:
15th IHSS Meeting- Vol. 2 Molecular
- Page 163 and 164:
15th IHSS Meeting- Vol. 2 On the Ad
- Page 165 and 166:
15th IHSS Meeting- Vol. 2 B) UV/Vis
- Page 167 and 168:
15th IHSS Meeting- Vol. 2 Capillary
- Page 169 and 170:
15th IHSS Meeting- Vol. 2 -0.0277 -
- Page 171 and 172:
15th IHSS Meeting- Vol. 2 4. Conclu
- Page 173 and 174:
15th IHSS Meeting- Vol. 2 The spati
- Page 175 and 176:
15th IHSS Meeting- Vol. 2 However,
- Page 177 and 178:
15th IHSS Meeting- Vol. 2 hydroquin
- Page 179 and 180:
15th IHSS Meeting- Vol. 2 on the eq
- Page 181 and 182:
15th IHSS Meeting- Vol. 2 2. Materi
- Page 183 and 184:
15th IHSS Meeting- Vol. 2 To prove
- Page 185 and 186:
15th IHSS Meeting- Vol. 2 to 0% (v/
- Page 187 and 188:
15th IHSS Meeting- Vol. 2 Figure 3:
- Page 189 and 190:
15th IHSS Meeting- Vol. 2 HS and HA
- Page 191 and 192:
15th IHSS Meeting- Vol. 2 The Separ
- Page 193 and 194:
15th IHSS Meeting- Vol. 2 60 Eutric
- Page 195 and 196:
15th IHSS Meeting- Vol. 2 Applicati
- Page 197 and 198:
15th IHSS Meeting- Vol. 2 from foss
- Page 199 and 200:
15th IHSS Meeting- Vol. 2 Soil Orga
- Page 201 and 202:
15th IHSS Meeting- Vol. 2 3. Result
- Page 203 and 204:
15th IHSS Meeting- Vol. 2 Determina
- Page 205 and 206:
15th IHSS Meeting- Vol. 2 3. Result
- Page 207 and 208:
15th IHSS Meeting- Vol. 2 Dynamics
- Page 209 and 210:
15th IHSS Meeting- Vol. 2 The soil
- Page 211 and 212:
15th IHSS Meeting- Vol. 2 Humic Mat
- Page 213 and 214:
15th IHSS Meeting- Vol. 2 In order
- Page 215 and 216:
15th IHSS Meeting- Vol. 2 Natural O
- Page 217 and 218:
15th IHSS Meeting- Vol. 2 3. Result
- Page 219 and 220:
15th IHSS Meeting- Vol. 2 UV-Vis an
- Page 221 and 222:
15th IHSS Meeting- Vol. 2 adjusted
- Page 223 and 224:
15th IHSS Meeting- Vol. 2 2.3), due
- Page 225 and 226:
15th IHSS Meeting- Vol. 2 3. Result
- Page 227 and 228:
15th IHSS Meeting- Vol. 2 Acid hydr
- Page 229 and 230:
15th IHSS Meeting- Vol. 2 to remove
- Page 231 and 232:
15th IHSS Meeting- Vol. 2 confirmed
- Page 233 and 234:
15th IHSS Meeting- Vol. 2 preparati
- Page 235 and 236:
15th IHSS Meeting- Vol. 2 decrease
- Page 237 and 238:
15th IHSS Meeting- Vol. 2 was isola
- Page 239 and 240:
15th IHSS Meeting- Vol. 2 included
- Page 241 and 242:
15th IHSS Meeting- Vol. 2 1,5 Mean
- Page 243 and 244:
15th IHSS Meeting- Vol. 2 humus qua
- Page 245 and 246:
15th IHSS Meeting- Vol. 2 longer pe
- Page 247 and 248:
15th IHSS Meeting- Vol. 2 managemen
- Page 249 and 250:
15th IHSS Meeting- Vol. 2 9. A. Bá
- Page 251 and 252:
15th IHSS Meeting- Vol. 2 (2:1). Th
- Page 253 and 254:
15th IHSS Meeting- Vol. 2 Differenc
- Page 255 and 256:
15th IHSS Meeting- Vol. 2 Equation:
- Page 257 and 258:
15th IHSS Meeting- Vol. 2 Figure. 1
- Page 259 and 260:
15th IHSS Meeting- Vol. 2 Impact of
- Page 261 and 262:
15th IHSS Meeting- Vol. 2 Acknowled
- Page 263 and 264:
15th IHSS Meeting- Vol. 2 polar lip
- Page 265 and 266:
15th IHSS Meeting- Vol. 2 Figure 3:
- Page 267 and 268:
15th IHSS Meeting- Vol. 2 3. Result
- Page 269 and 270:
15th IHSS Meeting- Vol. 2 Character
- Page 271 and 272:
15th IHSS Meeting- Vol. 2 38 24 172
- Page 273 and 274:
15th IHSS Meeting- Vol. 2 Acknowled
- Page 275 and 276:
15th IHSS Meeting- Vol. 2 horizon w
- Page 277 and 278:
15th IHSS Meeting- Vol. 2 differenc
- Page 279 and 280:
15th IHSS Meeting- Vol. 2 were the
- Page 281 and 282:
15th IHSS Meeting- Vol. 2 Figure 1:
- Page 283 and 284:
15th IHSS Meeting- Vol. 2 3. Result
- Page 285 and 286:
15th IHSS Meeting- Vol. 2 The C and
- Page 287 and 288:
15th IHSS Meeting- Vol. 2 4. Conclu
- Page 289 and 290:
15th IHSS Meeting- Vol. 2 mg C·L -
- Page 291 and 292:
15th IHSS Meeting- Vol. 2 Relations
- Page 293 and 294:
15th IHSS Meeting- Vol. 2 Changes i
- Page 295 and 296:
15th IHSS Meeting- Vol. 2 in C expo
- Page 297 and 298:
15th IHSS Meeting- Vol. 2 Distribut
- Page 299 and 300:
15th IHSS Meeting- Vol. 2 Table 1:
- Page 301 and 302:
15th IHSS Meeting- Vol. 2 Propertie
- Page 303 and 304:
15th IHSS Meeting- Vol. 2 to determ
- Page 305 and 306:
15th IHSS Meeting- Vol. 2 Changes i
- Page 307 and 308:
15th IHSS Meeting- Vol. 2 The verti
- Page 309 and 310:
15th IHSS Meeting- Vol. 2 NOM quali
- Page 311 and 312:
15th IHSS Meeting- Vol. 2 Organic M
- Page 313 and 314:
15th IHSS Meeting- Vol. 2 (
- Page 315 and 316:
15th IHSS Meeting- Vol. 2 HA was di
- Page 317 and 318:
15th IHSS Meeting- Vol. 2 fertilize
- Page 319 and 320:
15th IHSS Meeting- Vol. 2 to better
- Page 321 and 322:
15th IHSS Meeting- Vol. 2 The OM of
- Page 323 and 324:
15th IHSS Meeting- Vol. 2 2.3. Fung
- Page 325 and 326:
15th IHSS Meeting- Vol. 2 80 60 •
- Page 327 and 328:
15th IHSS Meeting- Vol. 2 humus com
- Page 329 and 330:
15th IHSS Meeting- Vol. 2 of forest
- Page 331 and 332:
15th IHSS Meeting- Vol. 2 Table 1:
- Page 333 and 334:
15th IHSS Meeting- Vol. 2 This is n
- Page 335 and 336:
15th IHSS Meeting- Vol. 2 On the de
- Page 337 and 338:
15th IHSS Meeting- Vol. 2 Reference
- Page 339 and 340:
15th IHSS Meeting- Vol. 2 customize
- Page 341 and 342:
15th IHSS Meeting- Vol. 2 Table 1:
- Page 343 and 344:
15th IHSS Meeting- Vol. 2 content o
- Page 345 and 346:
15th IHSS Meeting- Vol. 2 Transform
- Page 347 and 348:
15th IHSS Meeting- Vol. 2 Changes i
- Page 349 and 350:
15th IHSS Meeting- Vol. 2 FTIR Char
- Page 351 and 352:
15th IHSS Meeting- Vol. 2 (1234 cm
- Page 353 and 354:
15th IHSS Meeting- Vol. 2 Character
- Page 355 and 356:
15th IHSS Meeting- Vol. 2 Figure 1:
- Page 357 and 358:
15th IHSS Meeting- Vol. 2 Structura
- Page 359 and 360:
15th IHSS Meeting- Vol. 2 Changes o
- Page 361 and 362:
15th IHSS Meeting- Vol. 2 Carbon Di
- Page 363 and 364:
15th IHSS Meeting- Vol. 2 T5 a A T5
- Page 365 and 366:
15th IHSS Meeting- Vol. 2 Does the
- Page 367 and 368:
15th IHSS Meeting- Vol. 2 Figure 1:
- Page 369 and 370:
15th IHSS Meeting- Vol. 2 hydration
- Page 371 and 372:
15th IHSS Meeting- Vol. 2 average t
- Page 373 and 374:
15th IHSS Meeting- Vol. 2 Carbon Se
- Page 375 and 376:
15th IHSS Meeting- Vol. 2 TOC stock
- Page 377 and 378:
15th IHSS Meeting- Vol. 2 Mechanism
- Page 379 and 380:
15th IHSS Meeting- Vol. 2 Humus Sys
- Page 381 and 382:
15th IHSS Meeting- Vol. 2 Table 1:
- Page 383 and 384:
15th IHSS Meeting- Vol. 2 0.20 1.94
- Page 385 and 386:
15th IHSS Meeting- Vol. 2 Organic M
- Page 387 and 388:
15th IHSS Meeting- Vol. 2 where HA
- Page 389 and 390:
15th IHSS Meeting- Vol. 2 Organic M
- Page 391 and 392:
15th IHSS Meeting- Vol. 2 carbohydr
- Page 393 and 394:
15th IHSS Meeting- Vol. 2 Effect of
- Page 395 and 396:
15th IHSS Meeting- Vol. 2 the other
- Page 397 and 398:
15th IHSS Meeting- Vol. 2 Multianal
- Page 399 and 400:
15th IHSS Meeting- Vol. 2 Figure 1:
- Page 401 and 402:
15th IHSS Meeting- Vol. 2 Humic Aci
- Page 403 and 404:
15th IHSS Meeting- Vol. 2 Evaluatio
- Page 405 and 406:
15th IHSS Meeting- Vol. 2 Molecular
- Page 407 and 408:
15th IHSS Meeting- Vol. 2 458 572 6
- Page 409 and 410:
15th IHSS Meeting- Vol. 2 Vol. 2 Pa
- Page 411 and 412:
15th IHSS Meeting- Vol. 2 Long-Term
- Page 413 and 414:
15th IHSS Meeting- Vol. 2 4. Conclu
- Page 415 and 416:
15th IHSS Meeting- Vol. 2 Chromium
- Page 417 and 418:
15th IHSS Meeting- Vol. 2 SH, GP an
- Page 419 and 420:
15th IHSS Meeting- Vol. 2 3. Result
- Page 421 and 422:
15th IHSS Meeting- Vol. 2 significa
- Page 423 and 424:
15th IHSS Meeting- Vol. 2 decreased
- Page 425 and 426:
15th IHSS Meeting- Vol. 2 Factors A
- Page 427 and 428:
15th IHSS Meeting- Vol. 2 incorpora
- Page 429 and 430:
15th IHSS Meeting- Vol. 2 Anaerobic
- Page 431 and 432:
15th IHSS Meeting- Vol. 2 The bond
- Page 433 and 434:
15th IHSS Meeting- Vol. 2 Assessmen
- Page 435 and 436:
15th IHSS Meeting- Vol. 2 Table 1:
- Page 437 and 438:
15th IHSS Meeting- Vol. 2 Hot-Water
- Page 439 and 440:
15th IHSS Meeting- Vol. 2 collected
- Page 441 and 442:
15th IHSS Meeting- Vol. 2 Chemical
- Page 443 and 444:
15th IHSS Meeting- Vol. 2 Influence
- Page 445 and 446:
15th IHSS Meeting- Vol. 2 Applicati
- Page 447 and 448:
15th IHSS Meeting- Vol. 2 30 days o
- Page 449 and 450:
15th IHSS Meeting- Vol. 2 Effect of
- Page 451 and 452:
15th IHSS Meeting- Vol. 2 silage. T
- Page 453 and 454:
15th IHSS Meeting- Vol. 2 Aerobic S
- Page 455 and 456:
15th IHSS Meeting- Vol. 2 organic f
- Page 457 and 458:
15th IHSS Meeting- Vol. 2 Dynamics
- Page 459 and 460:
15th IHSS Meeting- Vol. 2 SOC miner
- Page 461 and 462:
15th IHSS Meeting- Vol. 2 The Conte
- Page 463 and 464:
15th IHSS Meeting- Vol. 2 Control p
- Page 465 and 466:
15th IHSS Meeting- Vol. 2 Study the
- Page 467 and 468:
15th IHSS Meeting- Vol. 2 4. Conclu
- Page 469 and 470:
15th IHSS Meeting- Vol. 2 The exper
- Page 471 and 472:
15th IHSS Meeting- Vol. 2 The main
- Page 473 and 474:
15th IHSS Meeting- Vol. 2 were obta
- Page 475 and 476:
15th IHSS Meeting- Vol. 2 has previ
- Page 477 and 478:
15th IHSS Meeting- Vol. 2 Analyses
- Page 479 and 480:
15th IHSS Meeting- Vol. 2 disadvant
- Page 481 and 482:
15th IHSS Meeting- Vol. 2 soil and
- Page 483 and 484:
15th IHSS Meeting- Vol. 2 inert as
- Page 485 and 486:
15th IHSS Meeting- Vol. 2 absorbanc
- Page 487 and 488:
15th IHSS Meeting- Vol. 2 obtained
- Page 489 and 490:
15th IHSS Meeting- Vol. 2 3. Result
- Page 491 and 492:
15th IHSS Meeting- Vol. 2 Evaluatio
- Page 493 and 494:
15th IHSS Meeting- Vol. 2 A 465 800
- Page 495 and 496:
15th IHSS Meeting- Vol. 2 Chemical
- Page 497 and 498:
15th IHSS Meeting- Vol. 2 3. Result
- Page 499 and 500:
15th IHSS Meeting- Vol. 2 Study of
- Page 501 and 502:
15th IHSS Meeting- Vol. 2 As seen i
- Page 503 and 504:
15th IHSS Meeting- Vol. 2 Use of Ra
- Page 505 and 506:
15th IHSS Meeting- Vol. 2 Looking a
- Page 507 and 508:
15th IHSS Meeting- Vol. 2 Photoacou
- Page 509 and 510:
15th IHSS Meeting- Vol. 2 The spect
- Page 511 and 512:
15th IHSS Meeting- Vol. 2 The Appli
- Page 513 and 514:
15th IHSS Meeting- Vol. 2 Height, c
- Page 515 and 516:
15th IHSS Meeting- Vol. 2 Microorga
- Page 517 and 518:
15th IHSS Meeting- Vol. 2 Can Semia
- Page 519 and 520:
15th IHSS Meeting- Vol. 2 twice hig
- Page 521 and 522:
15th IHSS Meeting- Vol. 2 The Exoge
- Page 523 and 524:
15th IHSS Meeting- Vol. 2 33 up to
- Page 525 and 526:
15th IHSS Meeting- Vol. 2 mineral f
- Page 527 and 528:
15th IHSS Meeting- Vol. 2 In additi
- Page 529 and 530:
15th IHSS Meeting- Vol. 2 case: soi
- Page 531 and 532:
% Soil Organic Carbon 3,00 2,50 2,0
- Page 533 and 534:
15th IHSS Meeting- Vol. 2 Rhizosphe
- Page 535 and 536:
15th IHSS Meeting- Vol. 2 used [14,
- Page 537 and 538:
15th IHSS Meeting- Vol. 2 Effects o
- Page 539 and 540:
15th IHSS Meeting- Vol. 2 Data calc
- Page 541 and 542:
15th IHSS Meeting- Vol. 2 Vol. 2 Pa