
You also want an ePaper? Increase the reach of your titles
YUMPU automatically turns print PDFs into web optimized ePapers that Google loves.
ADVANCESINNATURALORGANICMATTER<br />
ANDHUMICSUBSTANCESRESEARCH<br />
2008-2010<br />
XVMeetingofthe<br />
InternationalHumicSubstancesSociety<br />
PuertodelaC<strong>ru</strong>z,Tenerife,CanaryIslands,27June-2July2010<br />
Proceedings<br />
<strong>Vol</strong>2<br />
J.A.González-Pérez,F.J.González-Vila,G.AlmendrosEds
15th IHSS Meeting- <strong>Vol</strong>. 2<br />
ADVANCES IN<br />
NATURAL ORGANIC MATTER<br />
AND<br />
HUMIC SUBSTANCES RESEARCH<br />
2008-2010<br />
<strong>Vol</strong>. 2<br />
POSTER PRESENTATIONS<br />
Proceedings Book of the Communications presented to the<br />
15 th Meeting of the International Humic Substances Society<br />
Tenerife - Canary Islands. June 27- July 2, 2010<br />
Editors:<br />
J.A. González-Pérez, F.J. González-Vila & G. Almendros<br />
<strong>Vol</strong>. 2 Page - 1 -
15th IHSS Meeting- <strong>Vol</strong>. 2<br />
Maquetación: Carlos Marfil Daza<br />
Published on-line in: Digital.CSIC (http://digital.csic.es/), the Institutional<br />
Repository of “Consejo Superior de Investigaciones Científicas” (CSIC).<br />
© 15 th Meeting of the IHSS, Tenerife, Canary Islands. 2010<br />
URI:<br />
<strong>Vol</strong>. 2 Page - 2 -
15th IHSS Meeting- <strong>Vol</strong>. 2<br />
<strong>CONTENT</strong> <strong>Vol</strong>. 2<br />
POSTER PRESENTATIONS SESSION A<br />
MOLTER<br />
Molecular St<strong>ru</strong>ctures as Drivers and Tracers of Terrestrial C Fluxes<br />
(A selection of papers under the MOLTER Research Themes)<br />
Research Theme 1<br />
Molecular composition and turnover of soil organic matter<br />
MOL1-1 (83) Fate of different pure organic substances in the soil. F. Alianiello, P.<br />
Schmitt-Kōpplin, M. Lucio, M.G. Mascia, M. Valentini, S. Cozzolino<br />
MOL1-2 (280) Microbial carbon turnover and dynamics from biochemically diverse<br />
microbial groups in temperate and tropical forest soils. H.M. Throckmorton, J.A. Bird,<br />
W.R. Horwath, M.K. Firestone<br />
MOL1-3 (332) Carbon forms change in Chernozems of the Trans-Uralian region at<br />
reserve mode (at the Arcaim Reserve, Russia). V. Prikhodko, E. Manakhova, D. Manakhov<br />
MOL1-4 (335) An isotopic investigation of the temperature response of young and old<br />
soil organic matter respiration. N. Burns, J. Cloy, M. Garnett, D. Reay, K. Smith, W. Otten<br />
MOL1-5 (232) Factors influencing carbon stabilization processes in volcanic ash<br />
Anthrosols (Tenerife Island, Spain). Z. Hernández, G. Almendros, A. Gómez Sal<br />
Research Theme 2<br />
Plant molecular st<strong>ru</strong>ctures as drivers of C stabilisation in soils<br />
MOL2-1 (69) <strong>Humus</strong> of West-Siberian soils as influenced by human mpact. B. Klenov<br />
MOL2-2 (64) Prediction of soil organic carbon stock on arable soils. G. Barančíková, M.<br />
Nováková, Z. Tarasovičová, Š. Koco, J. Halás, R. Skalský, J. Makovníková<br />
MOL2-3 (162) Formation of humus-mineral compounds by surface polymerization of<br />
low molecular weight precursors. A. Zavarzina, V. Demin<br />
MOL2-4 (344) Assessment of soil organic matter stability after low temperature ashing<br />
by DRIFT spectroscopy. A. Piedra Buena, G. Almendros, A. Pucci, P. Tinoco, L.P. D’Acqui<br />
MOL2-5 (264) Organic matter in subtropical Leptosol under pasture affected by fire:<br />
stocks, physical fractions and chemical composition. D.P. Dick, M. Potes, C. Bayer, M.<br />
Tomazi<br />
<strong>Vol</strong>. 2 Page - 3 -
15th IHSS Meeting- <strong>Vol</strong>. 2<br />
Research Theme 3<br />
Fire transformations of plant and soil molecular st<strong>ru</strong>ctures<br />
MOL3-1 (59) Relationships between the vertical distribution of biochars and the soil<br />
age, humus composition or carbon storage in the profile of a cumulative volcanic ash<br />
soil. S. Nishimura, K. Miyazaki, Y. Inoue, H. Shindo<br />
MOL3-2 (116) Impact of st<strong>ru</strong>ctural heterogeneity of pyrogenic organic material (PyOM)<br />
on humification processes in fire-affected soils. H. Knicker, A. Hilscher<br />
MOL3-3 (246) Long-term effects of wildfires on soil organic matter features: a study in<br />
Mediterranean sh<strong>ru</strong>blands of Eastern Spain. P. Rovira, B. Duguy<br />
MOL3-4 (304) Comparison of humic substances in burnt and unburned forest soils in<br />
central Portugal. S. Faria, M.E Varela, V.I. Esteves, J.J. Keizer<br />
MOL3-5 (250) Similarities of 13 C NMR spectroscopic properties of humic acids between<br />
black soils–Andosols and Chernozems. N. Fujitake, M. Tani, B. Michael Msanya, E.<br />
Abakumov, T. Kosaki<br />
Research Theme 4:<br />
Molecular markers in soils<br />
MOL4-1 (263) Chemical composition of stabilized SOM in dense fractions of allophanic<br />
and non-allophanic Andosols. C. Rumpel, A. Rodríguez-Rodríguez, C.D. Arbelo, C.M.<br />
Armas, J.A. González-Pérez, F.J. González-Vila, A. Chabbi<br />
MOL4-2 (117) Molecular study of lipids in peat and lignite by sequential chemical<br />
degradation. R. Bachrata, M. Klucakova, L. Grasset<br />
MOL4-3 (88) Organic matter of buried soils as a paleoclimatic archive of Holocene. N.<br />
Kovaleva, I. Kovalev<br />
MOL4-4 (136) St<strong>ru</strong>ctural features of soil humic acids as assessed by 13 C nuclear<br />
magnetic resonance and analytical pyrolysis in areas under coffee cultivation in<br />
Southeastern, Brazil. F. Alisson, E. de Sá Mendonça, I.M. Cardoso, A. Roig, M.A. Sánchez-<br />
Monedero, J.A. González-Pérez, F.J. González-Vila<br />
MOL4-5 (341) Influence of the vegetation cover in the soil biomarker assemblage under<br />
rhododendron and oak stands. F.J. González-Vila, J.A. González-Pérez, C. Marfil, M.E.<br />
Arias, J. Rodríguez. T. Marañón, L. Clemente<br />
<strong>Vol</strong>. 2 Page - 4 -
15th IHSS Meeting- <strong>Vol</strong>. 2<br />
Research Theme 5<br />
Dissolved organic molecules in soils: origin, functionality and transport<br />
MOL5-1 (133) A novel approach to analyzing dissolved organic matter in ice core<br />
samples by Fourier transform ion cyclotron mass spectrometry. J.J.S. Marsh, P.G.<br />
Hatcher, A.M. Grannas, V.L. Boschi, N.L. Harmuth<br />
MOL5-2 (121) Distribution of protein-like components in electrophoretic fractions of<br />
humic substances from soils and their litter layers. O. T<strong>ru</strong>betskoj, N. Ganzhara, O.<br />
T<strong>ru</strong>betskaya<br />
MOL5-3 (245) Soil liquid phase pH-controlling role of water-soluble organic compounds<br />
in presence of extra heavy metal concentrations. I. Makarychev<br />
MOL5-4 (262) St<strong>ru</strong>ctural analysis of dissolved organic matter with hydrophilic<br />
interaction liquid chromatography and nuclear magnetic resonance spectroscopy. G.C.<br />
Woods, M.J. Simpson, A.J. Simpson<br />
Characterization of Natural Organic Matter and Humic Substances<br />
CHA1 (13) Pyrolytic approaches for the molecular characterization of lignite humic<br />
substances. M. Stefanova, S. Marinov, L. Grasset, A. Amblès<br />
CHA3 (47) Specific surface area of humic acids isolated from soils amended with<br />
different organic matter determined from water vapour and nitrogen adsorption data. J.<br />
Kwiatkowska-Malina, Z. Sokołowska<br />
CHA4 (70) Spectroscopic study of humic substances extracted from sediment at<br />
Goczałkowice Dam reservoir. M. Bartoszek, J. Polak, N. Młynarczyk, A. Kos, W.W.<br />
Sułkowski<br />
CHA5 (78) Reactivity and chemical characterization of effluent derived-organic<br />
nitrogen in freshwaters determined from Fourier transform ion cyclotron mass<br />
spectrometry (FT-ICR-MS). R. Mesfioui, P.G. Hatcher, M.R. Mulholland, D.A. Bronk,<br />
E.A. Canuel, N.G. Love<br />
CHA6 (100) Fluorescence dynamics of humic substances re-considered: st<strong>ru</strong>cture vs.<br />
heterogeneity. S. Eidner, S. Gehne, M.U. Kumke<br />
CHA7 (105) Characterization of humic acids from point of view of dissociation. E.<br />
Cechova, R. Kolajova, M. Klucakova<br />
CHA8 (110) Photochemical properties of humic substances: toward a better<br />
characterization of the photosensitizing chromophores (localisation, fluorescence<br />
characteristics). C. Coelho, G. Guyot, A. ter Halle, O. T<strong>ru</strong>betskaya, O. T<strong>ru</strong>betskoj, L.<br />
Cavani, C. Ciavatta, C. Richard<br />
<strong>Vol</strong>. 2 Page - 5 -
15th IHSS Meeting- <strong>Vol</strong>. 2<br />
CHA9 (119) Capillary electrophoretic characterisation of humic substances. V. Lepane,<br />
J. Gorohhova<br />
CHA11 (137) Analysis of carbohydrates in peatbogs: comparison of acid hydrolysis and<br />
thermochemolysis methods. C. Estournel, F. Dela<strong>ru</strong>e, L. Grasset, F. Laggoun-Défarge<br />
CHA12 (140) St<strong>ru</strong>ctural and statistical analysis of diverse analytical techniques spectra<br />
from diverse source organic matter in solution. R. Baigorri, M. Fuentes, F.J. González-<br />
Vila, J.M. García-Mina<br />
CHA13 (143) A novel approach of different analytical tools applied in the study of soils<br />
and humic substances. P.C. Dabas<br />
CHA14 (163) Study of immobilized Aluminium(III) metal ion affinity chromatography<br />
for fractionation and characterization of humic substances. R. Halko, T. Neuročný, M.<br />
Hutta<br />
CHA15 (182) The basis for a humeomic science. A. Piccolo, A. Nebbioso<br />
CHA16 (190) Radionuclide diagnostics of hydrophobicity and surface activity of humic<br />
substances. G.A. Badun, M.G. Chernysheva, A.I. Konstantinov, N.A. Kulikova, I.V.<br />
Perminova<br />
CHA18 (223) Molecular characterization of humic acids from Tunisian phosphatic<br />
pellets using pyrolysis- gas chromatography- mass spectrometry. A. Ben Hassen, J.<br />
Trichet, J.-R. Disnar<br />
CHA19 (247) On the additivity of the properties of humic acid fractions. M. Drosos, G.<br />
Abbt-Braun, F.H. Frimmel, Y. Deligiannakis<br />
CHA20 (248) Capillary zone electrophoresis (CZE) characterization of peat humic acids<br />
fractions obtained by tangential ultra-filtration. L. Cavani, C. Ciavatta<br />
CHA21 (254) DRIFT characterization of organic matter composition on soil st<strong>ru</strong>ctural<br />
surfaces. R. Ellerbrock, H.H. Gerke, M. Leue<br />
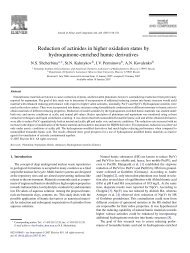
CHA22 (268) Redox properties of hydroqionone-enriched humic substances. N.S.<br />
Shcherbina, I.V. Perminova, A.P. Novikov, S.N. Kalmykov, C.M. Marquardt, C. Walther, G.<br />
Buckau<br />
CHA23 (270) Characterization of soil humic acids using off-line combination of twodimensional<br />
liquid chromatography methods RP-HPLC and SEC. G. Róbert, H. Milan,<br />
R. Pavol<br />
CHA24 (271) Characterization of RP-HPLC fractionated humic acids by RP-HPLC<br />
method using stepwise gradient. R. Pavol, G. Róbert, H. Milan<br />
CHA25 (293) Analysis of fluorescence parameters of alkaline peat extracts in<br />
dependence from their origin. R. Bejger, D. Golebiowska<br />
CHA26 (301) The separation of humic substances on aggregatively stable groups. A.I.<br />
Popov, L.Y. Golovenkina, S.E. Zalmanova<br />
CHA27 (302) Application of the 2D heterospectral correlation spectroscopy ( 13 C NMR x<br />
EPR) in Brazilian soils from reclaimed oil shale mining area. J.V. dos Santos, A.S.<br />
Mangrich, B.F. Pereira, C.A.P. da Silveira, C.N. Pillon, E.H. Novotny<br />
CHA28 (308) Soil organic matter characterization by modified Rock Eval pyrolysis in a<br />
Calcic Chernozem profile. T. Nyilas, I. Czinkota<br />
<strong>Vol</strong>. 2 Page - 6 -
15th IHSS Meeting- <strong>Vol</strong>. 2<br />
CHA29 (315) Determination of organic matter humification by laser induced<br />
breakdown spectrometry and artificial neural network. E.C. Ferreira, D.M.B.P. Milori,<br />
E.J. Ferreira, L. Martin-Neto<br />
CHA30 (343) Dynamics of soil organic matter degradation studied by low temperature<br />
ashing coupled to DRIFT-FTIR spectroscopy. A. Piedra Buena, A. Pucci, P. Tinoco, G.<br />
Almendros, L.P. D’Acqui<br />
CHA31 (346) Humic matter as a conceptual mixture of model compounds: an<br />
application of the molecular mixing model to humic acids from a Mediterranean<br />
semiarid wetland (Las Tablas de Daimiel, Central Spain). J.C. Rodríguez-Murillo, G.<br />
Almendros, H. Knicker<br />
Natural Organic Matter and Humic Substances in Terrestrial Systems<br />
Including Soils<br />
TER1 (8) <strong>Humus</strong> of epilitic and endolitic soils from the Antarcitc dry valley. E.<br />
Abakumov<br />
TER2 (27) humic acid properties in A peat profiles. J. Šīre, M. Kļaviņš<br />
TER3 (52) Comparison of C mineralization rates in forest ecosystems under Continental<br />
(Russia) and Mediterranean (Spain) conditions. I.N. Kurganova, J.F. Gallardo-Lancho,<br />
V.O. Lopes de Gerenyu, C. Oehm<br />
TER4 (60) Characteristic of HA in the system of oligotrophic landscapes of Vasyugan<br />
mire spurs. L.I. Inisheva, N.V. Yudina, A.V. Saveljeva<br />
TER5 (61) Content of polycyclic aromatic hydrocarbons in Podzolic and Peaty Podzolic<br />
Gleyey soils. V. Beznosikov, D. Gabov, B. Kondratenok, A. Taskaev<br />
TER6 (62) Specific features of the st<strong>ru</strong>cture of humic substances of podzolic and peaty<br />
podzolic Gleyey soils. E. Lodygin, V. Beznosikov<br />
TER7 (74) Carbon of particulate organic matter fraction in differently managed<br />
agricultural soil. I. Liaudanskiene, A. Slepetiene, A. Velykis<br />
TER8 (77) Humic substances and their information importance in biosphere. M.<br />
Dergacheva<br />
TER9 (89) The features of humus st<strong>ru</strong>cture of locally hydromorphic Chernozems of the<br />
South of Russia. S.A. Tischenko, O.S. Bezuglova<br />
TER10 (90) Distribution of 14 C-pentachlorophenol residues in different organic carbon<br />
fractions of soils. H. Wang, S.R. Yates, J. Gan, J. Xu, J. Ma<br />
TER11 (95) Evaluation of SOM in different-size fractions in Mexican soils. A. Moyano<br />
Gardini, C. Hidalgo M., J. Etchevers<br />
TER12 (114) Positive effect of “Aguaje” (Mauritia flexuosa L.f.) agroforestal managed<br />
systems on carbon storage in Pe<strong>ru</strong>vian Amazonian soils. J.A. González-Pérez, B. Sales,<br />
J.M. de la Rosa, T.Verdejo, F.J. González-Vila<br />
<strong>Vol</strong>. 2 Page - 7 -
15th IHSS Meeting- <strong>Vol</strong>. 2<br />
TER13 (120) Effects of different systems in use on the contents of organic carbon (TOC)<br />
and nitrogen (N) in the different classes and the stability of aggregates. C. Batista Müller,<br />
O.L. dos Santos Weber<br />
TER14 (123) Variation of humic acid properties within Eipurs peat profile. O. Purmalis,<br />
M. Klavins<br />
TER15 (131) Impact of litter quality on mineralization processes in managed and<br />
abandoned pasture soils in Southern Ecuador. K. Potthast, U. Hamer, F. Makeschin<br />
TER16 (134) Contribution of microbial biomass to SOM formation: bacterial cell<br />
envelops as a source for SOM. A. Miltner, R. Kindler, C. Schuring, P. Bombach, B.<br />
Schmidt-Brücken, M. Kästner<br />
TER17 (138) Quantity and st<strong>ru</strong>ctural characteristics of humic acid in soil aggregates<br />
under different land uses. X. Hao, S. Dou<br />
TER18 (144) Characterization of humic acid extracted from humus soil collected under<br />
the Rhododendron ponticum L. in Northwest Turkey. A. Tutar, A. Özdemir, S. Karakaya,<br />
G. Yazıcı<br />
TER19 (146) St<strong>ru</strong>ctural and functional parameters of humic substances of<br />
postagrogenic soils. I. Kechaykina, S. Chukov<br />
TER20 (154) Humic acids transformation in young buried soils. A.G. Ryumin<br />
TER21 (159) Humic substances in tropical ecosystem soils and the land-use changes.<br />
R.M. Hernández-Hernández, M. Pulido, R. Caballero, I. Castro, E. Ramírez, T. Rondón, Z.<br />
Lozano, B. Mendoza<br />
TER22 (167) Organo-geochemical characteristics of Podzols from the Santa Catarina<br />
Littoral. T. Boski, M. Kumar, H. Knicker, F.J. González-Vila, R. Angulo, M.C. Souza, T.<br />
Verdejo, J.A. González-Pérez<br />
TER23 (171) Humification of pyrogenic organic plant residues in soil. A. Hilscher, H.<br />
Knicker<br />
TER24 (173) Peculiarities of geochemical migration of organic matter in the system the<br />
Amur River – the Amur Liman. S. Levshina<br />
TER25 (181) Relationship between PARAFAC-derived compositional heterogeneity of<br />
fluorescent water-soluble soil organic matter and soil-st<strong>ru</strong>cture stability. G.J. Levy, A.<br />
Lordian, M. Borisover<br />
TER26 (185) Changes in dissolved organic matter losses from soils under different<br />
management. C.M. Byrne, M.H.B. Hayes, A.J. Simpson<br />
TER27 (186) Distribution of humic substances and their association with Fe and Al in<br />
subtropical Oxisol under different pasture management systems. D.P. Dick, G. Sarante<br />
Santana, A.V.A. Jacques, G.S. Chitarra<br />
TER28 (212) Properties of humic acids in soils under different management regimes.<br />
S.S. Gonet, B.Debska, A. Dziamski, M. Banach-Szott, A. Zaujec, N. Szombathova<br />
TER29 (217) Changes in SOM Composition as a function of land-use. M. Hetényi, T.<br />
Nyilas<br />
TER30 (224) NOM quality in forest soils from the NW of Spain: differences between<br />
Quercus robur L. and Betula alba L. plantations. I. Fernández, B. Carrasco, A. Cabaneiro<br />
<strong>Vol</strong>. 2 Page - 8 -
15th IHSS Meeting- <strong>Vol</strong>. 2<br />
TER31 (226) Organic matter evolution in Northern peatlands: a multidisciplinary<br />
approach. J. D’Andrilli, M. Tfaily, E. Corbett, J. Chanton, S.S. Dasgupta, D.I. Siegel, P.H.<br />
Glaser, B. Cooper<br />
TER32 (228) Long term impact of conservation tillage under semi-arid Mediterranean<br />
conditions: effect on soil humic substance content. M. Panettieri, J.M. Murillo, F. Moreno,<br />
R. López, E. Madejón<br />
TER33 (229) New and old C dynamics in a long-term experiment as affected by<br />
fertilization treatments. P. Gioacchini, D. Montecchio, G. Baldoni, C. Ciavatta<br />
TER34 (242) The organic matter of the Jurassic-Cretaceous deposits in the Yenisey-<br />
Khatanga regional trough (East Siberia) according to geochemical data. L<br />
Boldushevskaya, Y. Philiptsov, A. Fomin<br />
TER35 (252) Effect of clay minerals on the fungal degradation of humic acid. Y. Yanagi,<br />
S. Makino, T. Miyagawa, N. Fujitake<br />
TER36 (253) Fixation of organic substance in forms resistant to oxidative degradation as<br />
the universal mechanism of clay transformation at soil formation in forest-steppe<br />
conditions. A. Shinkarev, K. Giniyatullin, T. Lygina, G. Krinari<br />
TER37 (256) Pyrolysis-gas chromatography/ mass spectrometry characterization of<br />
humic acids in Spodosols under tropical rain forest in Southeastern Brazil. M. González-<br />
Péreza, P. Buurman, P. Vidal-Torrado, L. Martin-Neto<br />
TER38 (260) Dissolved organic carbon in soil solution on the area of agricultural used<br />
fen in North-East Poland. J. Jaszczyński<br />
TER39 (265) Humic substances preserved in speleothems: potential as a<br />
palaeoenvironmental proxy. A.J. Blyth, C. Grove<br />
TER40 (279) Study of chemical st<strong>ru</strong>cture of humic and fulvic acids from soils in arid<br />
and humid climates. S. Amir, P. Winterton, M. Hafidi<br />
TER41 (291) Effect of clear-cutting on humic substances in Podzol in the East Sudety<br />
Mountains. E. Jamroz, J. Weber, J. Drozd, A. Kocowicz, M. Licznar, S. Licznar<br />
TER42 (292) Transformations of humic substances by micromycetes revealed by<br />
fluorescence spectroscopy. V. Terekhova, O. Yakimenko, E. Fedoseeva, D. Khundzhua, D.<br />
Shubina, V. Yuzhakov, S. Patsaeva<br />
TER43 (303) FTIR characterization of humic substances extracted from a Typic<br />
Albaquult soil under different management systems. M. de Oliveira Farias, E.M. Cunha<br />
Cardoso, J. Nicolini, B. Fraga Pereira, A.S. Mangrich, C.N. Pillon<br />
TER44 (306) Characterization of peatland soils from the high Andes by 13 C NMR<br />
spectroscopy. A. Segnini, A.A. Souza, E.H. Novotny, T.J. Bonagamba, A. Posadas, R.<br />
Quiroz, D.M.B.P. Milori, L. Martin Neto<br />
TER45 (309) St<strong>ru</strong>ctural changes of Sieniawa brown coal humic acids upon air oxidation<br />
at 150 ºC. F. Czechowski<br />
TER46 (314) Carbon distribution in different soil fractions affected by cover crops and<br />
soybean rotations under no-tillage system in tropical areas. S.R. Brancalião, L. Martin<br />
Neto, I. Clerici De Maria, H. Cantarella, D.M.B.P. Milori, M.L. Simões, W.T.L da Silva<br />
TER47 (317) Does the thermo-oxidative stability of soil organic matter resemble its<br />
microbiological behaviour? J. Kislinger, C. Siewert, J. Kučerík<br />
<strong>Vol</strong>. 2 Page - 9 -
15th IHSS Meeting- <strong>Vol</strong>. 2<br />
TER50 (327) Carbon sequestration in an Acrisol under no-tillage and organic farming<br />
systems in Northeastern Brazil. L.F. Carvalho Leite, J. de Oliveira Lemos, F. das Chagas<br />
Oliveira, A.S. Ferreira de Araújo<br />
TER51 (336) Mechanisms of iron reduction and phospho<strong>ru</strong>s solubilization in an<br />
intermittently wet pasture soil. J.L. Wilmoth, L.M. McDonald, A.J. Sextone<br />
TER52 (340) <strong>Humus</strong> system of alluvial soils in different land-use systems. T. Shishkov, E.<br />
Filcheva<br />
TER53 (347) Organic matter fractions in semiarid biological soil c<strong>ru</strong>sts – Organomineral<br />
interactions patterns as indicators of the progressive humification stages. I.<br />
Miralles, R. Ortega, S. Chamizo, Y. Cantón, B. van Wesemael, F. Domingo, G. Almendros<br />
TER54 (348) Organic matter in calcimorphic biological soil c<strong>ru</strong>sts in semiarid<br />
ecosystems: when humic-type substances are formed from lignin-lacking terrestrial<br />
biomass. I. Miralles, R. Ortega, S. Chamizo, Y. Cantón, B. van Wesemael, F. Domingo, G.<br />
Almendros<br />
TER55 (349) Effect of soil type and management on soil organic matter in olive grove<br />
cultivation (organic vs. conventional) in a Mediterranean semi-arid environment. F.J.<br />
González-Vila, V. Aranda, T. Verdejo, M.J. Ayora, A. Domínguez, J.M. Martín-García, J.<br />
Calero, R. Delgado<br />
TER56 (351) Multianalytical approach to minerals characterization associated to coals<br />
by combined inst<strong>ru</strong>mental microspectroscopic techniques. L.F.O. Silva, A. Mendez,<br />
M.L.S. Oliveira, F. Macias<br />
TER57 (352) Humic acids properties of the Wroclaw Chernosems and Phaeozems. B.<br />
Łabaz<br />
TER58 (366) Evaluation of the effect of wildfires on microbial communities from<br />
Canary Island forest soils. J. Rodrígueza, A. Turmero, A. Blanquéz, J.A. González-Pérez,<br />
F.J. González-Vila, C. Arbelo, A. Rodríguez-Rodríguez, M.I. Pérez-Leblic, M.E. Arias<br />
TER59 (372) Molecular Proxies for Soil Carbon Storage Patterns in Humic and Fulvic<br />
Acids from Oxisols in Minas Gerais State (Brazil). J.A. González-Pérez, C.P. de Assis; F.J.<br />
González-Vila; J.M. de la Rosa, C. Marfil, I. Jucksch; J.C. Lima Neves; J.L. Lani; E. de Sá<br />
Mendonça, G. Almendros<br />
Natural Organic Matter and Humic Substances in the Agriculture and the<br />
Environment<br />
AGR1 (6) Long-term influence of compost amendment on soil humic acids chemical and<br />
optical properties. L. Pospíšilová, V. Petrášová, T. Liptaj<br />
AGR2 (25) Chromium(VI) bioreduction and Chromium(III)-binding to agricultural<br />
waste. L.F. Sala, P. Blanes, F. Mangiameli, S. García, J.C. González, M.I. Frascaroli, S. Bellú<br />
AGR3 (30) Co-composting of animal grease wastes and lignocellulosic as an approach<br />
for bioprocessing of wastes prohibited for landfilling. O. Bikovens, D. Zarina, G.<br />
Telysheva<br />
<strong>Vol</strong>. 2 Page - 10 -
15th IHSS Meeting- <strong>Vol</strong>. 2<br />
AGR4 (42) Long-term mineral fertilization and its effect on humic condition of the<br />
Haplic Chernozems in Dobroudja. M. Nankova<br />
AGR5 (43) Factors affecting the soil organic matter restoration by amendment<br />
application in arid zones of Argentina. A. Abril, L. Noe<br />
AGR6 (65) Anaerobic degradation of aromatic compounds in humification. K. Hänninen<br />
AGR7 (67) Assessment of humus substances from selected sources and organic wastes<br />
prospects for utilizing in fertilization. M. Huculak-Mączka, K. Hoffmann, J. Hoffmann<br />
AGR8 (96) Hot-water carbon – extracted with hot water percolation (HWP) – the<br />
indicator of compost maturity stages. G. Füleky<br />
AGR9 (98) Chemical and physical soil properties under permanent grassland by organic<br />
manure application. M. Svozilova, H. Karabcova<br />
AGR11 (115) Application of PLFA and DGGE to characterize microbial modifications<br />
induced by pesticides in organic substrates. C. Vischetti, E. Monaci, L. Coppola, M.<br />
Marinozzi, C. Casucci, P. Pe<strong>ru</strong>cci<br />
AGR12 (118) Effect of the application of humic substances on grassland production and<br />
nutrient uptake by herbage. G. Verlinden, T. Coussens, A. De Vliegher, G. Baert, G.<br />
Haesaert<br />
AGR13 (126) Aerobic solid-state processes of municipal solid waste produce recalcitrant<br />
residue that acts as C-sink in the landfill. B. Scaglia, S. Salati, F. Tambone, A. Digregorio,<br />
A. Carrera, F. Adani<br />
AGR14 (130) Dynamics of soil organic carbon in treated wastewater irrigated<br />
agricultural soils. E. Jueschke, B. Marschner, Y. Chen, J. Tarchitzky<br />
AGR15 (148) The content of total organic carbon (TOC) and water extractable organic<br />
carbon (WEOC) in reclaiming overlayers composed of different exogenic organic<br />
material and power plant ash. E. Giegużyńska, J. Chudecka, M. Sienkiewicz, T.<br />
Tomaszewicz<br />
AGR16 (161) Study the content of humic substances in different organic matter sources<br />
and the effect of HA derived from city waste compost on some soil properties. S.<br />
Samavat, M.M. Tehrani<br />
AGR17 (169) Biosolid stabilization degree affects soil fulvic acid properties after<br />
application in a semiarid agroecosystem. P. Soler-Rovira, J.C. García-Gil, C. Plaza, N.<br />
Senesi, A. Polo<br />
AGR18 (170) Molecular characterization of humic acids extracted from compost at<br />
increasing maturity stages. R. Spaccini, A. Piccolo<br />
AGR19 (177) Physical properties of urban compost-based growing media. R. López, J. C.<br />
Ostos, M.J. Díaz<br />
AGR20 (209) Organic matter mineralization and changes in soil biophysical parameters<br />
following biochar amendment. M. Contin, C. Pituello, M. De Nobili<br />
AGR21 (219) Dissolved organic matter (DOM) evolution during the composting process<br />
of coffee by-products. V. D’Orazio, D. Mondelli, N. Senesi<br />
AGR22 (230) Fluorescence monitoring of fulvic and humic acid behavior in wastewater<br />
irrigation experiments (Lins, Brazil). S. Mounier, E. Noirtin, H. Zhao, C. Montes, Y. Lucas<br />
<strong>Vol</strong>. 2 Page - 11 -
15th IHSS Meeting- <strong>Vol</strong>. 2<br />
AGR23 (272) Evaluation of the humification degree of humic acids extracted from soil<br />
under application of wastewater by fluorescence spectroscopy and Laser- Induced<br />
Fluorescence (LIF). C.H. dos Santos, D.M.B.P. Milori, B.H. Martins, M.C. do Brasil<br />
Cardinali, L. Martin-Neto, C.R. Montes, A.J. Melfi<br />
AGR24 (275) Chemical alteration of substrates during initial thermophilic phase of<br />
composting. C.T. Inácio, J. Lemke, D.M.V. de Almeida, C.R. Linhares, E.H. Novotny<br />
AGR25 (285) Study of the humification degree of different organic residues during the<br />
composting. P.R. Dores-Silva, M.D. Landgraf, M.O.O. Rezende<br />
AGR26 (286) Use of raw domestic sewage sludge as matrix for the vermicomposting<br />
process. P.R. Dores-Silva, M.D. Landgraf, M.O.O. Rezende<br />
AGR27 (287) Photoacoustic characterization of humic acids extracted from<br />
vermicomposted residues. D. Forgerini, P.R. Dores-Silva, M.D. Landgraf, M.O.O. Rezende,<br />
W.L. de Barros Melo<br />
AGR28 (300) The application of humic material for plant productivity control in<br />
Malaysia. A.I. Popov, S.P. Melnikov, M.A. Efremova, V.I. Kuznetsov, O.V. Fitch<br />
AGR29 (310) Microorganisms and enzyme activity in the formation of humic substances<br />
during the composting process. R. Quintero Lizaola<br />
AGR30 (311) Can semiarid soils admit high amounts of urban organic wastes for c<br />
fixation? E. García, C. García, T. Hernández<br />
AGR31 (316) The exogenetic huminous acids effectiveness in forming the yield of<br />
agricultural crops and the soils fertility reproduction. L. Pusenkova, I. Khabirov, S.<br />
Gilyazetdinov, V. Kuznetsov , L. Pusenkova<br />
AGR32 (320) Application of organic composts of agricultural and urban residues for<br />
cultivation of Ocimum selloi Benth. L. Botacini Favoretto, W.T.L. da Silva, A.V. Borsato,<br />
F.M. V. Pereira, L. Martin-Neto<br />
AGR33 (345) Evolution of humic-like fractions after application of co-composted sewage<br />
sludge to four Mediterranean agricultural soils. A soil microcosm experiment. A.L.<br />
Pérez-Lomas, V. Aranda, J. Párraga, R. Delgado, G. Almendros, G. Delgado<br />
AGR34 (359) Rhizosphere and exogenous organic matter effects on biological indicators<br />
of soil quality. B. Moreno Sánchez, R. Cañizares González, E. Benítez León<br />
AGR35 (371) Effects of cattle manure and sewage sludge on the transformation of soil<br />
organic matter. I. Pisarek, M. Głowacki<br />
<strong>Vol</strong>. 2 Page - 12 -
15th IHSS Meeting- <strong>Vol</strong>. 2<br />
Molecular St<strong>ru</strong>ctures as Drivers and Tracers of Terrestrial C Fluxes<br />
(MOLTER)<br />
(A selection of papers under the MOLTER Research Themes)<br />
MOLTER is an ESF-funded Research Networking Programme for the 2008-2013 period.<br />
MOLTER aims at stimulating European research on isotopic and organic chemistry<br />
exploration of carbon stabilization and biogeochemistry in terrestrial ecosystems and soils in<br />
particular.<br />
The understanding of the formation, stabilisation and decomposition of complex organic<br />
compounds in the environment (e.g., organic matter in plants, litter, soils and water) is<br />
currently being revolutionized by advanced techniques in identification, quantification, and<br />
origin tracing of functional groups and individual molecules. MOLTER promotes exchanges<br />
of ideas on emerging concepts and paradigms in this important field of research. In particular,<br />
MOLTER recognizes the need to further promote research on:<br />
1. the continued development of new analytical techniques,<br />
2. the inter-comparison of results from different techniques,<br />
3. the creation of molecular databases on studied ecosystems.<br />
4. the development of molecular modelling from soil to ecosystem levels.<br />
More info at: http://www.molter.no/<br />
<strong>Vol</strong>. 2 Page - 13 -
15th IHSS Meeting- <strong>Vol</strong>. 2<br />
Research Theme 1: Molecular composition and turnover of soil<br />
organic matter<br />
<strong>Vol</strong>. 2 Page - 14 -
15th IHSS Meeting- <strong>Vol</strong>. 2<br />
Fate of Different Pure Organic Substances in the Soil<br />
Francesco Alianiello a , Philippe Schmitt-Kōpplin b , Marianna Lucio b , Maria Gabriella Mascia a ,<br />
Massimiliano Valentini a , Sara Cozzolino a<br />
a Consiglio per la Ricerca e la Sperimentazione in Agricoltura - Centro di Ricerca per lo<br />
Studio delle Relazioni tra Pianta e Suolo; b Institut für Ökologische Chemie, Helmholtz<br />
Zent<strong>ru</strong>m.<br />
E-mail: francesco.alianiello@entecra.it<br />
1. Introduction<br />
Chemical and biochemical processes occurring to organic matter added to soil are still to be<br />
completely understood, and many doubts still exist on their chemical characteristics and<br />
general st<strong>ru</strong>cture.<br />
Experimental results obtained in field on this topic hardly can be generalised, since<br />
differences of soils, of the organic materials added to soil and of climate conditions provide<br />
heterogeneous results.<br />
A way to prevent difficulties in the investigation of stabilization and humification processes is<br />
to reduce the number of variables. So a laboratory experiment in controlled and continuous<br />
conditions of moisture and temperature was planned, where changes occurring to the<br />
chemical composition of the mixture of pure substances in soil were monitored<br />
2. Materials and methods<br />
4 pure compounds were added to two different soils and incubated for a year under controlled<br />
conditions of temperature and moisture (27°C, 2.5 pF). They were: lignin, cellulose, casein<br />
and tripalmitin. Lignin was chosen because it has been considered for long time the precursor<br />
of humic substances, while the others represent the most abundant classes of natural organic<br />
substances, i.e. proteins, carbohydrates and lipids.<br />
The material was added in a quantity to double soil’s organic C content. Sub-samples were<br />
collected immediately after mixing, after 3 weeks, 3 months, 6 months and 1 year.<br />
The organic matter of the samples has been characterised by determination of total organic<br />
carbon, total extractable carbon, humic plus fulvic acids and calculation of humification<br />
parameters. Soil microbial biomass was determined immediately after sampling.<br />
Organic matter of collected samples was extracted by NaOH plus Na 4 P 2 O 7 0.1M and analysed<br />
by CP-MAS 13 C NMR, isoelectric focusing and by Cyclotron Resonance Fourier Transform<br />
Ion Mass spectrometry (ICR-FT/MS) equipped with 12 Tesla superconducting magnet and an<br />
Apollo II electro spray source<br />
<strong>Vol</strong>. 2 Page - 15 -
15th IHSS Meeting- <strong>Vol</strong>. 2<br />
3. Results<br />
Total organic carbon decreased in all the treated soils, as expected, but differences were<br />
detected among the different mixtures. Casein seemed to be immediately mineralised: after 3<br />
weeks the content in organic C was almost the same as the one of the untreated soil. In the<br />
tripalmitin treated soil the organic C decreased within an year constantly. In the lignin treated<br />
soil the organic C content diminished very slowly, with almost the same trend as the soil<br />
untreated. Cellulose treated soil showed the highest decrease of organic C between 3 weeks<br />
and 3 months incubation.<br />
The general result of all the samples of the humification parameters shows an increase,<br />
although not perfectly linear, of degree of humification and humification rate, and a decrease<br />
of the humification index, indicating that that the incubation conditions are favourable to soil<br />
organic matter humification.<br />
At start only the lignin treated soil showed very high values of degree of humification and<br />
humification rate, and low values of humification index, signifying the chemical similarity of<br />
lignin to humic substances, but this result was changed after the first incubation times. After 3<br />
months the values of humification parameters started to show the humification progress again.<br />
IEF profiles demonstrate, in all the incubated samples, an increase of stabilization of the<br />
organic matter with incubation time.<br />
CP-MAS 13 C NMR data show that after 3 weeks the 13 C NMR spect<strong>ru</strong>m of cellulose treated<br />
soils is impossible to distinguish from the one of the untreated soil, demonstrating how<br />
cellulose is fast degraded. The same happens to the casein characteristics in the spect<strong>ru</strong>m of<br />
the relative treated soils.<br />
The characteristics of lignin, in the spectra of the lignin treated soils, after 1 year are still<br />
possible to be recognised. The spectra of tripalmitin treated soils show that a year is necessary<br />
for the compound to be mineralised or to be converted to compounds similar to those of the<br />
original composition of soil organic matter.<br />
In Fig. 1 the spectra of two matrices (lignin and casein) and their mixtures with a soil are<br />
shown, at incubation time 0, 3 weeks and 1 year.<br />
The ICR-FT/MS data were analyzed and visualized with different multivariate techniques in<br />
order to summarize the different chemical properties of the class objects. The spectra after the<br />
calibration were converted into CHONS compositions through the use of an in-house<br />
developed tool All the data were stored in a matrix and analyzed with two different<br />
<strong>Vol</strong>. 2 Page - 16 -
15th IHSS Meeting- <strong>Vol</strong>. 2<br />
techniques: principal component analysis (PCA) and partial least square analysis (PLS) with<br />
an Orthogonal Signal Correction (OSC) of the data. Particularly interesting was the score<br />
scatter plot (figure 2) of the first two components, in which the samples were grouped<br />
according to the different treatments: Casein, Cellulose, Control, Lignin and Tripalmitin. This<br />
plot revealed, within the different groups, a trajectory depending on the different time<br />
experiments (time effect). Moreover the group of Tripalmitin is completely isolated from the<br />
rest of observation exhibiting complete different chemical properties; instead the Casein and<br />
Cellulose groups manifest a strong homogeneity each other like the control and Lignin<br />
groups. These chemical affinities and the time effect were analyzed with the Van Krevelen<br />
diagram (figure 3). In the different plots were pointed out the various chemical spaces (CHO,<br />
CHOS, CHON, CHONS), which visually highlight specific cluster series of elementary<br />
compositions observed within nominal masses.<br />
Figure 1. Bottom to up: 13 C NMR spectra of matrix left, matrix+soil S at incubation time 0, 3<br />
weeks and 1 year; matrix at left is lignin, matrix at right is casein.<br />
Figure 2. PLS-OSC analysis: Score scatter plot with all the spectra. Observations are grouped<br />
according to the different class delaying similar chemical properties.<br />
<strong>Vol</strong>. 2 Page - 17 -
15th IHSS Meeting- <strong>Vol</strong>. 2<br />
Figure 3. In the top are pointed out the different number inherent of CHO, CHOS, CHON and CHONS for the<br />
different extracts. Van Krevelen diagram revealed the different chemical properties of the Time effect and the<br />
Lignin chemical characteristics.<br />
4. Conclusions<br />
The CP-MAS 13 C NMR results demonstrate that all the natural substances tend to be largely<br />
mineralised or to be converted to substances similar to those of the treated soil, excluded<br />
lignin which after an year incubation is still analytically recognisable in the soil. ICR-FT/MS<br />
shows that Casein increases N containing compounds, cellulose and tripalmitin increase the<br />
presence of small metabolites, while lignin shows a pattern similar to control. These results<br />
suggest a contribution of all the components to the soil organic matter dynamics.<br />
References<br />
Kögel-Knabner I (2002) The macromolecular organic composition of plant and microbial<br />
residues as inputs to soil organic matter. Soil Biol Biochem 34: 139-162.<br />
R. Rosselló-Mora, M. Lucio, A. Pena, J. Brito-Echeverría, A. López López, M. Valens-<br />
Vadell, M. Frommberger, J. Antón and P. Schmitt-Kopplin (2008): Metabolic evidence for<br />
biogeographic isolation of the extremophilic bacterium Salinibacter <strong>ru</strong>bber; Nature ISME<br />
Journal; 2:242-253.<br />
<strong>Vol</strong>. 2 Page - 18 -
15th IHSS Meeting- <strong>Vol</strong>. 2<br />
Microbial Carbon Turnover and Dynamics from Biochemically Diverse<br />
Microbial Groups in Temperate and Tropical Forest Soils<br />
Heather M. Throckmorton a , Jeffrey A. Bird b , William R. Horwath a , Mary K. Firestone c<br />
a Dept. Land, Air and Water Resources, UC, Davis, One Shields Ave., Davis, CA 95616,<br />
United States; b School of Earth and Environmental Sciences, Queens College CUNY, 65-30<br />
Kissena Blvd., Flushing, NY 11367, United States; c Dept. Environmental Policy and<br />
Management, UC, Berkeley, 137 Mulford Hall #3114, Berkeley, CA 94720, United States.<br />
E-mail: hthrockmorton@ucdavis.edu<br />
1. Introduction<br />
Microorganisms represent an important source of actively cycling carbon (C) in terrestrial<br />
ecosystems, yet little is known of the relative importance of microbial biochemistry as a<br />
factor influencing C stabilization across different microbial groups. This project utilized<br />
uniformly 13 C-labeled, biochemically diverse, non-living microbial residues as substrates in a<br />
reciprocal transplant experiment in Blodgett Forest (BF), a temperate forest in the Sierra<br />
Nevada, and Luquillo Forest (LF), a tropical forest in Puerto Rico to examine the stability of<br />
unique microbial biochemistries. These sites represent diverse ecosystems that are known to<br />
support substantially different microbial communities, and provide an excellent opportunity to<br />
look at the effects of climate, parent material, and microbial community on factors affecting<br />
humification processes.<br />
2. Materials and Methods<br />
Temperate and tropical microorganisms from four biochemically contrasting groups (fungi,<br />
actinomycetes, bacteria Ggram (+), and bacteria Ggram (-)) were isolated from BF and LF<br />
and grown in 99-atom-percent 13 C media. Enriched microorganisms were autoclaved and<br />
lyophilized lypholized and lysed microbial cells were added back to soil at both sites. Treated<br />
soils were excavated at 5 time points over a span of 3 years at BF and 2 years at LF. Soils<br />
were separated by ultrasonic/liquid density fractionation into light, aggregate-occluded, and<br />
mineral-associated fractions. Whole soils and fractions were analyzed for total C and 13 C<br />
using combustion gas chromatography-isotope ratio mass spectrometry (GC-IRMS). Soils<br />
treated with temperate fungi were analyzed using Curie point pyrolysis- gas chromatographymass<br />
spectrometry- isotope ratio mass spectrometry (Py-GC-MS-IRMS) to determine<br />
compound-specific turnover.<br />
3. Results and Discussion<br />
Microbial C dynamics differed substantially between the two sites, with microbial C levels<br />
stabilizing at 35% of input C after 12 months in BF, while in LF microbial C did not to begin<br />
<strong>Vol</strong>. 2 Page - 19 -
15th IHSS Meeting- <strong>Vol</strong>. 2<br />
to stabilize until about 16 months at less than 10% of initial input C. Average mean residence<br />
time (MRT) was 5.21±1.11 years in BF and 2.22±0.45 years for LF soils.<br />
Although microbial treatments did not differ in their relative partitioning among soil physical<br />
fractions, there was some evidence for slower overall decomposition of bacteria Gm+ and<br />
fungi relative to bacteria Gm- and actinomycetes; however, the effect was not substantial. In<br />
BF soils, there was a significant difference among microbial groups recovery in soils (Pp =<br />
0.0384), whereby more C derived from bacteria Ggram+ and fungi were recovered relative to<br />
bacteria Ggram-, while recovery of actinomycetes-C did not differ from any of the other<br />
groups (Ffig. 1).<br />
LSM Group<br />
50<br />
45<br />
40<br />
35<br />
30<br />
25<br />
AB<br />
A<br />
Actino Fungi Gram+ Gram-<br />
Figure 1. California (BF): least squares means for percent microbial C recovered in soils for<br />
microbial groups throughout the course of the study.<br />
For LF, there were also significant differences in microbial C recovery; however, in this case<br />
the origin (temperate vs. tropical) of the microbial group influenced whether this effect was<br />
significance. Results indicate that significantly more temperate fungi, temperate Ggram+,<br />
tropical actinomycetes, and tropical gram- were recovered relative to temperate bacteria<br />
Ggram-, and the remaining three groups (temperate actinomycetes, tropical fungi, and tropical<br />
Ggram+) did not differ from any of the other groups (Ffig. 2).<br />
A<br />
B<br />
25<br />
A<br />
A<br />
A<br />
20<br />
LSM group*origin<br />
15<br />
10<br />
AB<br />
B<br />
AB<br />
AB<br />
A<br />
5<br />
0<br />
Actino Fungi Gram+ Gram- Actino Fungi Gram+ Gram-<br />
Temperate<br />
Tropical<br />
<strong>Vol</strong>. 2 Page - 20 -
15th IHSS Meeting- <strong>Vol</strong>. 2<br />
Figure. 2. Puerto Rico (LF): least squares means for percent microbial C recovered in soils<br />
for microbial treatments (by microbial group*origin) throughout the course of the study.<br />
Physical fractionation of soils indicate that, despite the substantial difference in microbial C<br />
turnover between the two sites, microbial C turnover in the fraction occluded within<br />
aggregates and in the fraction associated with mineral surfaces did not differ between the two<br />
sites; the only physical fraction where microbial C turnover differed between the two sites<br />
was the light fraction, which is unassociated with the mineral matrix (Ffig. 3).<br />
20<br />
California<br />
Puerto Rico<br />
Input C Recovery (%)<br />
15<br />
10<br />
5<br />
0<br />
Light Fraction<br />
Occluded<br />
Fraction<br />
Mineral Fraction<br />
Figure 3. Plot of the least squares means for the site by fraction interaction.<br />
Pyrolysis- results indicated that there were differences in the turnover of different compound<br />
classes. Polysaccharide and protein biomarkers exhibit a rapid initial decline in enrichment,<br />
and begin to stabilize after the second mesocosm excavation for both sites. For California<br />
soils, proteins exhibit an increase in relative recovery of input microbial C from the third to<br />
fourth mesocosm excavation. For both sites, lipids were relatively stable throughout the<br />
course of the study, and for the tropical site exhibit an initial increase in enrichment from the<br />
input microbial C, which may be explained as microbial resynthesis of new compounds (figs.<br />
4a and 4b). These results agree with other studies that suggest that proteins and<br />
polysaccharides turnover rapidly, while lipids become relatively more prominent over time in<br />
microbial C cycling (Baldock et al, 1989, Hopkins et al, 1997).<br />
4. Conclusions<br />
There were substantial differences in microbial C dynamics between the two sites, with faster<br />
turnover in the tropical site. However, the only soil fraction where microbial C turnover<br />
differed between the two sites was the light fraction, while there was no difference between<br />
<strong>Vol</strong>. 2 Page - 21 -
15th IHSS Meeting- <strong>Vol</strong>. 2<br />
the occluded and mineral fractions. These results suggest that the effect of climate on<br />
microbial C turnover is limited to organic matter unassociated with the mineral matrix.<br />
Although there were no differences in the partitioning of microbial C among soil fractions,<br />
there were some differences in turnover among microbial treatments; however, the differences<br />
were not substantial.<br />
Pyrolysis results indicated that there are differences in the turnover of compound class<br />
biomarkers, which highlights the importance of examining these dynamics at the molecular<br />
level. Py-GC-MS-IRMS proves to be a valuable tool with the potential to follow the dynamics<br />
of specific compound classes in isotope tracer experiments.<br />
Acknowledgements<br />
This research was funded by the National Science Foundation.<br />
References<br />
Baldock JA, Oades JM, Vassallo AM, Wilson MA (1989) Incorporation of uniformly labeled<br />
13 C glucose carbon into the organic fraction of a soil - – carbon balance and CP MAS 13 C<br />
NMR Measurements. Australian Aus. Journal J. of Soil Research 27, 725–746.<br />
Hopkins, D.W., Chudek, J.A., Webster, E.A., Barraclough, D. Following the decomposition<br />
of ryegrass labeled with C-13 and N-15 in soil by solid-state nuclear magnetic resonance<br />
spectroscopy. Eur J Soil Sci 1997; 48: 623-31.<br />
<strong>Vol</strong>. 2 Page - 22 -
15th IHSS Meeting- <strong>Vol</strong>. 2<br />
Carbon Forms Change in Chernozems of the Trans-Uralian Region at Reserve<br />
Mode (at the Arcaim Reserve, Russia)<br />
Valentina Prikhodko a* , Elena Manakhova b , Dmitry Manakhov c<br />
a Institute of Physicochemical and Biological Problems in Soil Science of Russia Academy of<br />
Sciences, Pushchino, Russia, 142290, Email: valprikhodko@rambler.<strong>ru</strong>; b Soil Science Institute<br />
by V.V. Dokuchaev, Moscow, Russia, evmanakhova@yandex.<strong>ru</strong>; c Faculty of Soil Science,<br />
Moscow state University by M.V. Lomonosov, Moscow, Russia, Email: demian2@yandex.<strong>ru</strong><br />
1. Introduction<br />
Soil humus of the Reserve "Arkaim", located in Zaural plateau with elevations of 300-400 m<br />
a.s.l. of the Chelyabinsk Region, Russia was studied (52 o 40 'N, 59 o 34' E) (Fig. 1). It area is<br />
3761 ha, Reserve was established in 1992 for saving of the unique ancient city-fortress of<br />
3700 years age. Study of 4 soil catenas with 166 soil profiles were carried out before<br />
preservation in 1992 and in 2003, 2009. Climate of the region is characterized by continental<br />
feature. Diversity of the parent rocks are largely determined soil characteristics. They are<br />
follows: clay and loam of Neogene's and Quaternary ages, Mesozoic redeposited kaolinitic<br />
weathering c<strong>ru</strong>st and Paleocene eluvium of igneous rocks. Herb-stipa-fescue associations prevail<br />
among natural vegetation. Chernozems occupy 50% of the territory; they often have salinity<br />
and alkalinity due to properties of soil-forming rocks. Former pastures occupy 65% of the<br />
area, forest -1%. Soil plowing began in 1950's.<br />
2. Methods<br />
In soil samples the content and composition of humus - by Tyurin [5], catalase activity [3],<br />
light organic matter fractions with density
1 2 3 4 5 6 7 8 9 10 11 12 13 14 15 16 17 18<br />
1 2 3 4 5 6 7 8 9 1 0 1 1 1 2 1 3 1 4 1 5 1 6 1 7 1 8<br />
1 2 3 4 5 6 7 8 9 1 0 1 1 1 2 1 3 1 4 1 5 1 6 1 7 1 8<br />
1 2 3 4 5 6 7 8 9 1 0 1 1 1 2 1 3 1 4 1 5 1 6 1 7 1 8<br />
1 2 3 4 5 6 7 8 9 1 0 1 1 1 2 1 3 1 4 1 5 1 6 1 7 1 8<br />
3<br />
1 2 3 4 5 6 7 8 9 1 0 1 1 1 2 1 3 1 4 1 5 1 6 1 7 1 8<br />
1 2 3 4 5 6 7 8 9 1 0 1 1 1 2 1 3 1 4 1 5 1 6 1 7 1 8<br />
1 2 3 4 5 6 7 8 9 1 0 1 1 1 2 1 3 1 4 1 5 1 6 1 7 1 8<br />
1 2 3 4 5 6 7 8 9 10 11 12 13 14 15 16 17 18<br />
15th IHSS Meeting- <strong>Vol</strong>. 2<br />
in the horizon A. That is conditioned by proluvial humus accumulation and intensive humus<br />
formation at high productivity and better moistening of the hollows. The composition of organic<br />
% from soil mass A<br />
0,9<br />
0,6<br />
0,3<br />
HA1<br />
18<br />
12<br />
6<br />
% from C total B<br />
HA1<br />
0<br />
0<br />
0,6<br />
0,3<br />
FA1<br />
14<br />
7<br />
FA1<br />
0<br />
0<br />
1,2<br />
0,8<br />
HA2<br />
28<br />
21<br />
14<br />
HA2<br />
0,4<br />
7<br />
0<br />
0<br />
0,6<br />
FA2<br />
21<br />
FA2<br />
0,3<br />
14<br />
7<br />
0<br />
0<br />
5,4<br />
Organic mater<br />
2,8 Cha/Cfa<br />
3,6<br />
1,8<br />
1,4<br />
0,0<br />
C C al Cm C K Cm K<br />
1<br />
1 2 3 4<br />
0<br />
C C al Cm C K Cm K<br />
Fig. 1. <strong>Humus</strong> composition of soils before and after 12 years of preservation mode. A - % from soil mass, B - %<br />
from C total. 1, 4 -pasture soils before and after preservation; 2, 3 - plowed soils before and after preservation.<br />
Soils: C- chernozem, Cm - meadow-chernozemic, K – kaolinitic clay.<br />
matter was humic or fulvic-humic, humification degree and the content of HA2 was lower, the<br />
content of HA1 (30%) was higher relative to the chernozems. Among fulvic acids (FA) the first<br />
fraction dominates. These features testify about mobility of the humus substances.<br />
Soils on kaolinitic c<strong>ru</strong>sts. These soils’ development in the depth is limited by poor kaolinitic rock<br />
properties and low vegetation productivity. The chernozems derived from these deposits are usually<br />
<strong>Vol</strong>. 2 Page - 24 -
15th IHSS Meeting- <strong>Vol</strong>. 2<br />
low thick, weakly st<strong>ru</strong>ctured, have small carbonate quantity and lower value of CEC. The content of<br />
organic matter decreases quickly with the depth, its supply is small. The composition is humicfulvic<br />
or humic (С h. a. /С f. a. 1,3-2,2), humification degree in the horizon A is high (up to 40%),<br />
decreasing up to 23% along the soil profile. In humus composition of the chernozems on kaolinitic<br />
rocks as compared to the chernozems on loess loams the content of humic acids of the second<br />
fraction, connected with Ca is lower and the content of labile humic acids and fulvic acids is higher.<br />
This suggests about humus mobility in soils on kaolinitic c<strong>ru</strong>sts.<br />
The pasture soils differed from the arable analogues by rich humus content and its labile fraction<br />
(28-40% from the С total).<br />
Transformation of soil humus at preserved mode<br />
After 12-20-year of preservation regime in the former arable chernozems derived from all<br />
rocks st<strong>ru</strong>cture improved, the content of HA2 and FA2 in the upper layer increased. Organic<br />
matter increase after 18 years of reserve regime in chernozem is 0.4-0.95%, in the meadowchernozem<br />
soils - 0.2-0.55%, it is more in the soils of the former pastures, as compared with<br />
the ex-arable lands. In the composition of organic matter of the former arable chernozems<br />
labile fraction extracted 0,1 N solution of NaOH, grew up from 0,2-0,4% to 0,4-0,7% of soil<br />
mass or from 7-11% to 12 - 20% of C total. The carbon content of labile fraction more than<br />
0,3% is good for soil fertility [4]. Light fraction of organic matter of soils in preserve mode is<br />
0,6-2,2% C or 16-37% of C total. When the carbon content of light fraction is more than 25%<br />
soils have a satisfactory state [2]. Labile and light fractions of soil organic matter mainly<br />
determine the enzymatic activity, microbes function and loosening effect on the soil material.<br />
In the former pasture soils in the protected mode small changes were observed.<br />
Catalase activity. In soils of the former pasture catalase activity is higher than in the soils of<br />
the former arable land. Catalase promotes the processing of fresh organic matter. In the<br />
reserve habitat for plants and microorganisms has improved, plant productivity and supply of<br />
plant residues in soil increased. These lead to catalase activity enlarging. The high correlation<br />
coefficients (52-69%) between the total humus content and the level of catalase activity,<br />
content of light and labile fractions of organic matter were revealed.<br />
Soil respiration and microbial biomass after 20 years of protected mode<br />
The soils of the former pastures differ from the former arable soils of a greater magnitude of<br />
basal and heterotrophic respiration, higher content of microbial biomass (Fig. 2). Soils formed<br />
<strong>Vol</strong>. 2 Page - 25 -
15th IHSS Meeting- <strong>Vol</strong>. 2<br />
on kaolinitic weathering c<strong>ru</strong>st compared with soils on loess are characterized by lower values<br />
of CO 2 emissions, heterotrophic respiration and biomass of soil microorganisms.<br />
mkgC g-1 h<br />
1,4<br />
Basal soil respiration, СО 2<br />
mgC/100g<br />
1000<br />
Microbial biomass<br />
0,7<br />
500<br />
0<br />
C<br />
C*<br />
C K<br />
C K*<br />
Cm<br />
Cm*<br />
CmK<br />
CmK*<br />
F<br />
0<br />
C<br />
C*<br />
C K<br />
C K*<br />
Cm<br />
Cm*<br />
CmK<br />
CmK*<br />
F<br />
Fig. 2. Soil respiration and microbial biomass content after 18 years of preservation mode.<br />
F – forest soil, * former plowed soil, rest soils are former pasture. Rest marks is in Fig. 1.<br />
4. Conclusion<br />
Soil humus state before and after 12-20 years of protected mode in the Arcaim Reserve of<br />
Southern Urals, Russia was studied. Organic matter state of soils derived from different parent<br />
rocks was shown. Pasture soils differ from arable ones by rich of humus and its labile fraction.<br />
For 12-20 years of preservation mode in the former arable chernozems layers of litter and sod<br />
appeared, the content of humus, light and labile fractions of organic matter, catalase activity, soil<br />
respiration and microbial biomass increased. Soil transformation after anthropogenic loading<br />
elimination depends on the type, status, composition of parent rocks, previous use and age of<br />
sowing meadows. The Reserve soils requires more time for the rehabilitation to virgin condition.<br />
Acknowledgements<br />
We thank Japanese colleagues I. Kazuyuki, M. Kawahigashi and S. Sugihara for field research.<br />
This work was supported by grants RFBR 09-05-92106 - Jp-a<br />
References<br />
1. J.P.E Anderson and K.H.A. Domsch, Soil Biol. Biochem .J., 10 (1978) 215.<br />
2. N.F. Ganzhara, B.A. Borisov, R.F. Baibekov, Handbook on soil science, Agrokonsalt,<br />
Moscow, 2002, p. 302.<br />
3. 6. A.S. Galstyan, Enzymatic activity of soils of Armenia, Hayastan,Yerevan, 1974, p. 107.<br />
4. M. Kershens, Meaning of humus to the soil fertility and nitrogen cycle, Pochvovedenie J. (Soil<br />
Science), 10, (1992) 57.<br />
5. D.S. Orlov, L.A. Grishina, Handbook on humus chemistry. Moscow State. Univ. Press, Moscow,<br />
1981, p. 210.<br />
<strong>Vol</strong>. 2 Page - 26 -
15th IHSS Meeting- <strong>Vol</strong>. 2<br />
Temperature Sensitivity of Young and Old<br />
Soil Organic Matter Decomposition<br />
Nancy Burns a , Joanna Cloy a* , Mark Garnett b , Dave Reay a , Keith Smith a , Wilfred Otten c<br />
a School of GeoSciences, University of Edinburgh, UK; b NERC Radiocarbon Facility<br />
(Environment), East Kilbride, UK; c SIMBIOS, University of Abertay, UK<br />
E-mail: Joanna.Cloy@ed.ac.uk<br />
1. Introduction<br />
The effect of temperature on rates of soil respiration is critical to our understanding of the<br />
terrestrial carbon cycle and potential feedbacks to climate change. The relative temperature<br />
sensitivity of labile and recalcitrant soil organic matter (SOM) is still controversial, as<br />
different studies have produced contrasting results, indicating limited understanding of the<br />
underlying relationships between stabilization processes and temperature. Current global<br />
carbon cycle models still rely on the assumption that SOM pools with different decay rates<br />
have the same temperature response: small differences in temperature response between rate<br />
pools could lead to very different climate feedbacks. This study examined the temperature<br />
response of soil respiration and the age of soil carbon respired from radiocarbon dated bulk<br />
soils and SOM fractions.<br />
2. Materials and Methods<br />
Peaty gley soil samples were collected from Harwood Forest, Northumberland, UK. SOM<br />
fractions were isolated from organic layer material using high density flotation and ultrasonic<br />
disaggregation, designated as free (< 1.8 g cm -3 ), intra-aggregate (< 1.8 g cm -3 within<br />
aggregates > 1.8 g cm -3 ) and mineral-bound (> 1.8 g cm -3 ) organic material [1]. Bulk soils<br />
(organic (5-17 cm) and mineral (20-30 cm) layers) and SOM fractions were dated ( 14 C AMS),<br />
analyzed for chemical composition ( 13 C NMR, FTIR, CHN analysis), ∂ 13 C and δ 15 N (IRMS)<br />
and incubated in sealed vessels at 10 ºC and 30 ºC. Accumulated respired CO 2 samples were<br />
collected on zeolite molecular sieve cartridges and used for 14 C AMS dating [2]. In parallel,<br />
material from the same bulk soils and SOM fractions were incubated at 10ºC, 15ºC, 25ºC and<br />
30ºC for 6 months and sampled weekly for CO 2 flux measurements using GC<br />
chromatography.<br />
3. Results and Discussion<br />
Radiocarbon data for bulk soils and SOM fractions indicate that within the organic upper<br />
layer of soil, mineral-bound OM represents a slow-cycling or recalcitrant pool of SOM; intraaggregate<br />
OM is slightly less recalcitrant than mineral-bound OM, while free OM represents a<br />
<strong>Vol</strong>. 2 Page - 27 -
15th IHSS Meeting- <strong>Vol</strong>. 2<br />
fast-cycling, labile pool of SOM. Bulk soil from the mineral layer (20 – 30 cm) is much older<br />
than bulk soil from the organic layer and mineral-bound OM from the organic layer,<br />
suggesting the involvement of other stabilizing factors associated with depth besides mineral<br />
interactions. The link between age and recalcitrance is corroborated by measured CO 2 flux<br />
rates, which increase with decreasing age of fractions. The average ages of the soil/SOM<br />
respired CO 2 (at temperatures of 10 ºC and 30 ºC) were almost always found to be younger<br />
than the corresponding soils/SOM fractions, suggesting that microbes preferentially utilize<br />
young SOM during respiration. Results for the 14 C contents and calculated ages of the bulk<br />
soils and SOM fractions and their respired CO 2 at different temperatures will be discussed and<br />
compared with long-term trends in soil/SOM fraction CO 2 fluxes and their temperature<br />
sensitivity. Data on soil/SOM fraction chemical characteristics and ∂ 13 C values will also be<br />
presented.<br />
4. Conclusions<br />
Results indicated that the free SOM fractions are younger than intra-aggregate and mineralbound<br />
SOM fractions, which in turn, along with the shallow bulk soil material, are much<br />
younger than deep bulk soil material. These trends reflect the expected increase in soil age<br />
with depth and perhaps also stabilization of mineral-associated soil carbon. Also, the<br />
soil/SOM respired CO 2 is generally younger than the original incubated soil/SOM material,<br />
suggested that microbes preferentially utilize young sources of carbon during respiration.<br />
Overall, this investigation of the temperature response of young and old SOM respiration<br />
provides valuable information about SOM cycling and stabilization and allows us to gain a<br />
better understanding of the potential feedbacks to climate change associated with soil<br />
respiration.<br />
Acknowledgements<br />
N. Burns thanks the Scottish Alliance for Geoscience, Environment and Society for funding<br />
her PhD Studentship and the NERC Radiocarbon Facility for 14 C AMS analysis support.<br />
References<br />
1. S.P. Sohi, N. Mahieu, J.R.M. Arah, D.S. Powlson, B. Madari and J.L. Gaunt, Soil Sci. Soc.<br />
America J., 65 (2001) 1121.<br />
2. S.M.L. Hardie, M.H. Garnett, A.E. Fallick, A.P. Rowland and N.J. Ostle, Radiocarbon, 47<br />
(2005) 441.<br />
<strong>Vol</strong>. 2 Page - 28 -
15th IHSS Meeting- <strong>Vol</strong>. 2<br />
Factors influencing carbon stabilization processes in volcanic ash<br />
Anthrosols (Tenerife Island, Spain)<br />
Hernández, Z. a* , Almendros, G. a , Gómez Sal, A. b<br />
a<br />
Centro de Ciencias Medioambientales–CSIC, Serrano 115B, 28006, Madrid, Spain.<br />
b<br />
Department of Ecology, University of Alcalá, Alcalá de Henares, 28871,Madrid, Spain.<br />
Email: zulimar@ccma.csic.es<br />
1. Introduction<br />
There is a classical controversy concerning the mechanisms controlling the humification<br />
process in volcanic ash soils [1]. In general, it is considered that short-range silicates and<br />
amorphous oxides play an outstanding role in soil carbon stabilization. Nevertheless, despite<br />
the general agreement about the high potential for carbon sequestration in volcanic soils, the<br />
biogeochemical processes responsible for such an stabilization are not still completely<br />
understood. Whereas some authors have described a predominantly aromatic character of the<br />
humic acids (HAs) formed in allophane-containing soils, other authors have suggested that<br />
this aromaticity is but the effect of burning grass residues in the past (e.g. Miscanthus<br />
sinensis) [2], whereas the organic matter could be predominantly aliphatic as results of intense<br />
microbial activity in saturated anaerobic soil microcompartments, leading to the accumulation<br />
of alkyl, carbohydrate and protein-like constituents [3].<br />
Another topic of Andosols refers to the progressive loss of its andic properties after extensive<br />
agricultural management. In fact, several authors have suggested that cultivation could result<br />
into enhanced exposure to sunlight and rapid desiccation of the topsoil, which would favour<br />
crystallization of amorphous oxides (allophane or imogolite) into crystalline clay-type<br />
minerals [4]. However, the general occurrence of these phenomena should be carefully<br />
considered since these data have been reported for tropical environments with large<br />
precipitation (> 1,700 mm) and heavy dry season, which is not the case with Canary Islands,<br />
where there exists a constant moisture provided by the condensation of trade winds. In order<br />
to shed some light about the above processes in soils at Tenerife Island, a total of 30 HAs<br />
extracted from andic and non-andic soils were analyzed.<br />
2. Materials and methods<br />
The sampling sites were representative for different types of vineyards on volcanic materials,<br />
corresponding to: i) soils with andic character in the Northern side of the Island, ii) soils<br />
covered with a pumice bed in the Southern side of the Island, iii) clay soils in both sides of the<br />
<strong>Vol</strong>. 2 Page - 29 -
15th IHSS Meeting- <strong>Vol</strong>. 2<br />
Island, and, iv) soils on allochthonous volcanic materials that at the past were transported by<br />
farmers from the highlands to the coast, and traditionally referred to as sorribas.<br />
A set of physicochemical variables representing diagnostic criteria in volcanic soil<br />
classification systems [5] was analyzed, such as bulk density, organic carbon, amorphous<br />
minerals (Al o + 1 / 2 Fe o ), organo-mineral complexes (Al p /Al o ), pH, retention of P, and water<br />
holding capacity at atmospheric pressure and at 1500 kPa. The presence of crystalline<br />
minerals was analyzed by X-ray diffraction (XRD). Humic acids and extractable insolubilized<br />
humins (soil-matrix fixed HAs) were isolated by alkaline extraction; in the case of<br />
insolubilized humin treating the soil with 60 mM Na 2 S 2 O 4 and 1 M HF-HCl [6].<br />
The elementary composition (%C, %H and %N) of HAs was determined with a Carlo Erba<br />
EA1108 microanalyzer and the atomic H/C and O/C ratios were calculated. The optical<br />
density was measured at 465 nm (E4) and used to assess the maturity of organic matter<br />
whereas the second derivative of the visible spect<strong>ru</strong>m allowed measuring the concentration of<br />
fungal quinoid pigments [7]. Derivative infrared spectroscopy was used to identify the "lignin<br />
fingerprint" which is often characteristic in HAs from soils treated with recent inputs of<br />
manures and compost. 13 C nuclear magnetic resonance ( 13 C NMR) was used to assess the<br />
different carbon types (aromatic, aliphatic…) including the possible accumulation of black<br />
carbon. Analytical pyrolysis was carried out in a Pyrojector (SGE inst<strong>ru</strong>ments) connected to a<br />
GC/MS system Finnigan Trace GC Ultra with a Trace DSQ mass spectrometer. The<br />
identification of the individual compounds released by pyrolysis was carried out by i) single<br />
ion monitoring of different homologous series, ii) low resolution mass spectrometry and iii)<br />
comparison with published and stored data (NIST and Wiley libraries). With the data<br />
obtained, Principal Component Analysis (PCA) was used to identify possible biogeochemical<br />
processes in Anthrosols subjected to different agriculture practices.<br />
3. Results and discussion<br />
The st<strong>ru</strong>ctural differences between the HAs suggested that the origin of the variability of the<br />
soil organic matter could be explained by the differential contribution of two non-excluding<br />
processes, respectively i) selective preservation of plant and microbial biomacromolecules<br />
and ii) accumulation of condensed, aromatic HAs with high st<strong>ru</strong>ctural complexity (measured<br />
as the Shannon diversity index). In fact, a set of soils (mainly non-andic and developed on<br />
pumites) showed HAs with a typical lignin pattern reflected both by resolution-enhanced<br />
infrared spectroscopy and by the typical methoxyphenol pattern after analytical pyrolysis,<br />
suggesting a weakly condensed macromolecular st<strong>ru</strong>cture also evidenced by low optical<br />
<strong>Vol</strong>. 2 Page - 30 -
15th IHSS Meeting- <strong>Vol</strong>. 2<br />
density and comparatively small amounts of fungal quinoid pigments. Other set of soils, with<br />
a remarkable allophanic character showed HAs with large condensation and aromaticity (high<br />
optical density and fungal pigments), and pyrograms with methoxyl-lacking aromatic<br />
compounds, including high yields of carbohydrate-derived and nitrogen compounds.<br />
As a whole, the results suggested that allophanic soils accumulated comparatively high<br />
amount of soil organic carbon, with HAs of a large degree of aromaticity and st<strong>ru</strong>ctural<br />
condensation. However, it is worthy to mention that the most aromatic HAs did not occur just<br />
in allophanic soils, but in clay soils subjected to liming and probably affected by burnings in<br />
the past (Fig. 1).<br />
Figure 1. Graphical representation of the atomic H/C and O/C ratios (van Krevelen’s diagram)<br />
of HAs from Anthrosols subjected to different agriculture practices. The data are plotted on a<br />
contour diagram of distribution and frequencies showing the natural variability of these<br />
atomic ratios in soil HAs.<br />
The results obtained evidenced that the influence of agricultural management, which included<br />
inputs of transported allophanic materials in the past, have exerted a significant enhancement<br />
in organo-mineral complexes. This interaction is reflected in the performance of both soil<br />
carbon sequestration and soil agroecological quality. On the opposite hand, based on the<br />
difference between the mineralogical and the organic composition in the Anthrosols studied,<br />
we suggested that the weak humification processes observed in soils with a pumice bed, is<br />
due to the lack of reactive colloidal mineral, indispensable for the formation of the soil<br />
reactive matrix, while the periodic application of raw organic amendments favours the rapid<br />
mineralization of organic matter in these sandy soils, precluding the formation of humic<br />
substances.<br />
<strong>Vol</strong>. 2 Page - 31 -
15th IHSS Meeting- <strong>Vol</strong>. 2<br />
4. Conclusions<br />
In the volcanic soils under study, carbon stabilization is not only controlled by strong mineral<br />
interactions in part conditioned by volcanic ash transported to Anthrosols but also by intense<br />
perturbations associated to soil management practices including periodic input of manures<br />
and grass residues, and the effect of fire in the past. This suggest the possibility to control the<br />
humification processes by the farmer action, which—in the study zone—may represent the<br />
major source of variability on soil organic matter characteristics, with a stronger effect than<br />
that expected from the natural soil-forming factors.<br />
References<br />
1. R.A. Dahlgren, M. Saigusa and F.C. Ugolini, Adv. Agron., 82 (2004) 113–182.<br />
2. H. Shindo, Y. Matsui and T. Higashi, Soil Sci., 141 (1986) 84–87.<br />
3. P. Buurman, F. Peterse and G. Almendros, Eur. J. Soil Sci., 58 (2007) 1330–1347.<br />
4. R.L. Parfitt and A.D. Wilson, Catena Suppl., 7 (1985) 1–8.<br />
5. USDA. Keys to Soil Taxonomy, Soil Survey Staff, Virginia, USA, 2006, p. 333.<br />
6. B. Dabin, Sci. Sol, 1 (1971) 47–63.<br />
7. G. Almendros and J. Sanz, Geoderma, 53 (1992) 79–95.<br />
<strong>Vol</strong>. 2 Page - 32 -
15th IHSS Meeting- <strong>Vol</strong>. 2<br />
Research Theme 2: Plant molecular st<strong>ru</strong>ctures as drivers of C<br />
stabilisation in soils<br />
<strong>Vol</strong>. 2 Page - 33 -
15th IHSS Meeting- <strong>Vol</strong>. 2<br />
<strong>Humus</strong> of West-Siberian Soils as Influenced by Human Impact<br />
Boris Klenov<br />
Institute of Soil Science and Agrochemistry of SB RAS, Sovietskaya St 18, 630099<br />
Novosibirsk, Russia<br />
E-mail: klenov@issa.nsc.<strong>ru</strong><br />
1. Introduction<br />
At present it is well known that any man-made impact such as soil ploughing up, irrigation,<br />
drainage, forest fires, industrial emissions etc. alters the soil not only as a physical habitat of<br />
living organisms but also its organic constituent, in particular. In different parts of Western<br />
Siberia the soil cover is simultaneously subject to one or more of the above-mentioned<br />
factors. Long-term ploughing along with irrigation, to some extent, seems to be studied here<br />
more thoroughly as a factor influencing on soil organic matter as a whole. Specifically, the<br />
given paper deals with the change of principal characteristics of humus and humic acids<br />
(HA), in particular, as influenced by long-term ploughing and irrigation.<br />
2. Materials and Methods<br />
In Western Siberia old-arable lands amount to one tenth of its area, the major part of plough<br />
lands (at about 80%) is situated in the forest steppe and dry steppe belts. Comparativegeographic<br />
and comparative-analytical approaches served as a basis for studies in question.<br />
The principal automorphic soils under study develop under contrasting conditions of northasian<br />
ecosystems (Table 1). All the soils have been using in agriculture at about one century,<br />
except the chestnut one which has been using at about 25 years. It should be taken into<br />
account the irregular and non-system application of fertilizers in the course of agricultural<br />
history; hence, it can not be assessed the influence of some definite impact. Only general<br />
picture of humus state as a result of long-term soil agricultural use can be done with regard to<br />
the changes which took place in humus supply and nature of principal humus constituents,<br />
such as HA or fulvic acids (FA). HA have been taken into consideration as a prevailing part<br />
and as the most sustainable in chemical and ecological respect constituents of humus of these<br />
soils as it was shown earlier (1). The data were carried out by generally accepted procedures<br />
described elsewhere (2).<br />
3. Results and Discussion<br />
By the example of altitudinal soil sequence of Western Siberia one should note that by present<br />
time in arable lands where humus retained in considerably lesser amounts in arable lands as<br />
<strong>Vol</strong>. 2 Page - 34 -
15th IHSS Meeting- <strong>Vol</strong>. 2<br />
compared to virgin ones, the same geographical relationships of humus accumulation can be<br />
observed. Therefore, losses of humus as well as its supply increase from Albeluvisols (soils of<br />
Podzol type) to Albic Luvisols (soils of Grey forest type) and then to Luvic Chernozem (soils<br />
of Chernozem type), later, in Kastanozems/Calcisols (steppe chestnut soils), humus losses<br />
decrease (Table 1). From response of these soils to ploughing and their subsequent utilization<br />
one should expect to note that chernozems are the least ecologically resistant soils. It<br />
contradicts to generally accepted conceptions as concerns these soils. In reality, there is no<br />
contradiction, if to take into account the fact that in chernozems more than half of humus<br />
losses arise from erosion processes. As for the soils under irrigation, here the losses at the<br />
expense of irrigation erosion are especially revealed.<br />
Soil, location<br />
Epigenic<br />
Albeluvisols,<br />
taiga (soils<br />
of Podzol type)<br />
Albic Luvisols,<br />
forest steppe<br />
(soils of Grey<br />
forest type)<br />
Luvic Chernozem,<br />
forest steppe<br />
(leached<br />
chernozems)<br />
Luvic<br />
Chernozem,<br />
steppe<br />
(ordinary<br />
chernozems)<br />
Kastanozem/<br />
Calcisols, steppe<br />
(chestnut<br />
soil)<br />
Table 1. Some characteristics of humus and humic acids<br />
<strong>Humus</strong>,<br />
t per ha<br />
in 1 m<br />
layer<br />
147.6<br />
135.9<br />
215.9<br />
186.8<br />
395.7<br />
308.6<br />
(265.2*)<br />
370.5<br />
280.9<br />
177.8<br />
168.5<br />
(158.2*)<br />
Losses of<br />
humus, %<br />
of total<br />
content, %<br />
8 1.7<br />
1.3<br />
14 1.9<br />
1.4<br />
22<br />
(33*)<br />
HA/FA<br />
2.4<br />
1.7<br />
(1.5*)<br />
24 2.2<br />
5.2<br />
(11.1*)<br />
1.8<br />
1.8<br />
1.4<br />
(1.2*)<br />
CEC,<br />
cmol c /kg<br />
HA<br />
340<br />
300<br />
430<br />
380<br />
490<br />
440<br />
(410*)<br />
500<br />
450<br />
470<br />
420<br />
(400*)<br />
Decrease<br />
in CEC,<br />
%,<br />
Some indices of HA<br />
12 39<br />
24<br />
12 37<br />
28<br />
11<br />
(16*)<br />
С of hydro-<br />
lyzate,% of<br />
total mass<br />
of HA %<br />
32<br />
24<br />
(17*)<br />
10 33<br />
11<br />
(15*)<br />
24<br />
25<br />
25<br />
(20*)<br />
DA,<br />
23<br />
28<br />
20<br />
31<br />
%<br />
29<br />
39<br />
(39*)<br />
27<br />
36<br />
25<br />
35<br />
(35*)<br />
Note: above line – virgin land, below line – plough land, * - under influence of 13-year<br />
irrigation<br />
С/N<br />
16.1<br />
20.9<br />
17.7<br />
21.8<br />
16.9<br />
22.8<br />
(24.2*)<br />
16.5<br />
23.0<br />
17.3<br />
21.3<br />
(23.1*)<br />
<strong>Vol</strong>. 2 Page - 35 -
15th IHSS Meeting- <strong>Vol</strong>. 2<br />
In the course of long-term soil use the essential changes happened not only in humus supply<br />
but also in qualitative composition of humus. In particular, decrease in soil genetic index like<br />
HA/FA ratio (by carbon) is as a witness of deterioration of the system of humic substances as<br />
a whole. The most noticeable changes occurred in soils of chernozem type where humate<br />
humus (HA/FA more than 2) turned into fulvate-humate (HA/FA 1-2). In the remaining soil<br />
types this index showed a decrease also by doing so the deterioration of humus quality,<br />
although its qualitative composition is left within the limits of fulvate-humate type.<br />
Organic soil constituent is known to play a c<strong>ru</strong>cial role in soil cation exchange capacity<br />
(CEC). By the example of soil latitudinal sequence of Western Siberia it was shown that<br />
carboxylic groups of HA and FA determined as much as 50-65% of total soil CEC (3). During<br />
the whole agricultural history CEC was reduced approximately by 25%, it is completely<br />
consistent with decrease in humus supply. Furthermore, it should be noted that a half of<br />
general soil CEC decrease takes place at the expense of HA and FA.<br />
The change of CEC under influence of man-made impact more clearly can be studied by the<br />
example of HA rather than FA. The latter as the compounds well soluble and mobile in wide<br />
range of soil pH seem to be capable to rapid renewal of peripheral groups so that scarcely can<br />
be reliable indicator of man-made impact on soil humus.<br />
The data on the change of HA CEC under conditions of man-made impact are few in number<br />
in the world literature and for soils of Western Siberia they are not available in general. The<br />
data presented in Table 1 do not permit to note clearly pronounced change of HA CEC<br />
depending on soil type and duration of agricultural activity. At the same time it can be noted<br />
that long-term farming leads to the conclusion that HA lose approximately one tenth part of<br />
CEC independently on soil type, For sustainable part of soil organic matter, i.e. HA, this loss<br />
is perceptible because carboxylic groups are st<strong>ru</strong>ctural elements of HA molecule. Convincing<br />
evidence of interdependency between chemical and ecological activity of HA is their response<br />
to hydrolysis by mineral acids (sulphuric acid as a <strong>ru</strong>le). This simple and at the same time<br />
informative procedure (4) shows that the yield of C and N in hydrolyzate enriched by<br />
functional groups at the expense of proteins and carbohydrates is dependent first of all on<br />
bioclimatic situation. For example, HA of soils of Podzol type formed under humid<br />
conditions are more hydrolyzable than HA of soils of arid areas (chernozems, chestnut soils).<br />
Hydrolyzate which is assessed by content of C seems to include the substances with<br />
developed aliphatic chains, i.e. less sustainable part of HA. The residuum permits nominally<br />
to judge about chemical and apparently ecological sustainability of HA. As it is illustrated by<br />
<strong>Vol</strong>. 2 Page - 36 -
15th IHSS Meeting- <strong>Vol</strong>. 2<br />
obtained data, the decrease in CEC of HA of arable lands is accompanied, as a <strong>ru</strong>le, by<br />
decrease in yield of hydrolyzable C and increase in yield of residual C. In this connection a<br />
tendency is also observed towards interdependency between CEC and degree of aromaticity<br />
(DA). It is worthy to notice the fact of increase in DA and decrease in CEC in HA of arable<br />
lands as compared to those of virgin lands. Along with this, it should be noted that data on<br />
hydrolysis can be served to some extent as a complementary index for estimation of degree of<br />
man-made impact on HA nature. Based on comparison of HA C:N ratios in virgin and arable<br />
soils one can suppose that long-term farming leads to losses of nitrogen from HA, most likely<br />
aliphatic. Moreover, even rather short-term irrigation is apparently stronger dest<strong>ru</strong>ctive agent<br />
of HA than long-term use of soil as a plough land.<br />
4. Conclusions<br />
Long-term use of soil as a plough lands leads not only to essential losses of humus but also to<br />
deterioration of its quality. Along with these phenomena, the changes are even revealed in the<br />
nature of the most sustainable constituent of humus, i.e. HA. The increase in values of DA<br />
and C:N is as a reliable indicator of weakening of ecological function of HA as biologically<br />
active substances. Such characteristics of HA can be served as a complementary information<br />
in working out the measures to maintain soil fertility.<br />
References<br />
1. Klenov B.M., <strong>Humus</strong> Sustainability of Automorphic Soils of Western Siberia, SB RAS<br />
Publisher, Novosibirsk, 2000, 176 p. (In Russian).<br />
2. Orlov D.S., Grishina L.A., Practical Work on <strong>Humus</strong> Chemistry, Moscow State<br />
University Publisher, Moscow, 1981, 272 p. (In Russian).<br />
3. Klenov B.M., Change of Cation Exchange Capacity of Arable Chernozems of Western<br />
Siberia,. Proc. Siber. Geod. Academy, 9 (2004), 217–219. (In Russian).<br />
4. Rydalevskaya M.D., ITereshenkova A., On knowledge of Nitrogenous Compounds of<br />
Humic Acids, Proc. Leningrad University, Biology, 42, 221 (1956), 131–140 (In<br />
Russian).<br />
<strong>Vol</strong>. 2 Page - 37 -
15th IHSS Meeting- <strong>Vol</strong>. 2<br />
Prediction of Soil Organic Carbon Stock on Arable Soils<br />
Gabriela Barančíková a , Martina Nováková b , Zuzana Tarasovičová b , Štefan Koco a , Ján Halás a ,<br />
Rastislav Skalský b , Jarmila Makovníková c<br />
a Soil Science and Conservation Reseach Institute Bratislava, Regional station Prešov,<br />
Raymannova 1, 08001 Prešov, Slovakia; b Soil Science and Conservation Reseach Institute<br />
Bratislava,Gagarinova 10, 827 13 Bratislava, Slovakia; c Soil Science and Conservation<br />
Reseach Institute Bratislava, Regional station Banská Bystrica, Mládežnícka 36, 97404<br />
Banská Bystrica, Slovakia<br />
E-mail: g.barancikova@vupop.sk<br />
1. Introducion<br />
Soil organic matter presents a major pool of carbon in the biosphere and can act both as a<br />
source and a sink for carbon and other greenhouse gases. In present time as a consequence of<br />
climate changes and rapid changes in land use and land management is very important task<br />
prediction of soil organic carbon stock in upcoming time period. Prediction of SOC on the<br />
basis application of RothC 26.3 model on Slovak agricultural land is a main goal of project:<br />
Modelling of estimation and prediction of soil organic carbon stock. In this paper changes of<br />
SOC stock according two different climate scenarios and optimal or base <strong>ru</strong>n management<br />
scenario on arable soils of two different regions in time scale 1970–2100 are shown.<br />
2. Materials and methods<br />
For modeling of SOC stock Slovak agricultural land was delimited on regular 10 × 10 km<br />
grids. We selected two grid cells for simulations. Selected grid cell 1 is situated in south part<br />
and grid 2 in northeast part of Slovakia. These grids cells are characterized by set of<br />
meteorological, soil and land management data. Source for climate scenarios (2000–2100) are<br />
up-to-data Canadian atmospheric and ocean model CGCM 3.1. Climate scenario A assumed<br />
higher grow-up and climate scenario B lower grow of temperature (Lapin at.al, 2006). Soil<br />
management data for base <strong>ru</strong>n (BR) scenario represent actual data of plant residues and<br />
manure carbon input receiving for period 1970–2000 and using for all modelling period<br />
(1970-2100). Optimal soil management data for modelling scale (2000–2100) are calculated<br />
according PEDOP model (Vilček et Torma, 2004).<br />
3. Results and discussion<br />
Comparison of climate and land management changes effect on soil organic carbon stock<br />
shows, that carbon input has more important role as climate data. On both investigated grid<br />
cells modeling data of RothC model show different development of SOC stock according<br />
base <strong>ru</strong>n and optimal land management scenario. According optimal soil management higher<br />
<strong>Vol</strong>. 2 Page - 38 -
15th IHSS Meeting- <strong>Vol</strong>. 2<br />
input of organic carbon in contrast to BR management evocates gradual increase SOC stock<br />
Low input of organic carbon in base <strong>ru</strong>n management in combinations with increase<br />
temperature is reason of continuing decrease of SOC stock. Modeling data of SOC stock of<br />
both soil management scenarios are higher at climate scenario with lower grow-up<br />
temperature (climate scenario B).<br />
60<br />
SOC (t/ha)<br />
50<br />
40<br />
30<br />
20<br />
10<br />
0<br />
clim.scen. A BR<br />
clim.scen. B BR<br />
clim.scen. A optimal<br />
clim.scen. B optimal<br />
1970<br />
1982<br />
1994<br />
2006<br />
2018<br />
2030<br />
2042<br />
2054<br />
2066<br />
2078<br />
2090<br />
Figure1. Modeling data of SOC stock according two climate and management scenarios on soil grid I<br />
60<br />
SOC (t.ha)<br />
50<br />
40<br />
30<br />
20<br />
10<br />
0<br />
clim.scen. A BR<br />
clim.scen. B BR<br />
clim.scen. A optimal<br />
clim.scen. B optimal<br />
1970<br />
1982<br />
1994<br />
2006<br />
2018<br />
2030<br />
2042<br />
2054<br />
2066<br />
2078<br />
2090<br />
Figure 2. Modeling data of SOC stock according two climate and management scenarios on soil grid II.<br />
4. Conclusion<br />
Received data show that land management and climate changes can substantial influence of<br />
soil organic carbon stock on arable land. Low input of organic carbon of plant residues and<br />
manure and also increase temperature can be reason of gradual decrease of SOC stock on<br />
arable land.<br />
Acknowledgements<br />
This work was supported by the Slovak Research and Development Agency under the contract<br />
No. APVV-0333-06.<br />
References<br />
M. Lapin, I. Damborská, M. Melo, M.Vojtek and M. Martini, Acta Meteorologica<br />
Universitatis Comenianae, XXXIV, (2006), 35.<br />
J. Vilček,.and S. Torma, Prírodné vedy a IKT - supplementum roč. VIIL, Acta facultatis<br />
studio<strong>ru</strong>m humanitatis et naturae Universitatis Prešoviensis, Prešov (2004), 83.<br />
<strong>Vol</strong>. 2 Page - 39 -
15th IHSS Meeting- <strong>Vol</strong>. 2<br />
Formation of humus-mineral compounds by surface polymerization of low<br />
molecular weight precursors<br />
Anna Zavarzina a* , Vladimir Demin b<br />
a Faculty of Soil Science, Moscow State University, 119991 Moscow, Russia; b Institute of<br />
Ecological Soil Science, 119991, Moscow, Russia<br />
E-mail: zavarzina@mail.<strong>ru</strong><br />
1. Introduction<br />
Adsorption complexes of humic substances with soil minerals comprise the bulk of stable<br />
organic matter in humus horizons of cold and temperate soils. A considerable fraction of<br />
mineral-bound organic matter is represented by high molecular weight (50–100 kDa) humic<br />
polymers. The concept of sorptive preservation [1] cannot explain the origin of such polymers<br />
on mineral surfaces, because their migration to adsorption sites should be limited by low<br />
solubility. It can be suggested that humic-mineral compounds are formed in situ in mineral<br />
soil horizons. A possible mechanism is heterophase polymerization of low molecular weight<br />
(and thus soluble) precursor material in presence of catalytically active solid phases [2]. Here<br />
we present experimental data supporting possibility of low molecular weight precursors<br />
polymerization directly on mineral surface and provide an evidence for the key role of<br />
immobilized phenol oxidase in accelerating this process.<br />
2. Materials and Methods<br />
Kaolinite-hydroxyaluminum complex was prepared at a level of coatings 2.5 mmol Al/g clay<br />
according to [3]. Precursor mixture solution (2 mg mL -1 ) contained gallic, caffeic, fe<strong>ru</strong>lic,<br />
hydroxybenzoic and vanillic acids at a concentration of 500 µg mL -1 each, 250 µg mL -1<br />
tryptophan and 250 µg mL -1 tyrosin in 50 mM Na-acetate buffer (pH 4.5, buffer A). 1 mL of<br />
precursor solution was added to 10 mg of the mineral and the mixture was agitated for 15<br />
min. Then, the mixture was centrifuged, the supernatant with unbound monomers was<br />
removed and 2 µg of fungal laccase (activity 0.102 µg -1 min -1 ) in 1 mL of buffer A was added<br />
to the pellet. After 30 min of periodic ajitation (100% laccase immobilization was achieved)<br />
the supernatants were replaced by 0.5 mL of fresh buffer A and organic-mineral complex with<br />
immobilized enzyme was incubated at room temperature in the dark for 72 hours without<br />
agitation. Mixtures without laccase were used as abiotic controls. The precursor concentration<br />
was analyzed by gradient HPLC with variable wavelength detector; Zorbax 300Extend-C18<br />
column was used and H 2 O-acetonitrile-3ftoracetic acid mixture served as an eluent. The<br />
<strong>Vol</strong>. 2 Page - 40 -
15th IHSS Meeting- <strong>Vol</strong>. 2<br />
alkali-extractable reaction products were analyzed on TSK 2000SW column (Tosoh<br />
Biosciences) using 1100 HPLC system with diode-array detector (Agilent Technologies). 0.1<br />
M Na-phosphate buffer with 0.1% SDS (pH 7.0) was used as an eluent.<br />
3. Results and Discussion<br />
On the basis of preceding adsorption experiments, the concentration of precursor solution was<br />
selected so as to achieve maximal adsorption of monomers and multilayer formation. No<br />
polymerization in the bulk of the reaction mixture occurred during 15 min adsorption period<br />
as revealed by HPLC analysis of supernatants. The total amount of monomers adsorbed per<br />
10 mg of the mineral was 93.9 µg (632.9 µmol). The amount of individual compounds<br />
adsorbed was the following (µg): tyrosin (5.63) < triptophane (6.13) < fe<strong>ru</strong>lic acid(9.41) <<br />
vanillic acid(10.31) < hydroxybenzoic acid(13.36) < caffeic acid (22.84) < gallic acid(26.20).<br />
Laccase have lost about 50% of its initial activity upon immobilization.<br />
During reaction period initially white hydroxyaluminum-kaolinite became progressively<br />
brown in color due to oxidation of adsorbed phenolic compounds by laccase. After 72 hours<br />
of incubation high molecular weight (>70 kDa) humic-like polymers were formed on the<br />
mineral surface. Their absorption spect<strong>ru</strong>m in the region of 220–600 nm resembled natural<br />
humates. Humic-like compounds were similar to that obtained in earlier work [4] when<br />
opposite order of adsorption of reaction components on hydroxyaluminum-kaolinite was<br />
applied (first laccase was immobilized, then precursors were added to the mineral). No<br />
polymer formation was observed in abiotic controls.<br />
4. Conclusions<br />
High molecular weight humates can be formed by surface polymerization in presence of<br />
laccase. The order by which phenol oxidase and humus precursors are adsorbed on the<br />
mineral surface do not affect the resulting molecular weight of the product.<br />
Acknowledgements<br />
The work was supported by RFBR 09-04-00570 and by Programme 15 of Presidium RAS.<br />
References<br />
1. G.Guggenberger, K.Kaiser, Geoderma, 113 (2003), p.293.<br />
2. A.G.Zavarzina, in A.Varma, G.Shukla (Eds.), Soil Enzymes, Springer-Verlag, Germany,<br />
Chapter 3, in press.<br />
3. A.Naidja, J. Mol. Cat. A: Chemical, 115 (1997), p.305-316.<br />
4. A.G.Zavarzina, Eurasian Soil Sci., 39 (2006), p.48-53.<br />
<strong>Vol</strong>. 2 Page - 41 -
15th IHSS Meeting- <strong>Vol</strong>. 2<br />
Assessment of Soil Organic Matter Stability After Low Temperature Ashing<br />
by DRIFT Spectroscopy<br />
Piedra Buena, A. a *, Almendros, G. a , Pucci, A. b , Tinoco, P. a , D’Acqui, L.P. b<br />
a Centro de Ciencias Medioambientales-CSIC, Serrano 115B 28006 Madrid, Spain; b Istituto<br />
per lo Studio degli Ecosistemi-CNR, via Madonna del Piano 10, Sesto Fiorentino, Italy<br />
E-mail: soilmanage@gmail.com<br />
1. Introduction<br />
Soil aggregate stability is assumed to play a key role on soil organic matter (SOM) resistance<br />
to degradation, related to the restricted access to the encapsulated SOM against decomposer<br />
microorganisms, and to the reduced diffusion of hydrolytic enzymes [1,2]. Assessing the<br />
actual degree of this physical protection by soil aggregates is sometimes difficult using<br />
conventional analytical methods, which in general involve grinding or collapse of aggregates<br />
on wetting. However, Low Temperature Ashing (LTA) using oxygen plasma allows studying<br />
changes in SOM without mechanical dis<strong>ru</strong>ption of soil aggregates [3]. This technique consists<br />
of a controlled progressive oxidation of the SOM within undisturbed aggregates using “cold<br />
plasma” (25–130 ºC). In this work, soil aggregates were subjected to LTA and SOM fractions<br />
distribution was studied. The objective was to assess the resistance of these fractions to<br />
degradation and its possible relation to the physical protection exerted by soil aggregates.<br />
2. Material and Methods<br />
2.1. Experimental design. Six ecosystems representative of the seminatural and final status of<br />
forest soils from the mountain area of Madrid (Spain) were selected. The soil samples were<br />
labeled as: C1, evergreen oak forest (Quercus ilex); C2, the cleared evergreen oak forest used<br />
for cereal cultivation; B3, evergreen oak forest (Q. ilex); B4, the degraded evergreen oak<br />
forest, with bush vegetation (Cistus ladanifer); R1, evergreen oak forest (Q. ilex), and R2, the<br />
cleared evergreen oak forest, reforested with pine (Pinus pinea).<br />
2.2. Low Temperature Ashing treatment. Undisturbed aggregates (0.5–1 mm size) were<br />
obtained from soil samples by gentle sieving and 2 g subsamples were subjected to LTA<br />
application for 24 h, using an equipment assembled according to D’Acqui et al. [4]. The<br />
subsamples were placed in a 2-L quartz reactor, which was evacuated to -0.1 kPa. The<br />
external electrode was power-supplied using a radiofrequency (RF) generator (13.56 MHz<br />
Advance Energy), and RF glow discharges were carried out in the reactor. The oxygen flow<br />
rate in the asher was set to 20 mL min -1 , and the power input of the RF level was set at 100 W<br />
<strong>Vol</strong>. 2 Page - 42 -
15th IHSS Meeting- <strong>Vol</strong>. 2<br />
(maximum reflected power 5 W) to generate a stream of excited oxygen. Five 2 g-replications<br />
were made to obtain up to 10 g per sample. The LTA-treated soil samples were compared<br />
with a “control” set, not subjected to LTA treatment.<br />
2.3. Chemical fractionation of soil organic matter. Quantitative determination of the SOM<br />
was based on classical procedures [5,6]. The particulate fraction (free organic matter, FOM)<br />
was separated by flotation in 2 M H 3 PO 4 (density 1.25 g cm -3 ). The yellowish supernatant<br />
solution after the density fractionation corresponds to fulvic acids dissolved by H 3 PO 4 (FFA).<br />
The heavy fraction remaining after centrifugation was washed with distilled water and<br />
extracted by shaking with 0.1 M Na 4 P 2 O 7 followed by 0.1 M NaOH for 3 h (× 5 times). The<br />
dark brown extract obtained corresponded to the total humic extract (THE), consisting of<br />
humic acids (HA) and fulvic acids (FA). Two aliquots were taken from this extract: one was<br />
used for determining the THE, and the other one was precipitated with H 2 SO 4 (1:1 by vol.) for<br />
determining HA, which consists of the fraction insoluble at acid pH. The concentration of FA<br />
was calculated by difference between THE and HA. Soil residue after alkaline extraction<br />
corresponds to total humin. Oxidizable C content in each fraction was determined by wet<br />
oxidation [7].<br />
3. Results and Discussion<br />
3.1. Soil organic matter fractions. Figures 1 and 2 show the results of SOM fractionation and<br />
determination of the organic C content in samples from the seminatural (B3, C1, R1) and<br />
perturbed (B4, C2, R2) soils subjected, or not, to LTA treatment. As expected, LTA decreased<br />
total SOM in all soils under study (Fig. 1A), but the extent of this effect depended on the soil<br />
type and the SOM fraction, suggesting causal relationships between SOM stability and the<br />
resistance to oxidative processes and/or physical protection of its different fractions.<br />
The LTA-induced degradation was high in soils R1, R2 (seminatural oak forest and<br />
reforestation with pine, respectively), possibly related to their coarse texture, which means<br />
less stable aggregates (Fig. 1A).<br />
Concerning the changes in the relative amounts of the different SOM fractions (Figs. 1B and<br />
2), the effect of the LTA treatment produced a drastic overall reduction of FOM content,<br />
whereas changes in the amounts of the other fractions were highly variable. The LTA<br />
treatment reduced the relative content of the more recalcitrant fractions (HA and humin) on<br />
soils C2 and R1, whereas the more labile fractions (FOM, FFA and FA) were reduced in soils<br />
B3, B4 and R2. An associated increase in the relative amount of FA in C2 and R1, and of HA<br />
<strong>Vol</strong>. 2 Page - 43 -
15th IHSS Meeting- <strong>Vol</strong>. 2<br />
and humin in soils B3, B4 and R2 was observed. Soil C1 showed only slight changes in the<br />
relative amounts of the different SOM fractions.<br />
A<br />
g C 100 g soil -1<br />
8.0<br />
7.0<br />
6.0<br />
5.0<br />
4.0<br />
3.0<br />
2.0<br />
1.0<br />
0.0<br />
B3<br />
NT<br />
LTA<br />
B4<br />
C1<br />
C2<br />
R1<br />
NT<br />
LTA<br />
NT<br />
LTA<br />
NT<br />
LTA<br />
NT<br />
LTA<br />
FOM<br />
FFA<br />
FA<br />
HA<br />
Humin<br />
R2<br />
NT<br />
LTA<br />
B<br />
1.0<br />
g C 100 g C soil -1<br />
0.8<br />
0.6<br />
0.4<br />
0.2<br />
0.0<br />
B3<br />
NT<br />
LTA<br />
B4<br />
NT<br />
LTA<br />
C1<br />
NT<br />
LTA<br />
C2<br />
NT<br />
LTA<br />
R1<br />
NT<br />
LTA<br />
R2<br />
NT<br />
LTA<br />
Figure 1. Organic C content in the different SOM fractions from soils under evergreen oak forests (B3,<br />
C1, R1) and perturbed by bush encroachment (B4), cereal crop (C2) or reforestation with pine (R2),<br />
before and after LTA treatment. A. Respect to 100 g soil. B. Respect to 100 g soil C. NT: not treated;<br />
LTA: LTA-treated; HA: humic acid, FA: fulvic acid; FFA: fulvic acids extracted with H 3 PO 4 ; FOM:<br />
free organic matter.<br />
30<br />
20<br />
10<br />
0<br />
B3<br />
B4<br />
C1<br />
C2<br />
R1<br />
R2<br />
FOM<br />
FFA<br />
FA<br />
HA<br />
Humin<br />
-10<br />
-20<br />
-30<br />
-40<br />
Figure 2. Quantitative comparison of SOM fractions before and after LTA. Sample labels refer to Fig. 1.<br />
The changes due to LTA application were greater in soils with higher sand and lower clay<br />
content (R1,R2), whereas in soils with fine textural type and/or presence of carbonates the effect<br />
of LTA was less dramatic. This fact agrees with the well-known favorable effect of soil clay<br />
<strong>Vol</strong>. 2 Page - 44 -
15th IHSS Meeting- <strong>Vol</strong>. 2<br />
and carbonates on the formation of stable aggregates. Physical protection of SOM encapsulated<br />
within these aggregates is assumed to play a key role on SOM resistance to degradation [1,2],<br />
regardless the intrinsic chemical recalcitrance of the organic compounds [8,9].<br />
4. Conclusions<br />
The application of LTA and chemical fractionation provided valuable information about the<br />
resistance of SOM fractions to degradation. Therefore, it is possible to define SOM<br />
stabilization in terms of the relative resistance of the different soil fractions against LTA,<br />
although the particular soil characteristics (textural type, carbonate content) must be taken<br />
into account. In this work, the changes in SOM fractions after LTA suggested the greatest<br />
overall decrease in SOM stability in soils reforested with pine, whereas the SOM in oak forest<br />
behaved as relatively resilient against cultivation (C1,C2), and the bush-encroached site<br />
showed intermediate values (C2>B4>R2). Also, LTA enabled to differentiate two patterns of<br />
SOM alteration resulting of changes in soil use as regards the seminatural oak forests, i.e.<br />
lower stability or protection of the less stable humus fractions: FOM and FA, in bushencroached<br />
and pine-reforested soils, respectively.<br />
Acknowledgements<br />
Dr. A. Piedra Buena post-doctoral position at the CCMA-CSIC (I3P Program) is supported by<br />
the European Social Fund. The post-doctoral stay of Dr. A. Piedra Buena at the ISE-CNR was<br />
funded by a José Castillejo grant (Ministry of Science and Innovation, Spain).<br />
References<br />
1. G. Almendros, M. E. Guadalix, F. J. González-Vila and F. Martin, F. Org. Geochem. 24<br />
(1996), 651–659.<br />
2. E. Lichtfouse, S. Dou, C. Girardin, M. Grably, J. Balesdent, F. Behar and M.<br />
Vandenbroucke, Org. Geochem. 23 (1995), 865–868.<br />
3. L. P. D'Acqui, C.A. Santi, E. Sparvoli, J. G. Churchman, and G. G. Ristori, 1998. Proc.<br />
World Congr. Soil Sci. Int. Soil Soc., Montpellier, 1988 (CD).<br />
4. L.P. D'Acqui, G.J. Churchman, L.J. Janik, G.G. Ristori and D.A Weissmann, Geoderma 93<br />
(1999), 311–324.<br />
5. B. Dabin, Sci. Sol 1 (1971), 47–63.<br />
6. P. Duchaufour and F. Jacquin, Bull. AFES 1 (1975), 29–36.<br />
7. A. Walkley and I. A. Black, Soil Sci. 37 (1934), 29–38.<br />
8. J. Six, R. T. Conant, E. Paul and K. Paustian, Plant Soil 241 (2002), 155–176.<br />
9. N. Poirier, S. Derenne, J. Balesdent, C. Chenu, G. Bardoux, A. Mariotti and C. Largeau,<br />
Eur. J. Soil Sci. 57 (2006), 719–730.<br />
<strong>Vol</strong>. 2 Page - 45 -
15th IHSS Meeting- <strong>Vol</strong>. 2<br />
Organic Matter in Subtropical Leptosol Under Pasture Affected by Fire:<br />
Stocks, Physical Fractions and Chemical Composition<br />
Deborah Pinheiro Dick a* , Mariana Potes b , Cimélio Bayer c , Michley Tomazi c<br />
a Institute of Chemistry, UFRGS, Av. Bento Gonçalves, 9500, 91501-970, Porto Alegre,<br />
Brazil, b EMBRAPA Clima temperado, Pelotas, Brazil; c Soil Science Department, Agronomy<br />
Faculty, UFRGS, Avenida Bento Gonçalves, 7712, 91501-970, Porto Alegre, Brazil.<br />
*E-mail: debby.dick@gmail.com<br />
1. Introduction<br />
In the pastures of the Campos de Cima da Serra, South Brazil, burning of vegetation residues<br />
at the end of the winter season is a common and ancient practice, which aims to accelerate the<br />
pasture re-growth [1]. The goal of the present study was to evaluate the effect of periodic fire<br />
on carbon stocks, soil organic matter (SOM) distribution in physical compartments and its<br />
composition in profiles of a Leptosol (1200 m.a.s.l, 28°36´S, 49°58’W) under pasture<br />
submitted to periodic burning. The SOM of the same soil under native forest was also<br />
analyzed for comparison purpose.<br />
2. Materials and Methods<br />
Soil samples (triplicates) were collected in three layers (0–5 cm, 5–10 cm, 10–15 cm) of a<br />
native pasture that was biennially burned and last affected by fire 240 days ago and grazed by<br />
0.5 animal ha -1 (1NB), native pasture without burning in the last 23 years and grazed by 2<br />
animals ha -1 (23NB), and Araucaria forest (AF). Carbon (TOC) and nitrogen contents were<br />
determined by dry combustion and carbon stocks were calculated. Physical fractionation was<br />
performed by the densimetric method using polytungstate solution (ρ =2 g cm -3 ) [2] resulting<br />
in free light fraction (FLF), occluded light fraction (OLF) and heavy fraction (HF). SOM in<br />
physical fractions was investigated by thermo-gravimetric analyses (TGA) between 40 and<br />
800°C under synthetic air and a chemical recalcitrance index was calculated [3]: Δm (3º) Δm (2º) .<br />
3. Results and Discussion<br />
The periodic burning of vegetation (1NB) increased the C stocks in the subsurface (Table 1).<br />
In comparison to the site not fire-affected in the last 23 years, the 1NB site presented a greater<br />
proportion of C in the OLF in the 0–5 cm layer (Table 2). This result can be related to the<br />
occurrence of a more recalcitrant SOM originated during the fire that concentrates in this<br />
fraction and is more resistant to decomposition than other residues. In opposite, the 1NB site<br />
presented a greater C proportion in the HF in subsurface layer, what can be a consequence of<br />
the wider root system usually found in fire affected soils. In both depths, the OLF from 1NB<br />
<strong>Vol</strong>. 2 Page - 46 -
15th IHSS Meeting- <strong>Vol</strong>. 2<br />
showed a greater value for the TGA index (Table 2), evidencing the occurrence of a more<br />
recalcitrant SOM produced by periodic burning, that remained protected in this fraction,.<br />
4. Conclusions<br />
Periodic burning of subtropical pastures after the winter promotes the carbon sequestration<br />
until 15 cm soil depth. The more recalcitrant SOM produced during fire remains protected in<br />
the occluded light fraction.<br />
Table1. Carbon stocks and C/N ratio in soil layers of a Leptosol.<br />
Site<br />
TOC, Mg ha -1<br />
0–5 cm 5–10 cm 10–15 cm 0–15 cm<br />
1NB 33.1 ± 2.9 a 32.8 ± 1.1 32.0 ± 3.1 97.8 ± 6.9<br />
23 NB 31.2 ± 3.3 28.0 ± 1.2 26.2 ± 1.1 85.4 ± 4.0<br />
AF 52.0 ± 5.1 43.7 ± 4.4 41.7 ± 2.0 137.4 ± 10.6<br />
C/N<br />
1NB 14.9 ± 0.6 15.5 ± 0.8 15.7 ± 2.3 15.4 ± 0.7<br />
23 NB 14.6 ± 2.0 13.1 ± 1.0 15.1 ±1.8 14.2 ± 1.1<br />
AF 15.2 ± 0.3 14.9 ± 0.6 14.1 ± 1.2 14.8 ± 0.5<br />
Table 2. Proportion of soil carbon in the physical fractions and TGA index in soil layers of a<br />
Leptosol. N.d.: not determined<br />
Site<br />
0-5 cm 5-10 cm<br />
FLF OLF HF FLF OLF HF<br />
C fraction /TOC<br />
1NB 2.0 ± 0.0 25.6 ± 3.6 72.4 ± 3.6 0.8 ± 0.2 13.6 ± 0.2 85.6 ± 0.2<br />
23 NB 4.6 ±0.2 15.1 ± 1.9 80.3 ± 2.0 3.2 ± 0.9 19.3 ± 1.5 77.5 ± 2.3<br />
AF 20.8 ±1.6 26.3 ± 2.0 52.9 ± 3.4 2.0 ± 0.4 24.0 ± 4.9 74.0 ± 5.2<br />
Δm (3º) / Δm (2º)<br />
1NB 0.76 1.33 1.29 n.d 1.40 1.36<br />
23 NB 0.99 0.65 1.24 n.d. 0.61 1.30<br />
AF 0.73 1.54 1.31 n.d. 1.24 1.75<br />
Acknowledgements<br />
The authors acknowledge CAPES and CNPq (BR) and DAAD (GR) for support.<br />
References<br />
1 Heringer, MSc. Thesis, Universidade Federal do Rio Grande do Sul, Brazil, 2000.<br />
2 Conceiçao, P. C. PhD Thesis, Universidade Federal do Rio Grande do Sul, 2006.<br />
3 Benites, V. M., et al, Geoderma, 127 (2005) 104.<br />
<strong>Vol</strong>. 2 Page - 47 -
15th IHSS Meeting- <strong>Vol</strong>. 2<br />
Research Theme 3: Fire transformations of plant and soil molecular<br />
st<strong>ru</strong>ctures<br />
<strong>Vol</strong>. 2 Page - 48 -
15th IHSS Meeting- <strong>Vol</strong>. 2<br />
Relationships Between the Vertical Distribution of Biochars and the Soil<br />
Age, <strong>Humus</strong> Composition or Carbon Storage in the Profile of a Cumulative<br />
<strong>Vol</strong>canic Ash Soil<br />
Syusaku Nishimura a , Keisuke Miyazaki a , Yudzu<strong>ru</strong> Inoue b , Ha<strong>ru</strong>o Shindo a *<br />
a Faculty of Agriculture, Yamaguchi University, Yamaguchi, 753–8515 Japan; b Center of<br />
Advanced Inst<strong>ru</strong>mental Analysis, Kyushu University, Kasuga, Fukuoka, 816-8580 Japan<br />
E-mail: shindo@yamaguchi-u.ac.jp<br />
1. Introduction<br />
Biochars (mainly consists of charred plants) are produced during the burning of vegetation by<br />
human activity and wildfires. They have been widely detected in various soils [1–3]. In<br />
Japanese volcanic ash soils which predominated black (Type A) humic acids with a high<br />
degree of darkening and a graphite-like st<strong>ru</strong>cture [4], it was indicated that biochars merit close<br />
attention as one of the important sources of soil organic matter and Type A humic acids [1,5].<br />
The soil profiles often display the existence of several tephras with different ages. The<br />
objective of this study was to gain a basic understanding about the relationships between the<br />
vertical distribution of biochars and the soil age, humus composition or carbon storage in the<br />
profile of a cumulative volcanic ash soil.<br />
2. Materials and Methods<br />
Forty four soil samples were collected from surface and buried horizons (Ap, A, AC and A/C)<br />
in the profile of a cumulative volcanic ash soil (contains the tephra e<strong>ru</strong>pted in present to 26<br />
cal ka.), Miyakonojo, Miyazaki, Japan. Biochars in the soils were isolated using the specific<br />
gravity (s.g.) method. Soil samples were treated with the HCl-HF, washed with water and<br />
subjected to the s.g. method using heavy solution (s.g. 1.6 g cm -3 sodium polytungstate<br />
solution). The isolated fraction of less than s.g. 1.6 g cm -3 (< 1.6 fraction) was used for the<br />
microscopic observation and the determination of the organic carbon content. <strong>Humus</strong><br />
composition was analyzed for the organic matter extracted successively with 0.1 M NaOH<br />
and 0.1 M Na 4 P 2 O 7 [4].<br />
3. Results<br />
Microscopic observation showed that the biochars, which are black or blackish brown, were<br />
the main components in the < 1.6 fractions. Total organic matter content of the whole soil<br />
(TO) and organic carbon content of the < 1.6 fraction (CP), ranging from 17.6 to 142 g C kg -1<br />
whole soil and from < 0.5 to 15.8 g C kg -1 whole soil, respectively, were much higher in the<br />
<strong>Vol</strong>. 2 Page - 49 -
15th IHSS Meeting- <strong>Vol</strong>. 2<br />
2A (contains the tephra e<strong>ru</strong>pted in A. D. 1235) and 4A (contains the tephras e<strong>ru</strong>pted in 6.4<br />
and 4.6 cal ka) horizons than in the other horizons (Fig. 1). The percentage contribution of CP<br />
to TO was 5% or more in 15 samples from a total of 44 soils, with a maximum value of<br />
12.4%. Furthermore, the CP was highly correlated (r = 0.883) with the TO (Table 1 and Fig.<br />
2). No constant relationships were found between the elapse of soil age and the change of TO<br />
or CP. The humic acids obtained from whole soils were classified into Type A, except for the<br />
surface horizon soil. The vertical distribution pattern of the CP was similar to that of the<br />
amount of humic or fulvic acids. The CP was highly correlated with the sum (EO) of the<br />
amounts of NaOH-extractable humic acid (a 1 ) and fulvic acid (b 1 ) and the amounts of<br />
Na 4 P 2 O 7 -extractable humic acid (a 2 ) and fulvic acid (b 2 ), the a 1 +a 2 , the b 1 +b 2 , the a 1 +b 1 , the a 1<br />
and the b 1 (r > 0.850) (Table 1 and Fig. 2).<br />
4. Conclusion<br />
From the findings in this study, it was assumed that in the cumulative volcanic ash soil,<br />
biochars contributed to the formation of Type A humic and fulvic acids as well as the carbon<br />
storage.<br />
References<br />
1. H. Shindo, T. Honna, S. Yamamoto and H. Honma, Org. Geochem., 35 (2004) 235.<br />
2. M.W.I. Schmidt, J.O. Skjemstad, E. Gehrt and I. Kögel-Knabner. Eur. J. Soil Sci., 50<br />
(1999) 351.<br />
3. J.O. Skjemstad, D.C. Reicosky, A.R. Wilts and J.A. McGowan. Soil Sci. Soc. Am. J., 66<br />
(2002) 1249.<br />
4. K. Kumada, Chemistry of Soil Organic Matter, Elsevier, Amsterdam, 1987.<br />
5. S. Nishimura, T. Hirota, O. Hirahara and H. Shindo, Soil Sci. Plant Nutr., 52 (2006) 686.<br />
<strong>Vol</strong>. 2 Page - 50 -
15th IHSS Meeting- <strong>Vol</strong>. 2<br />
depth (m)<br />
0<br />
TO<br />
(g C kg -1 whole soil)<br />
CP<br />
(g C kg -1 whole soil)<br />
0 50 100 150 0 5 10 15 20<br />
1Ap<br />
1A<br />
1AC<br />
1C<br />
2A<br />
5<br />
10<br />
A. D. 1914<br />
A. D. 1471<br />
A. D. 1235<br />
1<br />
15<br />
3A<br />
20<br />
3AC<br />
3C<br />
4.6 cal ka<br />
4A<br />
30<br />
6.4 cal ka<br />
2<br />
5A<br />
5BC<br />
5C1<br />
5C2<br />
5C3<br />
6AC<br />
7A/C1<br />
40<br />
7.3 cal ka<br />
7.6 cal ka<br />
8.0 cal ka<br />
7A/C2<br />
7A/C3<br />
45<br />
8A1<br />
3<br />
50<br />
12.8 cal ka<br />
8A2<br />
8Bw1<br />
8Bw2<br />
9CBm<br />
10Bt<br />
26 cal ka<br />
4<br />
10C<br />
<br />
Figure 1. Vertical distribution of amounts of total organic matter (TO) and amounts of biochar (CP) in soil<br />
profile. A bar graph “ □ ” indicates that the amount of biochar is less than 0.5 g C kg -1 whole soil. Numbers in<br />
the figure of the TO indicate the soil. No. Letters and numbers in the figure of the CP stand for the soil age.<br />
<strong>Vol</strong>. 2 Page - 51 -
15th IHSS Meeting- <strong>Vol</strong>. 2<br />
Table 1 Relationships between amounts of biochar (CP) and amounts of total organic matter (TO) or amounts of humus<br />
components †<br />
TO EO a 1a 2 b 1b 2 a 1b 1 a 2b 2 a 1 a 2 b 1 b 2<br />
CP 0.883 *** 0.895 *** 0.865 *** 0.868 *** 0.897 *** 0.647 *** 0.860 *** 0.779 *** 0.882 *** -0.444 **<br />
(0.746) *** (0.773) *** (0.703) *** (0.738) *** (0.778) *** (0.382) (0.690) *** (0.599) ** (0.779) *** (-0.748) ***<br />
†<br />
Values out of parenthesis and in parenthesis indicate the correlation coefficients for 44 soil samples (all<br />
samples) and 23 soil samples (except 21 samples which the amounts of biochar were below 0.5 g C kg -1 whole<br />
soil), respectively. a 1 and b 1 indicate the amounts of humic acid and fulvic acid extracted with NaOH,<br />
respectively. a 2 and b 2 indicate the amounts of humic acid and fulvic acid extracted with Na 4 P 2 O 7 , respectively.<br />
EO stands for a 1 +b 1 +a 2 +b 2 . ** significant at 1% level. *** significant at 0.1% level.<br />
TO, a 1 +a 2 or b 1 +b 2 (g C kg -1 whole soil)<br />
160<br />
140<br />
120<br />
100<br />
80<br />
60<br />
40<br />
r =0.883 ***<br />
r = 0.865 ***<br />
r = 0.868 ***<br />
20<br />
0<br />
0 4 8 12<br />
CP (g C kg -1 whole soil)<br />
16<br />
Figure 2. Relationships between CP and TO, a 1 +a 2 or b 1 +b 2 . See Table 1 for CP, TO, a 1 , a 2 , b 1 and b 2 . TO:●,<br />
a 1 +a 2 :■, b 1 +b 2 :□.<br />
*** significant at P< 0.1% level.<br />
<strong>Vol</strong>. 2 Page - 52 -
15th IHSS Meeting- <strong>Vol</strong>. 2<br />
Impact of St<strong>ru</strong>ctural Heterogeneity of Pyrogenic Organic Material (PyOM)<br />
on Humification Processes in Fire-Affected Soils<br />
Heike Knicker a* , André Hilscher b ,<br />
a Instituto de Recursos Naturales y Agrobiología de Sevilla, CSIC, PO Box 1052, 41080<br />
Sevilla, Spain; b André Hilscher, Lehrstuhl für Bodenkunde, TUM, 85350 Freising, Germany,<br />
E-mail: knicker@irnase.csic.es<br />
1. Introduction<br />
Approximately 10 to 15×10 6 ha of boreal and temperate forest, 20 to 40×10 6 ha of tropical<br />
forests and up to 500×10 6 ha of tropical and subtropical savannas, woodlands and open forests<br />
are burnt every year (Goldammer, 1993). Beside the production of volatiles, vegetation fire<br />
transforms various amounts of labile organic components into recalcitrant dark colored and<br />
highly aromatic st<strong>ru</strong>ctures. They are incorporated into humic material of the soil and can<br />
substantially contribute to its darkness. Because in sediments and soils, this pyrogenic organic<br />
material (PyOM) can survive for millennia and it is assumed to represent an important sink<br />
within the global carbon cycle. However, if assumed that biomass burning occurred at the<br />
same rate than nowadays since the last glacial maximum, PyOM should account for 25 to<br />
125% of the total soil organic matter pool (Masiello, 2004). In order to elucidate the real<br />
importance of PyOM as a C-sink, a good understanding of its chemistry and the processes<br />
involved in its humification is c<strong>ru</strong>cial. Although there are several models describing “Black<br />
Carbon” (BC) on a molecular level are reported, a commonly accepted view of the chemistry<br />
involved in its formation is still missing. Its biogeochemical recalcitrance is commonly<br />
associated with a highly condensed aromatic st<strong>ru</strong>cture. However, recent studies indicated that<br />
this view may be oversimplified for PyOM derived from vegetation fires (Knicker et al.,<br />
2008). Alternatively, it was suggested that such combustion residues are a heterogeneous<br />
mixture of heat-altered biopolymers with domains of relatively small polyaromatic clusters,<br />
but considerable substitution with N, O and S groups.<br />
In order to bring some more light on the st<strong>ru</strong>ctural properties of PyOM produced during<br />
vegetation fire and its role for humification, charred plant residues and model chars derived<br />
from typical plant macromolecules were subjected to controlled charring and then<br />
characterized by nuclear magnetic resonance (NMR) spectroscopy and elemental analysis.<br />
Additional samples were fossilized char and humic material extracted from pyrogenic soil<br />
organic matter. Subsequently, the chemical features of the PyOM were related to its<br />
recalcitrance during humification.<br />
<strong>Vol</strong>. 2 Page - 53 -
15th IHSS Meeting- <strong>Vol</strong>. 2<br />
2. Materials and Methods<br />
Casein, cellulose, organosolv-lignin and condensed tannins as well as milled grass material<br />
(Lolium perenne) were charred for 4 min at 350 °C and 450 °C under oxic conditions. Further<br />
chars were produced from milled beech sawdust (4 min 450 °C). Their chemical stability was<br />
analyzed by chemical oxidation with 40 ml of 0.1 M K 2 Cr 2 O 7 /2 M H 2 SO 4 (Knicker et al.,<br />
2007). The total C, N, H and S contents were measured by dry combustion (975 °C). All<br />
samples were analyzed by solid-state 13 C NMR spectroscopy (B<strong>ru</strong>ker DSX 200) using the<br />
cross polarization magic angle spinning (CPMAS) technique.<br />
3. Results and Discussion<br />
Charring cellulose (350 °C, 8 min, oxic conditions) yielded in a low C-recovery (11%).<br />
Treating casein in the same way resulted in a survival of 62% of its C and 46% of its N.<br />
Comparable high C-recoveries are reported for lignin. After charring Lolium perenne, 34% of<br />
its N and C were recovered. NMR-spectroscopic studies revealed that for this sample most of<br />
the charred N and C occurred in pyrrole-type st<strong>ru</strong>ctures. Accordingly, it was calculated that in<br />
non-woody biochars, such compounds may consume up to 17% and sometimes even up to<br />
60% of their organic C. Our studies further indicate that the aromatic skeleton of char<br />
accumulating after a vegetation fire must contain remains of the lignin backbone and<br />
considerable contributions of furans and anhydrosugars from thermally altered cellulose.<br />
Enhancing the temperature during the charring of casein to 450 °C decreased the C and N<br />
recovery to 30% and 23%, respectively. Comparably the C, O and H recovery were also<br />
reduced in the cellulose char, but to a considerably higher extent (C:5%, O:1% and H:2%,<br />
respectively). These changes went along with a further augmentation of the relative<br />
contribution of aromatic C. Although signal intensity is still visible in the O-aryl C region, the<br />
aryl C/O-aryl C ratio increased revealing the preferential dest<strong>ru</strong>ction of O-heteroaromatic<br />
st<strong>ru</strong>ctures. Increased C, H and O losses were also observed for charring of lignin at higher<br />
temperature, although they were smaller than those observed for casein and cellulose. The<br />
higher temperature considerably altered the chemistry of the lignin char which was<br />
recognizable by the removal of alkyl C, and the disappearance of the signals for methoxyl C<br />
(56 ppm) and phenolic C (153 ppm). The atomic H/C ratio, however, remained above 0.5<br />
showing that in average at least every second C is protonated, which excludes that highly<br />
condensed st<strong>ru</strong>ctures represent a major fraction of this lignin char.<br />
Subjecting the produced chars to chemical oxidation with acid potassium dichromate clearly<br />
demonstrated that the resistance of the casein chars against heat is not necessarily related to<br />
<strong>Vol</strong>. 2 Page - 54 -
15th IHSS Meeting- <strong>Vol</strong>. 2<br />
chemical recalcitrance. For the char produced at 350 °C, only 13% of the C and N remained<br />
in the oxidation residues, whereas for that produced at 450 °C this value increased to 80%. In<br />
contrast, both cellulose chars showed high chemical resistance with a C-survival of more then<br />
80%. Comparatively, the C and N recalcitrance in the grass chars increased with temperature.<br />
However, the burned wood residues (350 °C) suffered an almost complete oxidation. The<br />
latter may be because it contained mainly lignin charring products with relative low stability<br />
against the dichromate treatment (C-loss: 64%). The chars from condensed tannins, on the<br />
other hand showed a high chemical resistance independently from the production temperature.<br />
Thus, although the chemical recalcitrance of N-containing charring products seem to be lower<br />
compared to the other biochars, we could demonstrate that they dominate the organic matter<br />
fraction of recent but also Neolithic burnt soils. This strongly supports their relatively high<br />
biochemical recalcitrance.<br />
4. Conclusions<br />
In summary, this study confirmed that the thermal, chemical and biological recalcitrance of<br />
biochars is related to their chemical st<strong>ru</strong>ctures and N-contents, which on the other hand<br />
depend on the source and the respective charring conditions. The resulting high variability of<br />
biochars is in accordance with the concept of BC as a continuum and explains the high<br />
discrepancy among BC quantifications obtained with common approaches assuming BC as a<br />
highly condensed polyaromatic network. The fact that in particular the N-charring<br />
components survived prolonged pedogenetic processes, underline the relevance of this<br />
compound class within the geobiochemical cycles and demonstrates the long-time impact of<br />
vegetation fires on organic matter maturation.<br />
References<br />
Goldammer, J.G. 1993. Historical biogeography of fire: tropical and subtropical, p. 297-314,<br />
In P. J. C<strong>ru</strong>tzen and J. G. Goldammer, eds. Fire in the Environment, the Ecological,<br />
Atmospheric and Climatic Importance of Vegetation Fires. John Wiley and Sons,<br />
Chichester.<br />
Knicker, H., P. Müller, and A. Hilscher. 2007. How useful is chemical oxidation with<br />
dichromate for the determination of "Black Carbon" in fire-affected soils? Geoderma<br />
142:178–196.<br />
Knicker, H., A. Hilscher, F.J. González-Vila, and G. Almendros. 2008. A new conceptual<br />
model for the st<strong>ru</strong>ctural properties of char produced during vegetation fires. Org.<br />
Geochem. 39:935–939.<br />
Masiello, C.A. 2004. New directions in black carbon organic geochemistry. Mar. Chem.<br />
92:201–213.<br />
<strong>Vol</strong>. 2 Page - 55 -
15th IHSS Meeting- <strong>Vol</strong>. 2<br />
Long-term effects of wildfires on soil organic matter features:<br />
A study in Mediterranean sh<strong>ru</strong>blands of Eastern Spain<br />
Pere Rovira a *, Beatriz Duguy b<br />
a Forest Technology Ctr of Catalonia, Crtra St Llorenç de Mo<strong>ru</strong>nys, km 2, Solsona, Spain<br />
b Universitat de Barcelona, Facultat de Biologia, Diagonal 645, Barcelona, Spain<br />
E-mail: pere.rovira@ctfc.cat<br />
1. Introduction<br />
Wildfires affect the characteristics of soil organic matter (SOM), but whether their effects are<br />
relevant on the long term is less clear, because the capacity of the soil system to recover its<br />
previous characteristics must be taken into account. Our research aims to verify the relevance<br />
of these effects on the long term, in typical Mediterranean sh<strong>ru</strong>blands in E Spain.<br />
2. Materials and Methods<br />
We studied a set of plots in Vall de Gallinera, province of Alacant, E Spain. Mean T is 17.4<br />
ºC and mean annual precipitation is 825 mm. The region has been affected by fires since the<br />
1970s. Soils are mostly Leptosols and calcaric Cambisols. Most agricultural fields were<br />
cultivated until the 1960s. After abandonment, the vegetation reverted to secondary<br />
sh<strong>ru</strong>blands of the Rosmarino-Ericion alliance Br.-Bl. 1931. The complete plot set includes<br />
never cropped plots (NC), early abandoned plots (EA) and recently abandoned plots (RA).<br />
These plots may have been affected by 0 fires, 1 fire or 2 fires in the last 25 years (in RA<br />
plots, only 0 and 1 fire). In each plot, 4 soil samples were taken at random, from the 0–5 cm<br />
depth layer. The organic horizons (L, F) were excluded from this study. Soil samples were<br />
air-dried and sieved to 2 mm, and a subsample finely ground for standard chemical analyses.<br />
The main results of this study have been published: overall, SOM content decreases with<br />
repeated wildfires [1], and repeated wildfires apparently do not result in increased BC<br />
contents [2]. Here we focus on the effect of wildfires on other characteristics of SOM: mainly,<br />
its distribution among physical fractions (size fractionation), and the abundance of refractory<br />
C forms, quantified by acid hydrolysis. Here we show some results obtained in size<br />
fractionation analysis. Size fractions were obtained by wet sieving after a strong ultrasonic<br />
dispersion. The obtained fractions were analyzed by organic carbon (OC) and total N.<br />
3. Results and Discussion<br />
Wildfires tend to decrease the amount of OC in the whole horizon, but on the other hand the<br />
OC associated to fine fractions (< 20 um) tends to increase: for a given amount of total OC,<br />
<strong>Vol</strong>. 2 Page - 56 -
15th IHSS Meeting- <strong>Vol</strong>. 2<br />
the amount of OC associated to fine silt plus clays is higher in plots affected by 1 fire. There<br />
is a great variability in plots affected by 2 fires (Fig. 1).<br />
The phenomenon may be due to the thermal shock suffered during the wildfire itself, which<br />
may increase the association of SOM to the fine fractions. Also, the inter<strong>ru</strong>ption of SOM<br />
inputs in the first year(s) after the fire may result in an increased dominance of the SOM<br />
associated to fine silt and clays, which are overall more resistant to biodegradation.<br />
14<br />
12<br />
0 2 4 6 8 10 12 14 16 2 3 4 5 6 7 8<br />
Never cropped plots<br />
C in fine silt + clay (g C per 100 g of mineral matter)<br />
10<br />
8<br />
6<br />
4<br />
2<br />
0<br />
9<br />
8<br />
7<br />
6<br />
5<br />
0 fires<br />
1 fire<br />
2 fires<br />
Recently abandoned plots<br />
4<br />
3<br />
2<br />
1<br />
1 2 3 4 5 6 7 2.0 2.5 3.0 3.5 4.0<br />
C in the whole horizon (g C per 100 g of mineral matter)<br />
Fig. 1. Relationship between OC content in the whole horizon and in fine fractions (< 20 μm)<br />
4. Conclusions<br />
Apparently wildfires may drive SOM towards an increased physical protection. The<br />
consequences of this phenomenon on the long-term SOM evolution deserve further research.<br />
References<br />
1. B. Duguy, P. Rovira and V.R. Vallejo, Eur. J. Soil Sci., 58 (2007) 83.<br />
2. P. Rovira, B. Duguy and V.R. Vallejo, J. Plant Nutr. Soil Sci., 172 (2009) 43.<br />
<strong>Vol</strong>. 2 Page - 57 -
15th IHSS Meeting- <strong>Vol</strong>. 2<br />
Comparison of Humic Substances in Burnt and Unburned Forest Soils in<br />
Central Portugal<br />
Faria S. a , Varela M.E. a *, Esteves V.I. b , Keizer J.J. a<br />
a Centro de Estudos do Ambiente e do Mar (CESAM), Dep. Ambiente & b Quimica,<br />
Universidade de Aveiro, Campus Universitário Santiago, 3810-193 Aveiro, Portugal.<br />
E-mail: eufemia.varela@ua.pt<br />
1. Introduction<br />
The EROSFIRE-I and -II projects aim at developing a model-based tool for predicting soil<br />
erosion hazard following wildfire and post-fire land management practices, and, thereby, at<br />
contributing to sustainable forestry in Portugal. It is rather well documented that wildfires,<br />
through their effects on soil properties and on vegetation and litter cover, can produce strong<br />
and sometimes extreme responses in <strong>ru</strong>noff generation and soil losses, especially during the<br />
earlier stages of the so-called “window-of-disturbance [e.g. 1]. The need for such a tool is<br />
thus clear in a country like Portugal, where wildfire affect in average year some 100.000 ha of<br />
<strong>ru</strong>ral areas [2] and in extreme years, like 2003 and 2005, up to 300.000 and more.<br />
Soil water repellency—the resistance of soil to wetting—is widely considered as one of the<br />
main factors involved in wildfire-enhanced <strong>ru</strong>noff generation and the associated soil losses<br />
[e.g. 1]. The impact of wildfires on soil water repellency is complex, however, with fire<br />
severity playing an important role through the combustion of soil organic matter and the<br />
production/dest<strong>ru</strong>ction of organic compounds inducing repellency [e.g. 3, 4].<br />
The present work wants to provide further insight into the role of the soil organic matter<br />
content and composition in explaining possible differences in water repellency between<br />
recently burnt and long unburned forest soils. It concerns a pilot-study, however, which has as<br />
main aim to explore the potential of two relatively easy and fast analytical techniques to<br />
characterize the humic organic substances [5,6,7]. To this end, this study compares two pairs<br />
of neighbouring burnt and unburned study sites that were being monitored on a monthly basis<br />
with respect to soil water repellency in the framework of the EROSFIRE-II project. The two<br />
pairs of sites concern the two principal forest types in the study area (and in central Portugal),<br />
those of Maritime Pine (Pinus pinaster) and Eucalypt (Eucalyptus globulus).<br />
2. Study area, and Materials and Methods<br />
This study was carried out in the municipality of Gois, located in the Serra de Lousã, central<br />
Portugal. The study area of about 70 ha was affected by a wildfire during late August 2008,<br />
<strong>Vol</strong>. 2 Page - 58 -
15th IHSS Meeting- <strong>Vol</strong>. 2<br />
and subsequently inst<strong>ru</strong>mented with several slope-scale erosion plots as well as a<br />
hydrometric-erosion gauging station. In the border zones of the burnt area, two pairs of<br />
adjacent burnt and unburned slopes were selected for monitoring the temporal patterns in soil<br />
water repellency. The two slope pairs concern contrasting forest types, i.e. Maritime Pine and<br />
Eucalypt stands, but the same underlying geology (schists).<br />
Soil water repellency was monitored in the field on a monthly basis from November 2008 to<br />
August 2009. During each of these 10 monthly field campaigns, also samples were collected<br />
from the soil’s top 5 cm, including for determination of organic matter content. Sample<br />
collection took place at 3 or 5 equidistant points along transects that were laid out at positions<br />
that shifted with fixed distances (3 m) between successive campaigns. The transects at the<br />
unburned pine site involved 3 sampling points (access was very difficult due to a dense<br />
undergrowth vegetation), whereas those at the other sites involved 5 points. Following drying<br />
in ambient laboratory conditions and mechanical sieving to remove the ≥2 mm fraction, the<br />
organic matter content of the samples was determined through heating in a muffle at 550 ºC<br />
during 2 hours [8].<br />
Ultraviolet-Visible and Molecular Fluorescence Spectroscopy were chosen as a first,<br />
“quick&dirty” approach to characterizing the humic substances composition of the soil<br />
organic matter. In the present context, these analyses could only be done for a limited number<br />
of samples. Therefore, only the samples of two of the monitoring campaigns were analyzed.<br />
The November-2008 and Feb<strong>ru</strong>ary-2009 campaigns were selected for representing contrasting<br />
antecedent weather condition, i.e. dry and wet conditions in the case of November (reflecting<br />
a less-rainy-than-normal autumn) and Feb<strong>ru</strong>ary, respectively. Furthermore, the analyses were<br />
limited to composite samples, composed of the 3 to 5 samples from the individual transect<br />
points and mixed in equal weight proportions.<br />
The humic substances were extracted following the methods adopted by the International<br />
Humic Substances Society [9], obtaining composite solutions of humic and fulvic acids. The<br />
UV-Vis spectra of the samples were measured, following dilution to avoid absorbance<br />
exceeding 1.000, with a Shimadzu 2501 PC UV-Vis spectrophotometer in the 250 and 700<br />
nm range, using a quartz cell with a path length of 1 cm. A HORIBA Jobin Yvon FluoroMax-<br />
3 spectro-fluorometer, controlled Datamax software, was employed to trace the molecular<br />
fluorescence spectra in synchronous mode, using a quartz cell with 1 cm optical path length.<br />
For fluorescence spectra, all samples were diluted such that absorbance equaled 0.03.<br />
<strong>Vol</strong>. 2 Page - 59 -
15th IHSS Meeting- <strong>Vol</strong>. 2<br />
3. Results and Discussion<br />
Comparison of the overall topsoil organic matter contents suggests a clear wildfire effect for<br />
both forest types. The median values over the entire 10-month period for the unburned and<br />
recently burnt soils are 32.6 and 27.5 %, respectively, in the case of the pine sites, and 27.8<br />
and 15.6, respectively, in the case of the eucalypt sites. These decreases suggest that fire<br />
severity was medium to high [e.g. 10].<br />
The UV-Vis spectra of the 4 composite samples have similar overall shapes, with absorbance<br />
gradually decreasing with increasing wavelength between 250 and 700 nm as is typical for<br />
humic substances. Differences between the neighboring burned and burnt soils are most<br />
evident in the 250–300 nm range but even these differences tend to be rather minor, except in<br />
the case of the pine soils in Feb<strong>ru</strong>ary. The effect of wildfire seems to be that of increasing<br />
absorbance, since the absorbance values of the burnt samples are consistently higher than<br />
those of the neighboring and concurrent unburned samples in three out of the four cases.<br />
To facilitate comparison and interpretation of the spectra [6], the ratio of absorbance at 250<br />
nm and at 365 nm (E2/E3) was computed. The ratios for unburned soils are higher or, in one<br />
case, equal to those for their burnt counterparts. Apparently, the effect of wildfire is that of<br />
increasing the relative amount of condensed aromatic compounds. This can be explained by<br />
the dest<strong>ru</strong>ction of non-aromatic compounds, since they are less heat-resistant than the<br />
aromatic compounds. The difference in ratios between the unburned and burnt soils in<br />
November is markedly bigger for the eucalypt stands (3.4 vs. 2.9) than for the pine stands (3.0<br />
vs. 2.9). This in agreement with the above-mentioned differences in organic matter contents,<br />
and equally suggests a more intense fire at the eucalypt than pine site. The Feb<strong>ru</strong>ary-2008<br />
ratios are smaller than the November-2009 ones in three out of four cases. This reduction can<br />
be attributed to a seasonal reduction in microbial activity, reflecting the lower winter<br />
temperatures and resulting in smaller amounts of humic substances of low molecular weight.<br />
Like the UV-Vis spectra, the 4 synchronous Fluorescence spectra for a Δλ of 18 nm reveal<br />
rather similar overall patterns. All spectra show 3 clear peaks in fluorescence, i.e. in the<br />
ranges of 295–300, 380–385 and 470–485 nm. The first peak is associated with the presence<br />
of proteins and/or amino acids bound to humic acids [7]; the second with the presence of<br />
polycyclic aromatic compounds with 3-4 fused benzene rings and/or 2–3 conjugate<br />
unsaturated aliphatic st<strong>ru</strong>ctures [11]; the third with the presence of highly condensed humic<br />
acids like lignin or lignin-like compounds [11].<br />
<strong>Vol</strong>. 2 Page - 60 -
15th IHSS Meeting- <strong>Vol</strong>. 2<br />
Following the example of [12], the ratios between the fluorescence intensities of the abovementioned<br />
3 peaks were computed. The I 295-300 /I 380-385 ratio seems unrelated to wildfire<br />
occurrence. In the case of the pine stands, the November-2008 ratio is higher for the burnt<br />
than unburned soil (1.6 vs. 1.5); in the case of the eucalypt stands, however, the opposite is<br />
t<strong>ru</strong>e (1.4 vs. 1.5). The I 380-385 / I 470-480 ratio reveals a more consistent pattern, with the<br />
November-values being higher for the burnt than unburned pine as well as eucalypt soils (1.7<br />
vs. 1.6 and 1.8 vs. 1.3, respectively). A possible explanation is the enrichment with humic<br />
substances with a greater degree of aromatic poly-condensation and/or π conjugation [12].<br />
Apparently, seasonal variation in the two ratios is limited, since the burned pine stand<br />
revealed—minor—changes from November to Feb<strong>ru</strong>ary.<br />
4. Conclusion<br />
Whilst the UV-Vis and Fluorescence Molecular spectra did not themselves reveal prominent<br />
differences between the burnt and unburned soils of two distinct forest types, the computed<br />
ratios provided various suggestions of wildfire effects on the humic substances composition<br />
of the topsoil organic matter. Therefore, the two techniques will be explored more<br />
exhaustively in the recently approved FIRECNUTS project.<br />
Acknowledgements<br />
This study was supported by the project EROSFIRE-II (PTDC/AGR-CFL/70968/2006),<br />
funded by the Portuguese Foundation for Science and Technology (FCT) with co-funding by<br />
FEDER through the POCI2010 Programme as well as by the post-doctoral research grant of<br />
the MEV (SFRH/BPD/63808/2009).<br />
References<br />
3. R.A. Shakesby and S.H. Doerr, Earth-Science Reviews 74 (2006): 269–307.<br />
4. J. Pereira, J. Carreira, J. Silva J. and M. Vasconcelos. In: J.S. Pereira et al. (eds.),<br />
ISAPress, Lisbon, pg 133–16.<br />
5. S.H Doerr, R.A.Shakesby and R.P.D Walsh, Earth-Science Reviews 51 (2000), 33–65.<br />
6. J.J. Keizer, S.H. Doerr, M.C. Malvar, S.A.Prats et al., Catena 74 (2008), 192–204.<br />
7. J.A. Hatten, D. Zabowski, A. Ogden and W. Thies, For. Ecol. Manage., 255 (2008)<br />
2555–2565.<br />
8. 1. A. Mendonca, A. C. Duarte and E. B. H. Santos, Biogeochemistry 69 (2004) 159–174.<br />
9. J. Hur, D.H. Lee and H.S. Shin, Organic Geochemistry 40 (2009) 1091–1099<br />
10. J.V. Botelho C., Caracterização e constituição do solo. Fund. C. Gulbenkian, ed. 7, 2004<br />
11. IHSS, www.ihss.gatech.edu/soilhafa.html, 05/06/2009.<br />
12. M.E. Varela, E. Benito and J.J. Keizer, Land Degradation & Development, in press.<br />
13. C. Santín, M. González-Pérez, X et al., Est. Coastal & Shelf Science 79 (2008) 541–548.<br />
14. K. Kalbitz, W. Geyer and S. Geyer, Biogeochemistry, 47(1999) 219–238.<br />
<strong>Vol</strong>. 2 Page - 61 -
15th IHSS Meeting- <strong>Vol</strong>. 2<br />
Similarities of 13 C NMR Spectroscopic Properties of Humic Acids Between<br />
Black Soils–Andosols and Chernozems<br />
Nobuhide Fujitake a *, Masayuki Tani b , Balthazar Michael Msanya c ,<br />
Evgeny Abakumov d , Takashi, Kosaki e<br />
a Grad. Schl. Agricultural Sci., Kobe University, Rokkodai, Nada, Kobe 6578501, Japan;<br />
b Dept. Agro-Environm. Sci., Obihiro University of Agriculture and Veterinary Medicine,<br />
Inada, Obihiro 080-8555, Hokkaido, Japan; c Dept. Soil Science, Sokoine University of<br />
Agriculture, P.O. Box 3008, Morogoro, Tanzania; d Dept. Soil Sci. Soil Ecology, Saint-<br />
Petersburg University, 199178, 16-line, Vasilyevskiy Island, Saint-Petersburg, Russia; e Grad.<br />
Schl. Urban Envirnm. Sci., Tokyo Metropolitan University, Hachioji 192-0397, Tokyo, Japan<br />
E-mail: fujitake@kobe-u.ac.jp<br />
1. Introduction<br />
Andosols and Chernozems are characterized as the soils with a thick black surface layer that<br />
is rich in organic matter though their parent materials, regional distribution, and pH<br />
conditions are different [1]. A number of NMR analytical studies for the properties of humic<br />
acids (HAs) in these soils have been performed [e.g. 2–7]. As a result, it has revealed that<br />
HAs in both soil types are often rich in aromatic st<strong>ru</strong>ctures. There is now increasing evidence<br />
that much of these aromatic properties are due to the effects of accumulation of charred plant<br />
remains (or black carbon (C)) from periodic burning of the vegetation [e.g. 6–9]. Further<br />
understanding of the soil C storage in both black soils has received much interest recently due<br />
to their relevance in the global C cycle. However, work on comparative characteristics of<br />
NMR spectra between HAs in Andosols and Chernozems has not been reported. The aim of<br />
this study is to assess the similarities between HAs in Andosols and Chernozems distributed<br />
worldwide using NMR characteristics, and to compare them with those in other soils.<br />
2. Materials and Methods<br />
Sixty one of HA samples –Andosols (AN; n=20), Chernozems (CH; n=19), Kastanozems<br />
(KS; n=4), and others (Cambisols, Podozols, Luvisols and Acrisols; n=18)– were prepared<br />
from A horizons of soils (but Bh horizons for Podozols). These sampling sites were located in<br />
Japan, Brazil, Tanzania, USA, Canada, Ukraine, Kazakhstan, and Russia. The HA preparation<br />
was based on the IHSS methods [10]. Solution 13 C NMR spectra were obtained using inversegated<br />
decoupling pulse program as described previously [5]. The relative carbon content was<br />
calculated according to previous reports [4, 5, 11, 12].<br />
<strong>Vol</strong>. 2 Page - 62 -
15th IHSS Meeting- <strong>Vol</strong>. 2<br />
Table 1 Average values of C distribution in HAs on 13 C NMR analysis.<br />
* Aromaticity=(110 to 165ppm)/(5 to 165ppm)<br />
Fig. 1. Histograms of average values of carbon distribution in HAs.<br />
3. Results and Discussion<br />
Table 1 and Fig. 1 show the average values of percentage distribution of the carbon species<br />
estimated from NMR spectra. Typical and Marginal Andosols (t-AN and m-AN) means the<br />
soils with a thick black surface layer and with a thin black-brownish one, respectively. As<br />
shown in the figure, higher Aryl-C contents and lower Alkyl- and O-Alkyl-C contents were<br />
<strong>Vol</strong>. 2 Page - 63 -
15th IHSS Meeting- <strong>Vol</strong>. 2<br />
significantly observed in t-AN, CH and KS, compared with those observed in m-AN and<br />
others. The characteristics of HAs are indistinguishable among t-AN, CH and KS.<br />
As shown in Fig. 2, the plots were divided into two groups: black soil HAs (t-AN, CH and<br />
KS) and others soil HAs (m-AN and others). Representative NMR spectra of HAs were<br />
Fig. 2. O-Alkyl-C vs. Aryl-C plots of HAs<br />
Fig. 3. Representative 13 C NMR spectra of HAs<br />
<strong>Vol</strong>. 2 Page - 64 -
15th IHSS Meeting- <strong>Vol</strong>. 2<br />
shown in Fig. 3. The shapes of the spectra in t-AN and CH were quite similar to each other.<br />
However these spectra were completely differ from those observed in the HAs of other soil<br />
types. The spectra in t-AN and CH were characterized two prominent broad peaks assigned to<br />
Aryl-C (110–145 ppm) and Carboxylic-C (165–190 ppm), and several weak peaks at higher<br />
magnetic fields (Alkyl C at 5–48 ppm and O-Alkyl C at 48–110 ppm). The spectra of HAs in<br />
m-AN were similar to those in HAs of other soil types. These HA spectra showed three<br />
distinct peaks at around 55, 125 and 145 ppm, which were attributed to the effects of ligninderived<br />
compounds. Further, their peak slopes in the range of 110–130 ppm (higher magnetic<br />
fields on the broad Aryl-C peaks) were jagged. However, the slopes in the black soil spectra<br />
were smooth and such shapes should be represented as an analog of char materials [7].<br />
Conclusively, results of this study suggest that (1) Characterization of HAs in the black soils–<br />
t-AN, CH and KS– are analogous, (2) HAs in black soils are commonly originated from plant<br />
char residues, whereas HAs in other soils are originated from lignin-derived compounds, and<br />
(3) HAs in marginal AN are composed of mixture of char materials and lignin-derived<br />
compounds.<br />
References<br />
1. FAO, World Reference Base for Soil Resources, ISSS-ISRIC-FAO, World Soil<br />
Resources Reports, No. 103, Rome.<br />
2. W. Zech, G. Guggenberger, P. Zalba, and N. Peinemann, Z. Pflanzenernahr. Bodenkd.,<br />
160, (1997) 563–571.<br />
3. W. Amelung, K.-W. Flach, and W. Zech, Soil Sci. Soc. Am. J., 61 (1997), 115–123.<br />
4. N. Fujitake and M. Kawahigashi, Soil Sci. Plant Nutr., 45 (1999) 359–366.<br />
5. A. Watanabe and N. Fujitake, Anal. Chim. Acta, 618 (2008), 110–115.<br />
6. A. Golchin, J.A. Baldock, P.Clarke, T. Higashi, and J.M. Oads, Geoderma, 76 (1997),<br />
175–192.<br />
7. H. Shindo, N. Ushijima, S. Hiradate, N. Fujitake, and H. Honma, Humic Substances<br />
Res. 1 (2004) 29–37.<br />
8. M.W.I. Schmidt, O.J. Skjemstad, E. Gehrt, and I. Kogel-Knabner, Eur. J. Soil Sci, 50<br />
(1999) 351–365.<br />
9. A. Rodionov, W. Amelung, L. Haumaier, I. U<strong>ru</strong>sevskaja, and W. Zech, J. Plant Nutri.<br />
Soil Sci., 169 (2006) 363–369.<br />
10. R.S. Swift, in D.L. Sparks et al. (Eds.), Methods of Soil Analysis. Part 3. Chemical<br />
methods. Soil Sci. Soc. Am. Book Series: 5, Soil Sci. Soc. Am. Madison, WI., 1996,<br />
p.1018.<br />
11. K.A. Thorn, D.W. Folan, and P. MacCarthy, Water-Resource Investigations Report, US<br />
Geological Survey, 1989, p.<br />
12. C.M. Preston and C.M. Blackwell, Soil Sci., 139 (1985) 88–96.<br />
<strong>Vol</strong>. 2 Page - 65 -
15th IHSS Meeting- <strong>Vol</strong>. 2<br />
Research Theme 4: Molecular markers in soils<br />
<strong>Vol</strong>. 2 Page - 66 -
15th IHSS Meeting- <strong>Vol</strong>. 2<br />
Chemical Composition of Stabilized SOM in Dense Fractions of Allophanic<br />
and non-Allophanic Andosols<br />
Cornelia Rumpel a* , Antonio Rodríguez-Rodríguez b , Carmen D. Arbelo b , Cecilia M. Armas b ,<br />
Jose A. González-Pérez c , Francisco J. González-Vila c , Abad Chabbi a<br />
a BIOEMCO, Campus AgroParisTech, Batiment EGER, France; b Universidad La Laguna,<br />
Dept Edafol. & Geol., San Cristóbal de la Laguna, Tenerife Spain; c CSIC, Instuto de Recursos<br />
Naturales & Agrobiología, Seville 41012, Spain<br />
E-mail: cornelia.<strong>ru</strong>mpel@grignon.inra.fr<br />
1. Introduction<br />
Carbon sequestration in soils is one important strategy to counteract the increasing<br />
atmospheric CO 2 concentrations as it implies a transfer of atmospheric CO 2 into the longliving<br />
soil organic matter (SOM) pools. Of the three processes which may lead to stabilisation<br />
of SOM only interaction with soil mineral was identified to stabilise carbon for more than<br />
decades. At present, we lack information about the carbon types stabilised by this process.<br />
Soil organic matter in subsoil horizons may serve a model to study those organic matter<br />
compounds. One difficulty with the study of carbon stabilised in subsoils is its low abundance<br />
in common soil types. To this end, Andosols provide a unique opportunity to study OM<br />
stabilised by the mineral phase, because they often contain huge amounts of OM with high<br />
carbon concentrations at depth in the soil profile. Moreover, these soils contain high<br />
proportions of iron and aluminium oxides, which were identified as main stabilising agents<br />
for organic matter. Andosols may therefore be prominent soil types to study the OM types<br />
involved in stabilisation and destabilisation processes.<br />
2. Materials and Methods<br />
We sampled all soil horizons of two volcanic soils located on Tenerife Island. Both soils were<br />
located under forest. They were however contrasting with regards to climate and soil<br />
development. Samples were taken from a allophonic Andosol supporting pine forest and a<br />
non-allophanic Andosol supporting laurel forest.<br />
Density fractionation was carried out using Na polytungstate (density: 1.9 g cm- 3 ) to separate<br />
a light fraction and a heavy fraction containing organic matter associated to soil minerals. The<br />
heavy fraction was subjected to demineralization using hydrofluoric acid in order to<br />
determine the contribution of carbon associated intimately with soil minerals.<br />
Organic carbon and N contents were determined by the dry combustion method using a CHN<br />
auto-analyser (CHN NA 1500, Carlo Erba) coupled to an Isochrom III Isotopic mass<br />
<strong>Vol</strong>. 2 Page - 67 -
15th IHSS Meeting- <strong>Vol</strong>. 2<br />
spectrometer (Micromass-GVI Optima), yielding the ratio of stable OC and N isotopes (δ 13 C,<br />
δ 15 N). 14 C activity was measured with the accelerator mass spectrometry (AMS) technique in<br />
the Leibniz Labor für Altersbestimmung, University of Kiel [1].<br />
Analytical pyrolysis was carried out to characterise the molecular composition of organic<br />
matter associated to both density fractions. The bulk chemical composition of the heavy<br />
fraction was analysed by 13 C CPMAS spectroscopy.<br />
3. Results and Discussion<br />
Elemental and isotope composition<br />
The carbon content ranged between 196 and 16 g kg -1 in both soils (Table 1). It was slightly<br />
higher in the non-allophanic Andosol compared to the allophanic Andosol. Stable carbon and<br />
nitrogen isotope ratios were increasing with depth, while the 14 C activity was decreasing with<br />
soil depth and reached a radiocarbon age of several thousand years in the B horizons of both<br />
soils. Carbon and nitrogen associated with the mineral fraction represented 20–30 % of total<br />
in the A horizons and > 68 % of total in the subsoil horizons. As indicated for sandy soils [2],<br />
the 14 C activity of SOM of allophanic as well as non-allophanic Andosols was closely related<br />
to the amount of mineral bound C.<br />
Table 1: Elemental and isotope composition of bulk soil horizons<br />
Horizon depth carbon nitrogen δ 13 C δ 15 N<br />
14 C activity<br />
cm g kg -1 g kg -1 ‰ ‰ pmC<br />
Allophanic Andosol<br />
A1 0-20 123.5 7.8 -26.4 3.4 105.0<br />
A2 20–45 86 6.5 -25.2 4.3 91.8<br />
BW >45 23 1.8 -23.1 6.5 75.8<br />
Non-allophanic Andosol<br />
A1 0-10 196.3 14.0 -26.7 5.3 110.3<br />
A2 10–55 93.9 8.0 -25.8 5.5 91.2<br />
BW 55–81 30.7 2.4 -24.5 5.7 48.7<br />
Bt >81 16.6 1.7 -24.3 6.4 78.7<br />
<strong>Vol</strong>. 2 Page - 68 -
15th IHSS Meeting- <strong>Vol</strong>. 2<br />
Bulk chemical composition as seen by 13 C CPMAS NMR spectroscopy of the mineral bound<br />
fraction was similar in both soils (Fig. 1). The spectra are characterized by a high contribution<br />
of O-alkyl carbon (45–110 ppm) most likely indicating signals derived from polysaccharides.<br />
Allophanic Andosol<br />
Non-allophanic Andosol<br />
A1<br />
A1<br />
A2<br />
A2<br />
300 200 100 0 ppm<br />
300 200 100 0 ppm<br />
Fig. 1: 13 C CPMAS NMR spectra of SOM in the heavy fraction of allophanic and nonallophanic<br />
Andosols.<br />
With soil depth the contribution of signals derived from alkyl carbon (0–45 ppm) seem to<br />
decrease, whereas aromatic carbon (110–160 ppm) is increasing. Analytical pyrolysis<br />
indicates that polysaccharide and N-containing pyrolysis products occur in higher proportions<br />
to mineral bound organic matter with increasing soil depth, whereas the contribution of<br />
lignin-derived pyrolysis products was absent in all horizons of the Allophanic Andosol and<br />
the B horizons of the non-Allophanic Andosol (Fig. 2). The absence of lignin in close<br />
association with the mineral phase has been reported by several authors [3, 4]. The high<br />
aromatic carbon contribution in the NMR spectra may be explained by accumulation of firederived<br />
black carbon, which has already been reported by other authors [5]. In agreement with<br />
the NMR spectra, N-containing and polysaccharide-derived pyrolysis products were found to<br />
dominate in the heavy fraction of most horizons of the allophanic as well as non-allophanic<br />
Andosol. This is in agreement with the decreasing C/N ratio and the increasing stable isotope<br />
ratios indicating the accumulation of highly processed microbial-derived carbon with<br />
increasing soil depth.<br />
<strong>Vol</strong>. 2 Page - 69 -
15th IHSS Meeting- <strong>Vol</strong>. 2<br />
Allophanic Andosol<br />
Non-Allophanic Andosol<br />
A1<br />
A2<br />
Bw<br />
lignin<br />
N-containing<br />
polysaccharide<br />
unspecific<br />
A1<br />
A2<br />
Bw<br />
Bt<br />
0 10 20 30 40 50<br />
0 10 20 30 40<br />
% of TIC % of TIC<br />
Fig. 2: Relative contribution of identified pyrolysis products to the TIC of the heavy fractions<br />
isolated from the allophanic and non-allophanic Andosol.<br />
4. Conclusions<br />
Density fractionation and chemical characterization of the dense fraction was carried out to<br />
study stabilized SOM of an allophanic and a non-allophanic Andosols. Our results show that<br />
carbon stabilized by mineral interactions is located in deep soil horizons and contains a high<br />
proportion of N-containing and polysaccharide-derived compounds.<br />
Acknowledgements<br />
We thank EGIDE for the financial support under the framework of the Acciones Integradas<br />
exchange program. The Lehrstuhl für Bodenkunde, TU München is acknowledged for<br />
providing the NMR spectrometer.<br />
References<br />
1. M.-J. Nadeau, P.M. Grootes, M. Schleicher, P. Hasselberg, A. Rieck, and M. Bitterling, M.,<br />
Radiocarbon, 40, (1998) 239.<br />
2. K. Eusterhues, C. Rumpel, M. Kleber and I. Kögel-Knabner, Organic Geochemistry 34,<br />
(2003) 1591.<br />
3. C. Rumpel, I. Kögel-Knabner and F. B<strong>ru</strong>hn, Organic Geochemistry 33, (2002) 1131.<br />
4. R. Kiem and I. Kögel-Knabner, Soil Biology & Biochemistry, 35, (2003) 101.<br />
5. W.. Dai, T.W. Button, B. Glaser, R.F. Ansley and W. Zech, Soil Biology & Biochemistry<br />
37, (2005) 1879.<br />
<strong>Vol</strong>. 2 Page - 70 -
15th IHSS Meeting- <strong>Vol</strong>. 2<br />
Molecular study of lipids in peat and lignite by sequential chemical<br />
degradation<br />
Radka Bachrata a* , Martina Klucakova a , Laurent Grasset b<br />
a Brno University of Technology, Faculty of Chemistry, Purkynova 118, 612 00 Brno, Czech<br />
Republic; b Université de Poitiers, SRSN, UMR 6514, CNRS, 40 avenue du Recteur Pineau,<br />
86022 Poitiers, France<br />
E-mail: xcbachrata@fch.vutbr.cz<br />
1. Introduction<br />
Directly solvent-extractable lipids (named bitumen components in sediments) are almost<br />
always minor components of soil organic matter but they provide significant information<br />
regarding the sources of organic matter and its diagenetic processes occurring in soils and<br />
sediment yielding humic substances (i.e. humic acids). Moreover, the study of lipids is<br />
essential for understanding dynamic processes of the formation of humic substances [1]. The<br />
aim of this study was to characterize the free bitumen composition of the South-Moravian<br />
lignite (SML) from Mikulčice (Czech Republic). The data are discussed in relation with the<br />
composition of the free lipids of a French Peat located in Frasne (Jura, France) to find out the<br />
link between a young sediment (peat) and an older one (lignite).<br />
2. Materials and Methods<br />
Extraction - the free lipids were obtained using traditional solvent extraction methods. The<br />
extraction was performed by Soxhlet with bidistilled chloroform (6×10 hours). The<br />
chloroform fractions were combined and evaporated to dryness under vacuum.<br />
Separation - the solvent fraction was dissolved again in chloroform to loading on pre-packed<br />
SiO 2·2H 2 O columns (SUPELCO Discovery® SPE DSC-Si Silica Tube).<br />
Lipids were eluted with chloroform, 25 % acetone/chloroform, 100 % acetone, and methanol,<br />
respectively, and the latter fraction was collected as well as residue in silica gel.<br />
Fractions (25 % acetone/chloroform, 100 % acetone, methanol and residue in silica gel) were<br />
saponified, methylated and acetylated (see below). Separation was performed on SiO 2<br />
column. Non-polar fractions were directly analyzed by GC and GC/MS.<br />
Saponification – lipids were saponified by reflux for 6 h under nitrogen with 6% KOH in<br />
methanol/distilled water 9/1 (v/v), then stirring overnight at room temperature to release<br />
bound lipids. The saponified lipids were extracted with chloroform after acidification with<br />
<strong>Vol</strong>. 2 Page - 71 -
15th IHSS Meeting- <strong>Vol</strong>. 2<br />
HCl (pH 1). The solvents were evaporated using a rotary evaporator. The fractions were<br />
transferred to preweight glass vials. They were dried under N 2 and weighted.<br />
Methylation – fractions were methylated with trimethylsilyldiazomethane (TMS-CHN 2 ).<br />
Briefly, 4 mL of chloroform, 2 mL of methanol and 2 mL of TMS-CHN 2 were added to the<br />
dried sample of lipids (1 g). The sample was homogenized on a vortex for 2 hours. The<br />
solvents were dried under N 2 .<br />
Acetylation – before analysis, alkanols and sterols were converted to acetates, catalytic<br />
quantity of pyridine and an excess of acetic anhydride (1 mL) were added to the dry lipids.<br />
The mixture was heated for 20 min at 50 °C and cooled at room temperature overnight. The<br />
reaction was stopped with ice-water (2 mL) to hydrolyse remaining acetic anhydride, and<br />
stirred for additional two hours. The products were extracted with chloroform. The organic<br />
extract (organic phase) was neutralized by saturated solution of NaHCO 3 , and then by<br />
saturated solution of NaCl.<br />
Lipid separation – the separated families were analyzed by capillary GC and GC-MS using a<br />
Hewlett-Packard 6890 GC (split injector, 250 °C; flame ionization Detector (FID), 300 °C)<br />
with a fused silica capillary column (SGE BPX 5 %, 30 m length, 0.25 mm id., 0.25 µm film<br />
thickness) and helium as carrier gas. The GC temperature was increased from 60 to 300 °C at<br />
5 °C min -1 (isothermal for 15 min final time). The GC/MS analyses were performed on a<br />
Trace GC Thermo Finnigan coupled to a Thermo Finnigan Automass (with the same GC<br />
conditions). The MS was operated in the electron impact mode with a 70 eV ion source<br />
energy and the ion separation was operated in a quadripolar filter. The various products were<br />
identified on the basis of their GC retention times, their mass spectra (comparison with<br />
standards) and literature data.<br />
3. Results and Discussion<br />
The GC/MS analysis of lipids from the peat and lignite reveals the occurrence of several<br />
series of components, including alkanes, ketones, alkanols, fatty acids, hydroxy acids and<br />
diacids. These main series are observed in the peat and lignite with different relative<br />
abundances and distributions. The information obtained from these different series is<br />
presented and discussed below in relation with their origin and differences between the peat<br />
and lignite. The less polar fractions were separated from the chloroform fraction extract by<br />
SiO 2 column. Methylation and acetylation were also performed to improve the detection of<br />
the polar lipids. The compounds were identified on the basis of retention time, mass spectra<br />
and by comparison with literature data.<br />
<strong>Vol</strong>. 2 Page - 72 -
15th IHSS Meeting- <strong>Vol</strong>. 2<br />
Peat (bound fatty acids) – Carboxylic acids ranging from C 12 to C 34 (C max at C 22 ) in the<br />
fraction 25 % acetone/chloroform (Fig. 1) and from C 12 to C 30 (C max at C 16 ) in the fraction 100<br />
% acetone with an even-over-odd carbon number predominance are obtained, as shown by the<br />
ion chromatogram at m/z 74 of the methylated acids. The presence of branched acids and<br />
unsaturated C 16:1 , C 18:1 components is also noted in these two fractions. The fatty acid methyl<br />
esters (FAMEs) profile showed a bimodal distribution with C max at C 16 and C 22 . Iso and<br />
anteiso acids appear as minor components. Branched iso- and anteiso-C 15 and C 17 FAMEs are<br />
typical of microbial activity. Such even carbon numbered, long chain (>C 18 ) n-saturated fatty<br />
acids are considered as typical of higher plant epicuticular waxes and are commonly found in<br />
lipid extracts of whole soils [2].<br />
These acids, observed after saponification, can originate either from the cleavage of ester<br />
linkages in high molecular weight and/or highly polar lipids or they can correspond to free<br />
acids [3].<br />
Abundance<br />
C12<br />
iC14<br />
C14<br />
iC15<br />
aC15<br />
C15<br />
iC16<br />
aC16<br />
C16:1<br />
C16<br />
iC17<br />
aC17<br />
C17<br />
C18:1<br />
C18<br />
iC19<br />
aC19<br />
C19<br />
C20<br />
C21<br />
C22<br />
C23C24<br />
C25<br />
C26<br />
C27<br />
C28<br />
C29<br />
C30<br />
C31<br />
C32<br />
C33<br />
C34<br />
Fig. 2 Distribution of FAMEs in peat (25 % acetone/chloroform); a: anteiso, i: iso; 16:1<br />
and 18:1 are monounsaturated acids<br />
Lignite (bound fatty acids) – The fatty acids obtained after saponification are the esterified<br />
acids released by ester cleavage. The distributions of FAMEs ranging from C 12 to C 28 (C max at<br />
C 16 ) in the fraction 25 % acetone/chloroform and from C 12 to C 24 (C max at C 16 ) in the fraction<br />
100 % acetone with an even-over-odd carbon number predominance are obtained.<br />
Comparison with the distribution in the peat shows similar series. The above observation<br />
indicates the presence of branched acids and unsaturated acids.<br />
<strong>Vol</strong>. 2 Page - 73 -
15th IHSS Meeting- <strong>Vol</strong>. 2<br />
These long ester-bound acids probably originate from higher plant components like wax<br />
esters and suberin-derived components. Short FAMEs are typical of microbial activity and are<br />
the most represented in the fraction 25 % acetone/chloroform for both samples.<br />
4. Conclusions<br />
Large differences in the distribution of the various lipid series (free hydrocarbons, free ketons,<br />
bound alkanols, bound fatty acids, bound hydroxy acids, bound diacids and polycyclic<br />
compounds) were observed between peat and lignite samples. The study provides information<br />
on the different lipid sources in these samples. Contribution from higher plant components<br />
(like waxes and wax esters), or microbially reworked plant components (like<br />
depolymerisation products of suberin and cutin) and direct microbial contributions (like fatty<br />
acids, alkanols and alkanes) were thus evidenced.<br />
Comparison of lipid composition in the peat sample and lignite sample revealed marked<br />
differences for all the types of lipids. On the other hand, similarities could be a strong sign of<br />
the preservation of a part of waxes and suberins from higher plants (such as long chained fatty<br />
acids). The odd carbon numbered homologues observed in substantial amounts; probably<br />
originate form partial microbial reworking of the long chain even acids, through α-oxidation<br />
and subsequent chain shortening.<br />
References<br />
1. S.D. Killops and V.J. Killops, An Introduction to Organic Geochemistry, Blackwell<br />
Science Ltd., Oxford, 2004, p. 43, 140, 166.<br />
2. L. Grasset and A. Ambles, J. Anal. Appl. Pyrolysis, 47 (1998) 1.<br />
3. K. Quanea, S. Derenne, C. Largeau, R. Spaccini, G. Bardoux and A. Mariotti, Org.<br />
Geochem., 37 (2006) 20.<br />
¡<br />
<strong>Vol</strong>. 2 Page - 74 -
15th IHSS Meeting- <strong>Vol</strong>. 2<br />
Organic Matter of Buried Soils as a Paleoclimatic Archive of Holocene<br />
Natalia Kovaleva, Ivan Kovalev<br />
Lomonosov Moscow State University, 119992, Leninskie Gory, Moscow, Russia<br />
E-mail: natalia_kovaleva@mail.<strong>ru</strong><br />
1. Introduction<br />
Global warming and impending sea-level rise have attracted increasing interest in regional<br />
climate changes and in the methods of their investigation. The soil cover of the extensive<br />
territories of Eurasian is represented by polygenetic Holocene soils along with soils buried by<br />
late Pleistocene and Holocene loess. Specific features of these soils are due to the action of<br />
elementary modern and relic soil processes, whose age and intensity varied under influence of<br />
glacier movements and climatic fluctuations. These properties could help to elucidate<br />
conditions of soil formation during the Holocene and, as well as, soil organic matter can be<br />
used as indicator of paleoclimatic changes. Soil organic matter is the more informative<br />
paleoarchive of Holocene climatic events, since it may be dated by the radiocarbon, and<br />
isotopic curves may be obtained for soil humic substances.<br />
2. Materials and Methods<br />
A soil chroho-climosequences were studied in Eurasia, focusing in Tian-Shan, Pamiro-Alay,<br />
Caucasus, Khibiny mountains and in the Russian plane.<br />
Diagnosis of ancient pedogenesis was based on criteria with the longest response time,<br />
namely soil morphology and such humus characteristics as the ratio between humic and fulvic<br />
acids content, lignin proportions, optical properties of humic acids, NMR-spectroscopy<br />
characteristics of organic matter, carbon and nitrogen isotope composition of humus, δ 13 C<br />
data and soil age.<br />
3. Results and Discussion<br />
Based on the radiocarbon chronology and soil organic matter properties the following major<br />
climatic events can be reconst<strong>ru</strong>cted: a glacial conditions during the late Pleistocene, a dry<br />
and cold climate during the early Holocene, warm and dry conditions of soil formation in the<br />
middle Holocene, and a moderate humid climate of the late Holocene.<br />
For example, the cold and dry climatic period with mean annual temperature about 5–7 º C<br />
above 0, with little alpine desert vegetation of C-3 type and slightly weathered interstadial<br />
soils can be reconst<strong>ru</strong>cted based on the δ 13 C data at 15000 years BP. At the 8–6 kyr BP, we<br />
<strong>Vol</strong>. 2 Page - 75 -
15th IHSS Meeting- <strong>Vol</strong>. 2<br />
reconst<strong>ru</strong>cted the warm and dry period with mean annual temperature about + 15 degree<br />
above 0, when peats spread out in the piedmonts and lowlands due to glacial melting.<br />
Meadows with C-3 type of plants developed, based on δ 13 C values ranging from -19 to -29 ‰.<br />
Low δ 13 C values in humus may indicate a climate regime with a contrasting dry and wet<br />
season. Based on the low aromatisity of humic asids in this horizon—about 20 %, low values<br />
of the humification index and the coefficient of extinction, proportions of lignin phenols we<br />
can assume, that it was Cambisoils under dry juniper forest in Tian-Shan mountains.<br />
In contrast, in humus horizon with radiocarbon data 10 000 y BP on the altitude about 1000<br />
m in Caucasus we detected mean values of the humification index, the spectral curve slope<br />
with the color coefficient Q>4. The results obtained provide some evidence for the existence<br />
of Lithic Leptosoil and Humic Leptosols under the wet alpine meadows and warm and wetter<br />
climate of early Holocene.<br />
The Holocene optimum events with a warm and dry climate, air temperatures higher than at<br />
the present, a C-3 type of vegetation on the Chernozem soils can be reconst<strong>ru</strong>cted at 6–4 kyr<br />
BP in Tian-Shan, Caucasus and Russian plane. A thick black humus horizon of a relic soils<br />
provides evidence for a warmer and drier period than at present. Infrared spectra show intense<br />
bands for amides and Hydrogen. Very high values of the humification index, high values of<br />
the coefficient of extinction, and the spectral curve slope with the color coefficient 3
15th IHSS Meeting- <strong>Vol</strong>. 2<br />
bioclimatic conditions in the subalpine zone of mountains studied differ appreciably from the<br />
underling horizons with respect to the condensation of aromatic nucleus which are closer to<br />
typical alpine soils.<br />
As δ 13 C and characteristics of organic matter shown, the Arhys interval of middle centures<br />
was characterized by warmer and dryer climate, than at present. Deformatic fluctuations<br />
dominate in IR spectra of the modern suface horizons in comprise with the high energetic<br />
valent fluctuations in the Middle Holocene horizons. The C=C band of aromatic rings bonds<br />
is more intense in spectra of humic acids of Arhus interval soils.<br />
Little ice age advance in mountaines was established at about 200–300 years ago and can be<br />
recognized by low values of humic acids optical density, increasing of Pg–fraction content in<br />
soil organic matter and magnetic susceptibility. It was a cool and wetter period. Soils in initial<br />
stages of formation characterized by the high humus content (up to 15 %), humate-fulvate<br />
type of it, low value of the extinction coefficient (0.06), the considerable green humic acids<br />
content, all of which indicate a humid and cold current climate.<br />
4. Conclusions<br />
That is way Holocene climatic changes in the central Asia seem to coincide with those of<br />
Eastern Europe, northwestern Caucasus, Russian plane and correspond to global climate<br />
changes. Organic matter of buried soils can be used successfully for paleoenvironmental and<br />
paleoclimatic reconst<strong>ru</strong>ctions.<br />
<strong>Vol</strong>. 2 Page - 77 -
15th IHSS Meeting- <strong>Vol</strong>. 2<br />
St<strong>ru</strong>ctural features of soil humic acids as assessed by 13 C nuclear magnetic<br />
resonance and analytical pyrolysis in areas under coffee cultivation in<br />
southeastern Brazil<br />
F.rancisco Alisson S. Xavier a* , Eduardo de Sá Mendonça b , Irene Maria Cardoso a , A. Roig c ,<br />
M. A. Sánchez-Monedero c , J.A. González-Pérez d , F.J. González-Vila d<br />
a Department of Soil, Federal University of Viçosa, 36571-000 Viçosa, MG, Brazil;<br />
b Department of Plant Production, Federal University of Espírito Santo, 29500-000, Alegre,<br />
ES, Brazil; c Centro de Edafología y Biología Aplicada del Segura, CSIC, PO Box 4195,<br />
30080 Murcia, Spain; d Instituto de Recursos Naturales y Agrobiología de Sevilla, CSIC,<br />
Reina Mercedes 10, 41012 Sevilla, Spain<br />
E-mail: alixavi@gmail.com<br />
1. Introduction<br />
Agroforestry systems (AGFs) have been shown to enhance soil organic matter (SOM) levels<br />
when compared to monoculture agricultural systems [1]. Nevertheless, information on the<br />
chemical and st<strong>ru</strong>ctural characterization of SOM in areas under agroforestry remains scarce.<br />
There has been a great deal of interest in the utilisation of more specific and accurate<br />
techniques for characterizing the chemical nature of SOM. Studies have shown that<br />
combining the techniques 13 C nuclear magnetic resonance with cross-polarization magic angle<br />
spinning ( 13 C CP-MAS/NMR) and analytical pyrolysis-gas chromatography-mass<br />
spectrometry (Py-GC/MS) is a valuable tool for st<strong>ru</strong>ctural studies on humic substances [3, 5].<br />
The constant input and quality of organic residues derived from tree-component in AGFs, in<br />
contrast to monoculture systems (full sun coffee), is expected to have an important effect on<br />
the humification processes and consequently on the chemical and st<strong>ru</strong>ctural features of soil<br />
humic substances. Our objective was to identify the qualitative changes of soil humic acids as<br />
influenced by management (agroforestry coffee versus full sun coffee) in areas under coffee<br />
production in the Atlantic Coastal Rainforest domain in the state of Minas Gerais, Brazil.<br />
2. Materials and Methods<br />
The study was carried out in the Zona da Mata (about 36,000 km 2 ), one of most important<br />
domain of the Atlantic Coastal Rainforest Biome, located in the state of Minas Gerais, Brazil.<br />
The region is characterized by a tropical highland climate (average temperature and<br />
precipitation of 18 °C and 1500 mm, respectively, with 2 to 4 months of dry period), and<br />
altitudes ranging from 200 to 1800 m. The parental rock is gneiss and the dominant soil types<br />
are deep and well drained Oxisols.<br />
<strong>Vol</strong>. 2 Page - 78 -
15th IHSS Meeting- <strong>Vol</strong>. 2<br />
The specific studied sites were: (a) Agroforestry-coffee (AGF): An area of approximately<br />
3,150 m 2 with 600 coffee-trees (Coffea arabica L.) spaced in 3.5 m × 1.5 m. Native tree<br />
species were intercropped with coffee. The main representative tree species is Luehea<br />
grandiflora Mart. (common name: Açoita-cavalo); (b) Full sun coffee (FSC): The area had<br />
approximately 2,000 m 2 with 1,000 coffee trees spaced in 2 m × 1 m. There were no trees<br />
intercropped with coffee. Since these areas are considered as smallholding production,<br />
intensive tillage or high fertilizers inputs were not adopted; (c) Native forest (NF): area under<br />
native forest was selected and used to determine the native or steady state condition of soil.<br />
Humic acids (HAs) from 0–5 and 5–10 cm soil depths were extracted and separated according<br />
to the International Humic Substances Society methodology [6]. The precipitated HAs were<br />
purified by successive washes of a mixed-solution of 10% HF + 0.1M HCl. After acid<br />
treatment, the samples were dialyzed by using cellulose membranes (Visking dialysis tubing<br />
36/32) until free of chlorine and then freeze-dried.<br />
The solid-state 13 C NMR spectra of freeze-dried HAs were obtained using a Varian Unity 300<br />
spectrometer operating at a 13 C resonance frequency of 75.42 MHz and a 1 H frequency of 300<br />
MHz. The experiments were performed using cross-polarization with magic angle spinning<br />
(CP-MAS) technique applied with a spectral width of 50 kHz with 90º pulse of 6.7 ms,<br />
contact time of 1.5 ms, spinning speed of 4 kHz, a pulse delay of 4 s and acquisition time of<br />
35 ms. For all samples it was performed 20,000 scans.<br />
Pyrolysis was performed using a double-shot pyrolyzer (Frontier Laboratories, model<br />
Y2020iD) attached to a GC/MS system. The thermal desorption was carried out by increasing<br />
the initial temperature of 100 ºC at a rate of 20 ºC min -1 to a final temperature of 500 ºC held<br />
for 1 min. The GC/MS system was composed by an Agilent 6890 gas chromatograph<br />
equipped with a fused silica capillary column DB17 J&W Scientific (30 m × 0.25 mm ×<br />
0.25µm film thickness), oven temperature was held at 50 ºC for 1 min and then increased up<br />
to 100 ºC at 30 ºC min -1 , from 100 to 300 ºC at 10 ºC min -1 and isothermal at 300 ºC for 10<br />
min using a heating rate of 20 ºC min -1 in the scan modus. Injector and transfer line<br />
temperatures were 250 and 280 ºC, respectively. The carrier gas used was helium with a<br />
controlled flow of 1 mL min -1 . The detector consisted of an Agilent 5973 mass selective<br />
detector (ion source temperature of 230 ºC, mass range 40–800, and 0.7 scan s -1 ) and mass<br />
spectra were acquired with a 70 eV ionizing energy. The pyrolytic fragments were identified<br />
after examining stored (NIST and Wiley libraries) and published data.<br />
<strong>Vol</strong>. 2 Page - 79 -
15th IHSS Meeting- <strong>Vol</strong>. 2<br />
3. Results and Discussion<br />
13 C CP-MAS/NMR assignment was dominated by the O-alkyl C resonance (45–92 ppm)<br />
followed by a resonance line assigned to alkyl C (0–45 ppm). Soil HAs extracted from the<br />
FSC system showed a decrease in the intensity of the peak centered at 56 ppm (methoxyl C),<br />
followed by a slight increase of the peak at 130 ppm in the aromatic C (92–150 ppm)<br />
resonance, when compared to the AGF system. A similar pattern was confirmed by the<br />
previous FTIR analysis (data not show), suggesting that the FSC management seems to favor<br />
the intensification of the process of humification of HA. The higher aromaticity index of HAs<br />
from FSC compared to the AGF system (data not shown) indicates a higher degree of<br />
humification of the humic st<strong>ru</strong>cture, confirming our previous results.<br />
More than 90 pyrolytic compounds were identified by Py-GC/MS of the soil HAs under<br />
different land use (total ions abundance not shown). Table 1 shows the general abundance of<br />
products belonging to specific chemical groups.<br />
Table 1. Abundance (% of SUM) of compounds belonging to specific chemical groups of humic acids extracted<br />
from soils (0–5 cm depth) under native forest (NF), agroforestry-coffee (AGF) and full sun coffee (FSC) systems<br />
in Atlantic Coastal Rainforest biome, Brazil<br />
Land use<br />
Source<br />
NF AGF FSC<br />
Polysaccharides 9.3 11.5 16.0<br />
Non-specific aromatics 31.0 27.5 30.4<br />
Lignins 27.2 35.6 15.4<br />
N-compounds 31.2 21.5 37.0<br />
Lipids 1.3 3.9 1.2<br />
Total 100.0 100.0 100.0<br />
The highest abundances (% of total) were registered by non-specific aromatics and N-<br />
compounds groups, followed by the lowest abundances of lignins, polysaccharides and lipid<br />
compounds. The higher abundance of aromatics and N-compounds over the abundance of<br />
polysaccharides and/or lipids suggests that, under tropical environment, SOM st<strong>ru</strong>cture is<br />
strongly influenced by the high intensity of oxidation processes. In general, the relative<br />
abundance in each specific group was similar among the different land use, with exception to<br />
the higher amounts of lignin-like and lipids compounds in AGF compared to FSC system, and<br />
the higher abundance of N-compounds in FSC (37,0%) than in AGF (21,5%) system. These<br />
results indicate that AGF system influenced the genesis of HAs by favoring a less condensed<br />
st<strong>ru</strong>cture when compared to FSC system. The higher abundance of lignins compounds in the<br />
st<strong>ru</strong>cture is an indicative of recent inputs of plants residues, probably as a result of the<br />
influence of organic material derived from trees. The higher abundance of lipids in AGF<br />
system might be related to as well the higher contribution of microorganisms (e.g. lipids<br />
derived from microbial cells) as from plants waxes [2].<br />
<strong>Vol</strong>. 2 Page - 80 -
15th IHSS Meeting- <strong>Vol</strong>. 2<br />
There were some slight discrepancies in the relative amounts of various chemical groups as<br />
determined by 13 C NMR and by analytical pyrolysis. Py-GC/MS products showed lower<br />
amounts of aliphatic compounds than NMR spectroscopy, which is in agreement with [5].<br />
These authors stated that a numerical coincidence of these two kinds of data should not be<br />
expected basically due to three main reasons: (i) Py-GC/MS is not an ideal method for<br />
distinction of highly polar compounds such as fatty acids; (ii) Each pyrolytic fragment may<br />
contain C atoms that belong to different functional groups as identified by NMR; and (iii)<br />
NMR quantification is based on C environments, whereas each pyrolysis product may have<br />
different C environments. Moreover, the inability of 13 C NMR to detect carbons far removed<br />
from protons, can results in an overestimate of aliphatic carbons [4].<br />
4. Conclusions<br />
The combined use of 13 C CPMAS/NMR with Py-GC/MS was valuable to the study of<br />
st<strong>ru</strong>ctural features of HAs. Pyrolysis provides more detailed information about the molecular<br />
st<strong>ru</strong>cture of SOM. Despite the discrepancies, both techniques indicated that AGF systems<br />
favored the genesis of soil HAs with lower degree of humification when compared to FSC<br />
system, probably by the influence of organic residues (fresh and old) derived from trees.<br />
Acknowledgements<br />
The authors would like to thanks to CTA-ZM and farmers in Zona da Mata for the use of their<br />
lands. Our sincere gratitude is extended to the Centro de Edafología y Biología Aplicada del<br />
Segura (Murcia-Spain) and Instituto de Recursos Naturales y Agrobiología de Sevilla<br />
(Sevilla-Spain) for all scientific and technical assistance. Thanks are due to Trinidad Verdejo<br />
(IRNAS) for her helpful technical assistance. We acknowledge CNPq (Brazilian government)<br />
sponsor of F.A.S. Xavier and E.S. Mendonça.<br />
References<br />
1. E.S. Mendonça, L.F.C. Leite and P.S. Ferreira Neto, Revista Árvore, 25 (2001) 375.<br />
2. I.D. Bull, P.F. van Bergen, C.J. Nott, P.R. Poulton and R.P. Evershed, Org. Geochem., 31<br />
(2000) 389.<br />
3. J. Zhang, J. Zhai, F. Zhao and Z. Tao, Analytica Chimica Acta, 378 (1999) 177.<br />
4. N. Poirier, S. Derenne, J.N. Rouzaud, C. Largeau, A. Mariotti, J. Balesdent and J. Maquet,<br />
Org. Geochem., 31 (2000) 813.<br />
5. P. Buurman, K.G.J. Nierop, J. Kaal and N. Senesi, Geoderma, 150 (2009) 10.<br />
6. R.S. Swift, in D.L. Sparks, A.L. Page, P.A. Helmke, R.H. Loeppert, P.N. Soltanpour, M.A.<br />
Tabatabai, C.T. Johnston, M.E. Summer (Ed.), Organic Matter Characterization, Part 3,<br />
Soil Science Society of America/American Society of Agronomy, Madison, 1996, p. 1011.<br />
<strong>Vol</strong>. 2 Page - 81 -
15th IHSS Meeting- <strong>Vol</strong>. 2<br />
Influence of the Vegetation Cover in the Soil Biomarker Assemblage Under<br />
Rhododendron and Oak Stands<br />
F. J. González-Vila a* , J. A. González-Pérez a , C. Marfil a , M. E. Arias b , J. Rodríguez b ,<br />
T. Marañón a , L. Clemente a<br />
a IRNAS, CSIC, P.O. Box 1052, 41080 Sevilla, Spain; b Departamento de Microbiología y<br />
Parasitología, Universidad de Alcalá, 28871 Madrid, Spain<br />
E-mail: fjgon@irnase.csic.es<br />
1. Introduction<br />
Rhododendron ponticum L. ssp. baeticum (Boissier & Reuter) Handel-Mazzetti is a relict of<br />
the Tertiary forest that persists in moist habitats, in SW Spain and Southern and Central<br />
Portugal. Is an aggressive invader of temperate deciduous forests, in Western and Central<br />
Europe [1]. The ecological study of Rhododendron in its native habitat is relevant for the<br />
conservation of plant communities subjected to invasion worldwide. Factors determining<br />
present area limitation and ecological constraints restricting the expansion have been reported<br />
[2]. However the influence of soil organic matter molecular composition is still poorly<br />
understood. Among its different fractions, lipids play a key role in the relationship between<br />
plants and their environments [3]. This is relevant since a frequent observation in temperate<br />
forests invaded by Rhododendron is the accumulation of plant litter on the soil surface. The<br />
high content of secondary compounds in leaves deterring herbivores, can contribute to<br />
invading success [4], but also allelopathic effects on soil biota and accompanying vegetation<br />
may also occur. In this work a comparative GC/MS study of biomarker assemblage is<br />
performed in soil under Rhododendron stands and adjacent sites with deciduous oak, Quercus<br />
canariensis Willd., in Southern Spain (Sierra de Luna, Cádiz).<br />
2. Materials and Methods<br />
The Aljibe Mountains, where R. ponticum this species is most abundant in the Iberian<br />
Peninsula, was chosen as the study area. It is located at the Southern tip of the Iberian<br />
Peninsula, and occupies the Northern side of the Strait of Gibraltar. Soil samples were taken<br />
after removing the litter layer at the soil surface (A: 0–10 cm) and from a deeper layer (B: 10–<br />
20 cm) from three well differentiated sites (Table 1). Soil samples (10 g) were Soxhlet<br />
extracted with a dichloromethane-methanol (3:1) mixture for 48 hours. Total extracts were<br />
saponified with 0.5 mol/L KOH/methanol for 2 hours under reflux. Neutral lipids were<br />
isolated by extraction with n-hexane, and acidic lipids were isolated with dichloromethane<br />
after acidification to pH
15th IHSS Meeting- <strong>Vol</strong>. 2<br />
(BSTFA) before analysis by GC/MS (Hewlett-Packard GCD). Separation of acidic and<br />
neutral compounds was achieved using a SE-52 fused silica capillary column (30 m × 0.32<br />
mm i.d., film thickness of 0.25 μm). The column oven temperature was programmed to<br />
increase from 40 to 100 °C at 30 °C min -1 and then to 300 °C at 6 °C min -1 . Helium was used<br />
as carrier gas at a flow rate of 1.5 mL min -1 . Mass spectra were measured at 70 eV ionizing<br />
energy. Individual compounds were identified by their mass fragments, key single ion<br />
monitoring (SIM) for homologous lipid series, low resolution mass spectrometry and by<br />
comparison with published mass spectra libraries (NIST and Wiley).<br />
Site 1:<br />
Quercus canariensis<br />
forest<br />
Site 2:<br />
Quercus +<br />
Rhododendron forest<br />
Table 1. Geographical location and codes of the soil samples<br />
Rhododendron stand<br />
Quercus stand<br />
Rhododendron stand<br />
Quercus stand<br />
Code Deep (cm) Georeference<br />
R1A 0–10<br />
R1B 10–20<br />
Q1A 0–10<br />
Q1B 10–20<br />
R2A 0–10<br />
R2B 10–20<br />
Q2A 0–10<br />
Q2B 10–20<br />
Site 3:<br />
R3A 0–10<br />
Rhododendron ponticum<br />
forest R3B 10–20<br />
3. Results<br />
N 36 º 6´ 19.4´´<br />
W 5 º 32´ 21.1´´<br />
N 36º 5´ 50.7´´<br />
W 5º 31´ 57.7´´<br />
N 36º 6´ 21.8´´<br />
W 5º 32´ 19.7´´<br />
A homologous series of C 15 –C 31 n-alkanes showing a bimodal distribution with maxima at<br />
C 19 or C 21 and C 27 or C 29 and a clear odd/even predominance was observed in all the samples.<br />
A higher predominance of long chains homologues was observed in the subsoil under<br />
Rhododendron (R1B, R2B and R3B). Low molecular weight homologues (C 20 / 20 /C< 20 increases in the<br />
<strong>Vol</strong>. 2 Page - 83 -
15th IHSS Meeting- <strong>Vol</strong>. 2<br />
deeper layers. In all samples, branched iso- and anteiso-C 15 and C 17 and β-hydroxy fatty acids<br />
were also found. The abundance of these compounds decreases with depth in samples Q1 and<br />
R3 and increase in the others. In addition, monounsaturated C 16 and C 18 acids and some<br />
polyunsaturated fatty acids (C 18:2 and C 18:3 ), derived largely from autochthonous algae but<br />
also from higher plants [6], were also detected.<br />
Normal alcohols (n-alkanols) occurred in the range C 12 –C 30 with a strong even-to-odd carbon<br />
number predominance and maxima at C 22 . In general,<br />
homologues < C 20 were more abundant in the deeper<br />
layers. Also branched alcohols (C 15 –C 26 ) were found,<br />
being more abundant in the topsoil. Likewise a series of<br />
n-alcan-2-ols (C 14 – C 26 ) were identified. A homologous<br />
series of alkan-2-ones in the range C 14 –C 24 was found in<br />
all the soil samples. The molecular distribution shows a<br />
predominance of even numbered carbon chains with<br />
maximum at C 22 .<br />
A well-resolved pattern of sterols was found (Fig. 1).<br />
Likewise, the main sterol components were reported to<br />
build up the steryl esters (sitosteryl acetate, stigmasteryl<br />
acetate) identified in Rhododendron species [7]. Among<br />
the sterols, β-sitosterol (#6), α-amyrin (#9) and friedelin<br />
(#16), were the most abundant. These compounds were<br />
also previously reported as constituents of Quercus and<br />
Fig.1. Distribution of sterols and<br />
terpenes in lipid extracts from the soil Rhododendron species [8]. Brassicasterol (24-methyl<br />
surface sample (0–10 cm).<br />
cholest-5,22-dien-3β-ol) (#2), a 28 C atoms sterol, was<br />
also present in the sterol assemblage, being a typical marker for microalgae [9] although is<br />
also produced by higher plants. The pentacyclic triterpenes taraxenone (#5) (friedoolean-14-<br />
en-3-one) and friedoolean-14-en-ol (#8) were detected only in soils under ericaceae<br />
(Rhododendron).<br />
4. Conclusions<br />
More than one hundred compounds were separated and identified by GC/MS in the soil lipid<br />
fraction, mainly alkanes, alcohols and fatty acids, which were accompanied by a large number<br />
of cyclic compounds: monoterpenes, sesquiterpenes, diterpenes, triterpenes and sterols. There<br />
were apparent compositional differences between lipids extracted from soils under different<br />
<strong>Vol</strong>. 2 Page - 84 -
15th IHSS Meeting- <strong>Vol</strong>. 2<br />
vegetation covers, as well as with soil depth. The distribution of n-alkanes with bimodal<br />
distribution and odd/even predominance observed is compatible with inputs from epicuticular<br />
waxes and protective layers of vascular plants [10]. The unexpected high values of low<br />
molecular weight homologues (C 20 in deeper<br />
layers could be justified by the preservation of epicuticular waxes in depth. The fatty acids,<br />
that also presented a bimodal distribution, reveal in the same way a selective preservation of<br />
long chain fatty acids with depth. Indication of high microbial activity is detected by the<br />
presence of branched iso- and anteiso- and β-hydroxy fatty acids, monounsaturated and<br />
polyunsaturated fatty acids and the sterol brassicasterol. A pattern of sterol markers was found<br />
in the soil lipds. These terpenoids are considered valuable biomarkers for plant species. In this<br />
study, the sterols taraxenone and friedoolean-14-en-ol, were detected only in soils under<br />
Rhododendron. These pentacyclic triterpenes were previously found in ericaceae plant<br />
material and in soils under this plant family [11]. Therefore, these terpenes are molecular<br />
marker candidates for the direct input of ericaceae plants to soils.<br />
References<br />
1. J. Travis, Bull. British Ecological Society, 34 (2003) 35.<br />
2. J. A. Mejías, J. Arroyo, T. Marañón, J. Biogeogr. 34 (2007) 456.<br />
3. G. Jandl, P. Leinweber, H. R. Schulten, Biol. Fertil Soils 43 (2007) 321.<br />
4. J. A Balsdon, K. E. Espelie, S. K. Braman, Biochem. Syst. Ecol. 23 (1995) 477.<br />
5. L. Schwark, K.Zink, J. Lechterbeck, Geoogy. 30 (2002) 463.<br />
6. E. A. Canuel, K. H. Freeman, S. G. Wakeham,. Limnol. Oceanogr. 42 (1997): 1570.<br />
7. D .Evans, B .A. Knights, V.B.Math, Phytochemistry 14 (1975) 2453.<br />
8. R. F. Chandler, S.N.Hooper, Phytochemistry 18 (1979) 711.<br />
9. J. K. <strong>Vol</strong>kman, Org. Geochem. 9 (1986) 83.<br />
10. A. Amblès, P. Magnoux, P.Jambu, R.Jacquesy, E.Fustec, J. Soil Sci. 40 (1989) 685.<br />
11. B. Jansen, K .G .J. Nierop, F. H. Tonneijck, F. W .M.van der Wielen, J.M.Verstraten,<br />
Plant Soil, 291 (2007) 181.<br />
<strong>Vol</strong>. 2 Page - 85 -
15th IHSS Meeting- <strong>Vol</strong>. 2<br />
Research Theme 5: Dissolved organic molecules in soils: origin,<br />
functionality and transport<br />
<strong>Vol</strong>. 2 Page - 86 -
15th IHSS Meeting- <strong>Vol</strong>. 2<br />
A Novel Approach To Analyzing Dissolved Organic Matter In Ice Core<br />
Samples By Fourier Transform Ion Cyclotron Mass Spectrometry<br />
Joshua J. S. Marsh a , Patrick G. Hatcher a , Amanda M. Grannas b , Vanessa L. Boschi b , Nicole<br />
L. Harmuth b<br />
a Old Dominion University, Department of Chemistry and Biochemistry, 4541 Hampton<br />
Boulevard, Norfolk, VA 23529-0126; 2 Villanova University, Department of Chemistry,<br />
Mendel Hall, Villanova, PA 19085<br />
E-mail: jmarsh@odu.edu<br />
1. Introduction<br />
The molecular composition of dissolved organic matter (DOM) is a topic that has been<br />
growing in interest over the past several years with the advent of many new sophisticated<br />
analytical methods, especially ultrahigh resolution mass spectrometry [1]. Unfortunately,<br />
meltwater from ice cores contains low concentrations of DOM, and this has provided a<br />
challenge to those interested in dissecting ice-core DOM for answers relating to past climates<br />
and hydrological conditions [2]. Concentrating the DOM from water has traditionally been<br />
accomplished by use of resin adsorption, typically XAD or C 18 [3]. For such low<br />
concentrations to provide sufficient material for analysis, researchers have resorted to use of<br />
large volumes, but large volumes of water from ice cores are not reasonably obtained.<br />
Moreover, it has recently been demonstrated by our group that the C 18 adsorption method<br />
selectively excludes certain types of compounds and recovers less than 50% of the DOM. For<br />
the past several years, we have sought to employ approaches that minimize the loss of DOM<br />
compounds during isolation or allow us to directly analyze DOM at natural abundance [4].<br />
We report here, for the first time, the ability to directly analyze ice-core melt water by Fourier<br />
transform ion cyclotron resonance mass spectrometry (FTICR-MS) using only rotary<br />
evaporation as a concentration method.<br />
2. Materials and Methods<br />
Ice core samples were collected from Greenland and Antarctic sites and were sent by the<br />
national ice core laboratory (NICL) from the USGS NICL located in Denver, Colorado. These<br />
samples were dry drilled so that there would be no contamination or interference from drilling<br />
fluids. These samples were selected for their presumed types and amount of DOM. All ice<br />
core samples (11) measured 35 cm in length (3 × 3 cm in area) and were stored in a freezer (-<br />
20 º C) in their original packaging.<br />
<strong>Vol</strong>. 2 Page - 87 -
15th IHSS Meeting- <strong>Vol</strong>. 2<br />
Each ice core was melted within a laminar flow hood or clean room environment (for<br />
comparison). Each sample was rinsed (0.5 cm of core rinsed off [2]) and melted for<br />
approximately 1–2 hours. Approximately 250 mL of melt water was collected and<br />
concentrated by a factor of ten using a rotary evaporator. The total organic carbon was<br />
measured with a total organic carbon (TOC) analyzer (Shimadzu TOC-V CPH ).<br />
All samples were analyzed for positive ions by using a FTICR-MS [2]. Exactly 300 μL of<br />
each sample was mixed with 100 μL of LC-MS grade methanol and 0.1% formic acid<br />
additive to increase the ionization efficiency. Samples were injected using a syringe pump at a<br />
flow rate of 2 μL/min. Optimal results were achieved by using specific inst<strong>ru</strong>mental<br />
parameters (300 scans, 5.0 sec. ion accumulation, 4.0 M acquisition size).<br />
3. Results and Discussion<br />
The TOC data displayed in Table 1 show that the DOM concentration of each ice core sample<br />
is very low. Half of the samples contain less than 70 ppb TOC and the other half are below<br />
the detection limit. For that reason, a manual injection procedure is currently being conducted<br />
to increase the sensitivity of the inst<strong>ru</strong>ment and thereby reduce the volumes needed for TOC<br />
analyses.<br />
The FTICR-MS data displayed in Figs. 2 and 3 show the mass spectral data obtained by<br />
analyzing three different ice core sites. These sites were chosen because they portray the<br />
different types of environments in which ice can be deposited (high accumulation, low<br />
accumulation, off-shore, near shore, etc.). Each site should, in theory, reflect different types of<br />
organic compounds while still retaining some similarities. It can be seen that each spect<strong>ru</strong>m is<br />
individually unique. We are currently assigning molecular formulas to the thousands of peaks<br />
in each spect<strong>ru</strong>m to gain insights on the molecular compositions of each respective DOM. It is<br />
noteworthy that, unlike FTICR-MS spectra of riverine DOM from previous studies [1,3,4],<br />
the spectra show discrete mass spectral amplifications in specific mass regions.<br />
Of great significance is that we have established that small amounts of water available from<br />
ice-cores are readily analyzed by this approach. This opens the door to detailed molecular<br />
characterization of the DOM from these types of samples with little processing and use of<br />
methods that minimize contamination and avoid use of adsorbents that have the potential to<br />
fractionate the DOM components.<br />
<strong>Vol</strong>. 2 Page - 88 -
15th IHSS Meeting- <strong>Vol</strong>. 2<br />
Table 1. TOC data for rotary evaporated ice core samples<br />
Sample Name Amount rinsed off edges TOC core ppb<br />
SiteA2 94-94.35 0.5 cm 69.1<br />
SiteA2 94-94.35 2 mm 18.3<br />
SiteA2 94.645-95 2 mm 7.5<br />
SP04-C5 A 0.5 cm BDL<br />
SP04-C5 B 2 mm 50.9<br />
BEN 5 A 0.5 cm BDL<br />
BEN 5 B 0.5 cm BDL<br />
BEN 5 C 2 mm BDL<br />
Blank - BDL<br />
BDL: Below Detection Limit<br />
Figure 2. FTICR-MS broad spectral data for ice core samples obtained from Greenland, West<br />
Antarctica, and South Pole sites.<br />
<strong>Vol</strong>. 2 Page - 89 -
15th IHSS Meeting- <strong>Vol</strong>. 2<br />
Figure 3. FTICR-MS spectra for a specific m/z ranges (530-580) for ice core samples<br />
obtained from Greenland, West Antarctica, and South Pole sites.<br />
4. Conclusions<br />
It has been determined that DOM can be found in ice core samples at low concentrations by<br />
FTICR-MS techniques without using C 18 extraction. This information can be used to<br />
characterize the types of organic compounds that are present. Employing FTICR-MS for the<br />
study of ice core organic matter can provide a new understanding of the nature of this organic<br />
matter, leading to the discovery of multitudes of molecular species indicative of global change<br />
processes whose abundances can be compared with other change proxies (isotopes, etc.).<br />
Ultrahigh-resolution FTICR-MS now presents us with the opportunity to expand the wealth of<br />
knowledge that ice cores could provide for the glaciology, atmospheric and climate<br />
communities.<br />
Acknowledgements<br />
Work supported by the National Science Foundation Antarctic program, grant nr. 0739684<br />
References<br />
1. R. L. Sleighter, P. G. Hatcher, Mass Spectrom. J., 42 (2007) 559.<br />
2. A.M. Grannas, et. al., Geophys. Res. J., D04304 (2006) 1.<br />
3. S. Kim, et. al., Org. Geochem., 34 (2003) 1325.<br />
4. R.L. Sleighter, G. A. Mckee, P.G. Hatcher, Org. Geochem., 40 (2009) 119.<br />
<strong>Vol</strong>. 2 Page - 90 -
15th IHSS Meeting- <strong>Vol</strong>. 2<br />
Distribution of Protein-like components in electrophoretic fractions of<br />
humic substances from soils and their litter layers<br />
Oleg T<strong>ru</strong>betskoj a *, Nikolai Ganzhara b , Olga. T<strong>ru</strong>betskaya c<br />
a<br />
Institute of Fundamental Problems of Biology, Russian Academy of Sciences, Pushchino,<br />
Moscow region, 142290, Russia; b Russian State Agrarian University–Timiryazev<br />
Agricultural Academy, ul. Timiryazeva 49, Moscow, 127550, Russia; c Shemyakin–<br />
Ovchinnikov Institute of Bioorganic Chemistry, Pushchino Branch, Russian Academy of<br />
Sciences, Pushchino, Moscow region, 142290, Russia.<br />
E-mail: t<strong>ru</strong>b@fibkh.serpukhov.su<br />
1. Introduction<br />
Humification, the process whereby biomass consisting of dead plant and animal remains is<br />
converted into soil humic substances (HS), is one of the basic process of the carbon cycle. It<br />
is known that humification involves the biotic and abiotic transformations of soil litter layer<br />
materials into mature HS. However, the ways of transformation of litter layer proteins into HS<br />
are still unclear. The aim of this work was to use electrophoresis for the comparative analysis<br />
of HS and their protein-like components from different soils and their litter layers.<br />
2. Materials and Methods<br />
Identical quantities of HS, extracted from litter layers and A horizons of Chernozem,<br />
Podzolic, and Chestnut soils, have been fractionated by 10% polyacrylamide gel<br />
elecrophoresis in the presence of denaturing agents (7M urea and SDS) according to<br />
T<strong>ru</strong>betskoj et al. [1]. After electrophoresis, the gel with naturally colored bands of HS was<br />
photographed and then stained with a protein-specific dye by immersing in a solution<br />
containing 15% acetic acid, 15% ethanol, 0.025% Coomassie Brilliant Blue R-250, and 1%<br />
CuSO 4 . Next, the gel was washed to a transparent background with a solution containing 10%<br />
acetic acid and 10% ethanol for 24 h. The colored gel was then photographed.<br />
3. Results and Discussion<br />
During the electrophoresis all HS samples were separated into four discrete fractions: A - or<br />
start zone, that did not move into the gel, B, C, and D were three narrow, intensely naturally<br />
colored zones (Fig. 1). It has been shown previously, that MS of electrophoretic fractions<br />
decreased with increasing of their EM [2]. The natural brown color of electrophoretic zones B<br />
and C+D was more intensive in Chestnut and Chernozem soil HS than in corresponding litter<br />
layer HS. On the other hand in Podzolic soil the controversy picture has been observed. After<br />
electrophoresis the gel slab was stained under gentle continuous stirring in a solution, which<br />
specific for proteins. High MS fractions A, which did not enter into the 10% polyacrylamide<br />
<strong>Vol</strong>. 2 Page - 91 -
15th IHSS Meeting- <strong>Vol</strong>. 2<br />
gel, were colored by the protein-specific dye in both all soil and litter layer HSs. While<br />
fraction B was well colored by the protein-specific blue dye only in all litter layer-derived<br />
HSs. At the same time, fractions B from the soil HSs were almost not colored by this dye,<br />
which indicated a significant transformation of proteins during the humification of litter layers<br />
(because of monochrome printing, the blue color of fractions A and B in Fig. 1 look like more<br />
intensive gray in part II, than in part I). Low MS fractions C+D of both soils and litter layers<br />
HSs were not colored by the protein-specific dye. It is in coincidence with data that in all<br />
investigated soil HAs high MS fraction A was enriched in amino acids, and fraction C+D<br />
practically lost this compounds [3].<br />
Figure 1. Polyacrylamide gel electrophoresis of 0.15 mg HS isolated (1) from three soils of different geneses and<br />
(2) corresponding litter layers. A, B, and C+D are electrophoretic zones of soil- and litter layer-derived HS.<br />
4. Conclusions<br />
The electrophoretic fractions of litter layer-derived HS, where proteins undergo considerable<br />
transformation during the humification process into the soil HS, have been found. These data<br />
could be useful for understanding the ways and mechanisms of soil HS formation.<br />
Acknowledgements: The work has been supported by INTAS grant 06-8055.<br />
References<br />
1. T<strong>ru</strong>betskoj O.A., Kudryavceva L.Yu., Shirshova L.T. 1991. Soil Biol. Biochem. 23, 1179–<br />
1181.<br />
2. T<strong>ru</strong>betskoj O.A., T<strong>ru</strong>betskaya O.E., Reznikova O.I., Afanasieva G.V., Saiz-Jimenez C.<br />
1997. J. Chromatogr. A 767, 285–292.<br />
3. T<strong>ru</strong>betskaya O.E., T<strong>ru</strong>betskoj O.A., Afanas’eva G.V., Reznikova O.I., Markova L.F.,<br />
Muranova T.A. 1998. Environ. Internat. 24, 573–581.<br />
<strong>Vol</strong>. 2 Page - 92 -
15th IHSS Meeting- <strong>Vol</strong>. 2<br />
Soil Liquid Phase pH-Controlling Role of Water-Soluble Organic<br />
Compounds in Presence of Extra Heavy Metal Concentrations<br />
Ivan Makarychev a *<br />
a Moscow State University, Faculty of Soil Science, 119992, Leninskie Gory, Moscow, Russia<br />
E-mail: makyvan@yandex.<strong>ru</strong><br />
1. Introduction<br />
Water-soluble organic compounds play one of leading roles in controlling liquid phase pH<br />
level of humid soils due to functional groups they possess. As these compounds can show<br />
acid properties as well as base properties, they perform pH-buffering role in soil solutions. In<br />
liquid phases of soils exposed to heavy metal contamination dissolved organic compounds<br />
enter into reaction with heavy metal ions. Considering a high ability of heavy metal ions to<br />
interact with organic compounds it may be supposed that this interaction can change acidbase<br />
properties of these compounds and their pH-buffering capacity.<br />
2. Materials and Methods<br />
In order to study the influence of the interactions between water-soluble organic compounds<br />
and heavy metal ions potentiometric titration was applied. Podzolic (horizon of litter) and<br />
soddy (soddy horizon) soils of Tverskoy region of Russia were studied. Water extract were<br />
obtained by daily extraction of soil samples with distilled water (ratios soil: water were 1: 5<br />
for organic horizon and 1: 2 for mineral horizon). The C org content and pH level of extracts<br />
were determined. Water extracts were titrated with the 0.01 M Cu(NO 3 ) 2 solution with the pH<br />
level 3.8. The level of pH and activity of Cu 2+ -ions in the extracts were controlled by selective<br />
electrodes during the titration. Water extracts were also titrated with 0.01 M HgCl 2 solution<br />
with pH 4.1 and 0.01 M Hg(NO 3 ) 2 solution with pH 2.0. During these titrations pH level was<br />
controlled.<br />
3. Results and Discussion<br />
Water extract from soddy soil had pH 6.5 and C org content 96 mg/l, whereas water extract<br />
from podzolic soil had pH 4.6 and C org content 240 mg/l. During titrations of extracts their<br />
pH levels decreased. Rapid decrease of pH level was observed at the beginning of titration,<br />
when free Cu 2+ ions were removed from the solution and included in the complexes with<br />
organic matter as Cu-selective electrode showed. Considering this it can be concluded that it<br />
is a complexing process between dissolved organic compounds and Cu 2+ ions that served as a<br />
source of protons released into a solution. Cu 2+ ions displaced protons from –COOH groups<br />
<strong>Vol</strong>. 2 Page - 93 -
15th IHSS Meeting- <strong>Vol</strong>. 2<br />
of organic compounds. Another source of acidification of extracts was hydrolysis of Cu 2+<br />
ions. This source exhibited when complex formation capacity of dissolved organic<br />
compounds was consumed. By means of Langmuir equation maximal complex formation<br />
capacity and lgK were calculated. For extracts from soddy horizon they amounted to 0.24<br />
mmol/l and 5.4 respectively whereas for extracts from horizon of litter they amounted to 0.30<br />
mmol/l and 3.9 respectively. Complex formation capacity of extracts from litter was higher<br />
because of higher dissolved organic matter content but lgK was lower because of lower pH<br />
level than in extracts from soddy horizon. During titrations pH level of extracts from soddy<br />
horizon decreased from 6.5 to 5.7, whereas pH level of extracts from horizon of litter<br />
decreased from 4.6 to 4.3. Decrease of pH of soddy horizon extracts was more significant due<br />
to higher initial pH level and lower buffer capacity of these extracts.<br />
Titrations of extracts with HgCl 2 and Hg(NO 3 ) 2 solutions showed an anion ability to control<br />
the behavior of heavy metal ions. Chloride-ion forms stable complexes with Hg 2+ ions and<br />
preserve it from hydrolysis as well as interaction with organic compounds, so HgCl 2 solution<br />
had relatively high pH level and low capacity to acidify soil extracts (from pH 6.5 to 6.0 in<br />
extracts from soddy horizon and from 4.6 to 4.5 in extracts from litter). Nitrate-ion does not<br />
form stable complexes with Hg 2+ ions, so Hg(NO 3 ) 2 solution had pH 2.0 due to hydrolysis<br />
and Hg 2+ ions could interact with organic compounds. Interactions between heavy metals and<br />
soil organic compounds can also change pH-buffering capacity of these compounds. It is<br />
confirmed by comparing titrations with Hg(NO 3 ) 2 solution and HCl solution of the same pH<br />
level. During the titration with Hg(NO 3 ) 2 solution extracts from soddy horizon showed less<br />
pH-buffering capacity than during the titration with HCl solution. The difference amounted to<br />
0.84 mmol/l. The reasons were that Hg 2+ ions blocked –COO - functional groups that have<br />
buffering capacity and also displaced extra protons from –COOH groups into the solution.<br />
4. Conclusions<br />
In presence of extra heavy metal concentrations water-soluble organic compounds react with<br />
heavy metal ions, which leads to change of acid-base properties of these compounds: an extra<br />
proton release, lower pH-buffering capacity, and ultimately, to acidification of soil liquid<br />
phase. Another source of acidification is hydrolysis of metal ions.<br />
<strong>Vol</strong>. 2 Page - 94 -
15th IHSS Meeting- <strong>Vol</strong>. 2<br />
St<strong>ru</strong>ctural Analysis of Dissolved Organic Matter with Hydrophilic<br />
Interaction Liquid Chromatography and Nuclear Magnetic Resonance<br />
Spectroscopy<br />
Gwen C. Woods, Myrna J. Simpson, Andre J. Simpson*<br />
Department of Chemistry, University of Toronto, Scarborough, Ontario M1C 1A4, Canada<br />
E-mail: gwen.woods@utoronto.ca<br />
1. Introduction<br />
Comprised of thousands of unknown constituents, dissolved organic matter (DOM) is thought<br />
to be one of the most complex natural mixtures on Earth [1]. Of the many analytical<br />
techniques applied to the st<strong>ru</strong>ctural analyses of DOM, nuclear magnetic resonance (NMR)<br />
spectroscopy is amongst the most promising techniques for the st<strong>ru</strong>ctural characterization of<br />
unknown compounds. The severe signal overlap, however, generated from NMR detection of<br />
DOM inhibits our ability to access molecular-level information of this extremely<br />
heterogeneous substance. Separation into more homogenous fractions is a fitting solution to<br />
overlapping signals but chromatographic separations such as those afforded by high<br />
performance liquid chromatography (HPLC) have traditionally been poorly resolved when<br />
applied to DOM separations. The aim of the research presented here was to explore the<br />
potential of hydrophilic interaction liquid chromatography (HILIC) as a tool for simplifying<br />
DOM prior to NMR analyses. HILIC is an attractive option compared to many reverse phase<br />
HPLC techniques as it is ideal for separating more polar constituents such as might be found<br />
in the highly degraded and oxidized molecules of DOM. In addition to NMR analyses,<br />
HILIC-generated DOM fractions were analyzed with excitation-emission matrix (EEM)<br />
fluorescence spectroscopy as a means of correlating NMR-derived st<strong>ru</strong>ctural information with<br />
fluorescence characteristics.<br />
2. Materials and Methods<br />
IHSS Suwannee River Natural Organic Matter (SRNOM) was separated on an Agilent 1200<br />
Series HPLC system with a Phenomenex Luna HILIC column. The mobile phase consisted of<br />
a complex gradient elution of acetonitrile and water with a continuous addition of 5mM<br />
ammonium acetate over a period of 220 minutes. 80 fractions were collected over repeated<br />
<strong>ru</strong>ns; fractions were N 2 -blown down, diluted with water and freeze dried. Resulting material<br />
was reconstituted in D 2 O with NaOD and analyzed via NMR. Solution-state 1 H NMR<br />
experiments were conducted on a B<strong>ru</strong>ker Avance TM 500 inst<strong>ru</strong>ment with a 1.7mm<br />
microprobe. Fluorescence measurements were obtained on an Agilent 1200 fluorescence<br />
<strong>Vol</strong>. 2 Page - 95 -
15th IHSS Meeting- <strong>Vol</strong>. 2<br />
detector equipped with an offline cuvette. Resulting 3-D EEM’s were analyzed with parallel<br />
factor analysis (PARAFAC) to decipher fluorophores, groups of fluorophores, or fluorescence<br />
phenomena (e.g. charge-transfer processes) that contribute to the overall fluorescence signal.<br />
3. Results and Discussion<br />
The material eluted from the HILIC column revealed significant variation from the earliest to<br />
latest-eluting material (see Figure 1). Carbohydrate-material was found to increase with<br />
polarity while material associated with carboxyl-rich alicyclic molecules (CRAM) [2] as well<br />
as signal coming from the region characterized as material derived from linear terpenoids<br />
(MDLT) [3] were found to decrease with polarity. Aromatics were not correlated with<br />
polarity but were found most prominent in mid-polar fractions. The PARAFAC analyses<br />
revealed seven components responsible for the fluorescence of all 80 fractions. Two of the<br />
seven PARAFAC components had signals with appropriate excitation/emission maxima to<br />
suggest tryptophan and tyrosine fluorescence. Previous research has suggested that quinones<br />
may contribute to some of the PARAFAC-derived components of DOM [4,5]. Possible<br />
quinone-influenced fluorescence was found to characterize four of the components. Evidence<br />
was found to suggest that the final component is also a product of tryptophan fluorescence,<br />
but more specifically of tryptophan associated with hydrophobic domains. Two fractions had<br />
very intense fluorescence signals and PARAFAC loadings indicate that they each are<br />
primarily characterized by a single component. The less polar of the two fractions is<br />
characterized as quinone-influenced while the second, much more polar fraction essentially<br />
appears to be dominated by tryptophan fluorescence.<br />
The NMR and fluorescence data provide insight into the st<strong>ru</strong>ctural components present in<br />
various fractions of DOM, separated by hydrophilicity. The variation in NMR data coupled<br />
with the discovery of two unique fluorophores that overwhelm the fluorescence signal of two<br />
unique fractions, suggests that HILIC provides excellent separation of this previously poorly<br />
resolved material. In examining the NMR data more closely (zoomed regions of Figure 1) it<br />
becomes apparent that the HILIC separations have simplified DOM to the extent that NMR<br />
resolution is greatly enhanced. While bulk DOM samples provide generally unresolved<br />
features (even with zero line broadening: see figure) the HILIC enhanced fractions provide<br />
spectra with sharp peaks suggesting that individual components have now become resolved.<br />
Further two-dimensional NMR experiments known as correlation spectroscopy (COSY) with<br />
a final pulse of 45˚ (COSY45) reveal that many more cross-peaks (i.e. neighboring protons,<br />
connected through 3 or fewer bonds) are apparent in the HILIC-simplified fractions than<br />
<strong>Vol</strong>. 2 Page - 96 -
15th IHSS Meeting- <strong>Vol</strong>. 2<br />
comparable bulk SRNOM sample (data not shown). The resolution of the spectra from oneand<br />
two-dimensional NMR experiments suggests that the HILIC-simplified fractions are<br />
closer to the resolution necessary for elucidating unknowns with NMR and that continuing<br />
improvements in separation are key to the future st<strong>ru</strong>ctural elucidation of DOM.<br />
Figure 1. 1D 1 H NMR spectra of bulk sample and 3 fractions of varying hydrophilicity with<br />
zoomed regions of the low polarity fraction and bulk SRNOM.<br />
4. Conclusions<br />
DOM was separated into 80 fractions based on increasing hydrophilicity and analyzed via<br />
NMR and PARAFAC analyses. Carbohydrate-type st<strong>ru</strong>ctures and amino acid fluorescence<br />
were found associated with the most hydrophilic fractions while material believed to be<br />
derived from cyclic and linear terpenoids (CRAM and MDLT) as well as quinone-influenced<br />
fluorescence were found to be most prominent in less polar fractions. HILIC is here shown to<br />
be an excellent HPLC technique for DOM analyses and the resulting NMR spectra have<br />
detailed peaks. Further innovations and improvements in separation will permit molecular<br />
st<strong>ru</strong>ctures to be distinguished by NMR.<br />
<strong>Vol</strong>. 2 Page - 97 -
15th IHSS Meeting- <strong>Vol</strong>. 2<br />
Acknowledgements<br />
The authors thank the Natural Science and Engineering Research Council of Canada<br />
(Discovery Grant, A.J.S) and the International Polar Year (IPY). The authors also thank the<br />
government of Ontario for providing an Early Researcher Award (A.J.S). G.C.W thanks the<br />
University of Toronto, Chemistry Department’s Special Opportunity Graduate Travel<br />
Fellowship for providing funding to attend the XVth IHSS conference.<br />
References<br />
1. T. Dittmar and J. Paeng, Nat. Geosci., 2 (2009) 175.<br />
2. N. Hertkorn, R. Benner, M. Frommberger, P. Schmitt-Kopplin, M. Witt, K. Kaiser, A.<br />
Kett<strong>ru</strong>p and J.I. Hedges, Geochim. Cosmochim. Acta 70 (2006) 2990.<br />
3. B. Lam, A. Baer, M. Alaee, B. Lefebvre, A. Moser, A. Williams, and A.J. Simpson,<br />
Environ. Sci. Technol., 41 (2007) 8240.<br />
4. R.M. Cory and D.M. McKnight, Environ. Sci. Technol., 39 (2005) 8142.<br />
5. J.B. Fellman, M.P. Miller, R.M. Cory, D.V. D’Amore and D. White, Environ. Sci.<br />
Technol., 43 (2009) 6228.<br />
<strong>Vol</strong>. 2 Page - 98 -
15th IHSS Meeting- <strong>Vol</strong>. 2<br />
Characterization of Natural Organic Matter and Humic Substances<br />
<strong>Vol</strong>. 2 Page - 99 -
15th IHSS Meeting- <strong>Vol</strong>. 2<br />
Pyrolytic Approaches for the Molecular Characterization of Lignite Humic<br />
Substances<br />
Maya Stefanova a , Stefan Marinov a , Laurent Grasset b and André Amblès b<br />
a Institute of Organic Chemistry, Bulgarian Academy of Sciences, Sofia 1113, Bulgaria<br />
1. Introduction<br />
b Université de Poitiers, SRSN, UMR-CNRS 6514, 86022 Poitiers, France<br />
E-mail: maia@orgchm.bas.bg<br />
Humic substances naturally occur in Bulgarian Miocene/Pliocene-aged lignites in very high<br />
contents (~70%). They could be regarded as representative of the st<strong>ru</strong>cture of coal organic<br />
matter. In addition, humic substances are valuable raw material for chemicals production. The<br />
aim of the present study is to evaluate by pyrolysis the st<strong>ru</strong>cture of humic substances from<br />
Thracian coal-bearing province in Bulgaria.<br />
2. Materials and Methods<br />
The isolation of humic acids from Maritza-East lignites (R o , 0.20±0.02%, C daf , 65%) as well<br />
as their characteristics was described in a previous paper [1]. Solvent-extractable compounds<br />
(bitumen) was first removed from lignite by chloroform under 100 atm at 80 °C (3 × 20 min).<br />
After bitumen extraction, humic acids were prepared by 0.1M NaOH treatment. Two samples<br />
were studied, humic acids after bitumen extraction (HA) and the rest of lignite after humic<br />
acid isolation, humin (H).<br />
Table 1. Characteristics of samples<br />
Proximate<br />
Sample analysis,%<br />
Rock Eval data<br />
Moisture Ash TOC (%) HI OI T max S 1 S 2<br />
HA 8.2 4.2 48.14 125 90 404 5.57 59.95<br />
H 10.0 19.7 35.42 319 88 397 14.62 113.09<br />
Preparative off-line thermochemolysis was carried out according to [2,3]. Briefly, ca. 1–2 g of<br />
the sample was placed in a ceramic boat and 2 mL of a TMAH solution (50% v/v in<br />
methanol) or 2 mL of a TEAAc solution (25% v/v in ethanol) were added. The moistened<br />
sample was left for overnight before insertion into a Pyrex tube (60 cm × 3 cm) and heated at<br />
400 o C (1 h). The thermochemolysis products being removed by a flow of helium (100<br />
mL/min) to two traps of cooled chloroform (15 o C). At the end of the treatment, the system<br />
was disconnected and the trapped products were combined and concentrated under reduced<br />
<strong>Vol</strong>. 2 Page - 100 -
15th IHSS Meeting- <strong>Vol</strong>. 2<br />
pressure. They were separated on a silica gel mini-column using mixtures of diethyl ether<br />
(Et 2 O) in petroleum ether with increasing polarity: petroleum ether (fraction I); 10% Et 2 O in<br />
petroleum ether (fraction II); 20% Et 2 O in petroleum ether (fraction III); 50% Et 2 O in<br />
petroleum ether (fraction IV); acetone (fraction V). Afterwards fraction IV was acetylated by<br />
acetic anhydride in pyridine at 50 o C for 20 min. Products of thermochemolysis were analyzed<br />
by GC and GC/MS as described in Válkova et al. [4].<br />
3. Results and Discussion<br />
The yields from preparative off-line TMAH thermochemolysis are summarized in Table 2.<br />
Using SiO 2 column chromatography pyrolysates were fractionated into: n-alkene/n-alkanes<br />
and cyclic hydrocarbons (I fraction); rests of lignin and fatty acid methyl esters, FAMEs (II<br />
fraction); phenols/catechols and lignin residues (III fraction); polyphenols, ketophenols,<br />
alcohols, sterols, etc. (IV fraction) and polars (V).<br />
Table 2. Yields and fractionation of products of thermochemolysis with TMAH<br />
Sample Yields Content of fraction, in rel.%<br />
% mg/gTOC I II III IV V<br />
HA 2.3 42 5.1 11.0 19.2 13.8 15.4<br />
H 3.0 56 9.6 1.4 39.5 20.5 14.1<br />
The first pyrolysate fraction was composed of n-alkanes/n-alkenes doublets (nC 16 –nC 33 ) with<br />
the regular isoprenoid prist-1-ene as mostly prominent compound. Tetracyclic diterpenoid<br />
16α(H)-phyllocladane strongly dominated the hydrocarbon distribution. Unsaturated<br />
analogues could be bonded to the macromolecular phase of coal organic matter and released<br />
during thermochemolysis. There were also identified hopenes/hopanes pairs in the range of<br />
C 27 –C 31 (C 28 absent) probably attached as well.<br />
In the second fraction were identified phenol and its alkylated homologues, 6,10,14-<br />
trimethylpentadecan-2-one and alkan-2-ones ranging from C 9 to C 33 dominated by odd carbon<br />
numbered compounds (max. for C 29 ).<br />
In the second fraction and tailing in the third one series of fatty acids methyl esters (FAMEs)<br />
were detected. Only linear FAMEs were registered. They probably originated from the<br />
transesterification of esters during thermochemolysis. They were the main aliphatic products<br />
of TMAH thermochemolysis. To discriminate naturally occurring FAMEs and the products of<br />
transesterification, an additional experiment was performed with TEAAc producing ethyl<br />
esters (FAEEs) from free fatty acids. The origin of FA in different rank coals was recently<br />
<strong>Vol</strong>. 2 Page - 101 -
15th IHSS Meeting- <strong>Vol</strong>. 2<br />
discussed by Glombitza et al. [5].<br />
The distributions of naturally occurring methyl esters and product of esterification of fatty<br />
acids in humic acids were compared by SIMs at m/z 74 for FAMEs and m/z 88 for FAEEs<br />
(Fig.1). “Free” FAMEs were detected only in the products of TEAAc thermochemolysis of<br />
HA. There were not significant differences in distribution profiles for FAMEs and FAEEs<br />
series. Both were bimodal with very slight prevalence of shorter homologues for FAEEs.<br />
They were represented by the ubiquitous nC 14 , nC 16 and nC 18 acids. The longer chain fatty<br />
acids (nC 22 to nC 32 ) were dominated by even compounds.<br />
Fig.1. FAMEs (m/z 74) and FAEEs (m/z 88) released after TEAAc treatment of humic acids<br />
The distribution pattern of nFAMEs in products of TMAH thermochemolysis indicated at<br />
least two possible origins – from ester hydrolysis of diagenetically reduced cutins, suberins or<br />
of glycerides from cell membranes for the shorter members and from the hydrolysis of<br />
epicuticular waxes. There were not unsaturated, branched chain, indicating the very low<br />
contribution of microbiota to this pool of compound. The absence of di- and hydroxyl-<br />
FAMEs could be indicative of the complete reduction of the cutin biopolymers.<br />
Aromatic compounds st<strong>ru</strong>cturally related to lignin were the main aromatic components in the<br />
pyrolysates. Vanillyl phenols, i.e. 3-methoxy-4-hydroxybenzaldehyde (vanillin); 3-methoxy-<br />
4-hydroxyacetophenone (acetovanillone) and 3-methoxy-4-hydroxybenzoic acid (vanillic<br />
acid) were registered. Small amounts of vanillyl derivatives of acetic and propanoic acids as<br />
methyl esters were determined as well. Syringyl phenols were absent. The strong<br />
preponderance of vanillyl st<strong>ru</strong>ctures was an indication for the prevalence of Gymnosperm<br />
vegetation in the coal-forming mire. There were traces of benzenedicarboxylic acid. This<br />
result was in discrepancy with the data of Del Rio et al. [6] for Miocene-aged Spanish lignites<br />
<strong>Vol</strong>. 2 Page - 102 -
15th IHSS Meeting- <strong>Vol</strong>. 2<br />
where benzenepolycarboxylic acids were highly abundant in products of TMAH treatment.<br />
In the fourth fraction, simple phenols, catechols, and their alkylated homologues (determined<br />
as acetylated derivatives) were identified. According to the contemporary view for<br />
peatification/coalification (presuming cleavage of β–O–4 bonds in lignin and subsequent<br />
realkylation of the aromatic ring followed by demethylation of methoxy side chain<br />
functionalities) lignin could produce catechol-like st<strong>ru</strong>ctures [7].<br />
Acetylation of the fourth fraction gave us ground for MS identification of broad series of<br />
alcohols: (i) linear alcohols, i.e. nC 12 –nC 34 , even numbered, nC 26 maximal (inner standard<br />
used); (ii) sterols, i.e. stigmasta-5-en-3-ol, stigmasta-5,22-dien-3-ol, cholesta-5-en-3-ol, etc.;<br />
(iii) triterpenols, i.e. lupan-3-ol, lup-20(29)-en-3-ol, taraxen-14-en-diol and the corresponding<br />
ketone; (iv) ketophenols, i.e. sugiol strongly dominating the alcohol fraction. Sterols and<br />
triterpenols were registered only in humin pyrolysate.<br />
The identification of fatty acids, n-alkanols and sterols in the products of thermochemolysis of<br />
humin sample was a hint for the importance of ester linkages in the st<strong>ru</strong>cture of lignite coal<br />
organic matter. The results demonstrated the abundance of ester bonds that have survived for<br />
million of years and the capability of thermochemolysis to cleave them.<br />
4. Conclusions<br />
The results of thermochemolysis proved the great ability of humic substances to retain<br />
hydrophobic compounds. A combination of preparative off-line TMAH thermochemolysis<br />
and TEAAc treatment provided the possibility of discriminating between “free” fatty acids<br />
tightly trapped within the organic matrix and ester-bound acids. The data confirmed the<br />
Gymnosperm origin of Bulgarian lignite. The absence of branched fatty acids could indicate<br />
the absence of microbial processes during the early steps of diagenesis of lignite predicted at a<br />
certain extent by the antiseptic properties of gymnosperm resins in Neogene lignites.<br />
References<br />
1) M. Stefanova et al., Fuel, 72 (1993) 681.<br />
2) L. Grasset and A. Amblès, J. Anal. Appl. Pyrolysis, 47 (1998) 1.<br />
3) L. Grasset et al., Org. Geochem., 33 (2002) 181.<br />
4) D. Válkova et al., Fuel, 88 (2009) 2113.<br />
5) C. Glombitza et al., Org. Geochem., 40 (2009) 1063.<br />
6) J.C. del Rio et al., Org. Geochem., 22 (1994) 885.<br />
7) P.G. Hatcher and D.J. Clifford, Org. Geochem., 27 (1997) 251.<br />
<strong>Vol</strong>. 2 Page - 103 -
15th IHSS Meeting- <strong>Vol</strong>. 2<br />
Characterization of Humic Substances from Permanently Frozen<br />
Sediments Using Sequential Resin-Alkali Extraction Technique and Optical<br />
Spectroscopy<br />
Shirshova L.T.*, Ostroumova N.V. and Yermolayev A.M.<br />
Institute of Physicochemical and Biological Problems in Soil Science, Russian Academy of<br />
Sciences, Pushchino, 142290, Russia<br />
E-mail: lushirsh@rambler.<strong>ru</strong><br />
1. Introduction<br />
Predictions of global warming render the studies of humic substances (HS) stored in<br />
permanently frozen sediments of northernmost areas particularly topical. The question arises<br />
whether the molecular characteristics of HS from permafrost sources change during their<br />
analysis under standard laboratory conditions.<br />
In this work we have employed UV-visible and fluorescence spectroscopy for the<br />
comparative characterization of HS fractions obtained from naturally frozen samples of<br />
permafrost sediments and thawed/air-dried samples. HS were isolated from these samples by<br />
means of sequential resin-alkali extraction procedure, which allows milder isolation<br />
conditions compared to the classical procedure, thereby preserving the native HS st<strong>ru</strong>cture<br />
[1]. The response of HS to soil freezing-thawing and drying, as well as the effect of freezing<br />
on the fluorescence properties of aquatic HS, has been discussed in [2–5].<br />
2. Materials and Methods<br />
The investigation dealt with permafrost aleurites sediments (Table 1) obtained by rotary<br />
drilling from Holocene (HL), Pleistocene (Ice Complex) and Neogen (NG) strata in Yakutia<br />
coastal lowlands [1]. Two types of samples taken from each of the sediments were analyzed:<br />
(1) thawed/air-dried samples stored at room temperature for two months [4] and (2) naturally<br />
frozen samples. HS were sequentially extracted from samples 1 and 2 by Sulfonate resin (HS-<br />
S, weakly cation-bound), Carboxylate resin (HS-C, strongly cation-bound) and, afterwards,<br />
by Alkaline solution (HS-A, free and/or associated with soil organics) as described previously<br />
[1]. HS extracts were filtered through the 0.45 μm membrane filter to obtain HS fractions, and<br />
the portions of each purified HS fraction were separated into humic acid fractions (HA-S, C,<br />
A) and fulvic acid fractions (FA-S, C, A) at pH 1. UV-Visible spectra of the samples were<br />
recorded on a Hitachi 557 spectrophotometer in the range of 200–600 nm. Fluorescence<br />
spectra were measured with a Hitachi 850 fluorescence spectrometer: excitation spectra at the<br />
emission wavelength of 450 nm; emission spectra at the excitation wavelength of 337 nm; and<br />
<strong>Vol</strong>. 2 Page - 104 -
15th IHSS Meeting- <strong>Vol</strong>. 2<br />
synchronous fluorescence spectra at Δλ = 18 nm [6]. The pH values of all sample solutions<br />
used for UV-Visible and fluorescence measurements were brought to 7.5–8.0; spectral<br />
absorbance values at 337 nm were adjusted to 0.15 or 0.3. C org in sediment samples and HS<br />
extracts was determined by the wet combustion method.<br />
Table 1. Identification and some characteristics of sediment samples and humic acid fractions<br />
Samples Age<br />
Identity (kyr)<br />
С org<br />
λ max (nm)*<br />
(g kg -1 ) HA-S HA-C HA-A<br />
HL 3 54.5 349 (a)** 493 (d) 413 (с)<br />
IC1 40 9.8 349 (a) 344 (a), 398 (c) 405 (c)<br />
IC2 200 5.9 384 (c) 386 (c) 371 (b)<br />
NG 1000 9.6 344 (a) 404 (c) 514 (d)<br />
* The main synchronous spectral peak position. ** a, b, c, d – peaks designation<br />
3. Results and Discussion<br />
Figure 1 shows representative UV-Visible and fluorescence spectra for the humic fractions<br />
isolated from sediment samples. The general view of all spectra is typical of HS; at the same<br />
time, the spectra of HS-S, C, A fractions and their HA and FA sub-fractions have their own<br />
peculiar features. In particular, the UV-Visible spectra of HS-S/FA-S fractions exhibit a band<br />
of about 230 nm, indicating the presence of relatively simple aromatic/carboxyphenol<br />
st<strong>ru</strong>ctures [7]. The excitation florescence spectra (Ex) of studied humic fractions have two<br />
possible maxima/shoulders: about 250–270 nm and 300–310 nm. The former is present in all<br />
fractions, and represents the main maximum for HA (centered at 254 nm). Florescence<br />
emission spectra (Em) are characterized by a broad band centered between 385 and 460 nm.<br />
FA generally fluoresce more intensely than their HA counterparts. Synchronous fluorescence<br />
(SF) spectra demonstrate 4 main peaks with maxima at 330–365 nm (a), 365-380 nm (b),<br />
380–420 nm (c), and 480–520 nm (d). Positions of these peaks do not depend on the state of<br />
initial sediment sample and represent a stable st<strong>ru</strong>ctural signature of isolated humic fractions.<br />
Fluorescence signals in the range a–b are usually attributed to low-humified compounds<br />
and/or protein-derived st<strong>ru</strong>ctures; signals in the range d are referred to highly-humified<br />
(chemically mature) components; and signals in the range c may be indicative of non-humic<br />
compounds (polysaccharide-like, lignin/amide-derived) adhered to humics [1,5–8]. The data<br />
presented in Fig. 1 and in Table 1 lead to a conclusion that sediment HS are rich in lowhumified<br />
compounds.<br />
<strong>Vol</strong>. 2 Page - 105 -
15th IHSS Meeting- <strong>Vol</strong>. 2<br />
HL NG NG<br />
2<br />
Absorbance<br />
2<br />
HS-S (1)<br />
HS-S (2)<br />
HS-C (1)<br />
HS-C (2)<br />
HS-A (1)<br />
HS-A (2)<br />
1,5<br />
FA-S (1)<br />
FA-C (1)<br />
FA-A (1)<br />
HA-S (1)<br />
HA-C (1)<br />
HA-A (1)<br />
0<br />
200 250 300 350 400 450 500 550 600<br />
0<br />
200 250 300 350 400 450 500 550 600<br />
0<br />
200 250 300 350 400 450 500 550 600<br />
0,8<br />
Ex<br />
1,6<br />
Ex<br />
0,8<br />
Ex<br />
Relative fluorescence intensity<br />
0<br />
200 250 300 350 400<br />
0,6<br />
Em<br />
0<br />
350 400 450 500 550<br />
0<br />
200 250 300 350 400<br />
0,9<br />
Em<br />
0<br />
350 400 450 500 550<br />
0<br />
200 250 300 350 400<br />
0,5<br />
Em<br />
0<br />
350 400 450 500 550<br />
0,18<br />
SF<br />
1,7<br />
SF<br />
a<br />
SF<br />
×10<br />
Normalized<br />
b<br />
c<br />
d<br />
0<br />
320 370 420 470 520<br />
0<br />
320<br />
370<br />
420<br />
470<br />
520<br />
320 370 420 470 520<br />
Wavelength (nm)<br />
Figure 1. UV-Visible, excitation (Ex), emission (Em) and synchronous (SF) fluorescence spectra of<br />
humic fractions isolated from naturally frozen (2) and thawed/air-dried (1) samples: HL and NG.<br />
Abbreviations are described in Materials and Methods.<br />
The following UV-Visible and fluorescence parameters are used in this work for description<br />
of the optical spectroscopic behavior of isolated humic fractions: (i) the A 254 /A 436 ratio widely<br />
used for HS characterization and (ii) the Im/A 337 ratio (fluorescence emission maximum<br />
intensity (Im) normalized by absorbance at λex). As is shown in Fig. 2A, the combination of<br />
these optical parameters allows splitting of the overall pull of fractions into areas specific to<br />
HA compounds (I), intermediate HA-FA forms (II), FA components (III), and the zone of<br />
fulvic-like (FLk) compounds (IV). We hereby introduce a term FLk unifying fractions that<br />
absorb in the UV region and/or fluoresce more intensely than the fractions from the areas I, II<br />
and III. As evident from Fig. 2B: (i) optical parameters of certain HS fractions isolated from<br />
<strong>Vol</strong>. 2 Page - 106 -
15th IHSS Meeting- <strong>Vol</strong>. 2<br />
naturally frozen samples differ from the corresponding parameters of corresponding fractions<br />
obtained from thawed/air-dried samples; (ii) the magnitude of differences observed depends<br />
on the sediment under study; (iii) as a whole, naturally frozen samples are characterized by<br />
the higher concentration of FLk compounds as compared to the thawed/air-dried samples. The<br />
above differences are most pronounced (Figs. 1 and 2B) in weakly cation-bound HS-S. The<br />
results presented in Fig. 1 and Table 1, as well as the results of our previous investigations<br />
[1,3], show that the HS-S fractions contain the least mature humic compounds and, possibly,<br />
humic-like compounds. The exposure of permanently frozen sediments to positive<br />
temperatures is apparently accompanied by alteration of photophysical properties of included<br />
mobile low-humified compounds. This finding may be related to a certain specific state of<br />
humic macromolecules and/or their environment in frozen samples.<br />
Im/A337 (a.u.)<br />
12<br />
10<br />
8<br />
6<br />
4<br />
2<br />
I<br />
II<br />
A<br />
III<br />
IV<br />
FA-S(1.2)<br />
FA-C(1,2)<br />
FA-A(1.2)<br />
HA-S(1.2)<br />
HA-C(1.2)<br />
HA-A(1,2)<br />
Im/A337 (a.u.)<br />
10<br />
8<br />
6<br />
4<br />
2<br />
HS-S (1)<br />
HS-Ñ (1)<br />
HS-A (1)<br />
HS-S (2)<br />
HS-C (2)<br />
HS-A (2)<br />
HL<br />
B<br />
IC1<br />
NG<br />
IC1<br />
NG<br />
0<br />
5 10 15 20 25 30 35<br />
A254/A436<br />
0<br />
5 10 15 20 25<br />
A254/A436<br />
30<br />
Figure 2. Relation between A 254 /A 436 and Im/A 337 ratios in sediment humic fractions. Abbreviations are<br />
described in Materials and Methods.<br />
References<br />
1. L.T. Shirshova, A.L. Kholodov, B.N. Zolotareva, L.A. Fominykh and A.M. Yermolayev,<br />
Geoderma, 149, 1–2 (2009) 116.<br />
2. A.M. Yermolayev and L.T. Shirshova, Soviet J. Ecol., 19, (1988) 10.<br />
3. L.T. Shirshova and T.E. Khomutova, Environ. Internat., 20, 3 (1994) 405.<br />
4. T.A. Polubesova, L.T. Shirshova, M. Lefevr and V.A. Romanenkov, Euras. Soil Sci., 28, 11 (1996)<br />
104.<br />
5. J. Peuravuori, R. Koivikko and K. Pihlaja, Water Res., 36 (2002) 4552.<br />
6. N. Senesi, T.M. Miano, M.R. Provensano and G. B<strong>ru</strong>netti, Soil Sci., 152, 4 (1991) 259.<br />
7. P.R. Bloom and J.A Leenheer, in M.H.B. Hayes, P. MacCarthy, R.L Malcolm and R.S. Swift (Ed.),<br />
Humic Substances II - In Search of St<strong>ru</strong>cture. Wiley, Chichester, 1989, p 409.<br />
8. M.M.D. Sierra, M. Giovanela, E. Partanti and E.J. Soriano-Sierra, Chemosphere, 58 (2005) 715.<br />
<strong>Vol</strong>. 2 Page - 107 -
15th IHSS Meeting- <strong>Vol</strong>. 2<br />
Specific Surface Area of Humic Acids Isolated from Soils Amended with<br />
Different Organic Matter Determined from Water Vapour and Nitrogen<br />
Adsorption Data<br />
Jolanta Kwiatkowska-Malina a , Zofia Sokołowska b , Alina Maciejewska a<br />
a Department of Spatial Planning and Environmental Sciences, Warsaw University<br />
of Technology, 1 Politechniki Sq., 00-661 Warsaw, Poland.<br />
b Institute of Agrophysics, Polish Academy of Sciences, Doświadczalna 4, 20-290<br />
Lublin, Poland<br />
E-mail: J.Kwiatkowska@gik.pw.edu.pl<br />
1. Introduction<br />
Absorption and exchange of ions between soil solution and solid phase are regarded as<br />
important properties for characterization of humic acids [2]. The specific surface area (SSA)<br />
is defined as the total amount of all surfaces that may be available for sorption, while water<br />
vapour adsorption measurements provide information on number of relevant surface<br />
properties (e.g. surface area, adsorption energy distribution) and the nature and value of<br />
interfacial forces. Also nitrogen adsorption measurements are widely used in soil sciences for<br />
determining the specific surface area and the pore size distribution [5]. The surface area of<br />
mineral soil as determined from water vapour adsorption isotherms is simply related to soil<br />
granulometric and ionic composition and mineralogy. Water vapour sorption on organic soils,<br />
especially on HAs, has a more complicated character. In this case the term “sorption”, is more<br />
realistic, as sorption involves both phenomena, adsorption and absorption [1].<br />
The aim of our study was to compare properties of humic acids (HAs) isolated from soils<br />
amended with different organic matter sources (brown coal preparation, the so-called,<br />
Rekulter, cow manure and compost DANO) based on water vapour and N adsorption data.<br />
2. Material and Methods<br />
The long-term field experiment was carried out in Skierniewice located on 20 o 34' longitude<br />
north 51 o 58' latitude east (Poland). The soil was developed from strong loamy sand on light<br />
clay (WRB - Haplic Luvisols). Cow manure (sample 1), compost DANO (sample 2), brown<br />
coal preparation, the so called Rekulter (containing 85% of brown coal) (sample 3) were<br />
applied to the soil in autumn 1999 in the dose of 20 Mg/ha. The C:N ratios for applied<br />
amendments were of: 14.2 (cow manure), 13.0 (compost), and 10.2 (Rekulter). Soil without<br />
amendment was a control. The basic properties of studied soil are summarized in Table 1.<br />
<strong>Vol</strong>. 2 Page - 108 -
15th IHSS Meeting- <strong>Vol</strong>. 2<br />
Six years after introducing organic amendments, soil samples were taken from the 0-25 cm<br />
horizon after plant harvest, air-dried, mixed, sieved (1-mm) and analyzed. Total organic<br />
carbon (TOC) was determined by the TOC analyzer (Shimadzu 5000), total N (Nt) using the<br />
standard Kjeldahl method, and pH was determined potentiometrically in 1 M KCl. HAs were<br />
extracted from soils according to the IHSS standard method [4].<br />
Water vapour adsorption-desorption isotherms were measured by a gravimetric method after<br />
drying HAs samples in a vacuum chamber with concentrated sulphuric acid until constant<br />
weight. The adsorption measurements were kept a the constant temperature (20°C ± 0.5).<br />
The surface area of HAs samples was evaluated from adsorption-desorption isotherms in the<br />
B<strong>ru</strong>nauer-Emmett-Teller (BET) range of the relative water vapour pressure, using the BET method<br />
[3]. The first step in the application of the BET method is to obtain the monolayer capacity (N m ) from<br />
the BET plot. The second step is to calculate the surface area S from the dependence S=N m ×M -1 ×L×ω,<br />
where L is the Avogadro number, M is the molecular weight of water (gram per mole) and ω<br />
is the molecule cross-sectional area (10.8×10 -20 m 2 for water molecule).<br />
3. Results and Discussions<br />
Basic properties of studied soil are given in Table 1. The application of compost and Rekulter<br />
resulted in an increase of TOC of almost 20% and 50%, respectively. Consequently, a<br />
significant increase of the TOC:Nt ratio was observed. The soil pH slightly increased after the<br />
application of cow manure and the Rekulter. The ratios of organic carbon to nitrogen were<br />
characteristic for typical polish arable soils.<br />
Table 1. The basic properties of the soil<br />
Sample Org. amendment Mg . ha -1 pH in 1M TOC Nt TOC:Nt<br />
KCl g . kg -1 g . kg -1<br />
control - 5.63 6.1 0.65 9.4<br />
1 (cow manure) 20 5.70 6.4 0.66 9.7<br />
2 (compost) 20 5.60 7.0 0.68 10.3<br />
3 (Rekulter) 20 5.90 9.1 0.65 14,0<br />
LSD α = 0.05 1.63 0.102 0.95<br />
notation: LSD – least significant difference<br />
Adsorption data are shown in figure 1a. Shapes of the curves are similar for all analysed samples, and<br />
according to Sokołowska et al. [5] they could be considered as belonging to type II isotherms<br />
(according to the BET classification scheme). At the same relative pressure values, the amounts<br />
adsorbed water vapour are the highest for HAs extracted from the soil amended with the Rekulter,<br />
while the lowest in the case of HAs from the soil with cow manure. It is also reflected by the<br />
desorption isotherms which are shown in figure 1b.<br />
<strong>Vol</strong>. 2 Page - 109 -
15th IHSS Meeting- <strong>Vol</strong>. 2<br />
NH2O(mg . g -1 )<br />
NH2O (mg . g -1 )<br />
a) b)<br />
20 control<br />
20<br />
18 cow manure<br />
control<br />
18 cow manure<br />
16 compost<br />
Rekulter<br />
16<br />
compost<br />
14<br />
Rekulter<br />
14<br />
12<br />
12<br />
10<br />
10<br />
8<br />
8<br />
6<br />
6<br />
4<br />
4<br />
2<br />
2<br />
0<br />
0<br />
0 0.2 0.4 0.6 0.8 1<br />
p . p0 -1<br />
0 0.2 0.4 0.6<br />
p . po -1<br />
0.8 1<br />
Fig. 1. Adsorption (a) and desorption (b) isotherms of water vapour on HAs<br />
notation: N-amount of sorbed gas, p . po -1 – relative pressure.<br />
a) b)<br />
20<br />
18<br />
16<br />
14<br />
12<br />
10<br />
8<br />
6<br />
4<br />
2<br />
0<br />
control ads<br />
control des<br />
0 0.2 0.4 0.6 0.8 1<br />
p . po -1<br />
N H2O (mg . g -1 )<br />
NH2O(mg . g -1 )<br />
20<br />
18<br />
16<br />
14<br />
12<br />
10<br />
8<br />
6<br />
4<br />
2<br />
0<br />
cow manure ads<br />
cow manure des<br />
0 0.2 0.4 0.6 0.8 1<br />
Fig. 2. The hysteresis of water vapour adsorption on HAs<br />
notation: ads – adsorption, des – desorption<br />
a) b)<br />
p . po -1<br />
NH2O (mg . g -1 )<br />
40<br />
35<br />
30<br />
25<br />
20<br />
15<br />
10<br />
5<br />
0<br />
compost ads<br />
compost des<br />
0 0.2 0.4 0.6 0.8 1<br />
p . po -1<br />
NH2O (mg . g -1 )<br />
40<br />
35<br />
30<br />
25<br />
20<br />
15<br />
10<br />
5<br />
0<br />
Rekulter ads<br />
Rekulter des<br />
0 0.2 0.4p . po -1 0.6 0.8 1<br />
Fig. 3. The hysteresis of water vapour adsorption on humic acids (HAs)<br />
notation: ads – adsorption, des – desorption<br />
In all cases a well pronounced hysteresis loop can be observed. The highest sorption as<br />
evaluated from the water vapour, hysteresis loop was reached for HAs extracted from the soil<br />
with the Rekulter (fig. 3b) while the lowest for HAs from the soil with cow manure (fig. 2b).<br />
<strong>Vol</strong>. 2 Page - 110 -
15th IHSS Meeting- <strong>Vol</strong>. 2<br />
The surface areas of HAs are presented in table 2. The specific surfaces areas (SSA) for HAs were the<br />
biggest for the soil amended with the Rekulter and the lowest for a control. High values of the<br />
correlation coefficients R 2 (0.99) indicate that the BET model fits well to the experimental data. It is<br />
now accepted to use the BET model to derive the specific surface area of organic material from<br />
physical adsorption data [5]. The high SSA value for HAs from the soil with the Rekulter may be<br />
related with the presence of polar functional groups, eg OH, COOH (dominant in organic matter [5])<br />
that are the sorption sites. Water is adsorbed on polar while nitrogen on non-polar surfaces.<br />
R 2<br />
Table 2. Specific surface areas (SSA) of humic acids based on nitrogen adsorption data<br />
Sample<br />
SSA<br />
m 2 . g -1<br />
control 65.8 0.99<br />
1 (cow manure) 114.9 0.99<br />
2 (compost) 144.5 0.99<br />
3 (Rekulter) 166.1 0.99<br />
notation: R 2 – correlation coefficient<br />
4. Conclusions<br />
The total surface area determined from water sorption isotherms was the biggest for HAs<br />
isolated from the soil amended with the Rekulter.<br />
The biggest sorption of water vapour reflected by the hysteresis loop was for HAs from the<br />
soil amended with the Rekulter.<br />
It appears that the SSA of HAs should be simultaneously evaluated on the basis of both water<br />
vapour and nitrogen adsorption data. Such a procedure will lead to better characterization of<br />
the surface properties of HAs.<br />
References<br />
1. C.T. Chiou, J-F. Lee, and S.A. Boyd, Environ. Sci. Technol., 24, (1990), 1164.<br />
2. J. Kwiatkowska, Z. Sokołowska, A. Maciejewska, Int. Agrophysics, 2, (2006), 121.<br />
3. K. S. W. Sing, Pure Appl. Chem., 54, (1982) 2201<br />
4. S.S. Gonet, B. Debska, Environ. Int., 24 (5/6) (1998) 603.<br />
5. Z. Sokołowska, D. Matyka-Sarzyńska and G. Bowanko, Int. Agrophysics, 18, (2004), 363.<br />
<strong>Vol</strong>. 2 Page - 111 -
15th IHSS Meeting- <strong>Vol</strong>. 2<br />
Spectroscopic Study of Humic Substances Extracted from Sediment<br />
at Goczałkowice Dam Reservoir<br />
Mariola Bartoszek*, Justyna Polak, Natalia Młynarczyk, Agnieszka Kos,<br />
Wiesław W. Sułkowski<br />
Department of Environmental Chemistry and Technology, Institute of Chemistry,<br />
University of Silesia, Szkolna 9, 40-006 Katowice, Poland<br />
E-mail: mariola.bartoszek@us.edu.pl<br />
1. Introduction<br />
Goczałkowice Reservoir is the biggest reservoir in the South of Poland. The main task of this<br />
dam reservoir is to supply water to the inhabitants of the Upper Silesia agglomeration. The<br />
hydrobiological studies of the reservoir indicate an unusual abundance of live nature. On the<br />
other hand studies of the inflowing water show a decrease in concentration of biogens over<br />
the last years. However, the over blooming of algae is still observed. This could be due to the<br />
presence of a large quantity of medium substances and nutrients in bottom sediments. The<br />
humic substances which contain nitrogen groups, phospho<strong>ru</strong>s groups and other functional<br />
groups, can constitute nutrients which are easily assimilated by flora. Hence, it is important to<br />
investigate the physicochemical properties of humic matter in dam reservoir.<br />
2. Materials and Methods<br />
Bottom sediment for studies were collected according to Polish standards in various seasons<br />
from eight places of the Goczałkowice Reservoir (Fig. 1).<br />
Fig. 1 The Goczałkowice Reservoir with marked points of sampling.<br />
Humic acids (HA) and fulvic acids (FA) components were extracted by conventional<br />
procedures. The EPR was applied for both quantitative (free radical concentration) and<br />
qualitative (g factor) analysis of humic substances. Comparison of signal intensity of the main<br />
functional groups of humic and fulvic acids was conducted by means of 1 H NMR and 13 C<br />
NMR techniques. The identification of functional groups was done by means of infrared<br />
spectroscopy.<br />
<strong>Vol</strong>. 2 Page - 112 -
15th IHSS Meeting- <strong>Vol</strong>. 2<br />
3. Results and Discussion<br />
The EPR spectra of the extracted humic substances exhibit broad lines from transition metals<br />
and narrow lines from free radicals. The values of free radical concentration obtained for<br />
humic acids amount 1.14–13.6·10 16 spin/g depending on season and place of sample<br />
collection. These values are comparable with the obtained for aquatic HA (~ 10 16 spin/g) and<br />
for HA extracted from sewage sludge (~10 16 –10 17 spin/g) [1]. The values of free radical<br />
concentration obtained for FA amount 0.43– 27.5·10 16 spin/g. The values of g factor obtained<br />
for FA (2.0041–2.0046) were higher compared with the values for HA (2.0027 – 2.0035).<br />
The NMR spectra are useful for estimation of the relative abundance of aliphatic, aromatic<br />
and carbonyl groups in humic samples. The FA extracted from sediment contain fewer<br />
aromatic groups and more aliphatic once in comparison to HA. Moreover, the percentage<br />
content of aromatic protons with aromatic carbons reveals a notably smaller proportion of<br />
aromatic hydrogen atoms than that of aromatic carbon atoms, especially in the case of HA.<br />
This difference indicates the presence of condensed aromatic rings with nonprotonated<br />
carbons in the HA st<strong>ru</strong>cture [2]. The content of carbonyl groups in the FA st<strong>ru</strong>cture is<br />
markedly higher in comparison with HA.<br />
The obtained IR spectra of HA and FA confirm the presence of functional groups typical for<br />
humic substances. These spectra differ in the relative intensity of some bands.<br />
4. Conclusions<br />
The spectroscopic studies show that HA and FA extracted from the bottom sediment collected<br />
at various points of the Goczałkowice Reservoir are characterized by similar physicochemical<br />
properties. The analysis of NMR and IR spectra confirmed the presence of the same<br />
functional groups in the st<strong>ru</strong>cture of HA and FA. It was stated that FA are less aromatised<br />
than HAs. Fulvic acids have a weakly formed aromatic core with the dominance of the<br />
branched side- aliphatic chains. The presence of transition metals was confirmed in the<br />
extracted humic substances.<br />
Acknowledgements<br />
This work was supported by the Ministry of Science and Higher Education (MNiSW Poland)<br />
under Project No. N N204 1932 33.<br />
References<br />
1. J. Polak, M. Bartoszek and W.W. Sułkowski, Wat. Res. 43 (2009) 4167.<br />
2. J. Polak, M. Bartoszek and W.W. Sułkowski, J. Mol. St<strong>ru</strong>ct. 924–926 (2009) 309.<br />
<strong>Vol</strong>. 2 Page - 113 -
15th IHSS Meeting- <strong>Vol</strong>. 2<br />
Reactivity and Chemical Characterization of Effluent Derived-Organic<br />
Nitrogen in Freshwaters Determined from Fourier Transform Ion<br />
Cyclotron Mass Spectrometry (FT-ICR-MS)<br />
Rajaa Mesfioui a , Patrick G. Hatcher a* , Margaret R. Mulholland b , Deborah A. Bronk c ,<br />
Elizabeth A. Canuel c , Nancy G. Love d .<br />
a Chemistry and Biochemistry department, Old Dominion Univ., Norfolk, VA 23529, USA;<br />
b Department of Ocean, Earth, and Atmospheric Sciences, Old Dominion Univ., Norfolk, VA<br />
23529, USA; c Virginia Inst. of Marine Science, the College of William and Mary, Gloucester<br />
Point, Virginia 23062; d Civil and Environmental Engineering, university of Michigan<br />
E-mail: phatcher@odu.edu.<br />
1. Introduction<br />
Wastewater effluents contribute to nitrogen (N) over-enrichment in many freshwater<br />
tributaries [1] including those draining into Chesapeake Bay. Up to 85% of the effluent<br />
derived N is organic herein referred to as effluent organic N (EON) because it is easier to<br />
remove dissolved inorganic N (DIN) during advanced wastewater treatment processes [1].<br />
There are relatively few data on EON bioavailability to aquatic microbes in nature [2] and<br />
there is currently no standard method to accurately assess EON bioavailability in natural<br />
systems. In this study we examined the reactivity of EON from two wastewater treatment<br />
plants (WWTP) in freshwater samples collected from the James River, a tributary of the<br />
Chesapeake Bay, using coupled Electrospray Ionization (ESI) and ultrahigh resolution Fourier<br />
transform ion cyclotron mass spectrometry (ESI-FT-ICR-MS). This relatively novel technique<br />
is capable of elucidating detailed molecular characterization of dissolved organic matter<br />
(DOM) and therefore of EON and allows a better understanding of both the ecosystem<br />
response and the potential bioavailability of EON. This information is important for<br />
regulatory agencies that set nutrient loading allowances to protect water quality and prevent<br />
further degradation of our waterways.<br />
2. Materials and Methods<br />
Source of effluents. The effluents used in this study were from two WWTPs; the T<strong>ru</strong>ckee<br />
Meadows (TM) Water Reclamation Facility located in Reno, NV and the King William (KW)<br />
plant located in King William County, VA. Both effluents were collected in August, 2008,<br />
filtered through a 0.2 µm cartridge filter then concentrated approximately 48-fold using a<br />
rotary evaporator system.<br />
Sampling sites and bioassay experiments. The concentrated effluents were added to natural<br />
water samples collected on August19, 2008, from the James River (JR), a major tributary of<br />
<strong>Vol</strong>. 2 Page - 114 -
15th IHSS Meeting- <strong>Vol</strong>. 2<br />
the Chesapeake Bay. The JR natural water, JR amended with T<strong>ru</strong>ckee Meadow effluent<br />
(TM+JR), and JR amended with King William effluent (KW+JR) were incubated under<br />
ambient environmental conditions with a 13.5/10.5 hour light/dark cycle at a constant<br />
temperature of 25 °C for a period of 0h (T 0 ) and 48 h (T f ).<br />
FTICR mass spectrometry. Samples were first desalted using electrodialysis, diluted with<br />
methanol, and then spiked with 0.1% ammonium hydroxide right before the mass<br />
spectrometry analysis. Ultrahigh resolution mass spectra were acquired with an Apollo II ESI<br />
ion source coupled to a B<strong>ru</strong>ker Daltonics 12 Tesla Apex Qe FTICR-MS. Samples were<br />
injected by direct diffusion with the flow rate of 120 μL/min. All samples were analyzed in<br />
negative ion mode to minimize complications due to sodium adduct formation. Spectra were<br />
internally calibrated with indigenous fatty acids [3]. Empirical molecular formulas were<br />
assigned to peaks with a signal to noise ratio (S/N) of > 4 in the mass range of 200–700 m/z<br />
by means of a Formula Calculator Program (v.1.0 © 1998 NHMFL) developed at the National<br />
High Magnetic Field Laboratory in Tallahassee, FL.<br />
3. Results and Discussion<br />
Dissolved organic carbon (DOC), total dissolved N (TDN), and dissolved organic N (DON)<br />
concentrations, in natural JR water, JR water after EON amendment (T 0 ) and after a 48h<br />
incubation period (T f ), are shown in Table.1 After 48h incubations, TDN decreased in both<br />
cases. Dissolved organic N concentrations, however, only decreased in incubations with TM<br />
EON but remained constant in incubations with KW EON, suggesting that the TM EON was<br />
more labile than the KW.<br />
Sample [DOC](µmolC L -1 ) [TDN](µmolNL -1 ) [DON](µmolNL -1 )<br />
Percent of assigned<br />
formulae<br />
JR at T 0 362.6 + 1.6 28.80 + 0.10 21.30 + 0.10 78%<br />
JR at T f 372.2 + 2.5 22.65 + 0.41 22.45 + 0.41 72%<br />
(TM+JR) T 0 604.3 + 3.4 55.55+ 0.72 47.61+ 0.72 ~92%<br />
(TM+JR) T f 600.0 + 3.7 43.10 + 0.64 42.75 + 0.64 92%<br />
(KW+JR) T 0 528.9 + 2.9 59.68 + 0.63 38.59 + 0.63 78%<br />
(KW+JR) T f 547.5 + 2.4 38.63+ 0.69 38.16 + 0.69 92%<br />
Van Krevelen plots of CHO-containing, CHNO-containing, and CHSO-containing formulae<br />
in the TM+JR (Fig. 1) and KW+JR (Fig. 2) incubations at T 0 and T f demonstrate clearly the<br />
lability of both effluents. In the case of the TM EON, approximately 79%, 36%, and 39% of<br />
CHNO, CHO, and CHSO formulae, respectively, were consumed after the 48 h incubation<br />
(Fig. 1,). However, about 54%, 42%, and 33% of the final CHNO, CHO, and CHSO<br />
<strong>Vol</strong>. 2 Page - 115 -
15th IHSS Meeting- <strong>Vol</strong>. 2<br />
formulae, respectively, were produced (Fig. 1, x). These results confirm that while portions of<br />
the TM effluents are consumed, new chemical compounds are being produced during the<br />
bioassays, confounding our ability to assess EON reactivity using bulk DON concentrations.<br />
Figure 1: Two dimensional van Krevelen diagrams showing the consumed (), resistant (), and produced (x)<br />
formulae of (CHNO, CHO, and CHSO) subcategories in the TM+JR at T 0 and T f . Bar charts on the sides show<br />
the percent of the consumed, resistant, and produced formulae in each subcategory.<br />
Figure 2: Two dimensional van Krevelen diagrams showing the consumed (), resistant (), and produced (x)<br />
formulae of (CHNO, CHO, and CHSO) subcategories in the KW+JR at T 0 and T f . Bar charts on the sides show<br />
the percent of the consumed, resistant, and produced formulae in each subcategory.<br />
<strong>Vol</strong>. 2 Page - 116 -
15th IHSS Meeting- <strong>Vol</strong>. 2<br />
In the case of KW EON there was a surprisingly large number of new compounds produced,<br />
compared to the TM EON during the 48h bioassay. For instance, about 100%, 86%, and 66%<br />
of CHNO, CHO, and CHSO formulae, respectively, were new molecules produced during the<br />
incubation (Fig. 2, x). The same figure shows that about 100%, 77%, and 58% of the initial<br />
CHNO, CHO, and CHSO molecules, respectively, disappeared completely upon incubation<br />
() (Table 1). The newly produced compounds can be attributed to partial digestion of the<br />
consumed DOM or to totally new production from microbial processes or other process such<br />
as abiotic alteration. It is important to note that the above estimates of alterations are<br />
conservative estimates because they do not include peaks that were present in both the natural<br />
JR water and the effluents, and peaks whose intensities diminished or increased during<br />
incubation. We only consider the formulae of peaks that either disappeared completely<br />
(consumed) and the ones that appeared (produced) after incubations.<br />
4. Conclusions<br />
Our results demonstrate that, while a fraction of the EON that falls in the lignin region was<br />
conserved, a large fraction of the aliphatic and the aromatic compounds that were originally<br />
present in the EON were removed after 48h incubations in natural waters containing resident<br />
microbes (79% to 100%). The newly produced compounds (53% to 100%) include all the<br />
major classes of biomolecules identified in natural DOM. These finding suggests that EON is<br />
highly reactive in the natural environment.<br />
Acknowledgments<br />
This research was supported by Grant No.0756475 from the National Science Foundation.<br />
The authors wish to thank the College of Sciences Major Inst<strong>ru</strong>mentation Cluster (COSMIC)<br />
at Old Dominion University for their assistance and support on <strong>ru</strong>nning the FTICRMS<br />
analysis.<br />
References<br />
1) Pehlivanoglu-Mantas, E.; Sedlak, D., Wastewater-Derived Dissolved Organic Nitrogen: Analytical<br />
Methods, Characterization, and Effects—A Review. Crit. Rev. Environ Sci. Technol. 2006, 36,<br />
261–285.<br />
2) Pehlivanoglu, E.; Sedlak, D., Bioavailability of wastewater-derived organic nitrogen to the alga<br />
Selenast<strong>ru</strong>m capricornutum. Water Res. 2004, 38 (14–15), 3189–3196.<br />
3) Sleighter, R.; McKee, G.; Liu, Z.; Hatcher, P., Naturally present fatty acids as internal calibrants<br />
for Fourier transform mass spectra of dissolved organic matter. Limnol. Oceanogr.: Methods 2008,<br />
6, 246–253.<br />
<strong>Vol</strong>. 2 Page - 117 -
15th IHSS Meeting- <strong>Vol</strong>. 2<br />
Fluorescence Dynamics of Humic Substances Re-Considered: St<strong>ru</strong>cture Vs.<br />
Heterogeneity<br />
Sascha Eidner, Sören Gehne, Michael U. Kumke *<br />
University of Potsdam, Department of Chemistry, Karl-Liebknecht-Str. 24-25, Germany;<br />
E-mail: Kumke@uni-potsdam.de<br />
1. Introduction<br />
Humic substances (HS) have been investigated by absorption and fluorescence spectroscopy<br />
for many years yet leaving the st<strong>ru</strong>ctural basis of the observed optical properties unclear [1].<br />
Humic substances show uncommon absorption and emission properties. While the absorption<br />
extends from UV to the NIR spectral range showing an almost exponential increase in<br />
extinction upon going from low to high energy, the emission is located in the visible spectral<br />
range. The latter can be seen as an unst<strong>ru</strong>ctured broad band and its maximum is dependent on<br />
the excitation wavelength. Upon shifting the excitation wavelength from the UV to the visible<br />
spectral range, the emission maximum also shifts bathochromic [2–5]. The corresponding<br />
fluorescence decay exhibits a highly complex time dependence, which is—to make it even<br />
more complicated—dependent on the emission as well as excitation wavelength [1–5]. Often<br />
these findings are attributed to the heterogeneous character of HS and the presence of a very<br />
large number of chromophores (and also fluorophores). However, recent results obtained from<br />
high-resolution analytical techniques, such as mass spectrometry and NMR spectroscopy,<br />
indicate that the observed complex optical properties may not be simply the sum of a large<br />
number of individual species, which are independently absorbing and emitting light. Intraand<br />
intermolecular interactions involving electronically excited states may need to be taken<br />
into account in order to properly analyze the absorption and emission properties of HS [1–8].<br />
To further elucidate the contribution of excited state reactions to the optical properties of HS,<br />
steady-state and time-resolved fluorescence experiments were carried out. In order to probe<br />
the different mechanisms, HS samples of different origins were investigated at different pH<br />
and in the presence of different metal ions.<br />
2. Materials and Methods<br />
Reference or standard materials for HS of different origins were purchased from the IHSS.<br />
Stock solutions of each HS sample at pH three, five, and seven were prepared at a<br />
concentration of 20 mg/L HS in MilliQ water. Stock solutions of La(III), Eu(III), Cu(II), and<br />
Ca(II) at the same pH were prepared as well. Absorption and steady-state fluorescence spectra<br />
<strong>Vol</strong>. 2 Page - 118 -
15th IHSS Meeting- <strong>Vol</strong>. 2<br />
were recorded using a Lambda 750 UV/Vis spectrometer (Perkin Elmer) and a Fluoromax 3<br />
spectrofluorometer (Jobin Yvon), respectively. In the time-resolved fluorescence<br />
measurements two different experimental setups were used: i) TCSPC system (FLS 920,<br />
Edinburgh Inst<strong>ru</strong>ments) and ii) a Streak camera system (Hamamatsu). While in the first setup<br />
fluorescence decays were measured at single emission wavelength, the Streak camera system<br />
allowed the collection of time-resolved fluorescence spectra, which in principle allow the<br />
extraction of the fluorescence decays at any emission wavelength. The fluorescence emission<br />
was collected in the wavelength range of 400 nm < λ em < 650 nm. The samples were excited<br />
using different laser sources (e.g., Ti:Sapphire laser with third harmonic generation (250 nm <<br />
λ ex < 295 nm or second harmonic generation 360 nm < λ ex < 440 nm ), a laser diode (λ ex =<br />
319 nm) or a diode laser (λ ex = 375 nm). Different sets of time-resolved fluorescence<br />
experiments and subsequent analysis were performed: i) variation of λ ex and λ em at constant<br />
pH and constant metal loading and ii) data evaluation at a constant λ ex / λ em pairs but a<br />
different pH or metal loading. Metal loading and pH were used as key parameters to address<br />
the effect of st<strong>ru</strong>ctural changes such as conformational alterations due to metal binding or<br />
formation of aggregates.<br />
3. Results and Discussion<br />
10 4<br />
5<br />
counts<br />
10 3<br />
10 2<br />
I 535nm<br />
/ I 400nm<br />
4<br />
3<br />
2<br />
10 1<br />
SRFA<br />
λ em 1<br />
+ La(III)<br />
400 nm<br />
+ Cu(II)<br />
500 nm<br />
10 0<br />
0<br />
0 10 20 30 40 50<br />
0 5 10 15 20<br />
t / ns<br />
t / ns<br />
Figure 1: (left) Fluorescence decays of Suwannee River fulvic acid (SRFA) measured at different<br />
excitation wavelengths (c HS = 10 mg/L, pH 5, λ ex = 375 nm). (right) Stern-<strong>Vol</strong>mer calculation for<br />
SRFA (pH 5, λ ex = 375 nm) in the absence and presence of different metal ions.<br />
In Fig.1 (left) the representative fluorescence decay curves of SRFA are shown for two<br />
different emission wavelengths. A clear emission wavelength dependence is shown and found<br />
for all HS samples investigated. Recently, it was suggested to attribute this emission<br />
wavelengths dependence to intramolecular quenching processes (e.g., energy or electron<br />
<strong>Vol</strong>. 2 Page - 119 -
15th IHSS Meeting- <strong>Vol</strong>. 2<br />
transfer). The calculated the ratio of the fluorescence decays at short (λ em = 400 nm) and long<br />
emission wavelengths (λ em = 525 nm) is shown in Fig. 1 (right). The ratio is changing with<br />
time eventually reaching a constant value. While addition of La(III) is enhancing the<br />
alteration of the ratio with time, adding Cu(II) is inducing the opposite effect. The observed<br />
quenching seems to be dependent on the overall conformation of the HS as well as the redox<br />
properties. While La(III) may only alter the conformation of HS, Cu(II) itself can further act<br />
as an electron acceptor. The latter effect strongly points to the involvement of electron<br />
transfer related processes in the observed fluorescence of HS.<br />
In order to quantify the quenching processes in HS, the fluorescence decays were further<br />
analyzed using eq.(1).<br />
β<br />
⎡ t ⎛ t ⎞ ⎤ ⎡ t ⎤<br />
I( t)<br />
= A + B1 ⋅ exp⎢−<br />
− C ⋅⎜<br />
⎟ ⎥ + B2<br />
⋅ exp<br />
⎢ −<br />
⎣<br />
⎥<br />
(1)<br />
⎢⎣<br />
τ ⎝τ<br />
⎠ ⎥⎦<br />
τ ⎦<br />
In eq. (1) the parameter A accounts for background signal, the parameters B 1 and B 2 represent<br />
fractional intensities and τ is the fluorescence decay time. The parameter β accounts for the<br />
heterogeneity of the sample (0 < β < 1) and may be seen as the heterogeneity of quenching<br />
processes (e.g., energy transfer or charge transfer). Parameter C is connected to the<br />
concentration of effective quenching sites in the HS. The second exponential term in eq. (1)<br />
accounts for any contributions from isolated fluorophores (not participating in electronic<br />
interactions) to the overall fluorescence decay. In the data analysis, sets of fluorescence decay<br />
curves (e.g., SRFA at different pH, but same λ ex and λ em or constant pH and lex, but different<br />
λ em ) were analyzed together, e.g., setting the fluorescence decay time τ or the distribution<br />
parameter β as a global variable (global fitting) yielding a reduced set of physical meaningful<br />
parameters.<br />
4. Conclusions<br />
A novel approach in the data evaluation and interpretation of HS fluorescence was develop<br />
and tested. The observed fluorescence properties such as dependence of the emission spectra<br />
on the excitation wavelength or complexity of the fluorescence decay were attributed to<br />
intramolecular interactions occurring in the electronically excited state of the HS molecules.<br />
Reactions such as electron transfer, proton transfer, or energy transfer are the major processes<br />
responsible for the observed complex fluorescence decay kinetics. The results obtained<br />
indicate that for HS (e.g., from aquatic origin) a joint model describing the electronic<br />
<strong>Vol</strong>. 2 Page - 120 -
15th IHSS Meeting- <strong>Vol</strong>. 2<br />
deactivation can be developed (e.g., see Fig. 2), allowing to better classify HS based on their<br />
optical properties. The importance of conformation and redox properties for the optical<br />
spectra of HS is underlined<br />
8<br />
7<br />
6<br />
aquatic<br />
soil<br />
parameter C<br />
5<br />
4<br />
3<br />
2<br />
0.4<br />
0.2<br />
0.0<br />
Suwanne<br />
river NOM<br />
Suwanne<br />
river FA<br />
Suwanne<br />
river HA<br />
λ em<br />
= 400 nm<br />
Elliot<br />
soil HA<br />
Waskish<br />
peat FA<br />
Minnesota<br />
peat HA<br />
HS<br />
HS + Ln(III)<br />
8<br />
7<br />
6<br />
soil<br />
parameter C<br />
5<br />
4<br />
3<br />
2<br />
1<br />
Suwanne<br />
river NOM<br />
Suwanne<br />
river FA<br />
Suwanne<br />
river HA<br />
Nordic<br />
aquatic HA<br />
aquatic<br />
λ em<br />
= 525 nm<br />
HS<br />
HS + Ln(III)<br />
Pahokee<br />
peat HA<br />
Pahokee<br />
peat FA<br />
Pahokee<br />
peat HA<br />
Nordic<br />
aquatic HA<br />
Pahokee<br />
peat FA<br />
Elliot<br />
soil HA<br />
Waskish<br />
peat FA<br />
Minnesota<br />
peat HA<br />
Figure 2: Effect of metal ion complexation (Ln(III) = La(III)) on effective quencher concentration (Parameter C)<br />
Acknowledgements<br />
The authors are thankful to the Federal Ministry of Economics and Technology (project<br />
number 02E10216) for financial support.<br />
References<br />
1. E.S. Boyle, N. Guerriero, A. Thiallet, R. Del Vecchio, N.V. Blough, Environ. Sci. Technol. 43<br />
(2009) 2262.<br />
2. F.H. Frimmel and M.U. Kumke, in G. Davies, E. Ghabbour (Eds.), Humic Substances: St<strong>ru</strong>cture,<br />
Properties, and Uses, Royal Society of Chemistry, Cambridge, 1998, p. 113.<br />
3. M.U. Kumke, G. Abbt-Braun, F.H. Frimmel, Acta Hydrochim. Hydrobiol. 26 (1998) 73.<br />
4. G.V. Korshin, M.U. Kumke, C.-W. Li, M.M. Benjamin, F.H. Frimmel, Environ. Sci. Technol. 33,<br />
(1999) 1207.<br />
5. M.U. Kumke and F.H. Frimmel, in F.H. Frimmel, G. Abbt-Braun (Eds.), Refractory organic<br />
substances in the Environment, Wiley 2002, p. 113.<br />
6. M.U. Kumke, S. Eidner, T. Krüger, Environ. Sci. Technol. 39 (2005) 9528.<br />
7. M.U. Kumke and S. Eidner, in E.A. Ghabbour and G. Davies (eds), Humic substances: molecular<br />
details and applications in land and water conservation, Taylor and Francis, Inc., 2005, p. 131.<br />
8. L. Marang, S. Eidner, M.U. Kumke, M.F. Benedetti, P.E. Reiller, Chem. Geol. 264 (2009) 154.<br />
<strong>Vol</strong>. 2 Page - 121 -
15th IHSS Meeting- <strong>Vol</strong>. 2<br />
Characterization of Humic Acids from Point of View of Dissociation<br />
Eva Cechova a* , Romana Kolajova a , Martina Klucakova a<br />
a<br />
Brno University of Technology, Faculty of Chemistry, Institution of Physical and Applied<br />
Chemistry, Purkynova 118, 612 00, Brno, Czech Republic<br />
E-mail: xccechova@fch.vutbr.cz<br />
1. Introduction<br />
Understanding humic acids (HAs) dissociation and determination of dissociation constant in<br />
water is very interesting task which should be paid attention. The authors of article analyzed<br />
potentiometric titration curves of HAs in aqueous solutions which are used to understanding<br />
of its electrochemical behaviour. They carried out all titrations in presence and absence of a<br />
neutral electrolyte such as sodium chloride. They found out the apparent pK a values which<br />
were determined by classical Henderson-Hasselbalch equation [1, 2]. In this study we test<br />
other possibility how to characterize HAs dissociation by means of UV/VIS spectroscopy.<br />
The absorbance spectra of organic compounds with acidic groups depend on the pH of<br />
solution, because acidic and alkaline mediums, in which these compound are dissolved, shift<br />
the dissociation equilibrium of organic compounds towards non-dissociated (macro)molecules<br />
or completely dissociated particles. This spectroscopic method is based on the shift of shape<br />
and intensity of absorbance spectra at the changes of pH of solution [3]. The aim of this work<br />
is to characterize and to determine dissociation constants of lignitic HAs in water by this<br />
methods and comparison of obtained results with those of classical one.<br />
2. Materials and Methods<br />
Three different HAs were used for all experiments. All HAs samples were extracted from<br />
South Moravian lignite (Czech Republic) by alkaline extraction. HA 1 and HA 2 were<br />
extracted by 0.5 M NaOH and 0.1 M Na 4 P 2 O 7 (ratio lignite : extractant 100 g : 1 L and 20 g :<br />
1 L, respectively). After stirring and centrifugation the supernatant was acidified by HCl to<br />
pH ~ 1. HA 1 was purified by HCl/HF mixture, washed, dialyzed in the dialyze tubes<br />
(3500 Da) against deionized water for one week and freeze-dryed. HA 2 was washed by<br />
deionized water and centrifuged up to negative AgNO 3 test (Cl - free) and dried in an oven at<br />
50 °C. HA 3 was prepared from 60 g of lignite mixed with 0.1 M NaOH and 0.084 M<br />
Na 4 P 2 O 7 (1 L). The extraction procedure was then the same as in case of HA 2.<br />
Determination of total acidity of HAs was carried out by classical titration method [4, 5]. The<br />
determination of dissociation constant of HAs according to the Henderson-Hasselbalch<br />
<strong>Vol</strong>. 2 Page - 122 -
15th IHSS Meeting- <strong>Vol</strong>. 2<br />
equation (1) was carried out by mean of the titration of 0.5 g of solid HAs with 25 mL of<br />
deionized water. pH values (pH-meter Mettler Toledo), and conductivity (conductometer<br />
Mettler Toledo) were monitored in titration by 1 M NaOH.<br />
In order to measure UV/VIS spectra of HAs in mediums with different pH, solid HA was<br />
mixed with deionized water (20 g/L) and stirred (24 hours). Then HAs extracts were diluted<br />
with deionized water, 0.1M HCl and 0.1 M NaOH in volume ratio 1:10. UV/VIS spectra were<br />
measured using Varian Cary 50 Probe.<br />
3. Results and Discussion<br />
A traditional approach to HA dissociation, which is usually used for determination of<br />
apparent pK a , is a Henderson-Hasselbalch equation:<br />
α<br />
H = pK<br />
− ⋅ log<br />
a<br />
1 − α<br />
p s , (1)<br />
where pK a is negative logarithm of apparent dissociation constant and α is the degree of<br />
dissociation. The degree of dissociation α can be expressed from the experimental data of<br />
titration curves for total acidity which is shown below<br />
α<br />
c<br />
⋅V<br />
+<br />
+<br />
[ H ] ⋅ ( V + V )<br />
NaOH NaOH<br />
susp NaOH<br />
= , (2)<br />
b ⋅ g<br />
c<br />
HA<br />
where c NaOH , V NaOH is the molar concentration and volume of stock solution, V susp is volume<br />
of suspension before titration, [H + ] is concentration of H + , b c is total acidity of HA and g HA is<br />
amount of HA for the titration. According to eq. (1) pK a is equal to pH for α = 0.5. Their<br />
values determined for our humic samples are listed in Tab. 1. We can see that they do not<br />
correspond with their total acidity. The reason is that HAs acidity includes several types of<br />
acidic groups (e.g. carboxylic, phenolic, enolic, sulfonic), each of which has different<br />
surrounding st<strong>ru</strong>cture influencing strongly the dissociation ability of the individual acidic<br />
groups. Therefore the determined values of pK a are only average or better apparent ones (Tab.<br />
1).<br />
In this work we tested the possibility of determination of pK a by the measurement of UV/VIS<br />
spectra of HAs in solutions with various pH (Fig. 1). The HAs is practically non-dissociated<br />
in acidic solutions; contrary the acidic groups are practically dissociated in strong basic ones.<br />
There exist both non-dissociated and dissociated forms of acid in neutral solution.<br />
Dissociation constant can be calculated from equation (3)<br />
<strong>Vol</strong>. 2 Page - 123 -
15th IHSS Meeting- <strong>Vol</strong>. 2<br />
p<br />
A − A −<br />
= pH +<br />
A − A<br />
K a<br />
B<br />
, (3)<br />
HB<br />
where pH corresponds to the value for HAs extract in deionized water with absorbance A, A B-<br />
is absorbance of HAs in acidic medium and A HB their absorbance in alkaline one. HAs<br />
concentration in all three mediums has to be the same. Obtained pK a values are summarized in<br />
Table. 1.<br />
Table 1: The dissociation constants of HAs according the Henderson-Hasselbalch equation and by<br />
UV/VIS spectroscopy<br />
Henderson-Hasselbalch plot<br />
UV/VIS measurement<br />
Total acidity<br />
HA sample<br />
[mmol/g] pK a K a pK a K a<br />
HA 1 5.75 7.89 1.29 × 10 -8 8.28 5.25 × 10 -9<br />
HA 2 4.66 9.32 4.79 × 10 -10 4.39 4.04 × 10 -5<br />
HA 3 6.83 6.63 2.34 × 10 -7 4.15 4.71 × 10 -5<br />
0,20<br />
HA 2 in water<br />
0,16<br />
HA 2 in 0,1M HCl<br />
A [-]<br />
0,12<br />
0,08<br />
HA 2 in 0,1 M<br />
NaOH<br />
0,04<br />
0,00<br />
300 400 500 600 700 800<br />
λ [nm]<br />
Fig. 1 UV/VIS spectra for the determination of dissociation constant of HA 2<br />
<strong>Vol</strong>. 2 Page - 124 -
15th IHSS Meeting- <strong>Vol</strong>. 2<br />
4. Conclusions<br />
The dissociation constants of HAs were determined by two different ways. Both approaches<br />
to task of HAs dissociation made the possibility of the determination with the respect to some<br />
assumption and every method has special protocol of determination and this includes some<br />
advantages and disadvantages. The values of HAs dissociation constants must be considered<br />
as the apparent due to the HAs st<strong>ru</strong>cture where different functional groups occur. UV/VIS<br />
spectroscopy can be used as relatively simple alternative method for determination of pK a ,<br />
which respects HAs dissociation behaviour in wide range of pH.<br />
Acknowledgements<br />
This work was supported by government funding – Czech Science Foundation, project. Nr.<br />
104/08/0990.<br />
References<br />
9. Shahr, R. K., Bhatt, I. M. Choksi, M. R.: Potentiometric Behaviour of Extracted humic acids in an<br />
Aqueous Medium. Chemical Era, 1976, vol. 12, pp. 422–426.<br />
10. Fukushima, M., Tanaka, S., Nakamura, H., Ito, S.: Acid-base characterization of molecular weight<br />
fractionated humic acid. Talanta, 1996, vol. 43, no. 3, pp. 383–390. ISSN 0039 –9140.<br />
11. Ceppan, M., Klucakova, M., Pekar, M., Vesely, M.: Fyzikalni chemie a fotochemie – praktikum, 1 st<br />
ed, , Brno, VUT v Brne, Fakulta chemicka, 2003, 114 p.<br />
12. Stevenson, F. J.: Cole, M. A.: <strong>Humus</strong> chemistry: Genesis, Composition, Reaction. 2nd ed. New<br />
York: Wiley, 1994, 512 p.<br />
13. M. Klucakova and M. Pekar, Colloid. Surface. A, 252 (2005) 157.<br />
<strong>Vol</strong>. 2 Page - 125 -
15th IHSS Meeting- <strong>Vol</strong>. 2<br />
Photochemical Properties of Humic Substances: Toward a Better<br />
Characterization of the Photosensitizing Chromophores (Localisation,<br />
Fluorescence Characteristics)<br />
C. Coelho a , G. Guyot a , A. ter Halle a , O. T<strong>ru</strong>betskaya b , O. T<strong>ru</strong>betskoj c , L. Cavani d , C.<br />
Ciavatta d , C. Richard a<br />
a<br />
PRES Clermont, Laboratoire de Photochimie Moléculaire et Macromoléculaire, UMR<br />
CNRS-Université Blaise Pascal 6505, 63177 Aubière Cedex, France; b Branch of Shemyakin<br />
and Ovchinnikov Institute of Bioorganic Chemistry, Russian Academy of Sciences, 142290<br />
Pushchino, Moscow region, Russia; c Institute of Basic Biological Problems, Russian<br />
Academy of Sciences, 142290 Pushchino, Moscow region, Russia; d Dipartimento di Scienze<br />
e Tecnologie Agroambientali, Alma Mater Studio<strong>ru</strong>m-Universitá di Bologna, Viale Fanin 40,<br />
40127 Bologna, Italy.<br />
E-mail: Claire.richard@univ-bpclermont.fr<br />
1. Introduction<br />
The ability of humic substances (HS) to generate reactive species under excitation by solar<br />
light is an environmentally important property leading to the possible elimination of organic<br />
pollutants in all the terrestrial compartments. The capacity of dissolved HS to interact with<br />
solar light also opens the way to characterization studies based on photochemistry.<br />
The objective of our work is to characterize the chromophoric constituents of HS and of<br />
coloured natural organic matter that generate singlet oxygen and oxidize organic compounds<br />
under excitation [1]. We tried to answer two questions: 1) are they randomly distributed<br />
within the humic or concentrated in some specific moieties and 2) do they have some spectral<br />
characteristics that may be of help for further identification?<br />
2. Materials and Methods<br />
A great variety of humic samples were selected: humic and fulvic acids extracted from soils<br />
of very different origins, aquatic organic matter, water extract organic matter from soils and<br />
compost, humic-like substances extracted from compost [2]. Moreover, humic acids were<br />
fractionated using different techniques (ultrafiltration (UF) without or in the presence of 7M<br />
urea, size-exclusion chromatography in coupling with polyacrylamide gel electrophoresis)<br />
and fractions showing distinct molecular weight (MW) were recovered in preparative<br />
quantities [3, 4]. Fluorescence spectra were recorded on a Perkin-Elmer LS-55 luminescence<br />
spectrometer [3]. The formation of singlet oxygen was monitored using furfuryl alcohol as a<br />
scavenger. Solutions containing the HS and furfuryl alcohol (10 -4 M) were irradiated using<br />
polychromatic light (300–450 nm).<br />
<strong>Vol</strong>. 2 Page - 126 -
15th IHSS Meeting- <strong>Vol</strong>. 2<br />
3. Results and Discussion<br />
Each of the samples was characterized for its spectral properties (UV-visible absorbance,<br />
fluorescence through excitation emission matrix) and was investigated for its ability to<br />
produce singlet oxygen in given conditions, the absorbance of solutions being set at 0.100 ±<br />
0.005 at 300 nm. The main findings are the following:<br />
As far as the localisation of photosensitizing chromophores is concerned, results depend on<br />
the fractionation procedure. When HS are fractionated using UF without any additives one<br />
finds that all the MW fractions produce singlet oxygen under irradiation and thus that<br />
photosensitizing chromophores are randomly distributed among fractions. When they are<br />
fractionated in the presence of urea —a hydrogen bond denaturing agent, the fractions of MW<br />
lower than 30 kDa generate much more singlet oxygen than the fractions of higher MW.<br />
Intensity of fluorescence (a.u.)<br />
800<br />
600<br />
400<br />
200<br />
Humic acids and their fractions<br />
λ exc<br />
=300 nm<br />
λ em<br />
=560 nm<br />
0<br />
0,0 0,2 0,4 0,6 0,8 1,0 1,2 1,4<br />
rate of FFA loss x10 3 (s -1 )<br />
Concerning fluorescence, we observed a<br />
nice positive correlation between the<br />
capacity of humic samples or humic acid<br />
fractions to produce singlet oxygen and their<br />
fluorescence above 560 nm. Thus<br />
photosensitizing chromophores are<br />
fluorescent at long wavelength.<br />
4. Conclusions<br />
Thus we may conclude that photosensitizing chromophores are in great part located in small<br />
macromolecules embedded in the humic network. They are fluorescent above 560 nm. This<br />
constitutes an important information for further identification.<br />
Acknowledgements<br />
Authors thank INTAS for financial support under the grant 06-8055.<br />
References<br />
1. S. Halladja, A. ter Halle, J.-P. Aguer, A. Boulkamh, C. Richard, Environ. Sci. Technol. 41, (2007),<br />
6066.<br />
2. C. Coelho et al., in preparation.<br />
3. L. Cavani, S. Halladja, A. Ter Halle, G. Guyot, G. Corrado, C. Ciavatta, A. Boulkamh and C.<br />
Richard, Environ. Sci. Technol., 43, (2009), 4348.<br />
4. O.A. T<strong>ru</strong>betskoj, O.E. T<strong>ru</strong>betskaya, G.V. Afanas’eva O.I. Reznikova, C. Saiz-Jimenez, J.<br />
Chromatogr. A, 767 (1997) 285.<br />
<strong>Vol</strong>. 2 Page - 127 -
15th IHSS Meeting- <strong>Vol</strong>. 2<br />
Capillary Electrophoretic Characterisation of Humic Substances<br />
Viia Lepane*, Jekaterina Gorohhova<br />
Inst. of Chemistry, Tallinn Univ. of Technology, Akadeemia tee 15, 12618 Tallinn, Estonia<br />
E-mail: viia.lepane@ttu.ee<br />
1. Introduction<br />
Capillary electrophoresis has been effective for the separation of many organic<br />
biomacromolecules due to the high separation efficiency. The earlier results clearly indicate<br />
the potential of this method for the fingerprint characterisation of organic matter from<br />
different sources [1−3]. In this study an attempt was made to separate humic substances (HS)<br />
using capillary electrophoresis with hydrophilic-coated capillaries. The separation of HS was<br />
carried out by using polyethylene glycol-coated (CEP) capillaries, that were not used for this<br />
purpose before.<br />
2. Materials and Methods<br />
Experiments were performed to analyse standard solutions of humic acids (HA). HA (Fluka,<br />
Aldrich) was dissolved in 1-5 M urea, to avoid conformational changes induced by basic<br />
media. Similar HA concentration 0.15 mg L -1 was used in all experiments. As representatives<br />
of natural aquatic samples, a water sample from Lake Peipsi (DOC 2.2 mg L -1 ) and pore water<br />
sample from Lake Võrtsjärv sediment core (DOC 12.4 mg L -1 ) were analysed as well.<br />
Capillary electrophoresis experiments were performed with HP 3D CE system (Hewlett-<br />
Packard, Waldbronn, Germany). For detection, the diode array detector (DAD) was used and<br />
the electropherograms were registered at 3 wavelengths 210 (214), 254 and 280 nm.<br />
Operation of the inst<strong>ru</strong>ment, data collection and analyses were controlled by ChemStation<br />
system software.<br />
CEP- and PVA- (polyvinyl alcohol) coated capillaries from Agilent (G1600-62318 and<br />
G1600-61419, respectively) were used for separation experiments. Dimensions of CEP<br />
capillary were: total length - 74 cm, effective length to the detector - 64.5 cm with i.d. 75 µm.<br />
PVA capillary had a total length of 64.5 cm, an effective length of 56 cm with i.d. 100 µm.<br />
Both capillaries were rinsed first 15 mins with ultrapure water and 40 mM phosphate buffer<br />
pH 6.8, and thereafter conditioned 2 min with the analysis voltage. Between the <strong>ru</strong>ns 4 min<br />
rinse with the phosphate buffer was performed. Each day at the end of experiments the<br />
capillaries were rinsed 5 min with phosphate buffer, 15 min with ultrapure water and dried<br />
with air for 10 min.<br />
<strong>Vol</strong>. 2 Page - 128 -
15th IHSS Meeting- <strong>Vol</strong>. 2<br />
3. Results and Discussion<br />
By using the CEP-coated capillary the HA standard solutions were analysed. The largest peak<br />
for HA was obtained by dissolving it in 5M urea (Fig.1). In order to obtain detectable signal,<br />
the injection time of the sample between 30 to 40 s was essential (Fig.2). The electrophoretic<br />
mobility for humic acid peak was -2.87.10 -8 m 2 sV -1 .<br />
mAU<br />
*DAD1 A, Sig=210,15 Ref=off (F:\DOCUMENTS\JEKATERINA BAKATÖÖ\100308_1.D)<br />
*DAD1 A, Sig=210,15 Ref=off (F:\DOCUMENTS\JEKATERINA BAKATÖÖ\100308_3.D)<br />
*DAD1 A, Sig=210,15 Ref=off (F:\DOCUMENTS\JEKATERINA BAKATÖÖ\080408_4.D)<br />
2- HA<br />
3<br />
200<br />
1<br />
4<br />
5 M karbamiid<br />
150<br />
3 M karbamiid<br />
100<br />
50<br />
1 M karbamiid<br />
0<br />
5 10 15 20 25 30 35 40<br />
min<br />
Figure 1: Electropherograms of HA by using CEP-coated capillary; detection at 210 nm injection 40 s; HA 0.15<br />
mg L -1 dissolved in 1, 3 and 5M urea .<br />
mAU<br />
200<br />
*DAD1 A, Sig=210,15 Ref=off (F:\DOCUMENTS\JEKATERINA BAKATÖÖ\190208_1.D)<br />
*DAD1 A, Sig=210,15 Ref=off (F:\DOCUMENTS\JEKATERINA BAKATÖÖ\260208_1.D)<br />
*DAD1 A, Sig=210,15 Ref=off (F:\DOCUMENTS\JEKATERINA BAKATÖÖ\080408_4.D)<br />
2- HA<br />
3<br />
175<br />
150<br />
1<br />
125<br />
4<br />
40 s<br />
100<br />
75<br />
30 s<br />
50<br />
25<br />
10 s<br />
0<br />
5 10 15 20 25 30 35 40<br />
min<br />
Figure 2: Electropherograms of HA by using CEP-coated capillary with varied sample injection times 10-40 s;<br />
detection at 210 nm; voltage -20 kV.<br />
<strong>Vol</strong>. 2 Page - 129 -
15th IHSS Meeting- <strong>Vol</strong>. 2<br />
The electropherograms of Lake Peipsi water and Lake Võrtsjärv pore water showed one broad<br />
humic acid peak at detection wavelengths 254 and 280 nm (Fig.3).<br />
a) b)<br />
DAD1 B, Sig=214,8 Ref=off (F:\DOCUMENTS\JEKATERINA BAKATÖÖ\110407_5.D)<br />
DAD1 C, Sig=254,8 Ref=off (F:\DOCUMENTS\JEKATERINA BAKATÖÖ\110407_5.D)<br />
DAD1 D, Sig=280,16 Ref=off (F:\DOCUMENTS\JEKATERINA BAKATÖÖ\110407_5.D)<br />
*DAD1 A, Sig=210,15 Ref=off (F:\DOCUMENTS\JEKATERINA BAKATÖÖ\120208_5.D)<br />
*DAD1 B, Sig=254,25 Ref=off (F:\DOCUMENTS\JEKATERINA BAKATÖÖ\120208_5.D)<br />
*DAD1 C, Sig=280,40 Ref=off (F:\DOCUMENTS\JEKATERINA BAKATÖÖ\120208_5.D)<br />
mAU<br />
mAU<br />
140<br />
17.5<br />
120<br />
15<br />
100<br />
12.5<br />
80<br />
10<br />
214 nm<br />
7.5<br />
254 nm<br />
60<br />
280 nm<br />
5<br />
280 nm<br />
40<br />
254 nm<br />
2.5<br />
20<br />
210 nm<br />
0<br />
0<br />
5 10 15 20<br />
min<br />
5 10 15 20 25 30 35 40<br />
min<br />
Figure 3: Electropherograms of (a) Lake Peipsi water and (b) Lake Võrtsjärv pore water by using CEP-coated<br />
capillary. Detection at 210, 254 and 280 nm; voltage -20 kV.<br />
The dependence of analysis voltage on separation of pore water dissolved organic matter<br />
(DOM) was investigated. It was clarified, that increased analysis voltage resulted to decrease<br />
of humic peak migration time but did not increase resolution (Fig. 4). The suitable analysis<br />
voltage was stated to be -20 kV. The electrophoretic mobility for humic peak maximum was<br />
-3.20.10 -8 m 2 sV -1 at 254 nm.<br />
a) -15 kV b) -20 kV<br />
DAD1 A, Sig=210,15 Ref=off (F:\DOCUMENTS\JEKATERINA BAKATÖÖ\110208_3.D)<br />
mAU<br />
DAD1 A, Sig=210,15 Ref=off (F:\DOCUMENTS\JEKATERINA BAKATÖÖ\110208_1.D)<br />
mAU<br />
7<br />
6<br />
6<br />
5<br />
5<br />
4<br />
4<br />
3<br />
3<br />
2<br />
2<br />
1<br />
1<br />
0<br />
0<br />
-1<br />
5 10 15 20 25 30<br />
min<br />
5 10 15 20 25 30<br />
min<br />
c) -25 kV d) -30 kV<br />
DAD1 A, Sig=210,15 Ref=off (F:\DOCUMENTS\JEKATERINA BAKATÖÖ\110208_4.D)<br />
DAD1 A, Sig=210,15 Ref=off (F:\DOCUMENTS\JEKATERINA BAKATÖÖ\110208_5.D)<br />
mAU<br />
mAU<br />
10<br />
10<br />
8<br />
8<br />
6<br />
6<br />
4<br />
4<br />
2<br />
2<br />
0<br />
0<br />
5 10 15 20 25 30<br />
min<br />
5 10 15 20 25 30<br />
min<br />
Figure 4: Electropherograms of pore water DOM by using CEP capillary with different analysis<br />
voltages a) -15 kV, b) -20 kV, c) -25 kV, d) -30 kV.<br />
<strong>Vol</strong>. 2 Page - 130 -
15th IHSS Meeting- <strong>Vol</strong>. 2<br />
For the comparison of separation efficiency, the PVA-coated capillary was also used to<br />
analyse HA standard. As result, one relatively broad humic acid peak was obtained (Fig. 5).<br />
When 210 nm was used for detection, a humic peak and additional sharp peaks (Fig. 5a, no 1-<br />
7) were separated. The average migration time for humic peak maximum was 17.6 min. The<br />
electrophoretic mobility for humic peak was -3.44.10 -8 m 2 sV -1 .<br />
a) b)<br />
DAD1 A, Sig=210,15 Ref=off (F:\DOCUMENTS\JEKATERINA BAKATÖÖ\151008_4.D)<br />
mAU<br />
2<br />
17.5<br />
DAD1 B, Sig=254,25 Ref=off (F:\DOCUMENTS\JEKATERINA BAKATÖÖ\151008_4.D)<br />
mAU<br />
5<br />
15<br />
6<br />
4<br />
12.5<br />
10<br />
3<br />
7.5<br />
5<br />
2.5<br />
0<br />
1<br />
3 4 HA<br />
7<br />
2<br />
1<br />
0<br />
-2.5<br />
5 10 15 20 25 30 35 40<br />
min<br />
5 10 15 20 25 30 35 40<br />
min<br />
Figure 5: Electropherograms of HA by using PVA-coated capillary, detection at a) 210 nm and b) 254<br />
nm; analysis voltage -10 kV, injection 10 s; HA 0.15 mg L -1 in 5M urea.<br />
4. Conclusions<br />
The results of this work indicated that CEP-coated capillaries can be used for separation of<br />
humic substances in standard solutions and DOM in natural aquatic samples but the usage of<br />
relatively high analysis voltage (-20 kV) and long injection times (40 s) are essential. The<br />
PVA-coated capillary should be preferred because of the lower analysis voltage (-10 kV) and<br />
shorter injection times (10 s).<br />
References<br />
1. J. Peuravuori, V. Lepane, T. Lehtonen and K. Pihlaja, J. Chromatogr. A, 1023 (2004)<br />
129.<br />
2. J. Peuravuori, T. Lehtonen, V. Lepane and K. Pihlaja, Talanta, 67 (2005) 103.<br />
3. V. Lepane, Acta Universitatis Latviensis, 692 (2005) 56.<br />
<strong>Vol</strong>. 2 Page - 131 -
15th IHSS Meeting- <strong>Vol</strong>. 2<br />
Potential of Capillary Electrophoresis for Estimation of Humic Substances<br />
Physico-Chemical Properties<br />
F. d’Orlyé*, P. Reiller<br />
CEA, CE Saclay, DEN DANS DPC SECR, Lab Speciat Radionucleides & Mol,<br />
F-91191 Gif Sur Yvette, France<br />
*E-mail: fanny.dorlye@cea.fr<br />
1. Introduction<br />
Despite the number of publications devoted to humic substances (HS) investigation, both their<br />
st<strong>ru</strong>cture and reactivity remain a matter of debate. Over the last two decades, there has been<br />
an effort to extend capillary electrophoresis (CE) applications to HS characterization [1] as it<br />
allows the separation and detection of natural organic material (NOM) in aqueous solutions<br />
close to environmental conditions. In this context, CE is mainly known to give information on<br />
the electrophoretic behaviour of HS. This in turn can provide deeper insight into their size and<br />
shape, as well as surface charge density, according to appropriate electrokinetic models [2].<br />
Besides, CE has recently proved to be well suited for performing Taylor dispersion analysis<br />
(TDA) in order to measure the average diffusion coefficients (D) of polydisperse samples<br />
such as polyelectrolytes [3] or nanoparticles [4].<br />
The aim of the present work is to give an overview of the use of CE in the characterization of<br />
HS, and to emphasize on the factors that may impact their st<strong>ru</strong>ctural properties and reactivity<br />
such as electrolyte composition (pH, ionic strength, counter-ion and co-ion nature, and<br />
concentration), as well as HS origin and concentration.<br />
2. Materials and Methods<br />
Carbonate buffers of various ionic strength (1 to 250 mM) and fixed pH 10 used throughout,<br />
were prepared by mixing stock solutions of 1 M (0.1 M, respectively) Na 2 CO 3 and 1 M (0.1<br />
M, respectively) NaHCO 3 . Purified Aldrich humic acid (PAHA) was first solubilised in 5 mM<br />
NaOH solution in order to obtain a 1 g/L, pH 10, stock solution. This solution was further<br />
diluted (× 2) in appropriate electrophoretic buffer and stayed still for at least 24 h. N,Ndimethylformamide<br />
was used as electroosmotic flow (EOF) marker at 0.01 % v/v in buffer<br />
solution.<br />
Electrophoretic measurements were carried with a Beckman P/ACE MDQ capillary<br />
electrophoresis system. 50 µm id × 60 cm fused-silica capillaries (detection length, 50 cm)<br />
were used. Successive hydrodynamic injections (0.2 psi, 5 s) were performed at the capillary<br />
outlet, in the following order: neutral marker, electrophoretic buffer, PAHA sample and<br />
<strong>Vol</strong>. 2 Page - 132 -
15th IHSS Meeting- <strong>Vol</strong>. 2<br />
electrophoretic buffer. The applied voltage was -10 kV. The temperature of the garage and the<br />
capillary cartridge was set at 25 °C. The detection wavelength for the EOF marker was<br />
200nm. For PAHA, detection wavelength was either 200 or 254 nm. Between two analyses<br />
the capillary was successively flushed with: (i) 0.1 M NaOH (20 psi, 1 min), (ii) H 2 O (20 psi,<br />
1 min) and (iii) electrophoretic buffer (20 psi, 1 min). TDA measurements were carried out<br />
under similar conditions except for the injection and mobilization steps: no injection was<br />
performed but the PAHA solution was continuously percolated trough the inlet end of the<br />
capillary under an applied mobilization pressure of 1 psi.<br />
3. Results and Discussion<br />
Figure 1A shows the electropherogram of PAHA (0.5 g/L) with a 7.1 mM Na 2 CO 3 /8.84 mM<br />
NaHCO 3 (I = 30 mM), pH 10, electrolytic buffer. Under these conditions PAHA migrates as a<br />
negatively charged analyte since most of the humic functions are ionized at pH 10. Broad<br />
electrophoretic profiles, characteristic of analyte samples presenting intrinsic size/charge<br />
polydispersity are observed. At pH 10, the effective mobility (µ ep ) of PAHA could be<br />
measured as a function of ionic strength in the range 1–250 mM. As can be seen from Figure<br />
1B, we experienced a monotonous decrease in PAHA effective mobility, from –50.6 10 -5<br />
cm 2 .V -1 .s -1 (RSD 8.6 %, n=3) to – 30.5 10 -5 cm 2 .V -1 .s -1 (RSD 0.2 %, n=3), over an increasing<br />
ionic strength from 10 to 250 mM. In the range 1–10 mM, measurements were noticeably<br />
12<br />
EOF<br />
A<br />
-27<br />
-32<br />
Ionic strength (mM)<br />
0 50 100 150 200 250<br />
B<br />
Absorbance (mAU)<br />
9<br />
6<br />
3<br />
PAHA<br />
µ ep<br />
(10 -5 cm 2 .V -1 .s -1 )<br />
-37<br />
-42<br />
-47<br />
-52<br />
0<br />
0 2 4 6 8<br />
10<br />
Time (min)<br />
-57<br />
Figure 1: (A) Electropherogram of PAHA (0.5 g/L) with a 7.1 mM Na 2 CO 3 /8.84 mM NaHCO 3 (I = 30<br />
mM), pH 10, electrolytic buffer. (B) Influence of ionic strength on the electrophoretic mobility of<br />
PAHA (0.5 g/L). Experimental conditions: see § 2.Material and methods.<br />
<strong>Vol</strong>. 2 Page - 133 -
15th IHSS Meeting- <strong>Vol</strong>. 2<br />
unstable as evidenced by RSD values up to 8.9 %. Similar mobility dependence has been<br />
previously observed for IHSS aquatic fulvic and humic acids as well as IHSS peat humic acid<br />
in buffers with ionic strength ranging from 10 to 120 mM [5]. This decrease in effective<br />
mobility could be attributed either to a decrease of the surface charge density at the shear<br />
plane due to a charge screening effect, or to an increasing size of the charged analytes a priori<br />
linked to aggregation. In this context, the coupling of CE with Taylor dispersion analysis<br />
(TDA) was used to determine the average diffusion coefficient of PAHA and thus estimate<br />
their equivalent spherical hydrodynamic radii (R H ) using the Stokes-Einstein equation. It is<br />
based on the dispersion of a solute front in a solvent flow under a parabolic velocity profile<br />
(laminar Poiseuille flow). Thus, the combined effect of convection and diffusion leads to a<br />
specific concentration profile, whose temporal variance and detection time allow determining<br />
the diffusion coefficient of the considered solute. The last two parameters were obtained by<br />
fitting experimental profiles as shown in figure 2. Measured average diffusion coefficients of<br />
PAHA were about 2 10 -3 m 2 .s -1 , corresponding to R H of approximately 1.2 nm over the all<br />
range of studied ionic strengths. This, as well as the smooth electrophoretic profiles, allows<br />
eliminating any assumption of aggregation for this sample consequently to an increase in<br />
ionic strength. Nevertheless, TDA measurements highlighted the coexistence of a very minor<br />
(6-7 %) population of larger analytes (R H ranging from 29 to 57 nm) which seems in good<br />
agreement with previous investigations carried out in tapping mode atomic force microscopy<br />
on a peat humic acid [6].<br />
Normalized absorbance<br />
1.1<br />
0.9<br />
0.7<br />
0.5<br />
0.3<br />
0.1<br />
1.1<br />
1.0<br />
0.9<br />
0.8<br />
8 8.2 8.4 8.6 8.8<br />
9.0<br />
-1.1<br />
6 6.5 7 7.5 8 8.5 9 9.5<br />
Time (min)<br />
Figure 2. Experimental front concentration profile (diamonds; one tenth of the experimental points are<br />
represented for the sake of clarity) of PAHA (1 g/L) in a 24.9 mM Na 2 CO 3 /25.5 mM NaHCO 3 (I = 100<br />
mM), pH 10, electrolytic buffer. Experimental conditions: see § 2.Material and methods. Dashed and<br />
solid black lines are curves fitted to the analytical solution to the convection-diffusion equation<br />
assuming a sample respectively made of one (r²=0.9997) and two (r²=0.99997) distinct analyte<br />
populations.<br />
<strong>Vol</strong>. 2 Page - 134 -
15th IHSS Meeting- <strong>Vol</strong>. 2<br />
4. Conclusions<br />
This study shows the potential of capillary electrophoresis for the characterization of HS in<br />
solution allowing access to information on both size and charge parameters. So far, we<br />
highlighted the role of ionic strength, but further work is in progress to evidence other factors<br />
that may impact HS effective mobility and correlate these experimental results with potential<br />
alteration to HS st<strong>ru</strong>cture and reactivity.<br />
References<br />
1. P. Schmitt-Kopplin, J. Junkers, J. Chromatogr. A, 998 (2003) 1.<br />
2. J.F.L. Duval, K.J. Wilkinson, H.P. Van Leeuwen, J. Buffle, Environ. Sci. Technol., 39<br />
(2005) 6435.<br />
3. H. Cottet, J.P. Biron, M. Martin, Anal. Chem., 79 (2007) 9066.<br />
4. F. d'Orlyé, A. Varenne, P. Gareil, J. Chromatogr. A, 1204 (2008) 226.<br />
5. M. Hosse, K.J. Wilkinson, Environ. Sci. Technol., 35 (2001) 4301.<br />
6. E. Balnois, K.J. Wilkinson, J.R. Lead, J. Buffle, Environ. Sci. Technol., 33 (1999) 3911.<br />
<strong>Vol</strong>. 2 Page - 135 -
15th IHSS Meeting- <strong>Vol</strong>. 2<br />
Analysis of Carbohydrates In Peatbogs: Comparison of Acid Hydrolysis<br />
and Thermochemolysis Methods<br />
Céline Estournel a , Frédéric Dela<strong>ru</strong>e b , Laurent Grasset a* , Fatima Laggoun-Défarge b<br />
a Université de Poitiers, CNRS, Laboratoire de Synthèse et de Réactivité des Substances<br />
Naturelles – UMR 6514, 40 Avenue du Recteur Pineau, 86022 Poitiers cedex, France;<br />
b Université d'Orléans, Université François Rabelais - Tours, CNRS/INSU. Institut des<br />
Sciences de la Terre d’Orléans - UMR 6113. Campus Géosciences. 1A Rue de la Férollerie,<br />
45071 Orléans cedex 2, France<br />
E-mail: laurent.grasset@univ-poitiers.fr<br />
1. Introduction<br />
Polysaccharides are common st<strong>ru</strong>ctural and storage polymers in both marine and terrestrial<br />
organisms and account for 50% of plant litter entering the soil system [1]. They are<br />
potentially useful compounds in elucidating sources, processes and pathways of biologically<br />
important organic materials in natural environments. The amounts and relative contribution of<br />
individual monosaccharides to the total carbohydrate pool may provide indication on plant<br />
organic matter sources or microbial inputs. Acid hydrolysis is currently used to liberate<br />
carbohydrates from soils. Recommended procedures either use H 2 SO 4 , HCl or TFA [2] to<br />
hydrolyse cellulosic and non-cellulosic polysaccharides. However, this method is time<br />
consuming. On the other hand, tetramethylammonium hydroxide (TMAH) thermochemolysis<br />
is a rapid method and could be used for carbohydrate analyses. This technique can be also<br />
applied to large quantities of material (up to 1g) since a preparative technique was developed<br />
[3]. Thus, it is now commonly used for the st<strong>ru</strong>ctural investigation of natural organic matter in<br />
soils [4] such as lipids [3], lignin [5] or humic substances [6]. TMAH thermochemolysis<br />
products originating from carbohydrates have also been observed from humic matter, wood,<br />
marine sediments and tree leaves but only few studies have been done to identify these<br />
products [7, 8].<br />
We have compared two methods for the analysis of non-cellulosic sugars, acid<br />
hydrolysis with 1.2 M H 2 SO 4 and TMAH thermochemolysis, in order to determine which<br />
might be more appropriate for sediment and soil analysis. The goals were to: (1) compare the<br />
ability of each method for determining sugar biomarkers; (2) determine how comparable the<br />
two methods are in determining sugar biomarkers; (3) determine which method is more<br />
appropriate for sediments and soils analysis.<br />
<strong>Vol</strong>. 2 Page - 136 -
15th IHSS Meeting- <strong>Vol</strong>. 2<br />
2. Materials and Methods<br />
Samples were collected from a 50 cm peat core at six different depths in an ombrotrophic<br />
Sphagnum peat bog localised at Frasne, (Jura Mountains, France, 46°49’N, 6°10’E), two in<br />
the upper oxic part (acrotelm), two in the zone of water table fluctuations (mesotelm) and two<br />
in the anoxic part (catotelm) (Figure 1).<br />
For acid hydrolysis, peat sample (20 mg) was placed in a<br />
← 2.5–5.0 cm<br />
tightly closed Pyrex ® tube with 5 ml of 1.2 M H 2 SO 4<br />
← 12.5–15.0 cm under vacuum and heated at 100°C for 4 h. After cooling,<br />
deoxy-6-glucose (0.4 mg.ml -1 in water) was added as<br />
← 20.0–22.5 cm internal standard. The samples were subsequently<br />
← 25.0–27.5 cm neutralised with CaCO 3 . The precipitate was removed by<br />
centrifugation and the supernatant was evaporated to<br />
← 40.0–42.5 cm<br />
← 47.5–50.0 cm<br />
dryness. The sugars were then dissolved in CH 3 OH and<br />
the solution was purified by centrifugation. After<br />
transferring the solution to another vessel, the solvent was<br />
Figure 1: The studied peat core<br />
and depths of the sampling. evaporated under vacuum. The sugars were dissolved in<br />
pyridine containing 1wt% LiClO 4 and left 16h at 60°C for<br />
anomer equilibration, then they were silylated (Sylon BFT, Supelco) before analysis.<br />
For preparative thermochemolysis, samples were placed in ceramic boat after one hour<br />
moistening with 2 ml of a 50% (w/w) methanol solution of tetramethylammonium hydroxide<br />
(TMAH). Each sample was transferred in a 60x3 cm i.d. Pyrex® tube and heated at 400°C (30<br />
min isothermal period). Thermochemolysis products were swept by nitrogen (flow rate: 100<br />
ml.min -1 ) to a trap containing dichloromethane. After evaporation of the solvent, trapped<br />
pyrolysates were analysed by GC-MS. The various permethylated deoxy aldonic acids<br />
derived from carbohydrates were identified on the basis of their GC retention times, their<br />
mass spectra (comparison with standards) and literature data. For quantification, peak<br />
integrations was performed in the selected ion chromatogram at m/z 129 [7, 8] and compared<br />
with references obtained after thermochemolysis of known amounts of individual<br />
carbohydrates.<br />
<strong>Vol</strong>. 2 Page - 137 -
15th IHSS Meeting- <strong>Vol</strong>. 2<br />
3. Results and Discussion<br />
TMAH thermochemolysis of individual standard sugars released permethylated deoxy aldonic<br />
acids. They are formed from the reaction of alkali on reduced sugars that are then<br />
subsequently methylated [7]. Xylose and arabinose afforded identical saccharinic acid<br />
products. Ribose gave its own unique methylated saccharinic products. However, its retention<br />
time on GC-MS chromatogram was similar to those of xylose/arabinose thermochemolysis<br />
products so it could not be clearly identified. In the same way, glucose and mannose gave<br />
identical products. Galactose released four products. Two of them were specific for galactose<br />
and the others had identical retention time on GC-MS chromatogram to those of<br />
glucose/mannose thermochemolysis products. Rhamnose and fucose (6-deoxy-hexoses)<br />
afforded their specific products with distinct retention times on GC-MS chromatograms. Each<br />
of them gave specific saccharinic products whose mass spectra all have m/z 129 as the base<br />
peak. After TMAH thermochemolysis, series of permethylated deoxy aldonic acids were<br />
identified in the six peat samples. The main permethylated deoxy aldonic acids observed<br />
arose from glucose/mannose (Glu) (the most abundant), galactose (Gal), pentoses (such as<br />
xylose, arabinose and ribose) (C5), rhamnose (Rha) and fucose (Fuc) (Fig. 2).<br />
Total C5 Rha Fuc Glu Gal C5/C6 deoxy/C6<br />
Figure 2: Amounts of carbohydrates in peat samples released after acid hydrolysis (up) and<br />
thermochemolysis (bottom) (in mg/g of dry sample) (C6: glucose/mannose + galactose; deoxy:<br />
rhamnose + fucose)<br />
<strong>Vol</strong>. 2 Page - 138 -
15th IHSS Meeting- <strong>Vol</strong>. 2<br />
Total amounts of non-cellulosic carbohydrates obtained after acid hydrolysis are lower in the<br />
anoxic and more aged part than in the upper part of the peat profile. In the same way, C5/C6<br />
and deoxy/C6 ratios show the importance of the preservation of plant sugars all along the peat<br />
column (Fig. 2). At the contrary, by thermochemolysis, the total amount of carbohydrates<br />
increases with depth. This increase is mainly due to the increase of glucose and consequently,<br />
the C5/C6 and deoxy/C6 ratios decrease with depth (Fig. 2).<br />
There was poor agreement between the methods for sugars yields for the samples. It occurred<br />
because of inherent differences in chemolytic mechanisms, which resulted in selective bias in<br />
detection of compounds. While yields are lower for thermochemolysis, the increase of<br />
glucose with depth may occur because of the increase with humification of hydrolysable ester<br />
and labile ether bonds primarily cleaved by this method. Consequently, thermochemolysis<br />
could release a specific pool of glucose retained in the complex st<strong>ru</strong>cture of our peat samples.<br />
4. Conclusion<br />
The thermochemolysis method applied to our samples did not discriminate as effectively<br />
among carbohydrates sources as the acid hydrolysis method. We caution against making<br />
direct comparisons of thermochemolysis TMAH data with data generated from the acid<br />
hydrolysis method, because of the different mechanisms involved in each process. However,<br />
when using the thermochemolysis method for lipid, lignin or humic substances analysis in soil<br />
organic matter, it could be also useful to track carbohydrates for additional information.<br />
Acknowledgements<br />
This study is a contribution of the PEATWARM project (ANR-07-VUL-010) supported by<br />
ANR, the French National Agency for Research.<br />
References<br />
1. I. Kögel-Knabner, Soil Biol. Biochem. 34 (2002) 139.<br />
2. W. Amelung, M.V. Cheshire, G. Guggenberger, Soil Biol. Biochem. 28 (1996) 1631.<br />
3. L. Grasset, A. Amblès, J. Anal. Appl. Pyrolysis 47 (1998) 1.<br />
4. J.M. Challinor, J. Anal. Appl. Pyrolysis 61 (2001) 3.<br />
5. A. Nakagawa-izumi, K.I. Kuroda, T. Ozawa, Org. Geochem. 35 (2004) 763.<br />
6. F. Martín, F.J. González-Vila, J.C. del Río, T. Verdejo, J. Anal. Appl. Pyrolysis 28 (1994)<br />
71.<br />
7. D. Fabbri, R. Helleur, J. Anal. Appl. Pyrolysis 49 (1999) 277.<br />
8. L. Grasset, P. Rovira, A. Amblès, J. Anal. Appl. Pyrolysis 1-2 (2009) 435.<br />
<strong>Vol</strong>. 2 Page - 139 -
15th IHSS Meeting- <strong>Vol</strong>. 2<br />
St<strong>ru</strong>ctural and Statistical Analysis of Diverse Analytical Techniques Spectra<br />
from Diverse Source Organic Matter in Solution<br />
1. Introduction<br />
R. Baigorri a *, M. Fuentes a , F.J. González-Vila b , J.M. García-Mina a<br />
a CIPAV-Roullier Group, Orkoien, Spain; b IRNAS-CSIC, Sevilla, Spain<br />
E-mail: rbaigorri@timacagro.es<br />
Although many studies indicate that the qualitative and quantitative interpretation of the mass<br />
spectra of humic substances (HS) is frequently very difficult, recent studies have<br />
demonstrated that the use of sophisticated statistical tools, such as principal components<br />
analysis (PCA) or multilayer neural networks, could permit the adequate classification of<br />
humic samples as a function of their origin and sampling places (1).<br />
These studies showed the usefulness of statistical methods like principal components analysis<br />
(PCA) for the quantitative or semi-quantitative analysis of very complex data set (2). Among<br />
these statistical methods the use of a specific method of principal components analysis (PCA),<br />
Pareto analysis, has proven to be very promising (3). This statistical technique uses the Pareto<br />
principle: a large majority of consequences (80%) are produced by a few key causes (20%).<br />
Thus, the use of this complementary statistical approach can allow the analysis of the totality<br />
of the data derived from the use of the different analytical techniques (4). Likewise, it<br />
facilitates the identification of those st<strong>ru</strong>ctural features that characterize and discriminate each<br />
humic fraction.<br />
In this context, the employment of PCA-Pareto for the analysis of the data derived from the<br />
application of different analytical techniques (UV-Visible, FTIR, 13 C-NMR, fluorescence and<br />
Pyrolysis-GC/MS) will permit us to evaluate which region (or regions) of the spect<strong>ru</strong>m is<br />
more relevant in order to define each HS fraction. Finally, we have carried out a Discriminant<br />
Analysis (DA) of PCA-Pareto data to assess the capacity of these specific st<strong>ru</strong>ctural markers<br />
for grouping the different HS fractions. In this way, we also have applied PCA-Pareto and DA<br />
to biological raw materials, their composted outputs, humic acids (HA) and fulvic acids (FA)<br />
to find st<strong>ru</strong>ctural markers and to evaluate, if it is possible, the humification grade of<br />
composted materials.<br />
2. Materials and Methods<br />
Humic materials. Four soil HA, including two IHSS standards, two FA from IHSS standards,<br />
four biological raw materials (NON-COMP) and their composted outputs (COMP) were used<br />
<strong>Vol</strong>. 2 Page - 140 -
15th IHSS Meeting- <strong>Vol</strong>. 2<br />
this work.<br />
Extraction procedure. Humic fractions were isolated following the IHSS procedure. HA were<br />
fractionated in gray humic acid (GHA) and brown humic acid (BHA) fractions according to<br />
Swift (5).<br />
Inst<strong>ru</strong>mental Analysis. Samples were analyzed by solid-state 13 C NMR; UV-visible, FTIR and<br />
synchronous fluorescence spectroscopy (SFS), and Pyrolysis-GC/MS.<br />
Statistical software. The analytical data were treated to obtain Pareto analysis PCA by<br />
MarkerViewTM 1.1 software (Applied Biosystems). Discriminant analyses were performed<br />
by SPSS 12.0 software (SPSS Inc., Chicago).<br />
3. Results and Discussion<br />
The results of Pareto analysis showed that very useful st<strong>ru</strong>ctural information can be obtained<br />
(Table 1). Thus, the GHA fraction is characterized by an important degree of aliphaticity ( 13 C-<br />
NMR and FTIR), a certain aromaticity (according to SFS) but simpler than in BHA, and some<br />
conjugation in polyens and cianines (UV-Visible). The BHA fraction presents a greater and<br />
more complex aromatic character than GHA and FA ( 13 C-NMR, FTIR and UV-Visible<br />
analyses), involving polycyclic aromatics of about seven fused benzene rings (SFS) and<br />
heterocycles, such as benzothiophenes (SFS and Pyrolysis-GC/MS). Finally the FA fraction is<br />
the most heterogeneous one. It contains simpler, less degraded and more functionalizated<br />
organic molecules, such us polysaccharides, alcohols, ethers ( 13 C-NMR); aromatic amino<br />
acids and some aromatic groups (SFS); carboxylic groups (FTIR); furfurals and furans<br />
(Pyrolysis-GC/MS) and finally, conjugated systems that may involve complexed metals (UV-<br />
Visible) as Simpson et al. have previously hypothesized (6).<br />
Table 1: Different fractions in humic substances and their characteristic st<strong>ru</strong>ctural groups by<br />
13 C-NMR, SFS, FTIR, Pyrolysis GC-MS and UV-Visible.<br />
Besides the st<strong>ru</strong>ctural information inferred from this statistical analysis, the principal<br />
components extracted from the Pareto analysis have been used as variables in a discriminant<br />
analyses (DA). As revealed by DA, the Pareto-PCA analysis is able to gather and reduce the<br />
<strong>Vol</strong>. 2 Page - 141 -
15th IHSS Meeting- <strong>Vol</strong>. 2<br />
information about the whole spectra of the samples, with few loose of information. In this<br />
way, the samples were grouped reasonably well, without misclassification into another HS<br />
class (Figure 1).<br />
Canonical Discriminant Functions<br />
13 C-RMN<br />
SFS<br />
UV-Visible<br />
FTIR<br />
Pyrolysis GC/MS<br />
GHA<br />
BHA<br />
FA<br />
Group Centroid<br />
Figure 1. Grouping by Discriminant Analysis of gray humic acid (GHA), brown humic acid<br />
(BHA), and fulvic acid (FA) for 13 C-NMR, SFS, FTIR, Pyrolysis-GC/MS and UV-Visible.<br />
However, when Pareto analysis was applied to the data obtained for the HA, FA, and the<br />
humic-like extracts from composts and from their corresponding initial organic wastes; no<br />
st<strong>ru</strong>ctural conclusions could be straightforwardly inferred. Notwithstanding this fact, the<br />
subsequent DA analysis of the principal components showed statistically certain proximity<br />
among raw materials and their composted outputs indicating that composting is an evolution<br />
of organic matter but not so complex than humification process. This could be supported<br />
because the most generic techniques 13 C-NMR, SFS, FTIR, and UV-Visible showed a better<br />
discrimination among raw materials and their composted output than Pyrolysis-GC/MS, a<br />
more descriptive technique, indicating that a first step in the process of chemical<br />
differentiation has been reached but not a more complex differentiation involving certain<br />
humification.<br />
<strong>Vol</strong>. 2 Page - 142 -
15th IHSS Meeting- <strong>Vol</strong>. 2<br />
Canonical Discriminant Functions<br />
6<br />
3<br />
13 C-NMR<br />
4<br />
SFS<br />
3<br />
2<br />
UV-Visible<br />
Function 2<br />
0<br />
-3<br />
Function 2<br />
2<br />
0<br />
Function 2<br />
1<br />
0<br />
-1<br />
-2<br />
-6<br />
-2<br />
-3<br />
-9<br />
-4<br />
-20 -10 0 10<br />
Function 1<br />
-5 0 5 10<br />
Function 1<br />
-2 0 2 4 6<br />
Function 1<br />
15<br />
FTIR<br />
4<br />
Pyrolysis GC/MS<br />
Function 2<br />
10<br />
5<br />
Function 2<br />
3<br />
2<br />
1<br />
NON-COMP<br />
COMP<br />
HA<br />
FA<br />
Group Centroid<br />
0<br />
0<br />
-1<br />
-5<br />
-2<br />
-20 -10 0 10 20<br />
Function 1<br />
-4 -3 -2 -1 0 1 2<br />
Function 1<br />
Figure 2: Grouping by Discriminant Analysis of biological raw materials (NON-COMP), their<br />
composted outputs (COMP), humic acids (HA) and fulvic acids (FA) for 13 C-NMR, SFS,<br />
FTIR, Pyrolysis-GC/MS and UV-Visible.<br />
References<br />
1. E.M. Peña-Méndez, K. Novotná, D. Gajdošová, V. González, and J. Havel, Chemosphere.<br />
68 (2007) 2047.<br />
2. J. Boehme, P. Coble, R. Conmy, and A. Stovall-Leonard. Mar. Chem. 89 (2004) 3.<br />
3. R. Baigorri, A.M. Zamarreño, M. Fuentes, G. González-Gaitano, J.M. García-Mina,<br />
G. Almendros, and F.J. González-Vila. J. Agric. Food Chem. 56 (2008) 5480.<br />
4. G. Ka<strong>ru</strong>ppusami, and R. Gandhinathan. TQM Mag. 18 (2006) 372.<br />
5. R.S. Swift, Humic substances in soil, sediment and water: Geochemistry, isolation, and<br />
characterization. Wiley-Interscience, New York. 1985. p. 387.<br />
6. A.J. Simpson, W.L. Kingery, M.H.B. Hayes, M. Spraul, E. Humpfer, P. Dvortsak, R.<br />
Kerssebaum, M. Godejohann, and M. Hofmann. Naturwissenschaften. 89 (2002) 84.<br />
<strong>Vol</strong>. 2 Page - 143 -
15th IHSS Meeting- <strong>Vol</strong>. 2<br />
A Novel Approach of Different Analytical Tools Applied to the Study of Soils<br />
and Humic Substances<br />
Paula C. Dabas*<br />
Department of Analytical Chemistry and Physicochemistry. School of Pharmacy and<br />
Biochemistry. University of Buenos Aires. Junín 956 (1113). Ciudad Autónoma de Buenos<br />
Aires, Argentina.<br />
1. Introduction<br />
E-mail: pdabas@ffyb.uba.ar<br />
Analysis of soils has acquired increasing attention for the last years, due to the economic<br />
impact associated to it which affects not only agriculture but also the environment. Both, soil<br />
and humic acids (HA), which are very important components of soils, represent very complex<br />
samples. Their analyses constitute a t<strong>ru</strong>e challenge for analytical chemists. There are many<br />
publications on the analysis of the HAs and soils and each report brings something new,<br />
mainly due to the heterogenic characteristics of the sample under study (soil and/or humic<br />
substances). In recent years there has been an increase in the publications using sophisticated<br />
inst<strong>ru</strong>mentation not available to all laboratories, particularly those from developing countries.<br />
For this reason, the aim of the present work was to evaluate the use of the current analytical<br />
techniques and their potentiality in the analysis of soils and/or humic substances.<br />
2. Materials and Methods<br />
The chemicals used were either from analytical grade or HPLC grade. Soil samples from three<br />
different geographical areas of Argentina were analyzed.<br />
Extraction and purification of humic acids: The sample was washed twice with distilled water<br />
to extract the non-humic, water-soluble substances. Extraction of HA was then performed in<br />
sealed tubes with 0.5 M NaOH under constant shaking in a N 2 gas atmosphere for no more<br />
than 24 hours. After centrifuging the mixture for 25 minutes at 3000 rpm, the supernatant was<br />
acidified with 6 M HCl (pH 0.5- 1) to precipitate HA. The purification of HA was performed<br />
by the addition of 0.1 M NaOH to the pellet, centrifugation at 3000 rpm for 25 min and<br />
acidification with 6 M HCl. The final suspension containing HA was dialyzed with distilled<br />
water until free of chloride and freeze-dried. The use of NaF instead of HF was also evaluated.<br />
Gel permeation chromatography (low-pressure size-exclusion chromatography (SEC): The<br />
chromatography was made by passing a solution of HA in mobile phase (0.02 M borate<br />
buffer, pH 9.2) through a glass column (60 cm x 1.5 cm i.d.) containing Sephadex G-75 or<br />
Sephacryl S-200 High Resolution. The fractions were collected every 6 and 4 minutes,<br />
<strong>Vol</strong>. 2 Page - 144 -
15th IHSS Meeting- <strong>Vol</strong>. 2<br />
respectively. The absorbance was monitored at 280 nm. The process was repeated several<br />
times in order to obtain sufficient material. Each fraction eluted with the same volume of<br />
mobile phase was combined and acidified to obtain the HA. The samples were then treated as<br />
those extracted from soils.<br />
Infrared spectroscopy with transform Fourier (FTIR) spectroscopy: the spectra were<br />
performed on KBr pellet.<br />
Catalytic oxidation: A gold electrode modified with polymers of metalloprotoporphyrins was<br />
used. The synthesis of Me-protoporphyrins was performed following the Adler procedure (1)<br />
and the Fe III protoporphyrin IX following the Smith procedure (2). The electropolymerization<br />
of metalloprotoporphyrins were carried out in 0.1 M tetrabutylammonium perchloratedichloromethane<br />
by potential sweep between 0.00 and + 1.50 V (vs. Ag|AgCl) at 0.05 Vs -1 ,<br />
five cycles; for all the polymers except for Fe III protoporphyrin IX (0.00 to + 1.2 V). An<br />
aliquot of a solution of a commercial HA in 50 mM phosphate buffer pH 5.00 previously<br />
centrifuged and filtered through a 0.45 µm membrane filter was transferred to a glass tube.<br />
Following the addition of 0.5 mL 80 mM H 2 O 2 a gold electrode was immersed in the solution<br />
and samples at different time points were analyzed by gas chromatography (GC) and by<br />
capillary electrophoresis (CE).<br />
Gas chromatography-mass spectrometry analysis: A HP-5MS (5%)-diphenyl-(95%)-<br />
dimethylsiloxane capillary column (30 m x 0.25 µm; Supelco) with helium (99.995 % pure)<br />
as gas carrier was used. Initially the column was maintained at 70 °C for 2 min, but then the<br />
temperature was increased to 230 °C at a rate of 8 °C/min, which was held until the end of the<br />
analysis. The mass spectrometer operated in the range of m/z 50 -550 amu. An aliquot of the<br />
aqueous solution was acidified with 6 M HCl and extracted with a sixth volume of<br />
chloroform, and finally chromatographied.<br />
Capillary electrophoresis analysis: Capillary zone electrophoresis mode with UV detection<br />
using a fused silica capillary of 60 cm total length x 75 µm i.d. was used. The background<br />
electrolyte was a 15 mM borate buffer, pH 10.0. The voltage was 20 kV and the analysis was<br />
carried out at room temperature. All the solutions and samples were filtered through a 0.45<br />
µm membrane filter before the analysis. Samples were introduced in mode hydrostatic for 30<br />
s and detection performed at 214 nm.<br />
Other analysis: Redox tritations of isolated HAs and enzymatic determinations for dry soils<br />
by conventional methods were also performed.<br />
<strong>Vol</strong>. 2 Page - 145 -
15th IHSS Meeting- <strong>Vol</strong>. 2<br />
3. Results and Discussion<br />
A wide variety of methods for extraction of HAs is described in the literature (3-10). This led<br />
to an evaluation of different methodologies to develop one, which allowed the analysis of<br />
HAs with good performance and purity in the shortest time. Different treatments for HAs<br />
purification were also studied. Results were assessed by FTIR.<br />
The gel permeation chromatography was conducted using a borate /boric acid buffer, pH<br />
alkaline and the stationary phase chosen was Sephacryl, because it achieved a better<br />
resolution in less time than Sephadex. The HAs were dissolved in mobile phase, so they can<br />
form complexes with buffer components before being introduced into the column. The effect<br />
of full volume and the AH concentration on the separation efficiency was also evaluated.<br />
Other analyses were carried out with fractions obtained from the chromatographic separation<br />
HAs in order to obtain information which can be extrapolated to soils that originated them.<br />
FTIR is useful since fractions obtained by SEC have different MW indicating that the<br />
chemical st<strong>ru</strong>cture is different and the abundance of functional groups is heterogeneous.<br />
However it was noted that even in soils with different characteristics, it was difficult to<br />
appreciate significant differences in the FTIR spectra. In order to magnify the differences<br />
between samples it’s convenient to obtain spectra differences. The first stage requires<br />
normalizing the spectra in a carefully chosen band with a common transmittance value.<br />
Normalization is performed for a sample pattern chosen depending on the type of study. In the<br />
present study normalization was obtained by comparing with commercial HA. The band<br />
chosen should not present changes or alterations either in its position or form.<br />
The application of monometallic and bimetallic complexes of porphyrins to HA and soil<br />
samples patterns oxidation catalysts proved to be very useful, getting the best results with<br />
polymers of Coprotoporphyrin films. The mild oxidation of humic substances with catalysts<br />
redox shown promising results, since a relatively simple profile in GC and CE was obtained,<br />
allowing the ability categorization of different types of soils and possible contamination.<br />
The increase of biological activity in cultivated soil shows a significant increase of the<br />
enzymatic activity, the catalytic chemical reactions are essential in the nutrition plant (11).<br />
Enzymatic determinations were conducted on dry ground samples since its allows working<br />
with more homogeneous samples and preserving them without undergoing chemical changes.<br />
These results were encouraging, since if combined with the other methods they could be early<br />
markers of soil deterioration (12).<br />
<strong>Vol</strong>. 2 Page - 146 -
15th IHSS Meeting- <strong>Vol</strong>. 2<br />
4. Conclusions<br />
Classical analytical chemistry is still very useful in the analysis of complex samples with<br />
variable composition as those studied in the present work. It provides relevant information<br />
which can be complementary to the data obtained by other techniques. Unfortunately at<br />
present, there is not a sole technique which can render all the necessary information regarding<br />
soils. Therefore a hard work is needed to assemble the results obtained by different analytical<br />
techniques to achieve the desired information.<br />
Acknowledgements<br />
This work was supported by grants from the University of Buenos Aires (UBACYT B062)<br />
and The Consejo Nacional de Investigaciones Cientificas y Tecnicas (CONICET) (PIP5021).<br />
References<br />
1. D. Adler, F. R. Longo, F. Kampas and J Kim. J. Inorg. Nucl. Chem., 32 (1970) 2443.<br />
2. K. M. Smith, Porphyrins and Metalloporphyrins. Elsevier, Amsterdam, 1975.<br />
3. D. C. Olk, K. G. Cassman and T. W. M. Fan. Geoderma. 65 (1995) 195.<br />
4. A. Piccolo, P. Conte and A. Cozzolino. Eur. J. Soil Sci. 50 (1999) 687.<br />
5. E. Velthorst, N. Nakken-Brameijer and J. Mulder. Intern. J. Environ. Anal. Chem. 73<br />
(1999) 237.<br />
6. Christl, H. Knicker, I. Koègel-Knabner and R. Kretzschmar. Eur. J. Soil Sci. 51 (2000)<br />
617.<br />
7. Watanabe, A. Sarno, B. J. Rumbanraja, B. K. Tsutsuki and M. Kimura. Eur. J. Soil Sci. 52<br />
(2001) 599.<br />
8. N. Senesi, V. D’Orazio and G. Ricca. Geoderma. 116 (2003) 325.<br />
9. M. C. Zancada, G Almendros and R. J. Ballesta. Sci. Total Environ. 313 (2003) 245.<br />
10. S. Amir, M. Hafidi, J. R. Bailly and J. C. Revel. Agronomie. 23 (2003) 269.<br />
11. R. Zornoza, C. Guerrero, J. Mataix-Solera, V. Arcenegui, F. García-Orenes y Mataix- J.<br />
Beneyto. Soil Biol. Biochem. 38 (2006) 2125.<br />
12. M. Alexander. Introducción a la microbiología del suelo. AGT. Editor S.A. México, 1980.<br />
<strong>Vol</strong>. 2 Page - 147 -
15th IHSS Meeting- <strong>Vol</strong>. 2<br />
Study of Immobilized Aluminium(III) Metal Ion Affinity Chromatography<br />
for Fractionation and Characterization of Humic Substances<br />
Radoslav Halko * , Tibor Neuročný, Milan Hutta<br />
Department of Analytical Chemistry, Faculty of Natural Sciences, Comenius University,<br />
Mlynská dolina CH-2, 842 15 Bratislava, Slovakia<br />
E-mail: halko@fns.uniba.sk<br />
1. Introduction<br />
Immobilized metal affinity chromatography (IMAC) is gaining widespread popularity as an<br />
effective tool for the separation and characterization of a variety of biological<br />
macromolecules [1]. This chromatographic technique is based on the interaction between<br />
molecules in solution and metal ions immobilized on a solid support. The molecules are<br />
separated according to their affinity for chelating metal ions, which depends on the<br />
coordination between the chelating metal ion and electron donor groups from the ligand. The<br />
ligands are assumed to bind to the metal through ligand exchange. Immobilized metal affinity<br />
chromatography is the most commonly used in biochemistry and molecular biology [2].<br />
However, IMAC has been also employed to isolate natural organic ligands from aquatic<br />
environments and to separate humic substances (HS) [3]. Humic substances possess a variety<br />
of sub-st<strong>ru</strong>ctures and functional groups, such as carboxylic, aromatic hydroxyl, aliphatic<br />
hydroxyl and amine groups, which may provide potential binding sites for metals via their<br />
lone electron pairs. Thus, IMAC may be applied to separate different HS fractions based on<br />
their affinity with the immobilized metal ions, e.g. Cu(II) [4]. In combination with the other<br />
techniques, isolated HS fractions have been characterized by complexation capacity,<br />
molecular size distribution, and HS amino acids profile characterization [5].<br />
The aim of this work was the study of IMAC technique for the fractionation of HS,<br />
specifically humic acids (HA). Trivalent ions of aluminum were chosen as an immobilized<br />
metal in IMAC for this purpose. Model Al(III)-IDA IMAC has been investigated only for<br />
purification of phosphoproteins [6] and purification and characterization of Al(III) binding<br />
ligands from Pisolithus tinctorius [7], but till now we have no evidence of its use for<br />
fractionation and/or characterization of HS, in spite of the fact that prevailing elements in soil<br />
are iron and aluminium (e.g. in aluminosilicates).<br />
<strong>Vol</strong>. 2 Page - 148 -
15th IHSS Meeting- <strong>Vol</strong>. 2<br />
2. Materials and Methods<br />
The sorption characteristics of Al(III) ions for the chelating sorbent were measured by<br />
peristaltic pump PCR 01 (Labeco, Spišská Nová Ves, Slovakia) combined with off-line<br />
spectrophotometric detection by spectrophotometric detector UVIKON 810 (Kontron,<br />
Switzerland). Chromatographic analyses were carried out by the HPLC system Elite LaChrom<br />
(Merck–Hitachi, Darmstadt, Germany) consisting of L-2130 pump provided with quarternary<br />
low-pressure gradient with solvent degasser, L-2200 autosampler, L-2400 UV-VIS<br />
spectrophotometric detector, L-2300 column oven, organizer and PC data station with<br />
software EZChrom Elite ver.3.1.3. software. Separation conditions for the selected aromatic<br />
acids (gallic acid, 4-hydroxybenzoic acid, benzoic acid, cinnamic acid, protocatechuic acid,<br />
phthalic acid and vanillic acid) were optimized by Elite LaChrom HPLC system using<br />
gradient elution with the mobile phase containing methanol and phosphate buffer solution.<br />
Constant flow rate 1 ml min -1 was used. The analytical column was LiChrocart (125×4 mm)<br />
containing LiChrospher 100, RP-18, 5 μm stationary phase produced by Merck (Darmstadt,<br />
Germany). All measurements were done at 250 nm. Column temperature was set at 40±0.1 ○ C.<br />
In IMAC procedures, we packed glass chromatographic column CGC (30×3 mm) produced<br />
by Tessek (Prague, Czech Republic) with chelating sorbent Iontosorb Salicyl (approximately<br />
250 mg). The column was equilibrated with 5 ml deionized water, and then 10 ml acetate<br />
buffer solution. After elution, the column was regenerated by washing with 10 ml solution of<br />
EDTA. The working standard of HA was isolated from peat from Cerová territory, Slovakia<br />
[8].<br />
3. Results and Discussion<br />
Chelating sorbent Iontosorb Salicyl was used for measurement of sorption characteristics of<br />
Al(III). This chelating sorbent is containing salicylic acid bound via azo group in side chains<br />
of modified bead-form cellulose (Fig. 1). The concentration of active groups is 0.2 mmol g -1<br />
at minimum.<br />
O<br />
CELLULOSE<br />
O<br />
CH 2 CH 2<br />
S<br />
N<br />
N<br />
OH<br />
O<br />
Figure 1: St<strong>ru</strong>cture of chelating sorbent Iontosorb Salicyl<br />
HO<br />
O<br />
<strong>Vol</strong>. 2 Page - 149 -
15th IHSS Meeting- <strong>Vol</strong>. 2<br />
Iontosorb Salicyl was chosen for two reasons: 1. Al(III)-salicyl chelate has high constant of<br />
stability (log β = 14.1) and 2. the salicyl functional group is one of functional groups of HS<br />
that are occurring naturally. The sorption characteristics of Al(III) were studied at different<br />
pH values (pH = 5.0, 5.5, 5.9 and 6.4). The eluted Al(III) fractions of 0.5-1.0 ml were<br />
collected into vials and then they were determined as purple-red Al(III)-SPADNS chelate by<br />
spectrophotometry at 590 nm. The resulting sorption capacity is highest at pH 5.5 giving<br />
value 36 μmol of aluminium per 1 g of the chelating sorbent. This pH value was used for<br />
further immobilization of metal ions on Iontosorb Salicyl sorbent.<br />
In the following part of the work, we have fractionated aromatic acids and/or humic acids by<br />
IMAC technique. As the first step, the effect of pH of acetate buffer solution on the retention<br />
of aromatic acids or peat HA was investigated at different pH values (pH = 8.9, 6.7 or 3.9).<br />
The retained fraction of sample was eluted with pH = 2.0 eluent (0.01 mol l -1 HCl). In the<br />
case of aromatic acids, the most of aromatic acids were retained at pH = 6.7. Both eluted and<br />
retained fractions of aromatic acids at this pH value were analyzed by RP-HPLC method.<br />
From achieved results we have observed, that aromatic acids containing more hydroxyl<br />
functional groups (gallic acid and protocatechuic acid) are more retained on IMAC column.<br />
The acids with one carboxylic functional group (benzoic acid and cinnamic acid) are retained<br />
the least. By this fact, the presumption was confirmed, that on the IMAC column more polar<br />
analytes with more function groups i.e. having higher probability of metal chelatation are<br />
retained.<br />
pH = 8.9 pH = 6.7 pH = 3.9<br />
ELUTED<br />
RETAINED<br />
ELUTED<br />
RETAINED<br />
ELUTED<br />
RETAINED<br />
Figure 2: Chromatograms of HA fractions collected in Al(III)-IMAC experiments with acetate buffer<br />
solutions having different pH values (pH = 8.9, 6.7 and 3.9). Retained HA fractions were<br />
<strong>Vol</strong>. 2 Page - 150 -
15th IHSS Meeting- <strong>Vol</strong>. 2<br />
eluted with pH = 2.00 eluent (0.01 mol l -1 HCl).<br />
Analysis of HA samples is shown on the Figure 2. As is shown at chromatographic records<br />
the most HA were retained at the value of pH = 6.70. By this experiment the presumption,<br />
that HS with great amount of polar functional groups will interact more with Al(III) ions at<br />
the same value of pH in the environment in comparison to the previous measurements<br />
performed for model mixture aromatic acids, was confirmed.<br />
4. Conclusions<br />
Based on presented results, Al(III)-IMAC method seems to be promising tool for<br />
fractionation of HS. Different ability of HS to be retained in IMAC column filled with<br />
Iontosorb Salicyl sorbent at different values of pH of elution environment may be utilized for<br />
design of IMAC method with buffer-based pH gradient. The obtained fractions can be<br />
characterized further by numerous methods. With help of this simple method it is possible to<br />
gain additional information about their character, st<strong>ru</strong>cture, functionality and possibilities for<br />
their utilization in different areas of medicine, agriculture and industry.<br />
Acknowledgements<br />
This work was financially supported by grants APVV-0595-07, VEGA-1/0329/10 and<br />
VVCE-0070-07.<br />
References<br />
1. E. Zatloukalová, Chem. Listy, 98 (2004) 254.<br />
2. V. Gaberc-Porekar and V. Menart, J. Biochem. Bioph. Meth., 49 (2001) 335.<br />
3. F. C. Wu, R.D. Evans and P.J. Dillon, Anal. Chim. Acta, 452 (2002) 85.<br />
4. I. Paunovic, R. Schulin and B. Nowack, Eur. J. Soil Sci., 59 (2008) 198.<br />
5. J.R. Donat, R.A. Kango and A.S. Gordon, Mar. Chem., 57 (1997) 1.<br />
6. M. Machida, H. Kosako, K. Shirakabe, M. Kobayashi, M. Ushiyama, J. Inagawa, J.<br />
Hirano, T. Nakano, Y. Bando, E. Nishida and S. Hattori, FEBS J., 274 (2007) 1576.<br />
7. C. Baldwin, J. Cumming and A.T. Timperman, Analyst, 130 (2005) 318.<br />
8. T. Procházková, R. Góra, J. Kandráč J. and M. Hutta, J. Radioanal. Nucl. Chem., 229<br />
(1998) 61.<br />
<strong>Vol</strong>. 2 Page - 151 -
15th IHSS Meeting- <strong>Vol</strong>. 2<br />
The Basis for a Humeomic Science<br />
Alessandro Piccolo a,b , Antonio Nebbioso a,b *<br />
a<br />
Dipartimento di Scienze del Suolo, della Pianta, dell’Ambiente e delle Produzioni Animali<br />
(DISSPAPA). Università di Napoli Federico II. 80055 Portici, Italy; b Centro per la Risonanza<br />
Magnetica Nucleare per l’Ambiente, l’Agro-alimentare e i Nuovi Materiali (CERMANU).<br />
Università di Napoli Federico II. 80055 Portici, Italy.<br />
Email: antonio.nebbioso@unina.it<br />
1. Introduction<br />
Humic Substances (HS) represent a class of naturally occurring organic compounds and are<br />
commonly found in soils, sediments and natural bodies of water [1]. They have an effect on<br />
physical-chemical and biological properties of such environments, and are fundamental for<br />
their quality and fertility [2]. The heterogeneous and complex nature of humic components<br />
represents the main difficulty against the chemical characterization and st<strong>ru</strong>cture elucidation<br />
of them. Recent findings have provided significant experimental evidence supporting the<br />
hypothesis that HS are organized in supramolecular architecture [3]. Such st<strong>ru</strong>cture is<br />
composed by relatively simple molecules held together by weak bonds and allows the single<br />
compounds to be selectively separated and quali-quantitatively characterized with appropriate<br />
analytical methods, such as NMR [4–6] and mass spectrometry (MS) [4, 7]. A comprehensive<br />
description of all components of HS, defined as “Humeomics” would bring an important<br />
achievement for research in agricultural and environmental chemistry. In order to accomplish<br />
this goal, it is required to obtain sub-fractions of HS as homogeneous as possible and<br />
characterize their molecular content.<br />
2. Materials and Methods<br />
A humic acid (HA) from a volcanic forest soil (Allic Fulvudand) was isolated, purified, and<br />
fractionated [1, 8]. The first step of this method consisted in a liquid extraction with a mixture<br />
of dichloromethane and methanol 2:1. This yielded an organic extract not bound to the residue<br />
via covalent bonds. Such residue underwent two trans-esterification stages in methanol, the<br />
first using BF 3 12%, and the second using KOH 1M. The extracts thus obtained were further<br />
separated in water/chloroform liquid extraction. Such components were defined as weakly<br />
and strongly ester bound to the residue. This step yielded also a residue, which is thereafter<br />
hydrolyzed in aqueous HI 47% to separate the organic matter bound via ether bonds. The final<br />
product showed minimal chemical reactivity. Such residual matter was separated with HP-<br />
SEC chromatography in order to separate fractions according to their hydrodynamic volume.<br />
The fractions obtained were analyzed with the following techniques: 1. Elemental analysis 2.<br />
<strong>Vol</strong>. 2 Page - 152 -
15th IHSS Meeting- <strong>Vol</strong>. 2<br />
NMR mono- and bidimensional spectroscopy, in both solid and solution state (B<strong>ru</strong>ker AV300<br />
e AV400) 3. GC-MS and pyrolysis-GC-MS (Perkin-Elmer Turbomass Gold) 4. HPSEC<br />
coupled to MS Electrospray source & Orbitrap detector (Thermo Finnigan Orbitrap, HR).<br />
3. Results and Discussion<br />
The organosoluble fractions showed linear aliphatic and, to a lesser extent, aromatic<br />
compounds. In water-soluble fractions several compounds with a chemical formula similar to<br />
saccharides were detected. This was suggested by formulas with high content of oxygen and<br />
nitrogen atoms. Aliphatic compounds were also revealed to a lesser extent. The final residue<br />
of the fractionation showed quantitative abundance in the order: aromatic (mostly<br />
quaternary)> aliphatic> carbonyl molecules. From NMR relaxation time measurements, a<br />
more rigid architecture was attributed to this material with respect to the starting HA. Mass<br />
spectrometry revealed formulas with extensive unsaturation and oxygen substitution, which<br />
could be inferred by NMR signals in the sp 2 carbon region. Ten subfractions were obtained<br />
from preparative HPSEC of the final residue.<br />
The MS analysis revealed fatty acids of variable chain length and substitution in all fractions.<br />
However, these fractions showed differences in the distribution of these fatty acids,. In fact,<br />
the ratios of 1) short/long chained homologues and 2) hydrophilic/hydrophobic homologues<br />
increased with the fraction elution volume. Such results suggested a correlation between<br />
chemical composition of aggregates and their hydrodynamic properties: abundance of long,<br />
saturated carbon chains resulted in more solidly stacked and larger aggregates, whereas<br />
abundance of small, hydroxylated compounds produced more labile aggregation (Fig. 1).<br />
Trend<br />
Arbitrary<br />
scale<br />
1,2<br />
1<br />
0,8<br />
0,6<br />
0,4<br />
0,2<br />
0<br />
1 2 3 4 5 6 7 8 9 10<br />
Ratio short/long<br />
Ratio hyd/lip<br />
Ratio hyd/lip<br />
Fraction<br />
Ratio short/long<br />
Figure 1: Fatty acid distribution vs elution vol. in size-fraction of final fractionation residue separated by HPSEC<br />
<strong>Vol</strong>. 2 Page - 153 -
15th IHSS Meeting- <strong>Vol</strong>. 2<br />
4. Conclusions<br />
The Humeomic approach to HS analysis represents a solid basis for a more reliable and<br />
detailed molecular characterization of Natural Organic Matter.<br />
References<br />
1. F.J. Stevenson (1994). <strong>Humus</strong> Chemistry: Genesis, Composition, Reactions. John Wiley &<br />
Sons, New York.<br />
2. P.M. Huang, M.K. Wang and C.H. Chiu, (2005) "Soil mineral-organic matter-microbe<br />
interactions: Impact on biogeochemical processes and biodiversity in soils", Pedobiologia,<br />
49, 609–635.<br />
3. Piccolo A., (2002). The supramolecular st<strong>ru</strong>cture of humic substances: a novel<br />
understanding of humus chemistry and implications in soil science. Adv. Agron. 75, 57–<br />
134<br />
4. Piccolo A., Conte P., Trivellane E., Van Lagen B., Buurman P., (2002). Reduced<br />
heterogeneity of a lignite humic acid by preparative HPSEC following interaction with an<br />
organic acid. Characterization of size-separates by PYR-GC-MS and 1 H-NMR<br />
spectroscopy. Environ. Sci. Technol., 36, 76–84<br />
5. Simpson A. J., (2002). Determining the molecular weight, aggregation, st<strong>ru</strong>ctures and<br />
interactions of natural organic matter using diffusion ordered spectroscopy. Magn. Reson.<br />
Chem. 40, S72–S82.<br />
6. Smejkalova D., Piccolo, A., (2008). Aggregation and disaggregation of humic<br />
supramolecular assemblies by NMR diffusion ordered spectroscopy (DOSY-NMR). Env.<br />
Sci. Technol., 42, 699–706.<br />
7. Grasset L., Amblès A., (1998). St<strong>ru</strong>ctural study of soil humic acids and humin using a<br />
new preparative thermochemolysis technique. J. Anal. Appl. Pyrolysis 47, 1–12.<br />
8. Kolattukudy P.E., Kronman K., Poulose A.J., (1975). Determination of st<strong>ru</strong>cture and<br />
composition of suberin from the roots of carrot, parsnip, <strong>ru</strong>tabaga, turnip, red beet, and<br />
sweet potato by combined gas-liquid chromatography and mass spectrometry Plant<br />
Physiol. 55, 567–573.<br />
<strong>Vol</strong>. 2 Page - 154 -
15th IHSS Meeting- <strong>Vol</strong>. 2<br />
Radionuclide Diagnostics of Hydrophobicity and Surface Activity<br />
of Humic Substances<br />
Gennadii A. Badun a , Maria G. Chernysheva a* , Andrey I. Konstantinov a , Natalia A.<br />
Kulikova a,b , Irina V. Perminova a<br />
a Lomonosov Moscow State University, Leninskie Gory, 119992, Moscow, Russia;<br />
b Bach Institute of Biochemistry of Russian Academy of Sciences, Leninskii 33, 119071,<br />
Moscow, Russia<br />
E-mail: masha.chernysheva@gmail.com<br />
1. Introduction<br />
Humic substances (HS) is a widespread reactionary active component of soils. Dual st<strong>ru</strong>cture<br />
and composition of HS provide their hydrophobicity and surface activity. Understanding<br />
fundamental physical properties of HS is important because of their direct relevance to the<br />
behavior of HS in the environment. Among analytical methods, radiochemical assay is the<br />
most suited and perspective for the experimental studies because of its sensitivity, selectivity<br />
and universality. In our previous work [1, 2] we have shown, that huge advantage of tritium<br />
thermal activation technique is the possibility of labeling HS from different origin. Specific<br />
radioactivity of labeled product was at least 2 times higher than one obtained by chemical<br />
reduction of fulvic acids by treated reagents [3] Furthermore, we have used tritium labeled HS<br />
for studying their interaction with bacteria and plants [4, 5] and also their hydrophobicity and<br />
surface activity by scintillation phase technique in aqueous/toluene system [6] In this study,<br />
we have shown that it is possible to achieve higher values of radioactivity of labeled HS and<br />
investigated sorption of HS at different hydrophobic surfaces by liquid scintillation<br />
spectrometry of tritium. This work has two component goals. To achieve the first of these<br />
goals, HS were labeled with tritium by means of tritium thermal activation method. The<br />
second critical goal was to investigate hydrophobicity and surface activity of [ 3 H]-HS by<br />
liquid scintillation spectrometry of tritium. We have study the behavior of HS in aqueous/oil<br />
system by liquid scintillation spectrometry in the application of scintillation phase technique.<br />
Not only toluene but alkanes and alcohols were used as an oil phase.<br />
2. Materials and methods<br />
Brown coal humic acids (CHA) (commercially available preparation Powhumus (Humintech,<br />
Germany) was used. Tritium labeling was carried out by means of thermal activation method<br />
[7]. One mL of 0.3 g/L solution of CHA in 0.05% NaOH was distributed on the walls of glass<br />
reactor, frozen with liquid nitrogen and lyophilized. Then the reactor was connected to<br />
<strong>Vol</strong>. 2 Page - 155 -
15th IHSS Meeting- <strong>Vol</strong>. 2<br />
vacuum system. Air was pumped out under resent pressure 0.01 Pa and then filled with<br />
tritium gas. To increase specific radioactivity of the product the reaction was conducted at<br />
target temperature 293–298 K [8]. W-wire temperature, gas pressure and treated time were<br />
verified in the wide possible range. After the reaction gas was pumped out, the target was<br />
dissolved in 0.4% NaOH. To purify [ 3 H]-CHA from labile tritium and radioactive by-products<br />
30 days dialysis through 2 kDa membrane against 0.028 M phosphate buffer (pH 6.8) was<br />
carried out. Final product was analyzed by size exclusion chromatography detecting both UVabsorbance<br />
and radioactivity [¡Error! Marcador no definido.].<br />
The behavior of HS in aqueous/oil system was studied by means of scintillation phase method<br />
[¡Error! Marcador no definido.]. The experiments were carried out in 7 mL polyethylene<br />
vials. To 1 mL of [ 3 H]-CHA solution 3 mL of scintillation cocktail was added. Scintillation<br />
phases based on octane, toluene and octanol were used. The system was incubated during 5<br />
days at 22 °C. Tritium counting rate of both whole system and the bit of organic phase was<br />
measured. The distribution coefficient and the value of adsorption of CHA were calculated<br />
according to the procedure described in Ref. [9].<br />
3. Results and Discussion<br />
In this work tritium thermal activation technique was applied for labeling of CHA at target<br />
temperature 295±3 K. It was found, that under this condition neither variation in W-wire<br />
temperature nor in gas pressure does not lead to significant changing in specific radioactivity<br />
of final product. Only the extension of the reaction time from 10 to 30 s led to specific<br />
radioactivity growth from 0.4 to 1.3 TBq/g. It has to be noted that at target temperature 77 K<br />
specific activity of labeled HS was decreased when exposition time was longer then 10 s.<br />
Unfortunately the formation of by-products of high molecular weight because of<br />
polymerization was also increased with the extension of exposition time. Comparing the<br />
results of the experiments allowed us to determine the conditions under which maximum<br />
specific radioactivity exist with minimum by-products, which can be separated by size<br />
exclusion chromatography. They are 10 s exposition at W-wire temperature 1880 K and 1.2<br />
Pa of tritium gas pressure. Specific radioactivity of [ 3 H]-CHA was 3.5 times higher then one<br />
obtained at target temperature 77 K.<br />
In order to provide sorption experiments at aqueous/oil interface [ 3 H]-CHA was used. We<br />
have compared the influence of the nature of organic liquid on the behavior of CHA. Liquid<br />
scintillation spectrometry of tritium in the application of scintillation phase technique allowed<br />
us to investigate both the adsorption of [ 3 H]-CHA at aqueous/oil interface and its distribution<br />
<strong>Vol</strong>. 2 Page - 156 -
15th IHSS Meeting- <strong>Vol</strong>. 2<br />
in the bulk of the system of two immiscible liquids. In this study, we have measured the<br />
distribution coefficient of CHA as a ratio of the concentration of CHA in the organic phase to<br />
its concentration in aqueous phase. It is evident that distribution coefficient of the compound<br />
is a characteristic of its hydrophobicity. Furthermore, we have determined the adsorption<br />
isotherms of [ 3 H]-CHA at aqueous/octane, aqueous/toluene and aqueous/octanol interfaces.<br />
The investigation of adsorption kinetics has shown that the formation of the adsorption layer<br />
occurs in the first three hours. Adsorption isotherms were described by Langmuir equation.<br />
HS posses rather low surface activity at aqueous/oil interfaces. The parameters of adsorption<br />
isotherms and distribution coefficients for the investigated liquids were differing. The values<br />
of adsorption and distribution coefficient were highest for aqueous/octanol system. The<br />
reason for these differences related to the specific interaction between the components of HS<br />
with molecules of the organic phase.<br />
4. Conclusions<br />
Specific radioactivity of tritium labeled HSs can be increased if the reaction with atomic<br />
tritium is carrying out at target temperature 295 K. The behavior of HS in aqueous/oil systems<br />
is determined by the interaction of HS with molecules of the organic phase. Radionuclide<br />
diagnostics of humic materials can reveal their important and unique properties.<br />
Acknowledgements<br />
This work was supported by Russian Foundation of Basic Research (project # 09-03-00819)<br />
and by Russian Federal Agency of Education (project # 2351P and P211).<br />
References<br />
1. V.Yu. Pozdnyakova, G.A.Badun, M.G. Chernysheva, Z.A. Tyasto, V.M. Fedoseev, I.V. Perminova. Proc.<br />
13 th IHSS Meeting, July 30 to August 4, 2006, 945.<br />
2. M.G. Chernysheva, G.A. Badun, I.V. Perminova, V.I. Korobkov, Z.A. Tyasto, E.Yu. Belyaeva, A.V.<br />
Kudryavtsev, E.A. Tsvetkova, N.A. Kulikva. Proc. 14 th IHSS Meeting, September 14-19, 2008, Moscow -<br />
St. Petersburg, Russia, 509.<br />
3. R.T. Tinacher, B.D.Honeyman. Environ. Sci. Technol. 41 (2007) 6776.<br />
4. N.A. Kulikova, G.A. Badun, V.I. Korobkov, V.Yu. Pozdnyakova, I.V. Perminova, Proc. 13 th IHSS Meeting,<br />
July 30 to August 4, 2006, 425.<br />
5. N. Kulikva, G. Badun, E. Kunenekov, V. Korobkov, Z. Tyasto, M. Chernysheva, E. Tsvetkova, I.<br />
Perminova. Proc. 14 th IHSS Meeting, September 14–19, 2008, Moscow - St. Petersburg, Russia. 425.<br />
6. M.G. Chernysheva, Z.A. Tyasto, G.A. Badun. J. Radioanalytical Nuc. Chem., 280 (2009) 303.<br />
7. G.A. Badun et al, Radiochim. Acta, (2010) (in press).<br />
8. G.A. Badun, M.G Chernysheva. Abstract of VIII Finish – Russian symposium on Radiochemistry,<br />
September 4–5, 2009, Turku, Finland. 96.<br />
9. G.A. Badun, N. A. Kulikova, M. G. Chernysheva, Z. A. Tyasto, V. I. Korobkov, V. M. Fedoseev, E. A.<br />
Tsvetkova, A. I. Konstantinov, A. V. Kudryavtsev, I. V. Perminova. Moscow Univ. Chem. Bull., 64 (2009)<br />
276.<br />
<strong>Vol</strong>. 2 Page - 157 -
15th IHSS Meeting- <strong>Vol</strong>. 2<br />
Molecular Transformations of Dissolved Organic Matter in Domestic<br />
Wastewaters After Ozonation and UV Irradiation<br />
Allison Paul, Dan Osborne, Bill Cooper*<br />
Florida State Univ., Dep. Chemistry and Biochemistry, Tallahassee, FL 32306-4390, USA<br />
E-mail: cooper@chem.fsu.edu<br />
1. Introduction<br />
A comprehensive study of the effects of advanced oxidation on the uncharacterized portion of<br />
dissolved organic matter (DOM) in two types of wastewater will be presented. Samples were<br />
obtained from various stages within a tertiary domestic wastewater plant as well as from a<br />
landfill leachate collection system. We have used a combination of size-exclusion<br />
chromatography, time-of-flight mass spectrometry, excitation-emission matrix (EEMS)<br />
fluorescence spectroscopy and ultrahigh resolution Fourier transform ion cyclotron resonance<br />
mass spectrometry (FT-ICR MS) to characterize the changes in wastewater and landfill<br />
leachate DOM after oxidation by UV irradiation and ozonation.<br />
2. Materials and Methods<br />
Samples of wastewater effluent were collected from the secondary clarifiers. Samples of<br />
leachate were obtained from the main leachate collection system under a Class I domestic<br />
landfill. DOM was extracted using solid-phase-extraction (SPE) methods. A PL Aquagel OH-<br />
30 (4mm × 25cm, 8μm) column was used for size exclusion separations. A Jobin Yvon SPEX<br />
Fluoromax-4 spectrometer with a xenon lamp was used to acquire three dimensional<br />
fluorescence spectra. Excitation wavelengths are scanned from 220-500 nm in 5 nm intervals<br />
and emission scans between 290–600 nm in 2 nm increments. Ultrahigh resolution mass<br />
spectra (UHR-MS) were acquired on the home-built 9.4 T FT-ICR mass spectrometer located<br />
at the National High Magnetic Field Laboratory.<br />
3. Results and Discussion<br />
Figure 1 includes EEM spectra of leachate before and after only 15 minutes of ozonation.<br />
There is a clear loss of fluorescence intensity in all fluorescing chromophores.<br />
Figure 2 includes elemental ratio plots (O/C vs. H/C, or van Krevelen diagrams) of formulas<br />
in leachate DOM obtained by UHR-MS. The data in these figures dramatically demonstrate<br />
the ability of UHR-MS to document changes in DOM after advanced oxidation. We see a<br />
clear trend in which compounds are being efficiently oxidized, as indicated by the general<br />
increase in O/C ratios.<br />
<strong>Vol</strong>. 2 Page - 158 -
15th IHSS Meeting- <strong>Vol</strong>. 2<br />
Figure 1: Three-dimensional Excitation – Emission Fluorescence Spectra (3D-EEMS) of<br />
landfill leachate DOM before (top) and after 15 minutes of ozonation (bottom).<br />
2.5<br />
2<br />
1.5<br />
Ozonation/UV Irradiation: AFTER Oxidation<br />
Compounds that Disappear<br />
Compounds that Appear<br />
Figure 2: van Krevelen diagram describing<br />
compounds that were removed by oxidation<br />
(dark) and those that appeared (light).<br />
H/C<br />
1<br />
0.5<br />
0<br />
0 0.2 0.4 0.6 0.8 1<br />
O/C<br />
4. Conclusions<br />
We have shown good correlations between mass spectrometry and optical spectroscopy<br />
measurements. The loss of fluorescence intensity parallels what is observed in natural<br />
photochemical processes, and is accompanied by the same types of molecular changes<br />
identified by FT-ICR MS [1–2].<br />
References<br />
1. M. Gonsior, B. M. Peake, W. T. Cooper, D. Podgorski, J. D'Andrilli, W. J. Cooper,<br />
Environ. Sci. Technol. 43 (2009) 698.<br />
2. L. B. Tremblay, T. Dittmar, A. G. Marshall, W. J. Cooper, W. T. Cooper, Mar. Chem. 105<br />
(2007) 15.<br />
<strong>Vol</strong>. 2 Page - 159 -
15th IHSS Meeting- <strong>Vol</strong>. 2<br />
Molecular Characterization of Humic Acids from Tunisian Phosphatic<br />
Pellets Using Pyrolysis- Gas Chromatography- Mass Spectrometry<br />
Aida Ben Hassen a* , Jean Trichet b , Jean-Robert Disnar b<br />
a Laboratoire de Géoénergie, Technopôle Borj Cédria, Tunisia; b Institut des Sciences de la<br />
Terre d'Orléans, Université d'Orléans/CNRS/Université François Rabelais - Tours (UMR<br />
6113), Campus Géosciences, 1A <strong>ru</strong>e de la Férollerie, 45071 Orléans Cedex 2, France,<br />
E-mail: aida.benhassen@crten.rnrt.tn<br />
1. Introduction<br />
Molecular characterization of humic acids (HAs) extracted from phosphatic pellets (grains<br />
whose size lies between 100 and 500 µm), were performed using a degradative method:<br />
Pyrolysis- gas chromatography- mass spectrometry (Py-GC-MS) at 670 °C with methylation<br />
using tetramethylammonium hydroxyde (TMAH). This thermal degradation method yielded<br />
mainly hydrocarbons (n-alkane/n-alkene doublets, isoprenoids, alkylbenzenes and other<br />
alkylated aromatics), methyl esters of linear C8–C18 fatty acids and heterocyclic compounds<br />
(alkylthiophenes and alkylbenzothiophenes). The results confirms the complexity and the<br />
heterogeneity of the HAs macromolecular st<strong>ru</strong>cture.<br />
2. Materials and Methods<br />
HAs were isolated from phosphatic pellets, which were collected in the Ras-Draâ mine<br />
(Gafsa-Métlaoui phosphatic basin, southern Tunisia) using the standard protocol of the<br />
International Humic Substances Society IHSS [1]. GC–MS was performed with a Thermo-<br />
Finnigan TRACE-Polaris GCQ gas chromatograph–mass spectrometer. The chromatograph<br />
was fitted with a Rtx-5Sil MS column (30 m × 0.25 mm i.d., 0.25 µm film thickness) with a<br />
5 m guard column. The temperature program was: 40 °C (hold 1 min) to 300 °C at 5 °C/min,<br />
to 300 °C (hold 30 min). The mass spectrometer was operated in the electron ionization (EI)<br />
mode at 70 eV ionization energy and scanned from m/z 50 to 600. Compounds were<br />
identified and assigned by comparison with data library (NIST) mass spectra and relative<br />
retention times. On-line pyrolysis was performed with a Fischer GSG flash pyrolyser directly<br />
coupled to the GC–MS system. The temperature of the ferromagnetic cylinder was 670 °C,<br />
which allows cracking of the bulk HA macromolecule.<br />
3. Results and Discussion<br />
A representative pyrogram (TIC) of HAs obtained by Py-GC-MS is displayed in Fig. 1. The<br />
compound distribution is dominated by the peaks of polycyclic aromatic hydrocarbons<br />
(alkylbenzenes, alkylnaphthalenes) and heterocyclic (mainly S-bearing) organic compounds<br />
<strong>Vol</strong>. 2 Page - 160 -
15th IHSS Meeting- <strong>Vol</strong>. 2<br />
(i.e. alkylthiophenes and alkylbenzothiophenes), reflecting the complexity of the st<strong>ru</strong>cture of<br />
the organic macromolecules. Other hydrocarbons such as n-alkane/n-alkene doublets can be<br />
clearly appreciated using selective ion detection (m/z 57+55). Their distribution extends over<br />
a large carbon number range (C12–C28). Furthermore, the Py-GC/MS chromatogram shows<br />
also various other compounds: linear C8–C18 fatty acids (as methyl esters), isoprenoids, etc.<br />
We hypothesized that the majority of the linear hydrocarbons derive from algal biopolymers<br />
contributing to the original OM but that the aromatic compounds can originate from preexisting<br />
aromatic entities or from acyclic hydrocarbon cyclization and aromatization during<br />
pyrolysis. In total, the various pyrolysis compounds can be attributed, on one hand, to the<br />
algal original OM associated to phosphatic sediments and, on the other hand, to lipids of<br />
microbial-faecal origin incorporated into phosphatic pellets (Ben Hassen, 2007). The presence<br />
of similar organic compounds (n-alkane/n-alkene doublets, alkylbenzenes, isoprenoids,…)<br />
was already acknowledged in Tunisian phosphorites [2].<br />
4. Conclusions<br />
The main thermal degradation products obtained by Py-GC/MS of the studied HAs are<br />
hydrocarbons (n-alkane/n-alkene doublets, isoprenoids, alkylbenzenes), linear C8–C18 fatty<br />
acids and heterocyclic compounds (mainly S-bearing). The importance of these compounds<br />
reveals the complexity and the heterogeneity of the HA macromolecular st<strong>ru</strong>cture.<br />
Figure 1. Example of pyrogram (Py-GC-MS at 670 °C) of HAs from pellets.<br />
T: alkylthiophenes, B: alkylbenzenes, BT: benzothiophenes). P = Polluant.<br />
References<br />
1. R.S. Swift, In Sparks, D.L., et al. (Eds.), Methods of Soil Analysis: Part 3. Chemical Methods. Soil<br />
Science Society of America Book, Series 5, Madison, 1996, pp.1018-1020.<br />
2. H. Belayouni and J. Trichet, Org. Geochem., 1984, p. 741–754.<br />
<strong>Vol</strong>. 2 Page - 161 -
15th IHSS Meeting- <strong>Vol</strong>. 2<br />
On the Additivity of the Properties of Humic Acid Fractions<br />
Marios Drosos a* , Gud<strong>ru</strong>n Abbt-Braun b , Fritz Hartmann Frimmel b , Yiannis Deligiannakis a<br />
a Lab of Physical Chemistry, Dept. of Environmental & Natural Resources Management,<br />
University of Ioannina, Seferi 2, 30100 Agrinio, Greece; b Engler-Bunte-Institut,<br />
Wasserchemie, Universitat Karls<strong>ru</strong>he, Engler-Bunte-Ring 1, D-76131 Karls<strong>ru</strong>he, Germany<br />
E-mail: drosos.marios@gmail.com<br />
1. Introduction<br />
The st<strong>ru</strong>cture and origin of properties of humic acids (HA) are still a matter of great concern. To enter<br />
into the st<strong>ru</strong>cture of HA, a fractionation procedure was carried on, that combines both size cut-off<br />
membrane and pH grade fractionation on a XAD-8 column. A soil HA (SHA) and a lignite HA (LHA)<br />
(1) were fractioned (2). Key physicochemical properties of the fractions were measured. Moreover a<br />
critical comparison was carried out between the fractions and the original unfractioned HAs, in order<br />
to assess whether there is additivity to the properties of the fractions vs. the original unfractioned HA.<br />
2. Materials and Methods<br />
The parental HA (LHA, SHA) were isolated and characterized as described in (3). This fractionation<br />
was performed in collaboration with Jerry A. Leenheer (U.S. Geological Survey laboratory, Denver<br />
Co.). HA used, were extracted from the top 10 cm of an Alfisol forest soil and from a lignite mined in<br />
Greece with 0.5 M NaOH plus 0.1 M Na 4 P 2 O 7 using an extraction protocol recommended by the IHSS<br />
(3). The HA was disaggregated by removing metals and residual clay minerals by using HCl and HF.<br />
Residual aluminum fluoride reaction products were removed by dialysis against 0.1 M sodium citrate<br />
at pH = 10. Lastly, dialysis against 0.1 M NaOH was applied to ionize carboxyl and phenol groups to<br />
maximize charge density and to dis<strong>ru</strong>pt hydrogen-bonded aggregates. A SpectraPor dialysis cut-off<br />
membrane (15 kDa) was used to separate large (>15 kDa) from small (
15th IHSS Meeting- <strong>Vol</strong>. 2<br />
Table 1: Mass percent (w/w) of the fractions<br />
Fraction Type Fractionation<br />
pH<br />
%<br />
w/w<br />
Lignite Humic Acid (LHA)<br />
LC1 C1 pH 10 0.67<br />
LC21 C2 pH 5 24.69<br />
LC22 C2 pH 5 12.14<br />
LC23 C2 pH 5 8.78<br />
LC3 C3 pH 3 18.95<br />
LC4 C4 pH 2 13.16<br />
LN N3 pH 2 5.04<br />
Lret Ret - 16.57<br />
Soil Humic Acid (SHA)<br />
SC1 C1 pH 10 3.28<br />
SC2 C2 pH 5 10.3<br />
SC3 C4 pH 2 8.93<br />
SN1 N1 pH 13 1.6<br />
SN2 N2 pH 6 2.77<br />
SN3 N3 pH 2 11.1<br />
SRet Ret - 62.01<br />
Table 2: E 4 /E 6 ratio<br />
Sample E 4 /E 6<br />
LHA 6.73<br />
Ltot 6.07<br />
SHA 9.09<br />
Stot 7.89<br />
% w/w at LHA<br />
% w/w at SHA<br />
70<br />
60<br />
50<br />
40<br />
30<br />
20<br />
10<br />
0<br />
70<br />
60<br />
50<br />
40<br />
30<br />
20<br />
10<br />
0<br />
(a)<br />
LC1 LC2 LC3 LC4 LN LRet<br />
(b)<br />
SC1 SC2 SC3 SN1 SN2 SN3 Sret<br />
Fraction<br />
Figure 1: Bar charts of HA fractions;L=Lignite, S=Soil,<br />
C=Citrate dialysis,N=sodium hydroxide dialysis,<br />
Ret=retained fraction in dialysis<br />
LHA<br />
Ltot<br />
SHA<br />
Stot<br />
4000 3500 3000 2500 2000 1500 1000 500<br />
Wavenumber (cm -1 )<br />
4000 3500 3000 2500 2000 1500 1000<br />
Wavenumber (cm -1 )<br />
Figure 2: FTIR spectra of lignite (on left) and soil (on right) HA<br />
500<br />
3. Results and Discussion<br />
A) Fractions percentage: LHA gave 8 and SHA gave 7 fractions. In Table 1 the percentage of<br />
each fraction to the parental HA and the experimental conditions are shown. In Fig. 1 bar<br />
charts of the mass percent w/w are given.<br />
<strong>Vol</strong>. 2 Page - 163 -
15th IHSS Meeting- <strong>Vol</strong>. 2<br />
B) UV/Vis: In both LHA and SHA seems that the fractions show a lower E 4 /E 6 ratio than the<br />
parental HAs, see Table 2.<br />
C) FTIR: The spectra show that there are no H 2 O and metal impurities. Peaks of the Stot,<br />
Ltot spect<strong>ru</strong>m are better resolved.<br />
D) EPR: Ltot has more spin/g and larger g-shift at pH = 5 and pH = 12 (4) than LHA, while<br />
Stot has less spin/g than SHA, with almost n g-shift, as it is shown in Fig. 3.<br />
E) SEC-OCD: Total chromatograms from the sum of all fractions have more DOC than the<br />
parental ones as it is shown in Figure 4. This means that fractions of HA give more CDOC<br />
(chromatographic DOC), probably due to simpler st<strong>ru</strong>cture. Low molecular weight fractions<br />
which contain the peak that is observed in fulvic acid are contained in the sum of the<br />
fractions. SUVA from SEC_OCD, ratio for LHA is 3.68, and for SHA is 1.13, while for Ltot<br />
is 1.67 and for Stot is 0.99, showing that fractioned HA is less aromatic with less π-π bonds<br />
(5).<br />
F) H-Binding: SHA has a higher charge density than Stot, while Ltot has more charge<br />
density than the LHA one, as it is shown in Figure 5. Table 3 compares the NICA values.<br />
Spin/g<br />
7,00E+017<br />
6,00E+017<br />
5,00E+017<br />
4,00E+017<br />
3,00E+017<br />
2,00E+017<br />
1,00E+017<br />
0,00E+000<br />
pH5<br />
pH12<br />
Stot<br />
SHA<br />
g<br />
2,0054<br />
2,0052<br />
2,0050<br />
2,0048<br />
2,0046<br />
2,0044<br />
2,0042<br />
2,0040<br />
2,0038<br />
2,0036<br />
2,0034<br />
2,0032<br />
pH5<br />
pH12<br />
Stot<br />
SHA<br />
rel. DOC-Signal<br />
2,5<br />
2,0<br />
1,5<br />
1,0<br />
0,5<br />
0,0<br />
LHA<br />
Ltot<br />
Spin/g<br />
7,00E+017<br />
6,00E+017<br />
5,00E+017<br />
4,00E+017<br />
3,00E+017<br />
2,00E+017<br />
1,00E+017<br />
0,00E+000<br />
pH5<br />
pH12<br />
Ltot<br />
LHA<br />
g<br />
2,0046<br />
2,0044<br />
2,0042<br />
2,0040<br />
2,0038<br />
2,0036<br />
2,0034<br />
2,0032<br />
2,0030<br />
pH5<br />
pH12<br />
Ltot<br />
LHA<br />
rel. DOC-Signal<br />
2,5<br />
2,0<br />
1,5<br />
1,0<br />
20 40 60 80 100<br />
V 0 Elution <strong>Vol</strong>ume (mL) V P<br />
SHA<br />
Stot<br />
Figure 3: Spin/g and g values of HA and the<br />
total sum of the fractions (tot)<br />
0,5<br />
0,0<br />
20 40 60 80 100<br />
V 0 Elution <strong>Vol</strong>ume (mL) V P<br />
Figure 4: Size exclusion chromatograms of<br />
unfractioned HA vs. the sum of fractions<br />
<strong>Vol</strong>. 2 Page - 164 -
15th IHSS Meeting- <strong>Vol</strong>. 2<br />
Table 3: NICA-Donnan Fit parameters<br />
Sample Q 1 Q 2 logk 1 logk 2 m 1 m 2<br />
Lignite Humic Acid<br />
Ltot 4.05 4.38 3.99 7.02 0.41 0.15<br />
LΗΑ 3.62 3.00 3.79 7.67 0.39 0.19<br />
Soil Humic Acid<br />
Stot 2.27 1.13 3.88 7.64 0.40 0.30<br />
SΗΑ 4.49 1.50 3.63 9.62 0.38 0.37<br />
4. Conclusions<br />
charge (equiv kg -1 )<br />
charge (equiv kg -1 )<br />
-8<br />
-6<br />
-4<br />
-2<br />
0<br />
-8<br />
Stot<br />
SHA<br />
pH<br />
4 6 8 10<br />
-6<br />
The SHA and LHA samples show that the fractionation<br />
-4<br />
leads to samples which are less aromatic. In SHA the<br />
-2<br />
fractions have a significant loss in H-binding capacity. The<br />
0<br />
free radicals of SHA are severely diminished due to the<br />
4 6<br />
pH<br />
8 10<br />
fractionation. In LHA fractionation creates additional H- Figure 5: H-binding of<br />
unfractioned humic acids acids<br />
binding and radical sites. The LHA shows a more aromatic<br />
vs. the sum of fractions<br />
character and is of supramolecular (6) st<strong>ru</strong>cture. Its H-<br />
binding-groups and the stable radicals are well protected possibly inside hydrophobic<br />
domains. During the fractionation there is an increase in both radical and the charge density,<br />
probably via an “opening” of the hydrophobic domains. The SHA contains more aliphatic<br />
macromolecular st<strong>ru</strong>ctures. Fractionation dis<strong>ru</strong>pts severely its st<strong>ru</strong>cture. The main finding<br />
from this work is that (a) the fractions of HA are diverse, (b) the properties of the fractions do<br />
not add-up to imitate the properties of the unfractioned HA; (c) fractionation reveals that the<br />
studied physicochemical properties vary according to the humification degree of the sample;<br />
(d) fractionation can provide unique information on the t<strong>ru</strong>e nature of the HA st<strong>ru</strong>cture.<br />
Acknowledgements<br />
We would like to thank Jerry A. Leenheer, for the collaboration in the fractionation and IHSS for the<br />
training award that gave the chance to collaborate with Dr. Gud<strong>ru</strong>n Abbt-Braun and Prof. F. H.<br />
Frimmel for the SEC-OCD analysis.<br />
References<br />
1. M. Drosos, M. Jerzykiewicz, Y. Deligiannakis, J. Colloid Interface Sci., 332 (2009) 78.<br />
2. J. A. Leenheer, Ann. Environ. Scie., 3 (2009) 111.<br />
3. M. H. B. Hayes, Extraction of humic substances from soil, In: G. R. Aiken, D. M. McKnight, R. L.<br />
Wershaw and P. MacCarthy (Eds.), Humic Substances in Soil, Sediment, and Water: Geochemistry,<br />
Isolation, and Characterization, Wiley, New York, 1985, p. 329-362.<br />
4. C. Christoforidis, S. Un, Y. Deligiannakis, J. Phys. Chem. A, 46 (2007) 11860.<br />
5. S. Wong, J. V. Hanna, S. King, T. J. Carroll, R. J. Eldridge, D. R. Dixon, B. A. Bolto, S. Hesse, G. Abbt-<br />
Braun, F. H. Frimmel, Environ. Sci. Technol., 36 (2002) 3497.<br />
6. R. Sutton, G. Sposito, Environ. Sci. Technol., 23 (2005) 9009.<br />
Ltot<br />
LHA<br />
<strong>Vol</strong>. 2 Page - 165 -
15th IHSS Meeting- <strong>Vol</strong>. 2<br />
Capillary Zone Electrophoresis (CZE) Characterization of Peat Humic<br />
Acids Fractions Obtained by Tangential Ultra-Filtration<br />
Luciano Cavani, Claudio Ciavatta<br />
Department of Agro-Environmental Science & Technology, Alma Mater Studio<strong>ru</strong>m -<br />
University of Bologna, viale Fanin 40, I-40127 Bologna, Italy.<br />
E-mail: luciano.cavani@unibo.it<br />
1. Introduction<br />
Capillary zone electrophoresis (CZE) is a techniques suitable for separation and<br />
characterization of humic (HS) and humic-like substances (HLS) because their<br />
polyelectrolytic nature [1], although their application was limited because artifacts or<br />
interactions among HSs and other chemicals occur during the electrophoretic <strong>ru</strong>n [2]. Two<br />
different buffers have been used to analyze the HS with CZE: (i) a non-interactive alkaline<br />
buffer (i.e. carbonate or phosphate) whose pattern show broad bands, useful to calculate the<br />
average electrophoretic mobility (AEM) of the HS [2–4] and (ii) buffers with interactive<br />
agents (i.e. borate, urea, SDS, EDTA) that, separating several peaks or bands, permit a<br />
“finger-print” characterization of HSs [5–7].<br />
In the present paper we report some results about the characterization of peat humic acids<br />
(HA) fractions obtained by tangential ultra-filtration by CZE in order to improve the<br />
knowledge about electrophoretic behavior of HS and the application of CZE to the analysis of<br />
organic matter extracted from organic fertilizers.<br />
2. Material and methods<br />
The HA was isolated from a Sphagnum peat (pH 4.8; ash 4.5%; total organic carbon 52.3%,<br />
total nitrogen 0.07%, humic carbon 22.5% (all data refer to dry weight basis). The HA was<br />
fractionated using tangential ultra-filtration (UF) technique and four fractions with different<br />
nominal molecular weight (NMW) were obtained: >300, 300–100, 100–50 and 50–20 kDa.<br />
Finally, each fraction was dialyzed against deionised water and freeze-dried. More detail of<br />
isolation and fractionation are reported elsewhere [8].<br />
The capillary electrophoresis (CE) separations were carried out with a BioFocus 3000<br />
capillary electrophoresis system (Bio-Rad, USA) using a 50 cm (total length, 45.4 cm at the<br />
detector window) × 75 μm (inner diameter) uncoated fuse silica capillary (Agilent, USA).<br />
Typical CE conditions for separations of the HA fractions were: voltage +15 kV, detector<br />
wavelength 220–254 nm, capillary temperature 25–30 °C, pressure injection 5 p.s.i. per sec at<br />
<strong>Vol</strong>. 2 Page - 166 -
15th IHSS Meeting- <strong>Vol</strong>. 2<br />
the anode. The background electrolyte buffer (BGE) were: (i) 5 mM (NH 4 ) 2 CO 3 + NH 4 HCO 3<br />
(pH 9.25) and (ii) 3 mM KH 2 PO 4 + 6 mM Na 2 B 4 O 7 (pH 8.9). The HA stock solutions (2 g L -1<br />
of total carbon) were prepared dissolving freeze-dried samples in 50 mM NaOH. The final<br />
solution (200 mg L -1 of total carbon) were prepared diluting the stock solution with deionised<br />
water. Benzilalcohol (10 mM in water) was used as EOF marker.<br />
3. Results and discussion<br />
All electropherograms of the HA fractions obtained with carbonate buffer contained only one<br />
broad peak (Fig. 1). Typically, the migration time of the top of the peak was used to calculate<br />
the average electrophoretic mobility (AEM) of the sample [2,4]. Taking into account the<br />
heterogeneity of HSs, we have calculated the AEM on the basis of the statistical moments, as<br />
follows:<br />
( h ⋅ μ )<br />
∑ i<br />
∑<br />
AEM = ;<br />
h<br />
i<br />
i<br />
where, μ i and h i are the effective electrophoretic mobility, and the height of the ith<br />
electrophoretic slice at ith migration time.<br />
The effective electrophoretic mobility (μ eff ) was calculated taking into account the electroosmotic<br />
mobility (μ EOF ), as follows:<br />
μ μ − μ , and<br />
eff<br />
=<br />
EOF<br />
app<br />
EL ⋅TL<br />
μ<br />
app<br />
= r ;<br />
V ⋅t<br />
m<br />
with μ app is the apparent electrophoretic mobility, EL and TL are the effective and the total<br />
capillary length, V r is the applied voltage, and t m is the migration time.<br />
<strong>Vol</strong>. 2 Page - 167 -
15th IHSS Meeting- <strong>Vol</strong>. 2<br />
-0.0277<br />
-0.0269<br />
HA Whole<br />
ABS at 254 nm<br />
-0.0284<br />
-0.0299<br />
-0.0302<br />
HA >300<br />
HA 300-100<br />
HA 100-50<br />
HA 50-20<br />
-0.04 -0.03 -0.02 -0.01 0.00<br />
μ eff<br />
(cm 2 V -1 min -1 )<br />
Figure 1: Electropherograms of peat HA fraction with carbonate buffer<br />
The calculated AEM values (Fig. 1) were in agreement with electrophoretic migration theory:<br />
as molecular weight is lower, as electrophoretic mobility is higher. In CZE, solutes are<br />
basically separated according to the differences in their charge-to-size ratios. The AEM value<br />
of not fractionated HA (HA whole ) was close to the AEM of HA >300 fraction, which was the<br />
more recovered fraction from the original HA.<br />
Electropherograms of the investigated samples obtained with borate-phosphate buffer<br />
contained four peaks (Fig. 2).<br />
4<br />
3<br />
2<br />
1<br />
HA whole<br />
ABS at 254 nm<br />
HA >300<br />
HA 300-100<br />
HA 100-50<br />
HA 50-20<br />
-0.040 -0.035 -0.030 -0.025 -0.020 -0.015 -0.010<br />
μ eff<br />
(cm 2 V -1 min -1 )<br />
Figure 2: Electropherograms of peat HA fraction with borate-phosphate buffer<br />
The peaks #1 around -0.025 cm 2 V -1 min -1 was broad with a tailing character, the peak #2<br />
<strong>Vol</strong>. 2 Page - 168 -
15th IHSS Meeting- <strong>Vol</strong>. 2<br />
close to the peak #1 was sharp, the peak #3 around -0.028 cm 2 V -1 min -1 was broad and not<br />
well present in all sample. The peak #4 -0.030 cm 2 V -1 min -1 was sharp, but with a tailing<br />
character. The electropherogram of HA >300 was characterized by a very broad peak #1, and a<br />
higher peak #2, whereas the peaks #3–4 were small. HA 300-100 shows a pattern similar to that<br />
of HA >300 , but in this case the peak #4 was higher. The fractions HA 100-50 and HA 50-20 were<br />
characterized by a lower peak #1, a broad and flatter peak #3, and a peak #4 higher than the<br />
peaks #2. The fourth sharp peak which appears with the borate-phosphate buffer increases<br />
significantly when the molecular size decreases. This peak has been proposed to represent<br />
complexes formed through interaction of the phenolic groups of HA with the borate buffer<br />
[2]. The presence of a large number of carboxylic and phenolic groups in low molecular size<br />
fractions [8] can explain this observation.<br />
<strong>Vol</strong>. 2 Page - 169 -
15th IHSS Meeting- <strong>Vol</strong>. 2<br />
4. Conclusions<br />
Humic acid fractions obtained by tangential ultra-filtration were characterized by CZE with<br />
two different approaches. Using a non interactive buffer (carbonate) was possible to calculate<br />
the average electrophoretic mobility of each fraction and a precise correlation with molecular<br />
size was found. Instead with borate-phosphate buffer the electropherogram contained four<br />
resolved peaks. The pattern shows an increase of high mobility peak, when the molecular size<br />
decrease. The combination of CZE and tangential ultra-filtration provide to increase the<br />
knowledge about electrophoretic behavior of the HSs.<br />
Acknowledgments<br />
This research was supported with funds provided by UNIBO (RFO).<br />
References<br />
1. P. Janos, J. Chromatogr. A, 983 (2003) 1.<br />
2. P. Schmitt-Kopplin and J. Junkers, J. Chromatogr. A, 998 (2003) 1.<br />
3. M. Hosse and K.J. Wilkinson, Environ. Sci. Technol. 35 (2001) 4301.<br />
4. N.G. Vanifatova, A.G. Zavarzina and B.Y. Spivakov, J. Chromatogr. A, 1183 (2008) 186.<br />
5. S. Pompe, K.-H. Heise and H.J. Nitsche, J. Chromatogr. A, 723 (1996) 215.<br />
6. L. Cavani, C. Ciavatta, O.E. T<strong>ru</strong>betskaya, O.I. Reznikova, G.V. Afanas'eva and O.A.<br />
T<strong>ru</strong>betskoj, J. Chromatogr. A, 983 (2003) 263.<br />
7. Z. He, T. Ohno, F. Wu, D.C. Olk, C.W. Honeycutt and M. Olanya, Soil Sci. Soc. Am. J.,<br />
72(5) (2008) 1248.<br />
8. O. Francioso, S. Sànchez-Cortéz, D. Casarini, J.V. Garcia-Ramos, C. Ciavatta and C.<br />
Gessa, J. Mol. St<strong>ru</strong>ct., 609 (2002) 137.<br />
<strong>Vol</strong>. 2 Page - 170 -
15th IHSS Meeting- <strong>Vol</strong>. 2<br />
DRIFT Characterization of Organic Matter Composition on Soil St<strong>ru</strong>ctural<br />
Surfaces<br />
Ruth Ellerbrock*, Horst H. Gerke, Martin Leue<br />
Leibniz-Centre for Agricultural Landscape Research (ZALF), Institute of Soil Landscape<br />
Research, Müncheberg, Germany<br />
E-mail: rellerbrock@zalf.de<br />
1. Introduction<br />
In st<strong>ru</strong>ctured soils, interaction of percolating water and reactive solutes with the soil matrix is<br />
often restricted to the outer surfaces of the preferential flow paths. Such surfaces of soil<br />
aggregates and biopores are mostly covered by organic matter (OM) that finally controls<br />
wettability, sorption and transfer properties of the flow pathways. However, the local OMproperties<br />
along such surfaces are largely unknown to date since the coatings are relatively<br />
thin and vulnerable. Organic aggregate coatings were already found to differ in SOM content<br />
and composition from the surrounding soil matrix when using disturbed samples [1]. The<br />
objective of this study is to determine and compare the local 2D distribution of soil OM<br />
composition (i.e. OM functional groups) at intact aggregate surfaces by the Fourier Transform<br />
Infrared Spectroscopy in Diffuse Reflectance (DRIFT) technique [2].<br />
2. Materials and Methods<br />
Soil clods were sampled from a loess-derived Luvisol located at Hněvčeves (near Hradec<br />
Králové, CZ) [3]. The aggregate sample surfaces are distinguished in areas from earthworm<br />
burrows, root channels, and aggregate coatings.<br />
a) b) c)<br />
30<br />
20<br />
10<br />
Kubelka Munk units 40<br />
B<br />
A<br />
4000 3200 2400 1600 800<br />
Wavenumber [cm -1 ]<br />
Transect<br />
0<br />
A/B *1000<br />
1<br />
2<br />
A/B mapping<br />
A/B mixed sample<br />
3<br />
0 5 10 15 20<br />
Transect [mm]<br />
Figure 1: a) Principle of ‘DRIFT mapping’ of an aggregate surface (Photo), b) DRIFT spectra<br />
obtained along the transect, and c) A/B ratios determined from these DRIFT spectra.<br />
<strong>Vol</strong>. 2 Page - 171 -
15th IHSS Meeting- <strong>Vol</strong>. 2<br />
The spatial distribution of SOM functional groups was analyzed using automatic DRIFT<br />
mapping that was carried out in a 1 mm grid for several aggregate surfaces (Fig. 1; [4]). All<br />
DRIFT spectra were recorded in the range between 400 and 4000 cm -1 (resolution 4 cm -1 ) and<br />
converted to Kubelka-Munk units [5]. The heights of the C–H bands (A) (at about 2930 cm -1<br />
(Aa) and 2855 cm -1 (As)), were related to the heights of the C=O bands (B) at about 1710 cm -<br />
1 and 1620 cm -1 . The A/B ratio as a ratio between hydrophobic (C–H) and hydrophilic (C=O)<br />
functional groups (Fig. 1d) is assumed to correspond with the wettability of the surfaces [1].<br />
3. Results and Discussion<br />
For a fine textured soil the aggregate sample surfaces can be distinguished by DRIFT<br />
mapping in areas from earthworm burrows, root channels, and aggregate coatings. The A/B<br />
ratios differ at a scale of less than 1 mm.<br />
a) Photo b) A/B ratios<br />
c)<br />
0.04<br />
A/B ratios<br />
0.000<br />
0.003<br />
0.006<br />
0.009<br />
0.012<br />
0.015<br />
0.018<br />
0.021<br />
0.024<br />
0.027<br />
0.030<br />
A/B ratio<br />
0.03<br />
0.02<br />
0.01<br />
0.00<br />
5 10 15 20 25<br />
30 35<br />
Transect [mm]<br />
Figure 2: a) Photo of an aggregate surface of a Luvisol (Hněvčeves, 60 cm soil depth);<br />
Features: (i) old earthworm burrow (left side), (ii) a fine root (down left) and (iii) a fresh<br />
earthworm burrow (right side), b) contour plot of A/B ratios in DRIFT spectra (Red circles:<br />
polystyrene markers) and c) A/B ratio at point 37 of the transects 1 to 38 obtained by ‘DRIFT<br />
mapping’ at a soil aggregate crossing two earthworm burrows.<br />
For an intact aggregate surface (Fig. 2a), A/B ratios in DRIFT of clay-organic coatings, root<br />
residues, and channels and earthworm burrows are higher than those of the matrix (Fig. 2b).<br />
Further the A/B ratios are higher for the region of the older (feature i) as compared to that of<br />
the younger earthworm burrow (feature iii; Fig. 2b and c). For an aggregate surface that did<br />
not show earthworm burrows (Fig. 3a) similar differences in A/B ratio were observed: Areas<br />
with a fine root (Fig. 3b, turquoise circle) and clay organic coatings (Fig. 3b, black circle)<br />
respectively show higher A/B ratios than those of the surrounding matrix.<br />
<strong>Vol</strong>. 2 Page - 172 -
15th IHSS Meeting- <strong>Vol</strong>. 2<br />
25<br />
20<br />
15<br />
10<br />
5<br />
A/B ratios<br />
0.000<br />
0.003<br />
0.006<br />
0.009<br />
0.012<br />
0.015<br />
0.018<br />
0.021<br />
0.024<br />
0.027<br />
0.030<br />
5 10 15 20 25 30 35 40 45<br />
[mm]<br />
Figure 3: a) Photo of an aggregate surface without earthworm burrows (Luvisol: Hněvčeves,<br />
60 cm soil depth) and b) contour plot of A/B ratios determined from DRIFT spectra obtained<br />
by DRIFT mapping of the corresponding surface. (Black circle: clay organic coatings;<br />
turquoise circle: fine root; red circles: polystyrene markers).<br />
The findings presented here are similar to findings for the surface of an earthworm burrow<br />
and a crack surface obtained from the Bt horizon of another Luvisol analyzed by [4]. Such<br />
differences in the spatial distribution of A/B ratios at the aggregate surfaces indicate that the<br />
relative amount of hydrophobic groups is higher in the OM of both clay-organic (Fig. 3b) and<br />
bio pore (Fig. 2b) coatings as compared to that of the matrix. The higher A/B ratios will<br />
possibly result in a decreased wettability of the respective surface regions.<br />
4. Conclusions<br />
The results suggest that standard DRIFT inst<strong>ru</strong>ments are usable to detect differences in OM<br />
composition for flat flow path surfaces from fine textured soils. DRIFT mapping of aggregate<br />
surfaces becomes feasible by measuring series of parallel transects. Artificial materials (e.g.,<br />
polystyrene; polyethylene) could be used as appropriate spatial markers. For fine textured<br />
soils, DRIFT mapping detects differences in A/B ratios along transects crossing earthworm<br />
burrows and crossing regions with fine roots or clay organic coatings. The A/B ratios differ at<br />
a scale of less than 1 mm. For intact aggregate surfaces, A/B ratios in DRIFT of clay-organic<br />
coatings, root residues, and channels and earthworm burrows are higher than those of the<br />
matrix indicating that the relative amount of hydrophobic groups is higher in the OM of both<br />
clay-organic and bio pore coatings as compared to that of the matrix. Therefore we conclude<br />
that the coatings at preferential flow path surfaces differ locally in terms of OM composition,<br />
distribution and possibly also in wettability which indicates yet unknown implications for<br />
preferential movement of water and especially of reactive solutes. Local maps of OM<br />
composition, however, may eventually help improving the analysis of transport of sorptive<br />
chemicals in st<strong>ru</strong>ctured soil.<br />
<strong>Vol</strong>. 2 Page - 173 -
15th IHSS Meeting- <strong>Vol</strong>. 2<br />
However, for analyzing flow path surfaces that show a micro relief additional calibration for<br />
application towards intact surface analyses is required since the distance between samples<br />
surface and collection mirror influences the DRIFT signal intensity as well. Future<br />
requirements are the application of radiometric and geometric correction procedures to<br />
consider the effect of the surface geometry on both the signal intensities of the DRIFT spectra<br />
and the location of the displayed measurement points.<br />
Acknowledgements<br />
The authors thank the “Deutsche Forschungsgemeinschaft (DFG)” (EL 191/7-1) for financial<br />
support and Prof. Dr. Radka Kodesova (University of Prague) for collaboration during soil<br />
sampling in Hnevceves. Thanks to Marina Schmidke (TU Dresden) for scanning the soil<br />
aggregate samples.<br />
References<br />
1. R.H. Ellerbrock and H.H. Gerke, 2004 Eur. J. Soil Sci., 55 (2004) 219–228.<br />
2. B.C. Smith Fundamentals of Fourier Transform Infrared Spectroscopy, Taylor and<br />
Francis CRC Press, 1995, pp. 216.<br />
3. R. Kodesova, M. Kocarek, V. Kodes, J. Simunek and J. Kozak. Vadose Zone J., 7 (2008)<br />
798–809.<br />
4. R.H. Ellerbrock, H.H. Gerke and C. Böhm, Soil Sci. Soc. Am. J., 73 (2009) 531–540.<br />
5. A. Ciani, K.-U. GOSS and R.P. Schwarzenbach, Eur. J. Soil Sci., 56 (2005) 561–574.<br />
<strong>Vol</strong>. 2 Page - 174 -
15th IHSS Meeting- <strong>Vol</strong>. 2<br />
Redox Properties of Hydroquinone-Enriched Humic Substances<br />
Shcherbina N.S. a* , Perminova I.V. b , Novikov A.P. c , Kalmykov S.N. b ,<br />
Marquardt C.M. d , Walther C. d , Buckau G. d<br />
a Isotope and Elemental Analysis, Department Nuclear Energy and Safety, Paul<br />
ScherrerInstitut, 5232 Villigen PSI, Switzerland; b Department of Chemistry, Lomonosov<br />
Moscow State University, Leninskie Gory 1/3, 119991, Moscow, Russia; c Vernadsky Institute<br />
of Geochemistry and Analytical Chemistry, RAS, Kosygin av. 19, 119991, Moscow, Russia<br />
d Institut für Nukleare Entsorgung, KIT, Campus Nord, Herrman-von-Helmholtz-Platz 1,<br />
76344, Eggenstein-Leopoldshafen, Germany<br />
E-mail: natalia.shcherbina@psi.ch<br />
1. Introduction<br />
It is well established that humic substances (HS) are redox active. To quantify reducing<br />
properties a number of methods have been applied [1–3]. However use of different techniques<br />
for HS redox properties quantification resulted in a huge amount of incomparable data,<br />
characterized certain HS under different conditions. Moreover, measurable value is strongly<br />
dependant on initial speciation of HS under investigation, so-called “starting” point, specified<br />
by sequestration and separation procedures. Therefore unique method of HS redox properties<br />
characterization is required to perform reliable comparison of HS with different origin.<br />
Recently spectroscopic techniques were successfully applied for HS characterization [4, 5].<br />
The fluorescence spectra of DOM and isolated fulvic acids are similar among freshwater and<br />
marine samples; positions of the peak and intensities have been correlated with origin of HS.<br />
These studies indicated that some features of fluorescence spect<strong>ru</strong>m can be linked to the HS<br />
functionality and therefore can characterize redox state of HS [4, 5].<br />
Redox sensitive functionalions of HS have not been clearly specified. A number of authors<br />
suggested quinonoid-type groups to be redox-sensitive functionality of HS [1-3], some<br />
authors discern sulfur-containing groups that pose redox properties as well [6]. To approve<br />
these suggestions, HS enriched in hydroquinone moiety were used as a model compounds<br />
with known functionality. Changes in redox state translated into different optical<br />
characteristics were traced by laser-induced fluorescence spectroscopy in steady-state (LIFS)<br />
and time-resoled mode (TRLIFS). The HS in reduced forms were generated at different Eh<br />
values.<br />
2. Materials and Methods<br />
Modification of HS and further characterisation have been previously described in details by<br />
Perminova et al. [7]. Oxidative polymerization with hydroquinone was used to prepare<br />
<strong>Vol</strong>. 2 Page - 175 -
15th IHSS Meeting- <strong>Vol</strong>. 2<br />
hydroquinone-homopolymers (HQ m ) and derivatives of HS (HQ250, HQ500). Leonardite HA<br />
(CHP) was used as parent humic material. For comparison GoHy-573 HA extracted from<br />
Gorleben groundwaters (Low Saxony, Germany) was used as a well characterized humic<br />
pattern [8].<br />
Reduction of HS was preformed with Na 2 S 2 O 4 . The aliquots of HS were mixed with aliquot<br />
of sodium dithionite at pH ~ 10 and after the certain incubation time (>24 hours) mixture was<br />
diluted by 0.001 M PIPES buffer in background electrolyte (0.1 M NaClO 4 ) up to 10 ml.<br />
Final HS concentration was 12.5 mgC·L -1 , sodium dithionite concentration was ranged from<br />
2.2·10 -5 to 2.2·10 -3 mol·L -1 . Afterwords pH and Eh were controlled and fluorescence spectra<br />
were recorded.<br />
Stationary fluorescence spectra in the spectral range of 350 nm < λ em < 650 nm were recorded<br />
time resolved at room temperature following excitation by a pulsed (20 ns) dye laser at λ ex =<br />
375 nm.<br />
3. Results and Discussion<br />
Synthesis and characterization of hydroquinone humic derivatives are described in detailes<br />
elsewhere [7]. The fluorescence spectra of HS contain prominent “humic” peak that are<br />
similar among all the samples examined. Samples incubated at reduced conditions (Eh < -77<br />
mV) are characterized by blue shift of the peak maximum. This could be attributed to the<br />
increase of reduced moiety (e.g. hydroquinone), whose emission spectra shifted to lower<br />
wavelength with respect to the peak of oxidized groups (e.g. qionone). A similar shift was<br />
alos observed in the case of hydroquinone homopolymer (HQ m ).<br />
The temporal decay (lifetime) was fitted by biexponential function<br />
I = A exp[ − t/ τ ] + A exp[ − t/ τ<br />
2]<br />
). When the intensity of the fluorescence and its temporal<br />
(<br />
1 1 2<br />
decay was compared as a function of Eh, the following characteristic dependency was found.<br />
Whereas the short component τ 1 remains almost unaffected, the long component τ 2 passes a<br />
maximum close to Eh=0 upon stepwise reduction of the HA. As a consequence the emission<br />
intensity also reaches a maximum close to Eh=0.<br />
<strong>Vol</strong>. 2 Page - 176 -
15th IHSS Meeting- <strong>Vol</strong>. 2<br />
Table 1: Results of TRLIFS of GoHy-573 HA reduced at different Eh; C(HS) = 12.5 mgC·L -1 , 0.001<br />
M PIPES buffer (in 0.1 M NaClO 4 ).<br />
Int (at 515 nm), Lifetime (at 515 nm), μs<br />
Sample # pH Eh, mV<br />
a.u. τ 1 τ 2<br />
1 7.12 +356 2957 0.0148 0.1051<br />
2 7.04 -332 4819 0.013 0.2226<br />
3 7.09 -377 4956 0.014 0.165<br />
4 7.09 -398 3717 0.014 0.161<br />
5 7.09 -410 3322 0.016 0.097<br />
6 7.07 -420 2884 0.012 0.080<br />
This rather complex dependence on the redox potential may be understood by considering the<br />
different kinds of functional group produced whith different molar absorptions and lifetimes.<br />
For instance, if quinonoid groups represent redox sensitive moiety in humic st<strong>ru</strong>cture,<br />
reduction of qionone should proceed though formation of intermediate semiquinone radicals,<br />
as it is shown in Fig. 1 below.<br />
O<br />
O<br />
O<br />
-e -<br />
-e -<br />
+e - +e -<br />
O<br />
Figure 1: Quinone-hydroquinone redox equilibrium.<br />
Increase in τ 2 may signify formation of semiquinones that are relatively stable [9]. Subsequent<br />
decrease of τ 2 may be attributed to the semiquinone consumption due to formation of<br />
hydroquinone-type groups.<br />
This suggestion is confirmed by Ayako Futami and Guenter Gauska [10], who reported value<br />
of semiquinone molar absorption to be 7.2·10 3 M -1·cm -1 (measured at 420 nm), that is at least<br />
order of magnitude higher, than that of quinone (500 - 600 M -1·cm -1 ), while molar absorption<br />
of hydroquinone is negligible at this wavelength range. Cory and Mcknight [11] established<br />
the increase in emission intensity of the reduced quinone-like components. Since, all these<br />
components have different contribution into the fluorescence properties because their ratio in<br />
the HS st<strong>ru</strong>cture is unknown, one can observe only average emission spectra. Therefore,<br />
increase of emission intensity might originate from hydroquinone-type groups formed upon<br />
reduction, while the subsequent intensity decrease occurs because of semiquinones<br />
production, possessing higher molar absorption. It means that emission should be dependent<br />
O<br />
O<br />
<strong>Vol</strong>. 2 Page - 177 -
15th IHSS Meeting- <strong>Vol</strong>. 2<br />
on the equilibrium position between these tree products (Fig. 1). Intensity was also found to<br />
depend on free electron content (spin/mol Ar-OH): the lowest intensity is observed for CHP<br />
having the highest free electron to phenol ratio (58.9·10 19 ), while intensity icreases in the<br />
order HQ100 < HQ250 < HQ500 with free electron content 12.7·10 19 , 12.1·10 19 and 4.1·10 19<br />
spin/mol Ar-OH correspondingly. [7]. Therefore, emission intensity is characteristic for<br />
particular HS and can be one of the criteria for comparison of different HS oxidation state.<br />
4. Conclusions<br />
Reduction of HS performed by Na 2 S 2 O 4 is accompanied by blue-shift of fluorescence<br />
spect<strong>ru</strong>m that may be due to the increase of hydroquinone-to-quinone-groups ratio. The low<br />
quinonoid moiety of HS, the less changes are observed in the spectra of treated humic<br />
materials, when compared to the original HS. Time-resolved measurements showed initial<br />
increase of life-times of reduced HS and subsequent decrease of τ with redox potential on<br />
which HS were incubated. This confirms formation of intermediate product with longer τ if<br />
compared to completely reduced or oxidized functionality. Semiquinone radicals were<br />
proposed to be the intermediate products either in HS reduction or oxidation and may be<br />
responsible for the complicated dependence of fluorescence properties of HS on redox<br />
conditions.<br />
Acknowledgements<br />
This work was supported by training grant by the EURATOM 7 th Framework Program<br />
Collaborative Project “Redox Phenomena Controlling Systems” (CP ReCosy).<br />
References<br />
1. Z.St<strong>ru</strong>yk, G. Sposito, Geoderma, 102 (2001) 329.<br />
2. M. Bauer, T. Haitnamm, D.L. Macalady, Ch. Blodau, Environ. Sci. Technol., 41 (2007) 139.<br />
3. A. Matthiessen, Vom Wasser, 84 (1995) 229.<br />
4. L. Klapper; D.M. McKnight, E.L. Blunt-Harris, K.P. Nevin, D.R. Lovley, P.G. Hatcher, Environ.<br />
Sci. Technol., 36 (2002) 3170.<br />
5. H. Gorner Photochim. Photobiol., 78 (2003) 440.<br />
6. V. B<strong>ru</strong>echert Geochim. Cosmochim. Acta, 62 (9) (1998) 1567.<br />
7. I.V. Perminova, A.N. Kovalenko, P. Schmitt-Kopplin, K. Hatfield, N. Hertkorn, E.Y. Belyaeva,<br />
V.S. Petrosyan, Environ. Sci. Technol. 39(21) (2005) 8518.<br />
8. J.I.Kim, G. Buckau, G.H. Li, H. Duscher, N. Psarros, Fresenius J. Anal. Chem.,338 (1998) 245.<br />
9. Min Weng, Man-Hua Zhang, Tao Shen, J. Photochem. Photobiol. A: Chem. 111 (1997) 105.<br />
10. Ayako Futami and Guenter Gauska. Biochim. Biophys. Acta, 547 (1979) 597.<br />
11. R.M. Cory, D.M. Mcknight, Environ. Sci. Technol., 39 (2005) 8142.<br />
<strong>Vol</strong>. 2 Page - 178 -
15th IHSS Meeting- <strong>Vol</strong>. 2<br />
Characterization of Soil Humic Acids Using Off-Line Combination of<br />
Two-Dimensional Liquid Chromatography Methods RP-HPLC and SEC<br />
Góra Róbert*, Hutta Milan, Rohárik Pavol<br />
Department of Analytical Chemistry, Faculty of Natural Sciences,<br />
Comenius University in Bratislava, Mlynská dolina CH-2, 842 15 Bratislava, Slovakia<br />
E-mail: gora@fns.uniba.sk<br />
1. Introduction<br />
Humic substances (HS) are created by a complex mixture of amorphous, yellow to black<br />
colored, hydrophilic, polyelectrolyte poly-disperse macromolecules and maybe no two<br />
molecules are identical [1]. From the point-of-view of chemical analysis, characteristic feature<br />
of these analytes is diffuse non-distinct analytical signal produced by many detection<br />
principles. Therefore, we could call them loosely defined or fuzzy chemical systems. This<br />
signal does not usually result in an exact numerical physical-chemical data, but is described<br />
also by their distribution function or range of validity.<br />
Separation methods play an important role in universal approach outlined below mainly<br />
during the isolation of environmental macromolecules and during their separation and/or<br />
fractionation into relatively well defined sub-fractions. Among the chromatography methods<br />
[2] size–exclusion chromatography (SEC) occupies the largest application area in the field of<br />
HSs relative molar mass determination and is extensively used also for purpose of<br />
macromolecule size based fractionation [3,4]. Reversed-phase high performance liquid<br />
chromatography (RP-HPLC) as prevailing chromatographic method has achieved in the field<br />
of analysis and characterization of HS only very limited application [5,6].<br />
Complexity of HSs invokes need for more comprehensive solutions of their separation. This<br />
dictates the necessity of development of automated complex separation procedures with<br />
minimal sample pretreatment, and the use of on-line multidimensional chromatographic<br />
techniques is a logical solution to these requirements. Multidimensional chromatography has<br />
proven to be useful for the analysis of complex samples such as humic substances [7].<br />
The aim of this work is an introductory study of off-line combination RP-HPLC and SEC.<br />
With respect to the non-common approach we focused to evaluation of its potential to create<br />
orthogonal, i.e. on different separation principles working two dimensional comprehensive<br />
separation methods.<br />
<strong>Vol</strong>. 2 Page - 179 -
15th IHSS Meeting- <strong>Vol</strong>. 2<br />
2. Materials and Methods<br />
All chromatographic experiments involving RP-HPLC fractionation and SEC characterization<br />
of the selected groups of humic substances were carried out by the HPLC system LaChrom<br />
(Merck-Hitachi, Darmstadt, Germany) using a LiChroCART column 250x4mm filled by wide<br />
pore octadecylsilica LiChrospher WP 300 RP-18, 5μm spherical particles. Measured dwell<br />
volume of the RP-HPLC system including column was 3.80 mL and should be considered<br />
when gradient mixing profile and chromatogram appearance is to be compared [8].<br />
SEC separation was carried out using a stainless-steel column 250×2.2 mm filled by Spheron<br />
HEMA 100 (copolymer of hydroxyethylmetacrylate with ethylenedimetacrylate) sorbent,<br />
spherical particles diameter was below 25 µm. Pump operated at flowrate 0.2 mL/min.<br />
<strong>Vol</strong>umes 20 µL of sample from selected HSs fractions were injected to SEC system. Void<br />
volume (V 0 ; 0.35 mL) and total permeation volume (V i ; 0.95 mL) of the column were<br />
determined using Blue Dextran 2000 (Pharmacia Fine Chemicals AB, Uppsala, Sweden) and<br />
toluen, or nitrobenzene (Lachema, Brno, Czech Republic), respectively. The column system<br />
was calibrated using polystyrene standards (Polymer Laboratories, Amherst, USA) with<br />
different nominal molar mass for estimating the averaged molar mass of injected fraction of<br />
HSs. Target group of humic substances was obtained by the procedures published by [9,10].<br />
Solutions of humic substances were prepared daily fresh by dissolution of weighed HSs at ca.<br />
3 mg/mL concentration level in initial composition of mobile phase for RP-HPLC slightly<br />
adjusted by 0.05 M NaOH.<br />
3. Results and Discussion<br />
The devised stepwise gradient chromatographic [8,11] method with tandem DAD and<br />
fluorimetric detection was used for characterization and fractionation of HSs by their<br />
chromatographic profiles. Each fraction was collected in time range which was obtained<br />
according to the FLD response. <strong>Vol</strong>ume of these fractions was 400 µL collected around their<br />
peak maximum. Selected major fractions were analysed by the second chromatographic<br />
method (SEC). Relative molar mass exclusion limits of polymers in Spheron HEMA 100<br />
range from 70 000 to 250 000 according to the manufacturer [12]. During develoment of SEC<br />
method for the reliable characterization of HSs and their fractions, several mobile phases were<br />
tested (1% DMF / 99% phosphate buffer, pH = 3.00 (v/v); 50% DMF / 50% phosphate buffer<br />
(v/v); 99% DMF / 1% phosphate buffer (v/v). Finaly, mixture of 99% DMF / 1% phosphate<br />
buffer, pH = 3,00 (v/v) was chosen.<br />
<strong>Vol</strong>. 2 Page - 180 -
15th IHSS Meeting- <strong>Vol</strong>. 2<br />
Figure 1: Example multi-chromatogram of HA I obtained by application of combination of<br />
chromatographic methods RP-HPLC and SEC. Vertically located record is background corrected RP-<br />
HPLC profile obtained using FLD at Ex 470 nm/Em. 530 nm, flow-rate 1 mL/min, after injection of<br />
100 µL sample volume. Horizontally located records are SEC profiles of major HA I fractions (FLD at<br />
Ex 470 nm/Em) at flow-rate 0.2 mL/min. Injection volume was 50 µL<br />
Horizontally located chromatograms (RP-HPLC profiles) in the following figure (Fig.1.)<br />
show typical examples of the profiles as resulted from analysis of humic acid (HA isolated<br />
from soil, for specifications see figure captions). From the drawing it is evident that the<br />
combination of chromatographic methods is capable to distinguish among the fractions of<br />
HAs. The records show that in each of collected fractions from RP-HPLC we can find<br />
different peaks by SEC that code distribution of HA fractions with the highest signal in the<br />
region below relative molar mass value 5000. It means that regardless the hydrophobicity<br />
and/or interaction HA-DMF ability of HAs – their SEC profiles are similar but not identical<br />
under the FLD detection conditions.<br />
Spearman Rank Correlation<br />
Correlation rho -0.0527<br />
2-sided P-value 0.8929<br />
S 126.3245<br />
Number of pairs (N) 0.05 0.01<br />
7 0.714 0.893<br />
Table 1: Statistical parameters obtained by application of Spearman Rank Correlation [13] for<br />
calculation of degree of correlation for data obtained using application of above described<br />
combination of chromatographic methods (RP-HPLC – SEC) for three selected fractions of HA I.<br />
<strong>Vol</strong>. 2 Page - 181 -
15th IHSS Meeting- <strong>Vol</strong>. 2<br />
To prove the non-existence of retention times (RP-HPLC/SEC) correlation (its existence is<br />
defined as H0 hypothesis) we did statistical test by Spearman rank correlation (SRC) and<br />
Pearson product-moment correlation coefficient. The treatment is given in Table 1.<br />
4. Conclusions<br />
The results suggest that the devised off-line 2D RP-HPLC and SEC method is highly reliable<br />
for characterisation and fractionation of soil HAs in a wide concentration range and also at<br />
trace concentration levels. Analysis of individual fractions obtained by the described RP-<br />
HPLC method by the method working on independent separation principles – described SEC<br />
method - provided data of even higher dimensionality needed for HSs investigation.<br />
Obtained results indicate, that such methods could be combined in a compact, automatic,<br />
orthogonal separation systems for characterization of such complicated natural substances as<br />
are examined HAs and obtain so more information about their character.<br />
Acknowledgements<br />
This work was supported by the financial support of projects VEGA 1/0870/09, APVV-0595-<br />
07 and VVCE-0070-07<br />
References<br />
1. Choudhry G.G., Humic Substances. St<strong>ru</strong>ctural aspects, and photophysical, photochemical and free<br />
radical characteristics, in Hutzinger O. Ed., The Handbook of Environmental Chemistry <strong>Vol</strong>. 1.,<br />
Part C., The Natural environment and the biogeochemical cycles, Springer, Heidelberg, 1989, 1.<br />
2. P. Janoš, J. Chromatogr. A 983 (2003) 1.<br />
3. J. Peuravuori, K. Pihlaja, Anal. Chim. Acta, 337 (1997) 133.<br />
4. P. Janoš, I. Zatřepálková, J. Chromatogr. A, 1160 (2007) 160.<br />
5. G. Woelki, S. Friedrich, G. Hanschmann, G. Salzer, Fresenius J. Anal. Chem. 357 (1997) 548.<br />
6. A.T. Lombardi, E. Morelli, E. Balesteri, A. Seritti, Environ. Technol., 13 (1992) 1013.<br />
7. T.-J. Whelan, R.A. Shalliker, C. McIntyre, M.A. Wilson, Ind. Eng. Chem. Res., 44 (2005) 3229.<br />
8. M. Hutta, R. Góra, J. Chromatogr. A., 1012 (2003) 67.<br />
9. J. Kandráč, M. Hutta, M. Foltin, J. Radioanal. Nucl. Chem., Articles, 208 (1996) 587.<br />
10. Prochácková, R. Góra, J. Kandráč, M. Hutta, J. Radioanal. Nucl. Chem., Articles, 229 (1998) 61.<br />
11. R. Góra, M. Hutta, J. Chromatogr. A.,1084 (2005) 39.<br />
12. Anonymous, Hydroxyethylmethacrylate gels, Gels Spheron, Lachema, n.p. Brno, Karásek 28<br />
Brno.<br />
13. Wessa, P. (2009), Free Statistics Software, Office for Research Development and<br />
Education,version 1.1.23-r4, URL http://www.wessa.net/ (15.9.2009).<br />
<strong>Vol</strong>. 2 Page - 182 -
15th IHSS Meeting- <strong>Vol</strong>. 2<br />
Characterization of RP-HPLC Fractionated Humic Acids by<br />
RP-HPLC Method Using Stepwise Gradient<br />
Rohárik Pavol * , Góra Róbert, Hutta Milan<br />
Department of Analytical Chemistry, Faculty of Natural Sciences, Comenius University in<br />
Bratislava, Mlynská dolina, 84215, Bratislava, Slovakia<br />
E-mail: roharik@fns.uniba.sk<br />
1. Introduction<br />
Humic substances (HSs) are ubiquitous natural materials occurring in huge amounts in soils,<br />
sediments and waters as a product of the chemical and biological transformation of animal<br />
and plant residues [1]. The HSs are also complex mixture of amorphous, yellow to black<br />
colored, hydrophilic, polyelectrolyte-like, polydisperse macromolecules and probably no their<br />
two molecules are identical. With respect to their supramolecular st<strong>ru</strong>cture, there is still a lot<br />
of controversy about their nature. Reversed-phase high performance liquid chromatography<br />
(RP-HPLC) as prevailing chromatographic method has achieved in the field of analysis and<br />
characterization of HSs only very limited application. In the majority of cases authors used<br />
conventional organic solvents (methanol, acetonitrile) typical for RP-HPLC separation of<br />
small molecules together with weakly pH buffered aqueous part of mobile phase. However,<br />
these mobile phases did result in moderate satisfaction with HS samples [2–4].<br />
In this work, RP-HPLC using combination of step-wise and linear gradient of<br />
dimethylformamide (DMF) in buffered aqueous mobile phase and a wide-pore (30 nm)<br />
octadecylsilica column was evaluated for purpose of characterization of RP-HPLC<br />
fractionated humic acids [5,6].<br />
2. Materials and Methods<br />
Fractionation and characterization of HSs was carried out by the HPLC system LaChrom<br />
(Merck-Hitachi, Darmstadt, Germany) consisting of pump L-7100 provided by a quarternary<br />
low-pressure gradient, autosampler L-7200, LiChrospher ODS WP 300 RP-18 (250 × 4) mm,<br />
(30nm wide-pore) column and guard column, column oven L-7300, diode-array detector L-<br />
7450A (DAD), fluorescence detector L-7480 (FLD), interface D-7000, PC data station with<br />
software HSM version 4 and on-line four channel solvent degasser L-7612.<br />
Stepwise gradient program was set from 0.0 to 3.6 min isocratic 0% (v/v) B in A, and from<br />
3.7 min, every 4 min there was isocratic step added increasing content of B in A by 10% (v/v)<br />
up to the last step increased by 9% (v/v) ending in 99% (v/v) B in A, maintained till 55.0 min<br />
isocratic 99% (v/v) B in A, from 55.1 min to 60.0 min linear decrease from 99% (v/v) B in A<br />
<strong>Vol</strong>. 2 Page - 183 -
15th IHSS Meeting- <strong>Vol</strong>. 2<br />
to 0% (v/v) B in A and between <strong>ru</strong>ns 10 min re-equilibration was maintained [5,6].<br />
Solution A: 1% DMF / 99% phosphate buffer (c = 5 mM, pH = 3.00)<br />
Solution B: 99% DMF / 1% phosphate buffer (c = 5 mM, pH = 3.00)<br />
Linear gradient program was set from 0.0 to 5.0 min isocratic 0% (v/v) B in A, from 5.1 to<br />
35.0 min linear increase from 0% (v/v) B in A to 95% (v/v) B in A,from 35.1 to 40.0 min<br />
isocratic 95% (v/v) B in A, from 40.1 to 45.0 min linear decrease from 95% (v/v) B in A to<br />
0% (v/v) B in A and between <strong>ru</strong>ns 10 min re-equilibration was maintained [5].<br />
Two types of HAs were analysed in this work, the first one was commercially available<br />
standard of HSs from Sigma - Aldrich company (Aldrich) and the second one was extracted<br />
from soil of Dunajská Streda locality, Slovakia (DS J) and isolated by modified IHSS<br />
fractionation scheme [7, 8].<br />
3. Results and Discussion<br />
In the first step the step-wise RP-HPLC method was used to obtain elution profiles and for<br />
fractionation (collecting all 11 fractions) of both samples (Fig. 1). In the second step the stepwise<br />
RP-HPLC method was applied for characterization of each fraction, which means reinjection<br />
all collected fractions (Fig. 2). We also used linear gradient RP-HPLC method for<br />
re-injection these fractions to prove that each fraction stays the same even through reinjection,<br />
independently on type of used gradient (Fig. 3).<br />
The results showed that ten-step gradient can induce distinct features of HAs and concentrate<br />
HA in peaks, increasing thus detection sensitivity. Combination of DMF solvating properties<br />
for HSs together with wide pore RP stationary phase improve surface interactions of the<br />
analytes and suppress the influence of size exclusion effects. Thus it provides reproducibility<br />
of characterization profiles and robustness of the methods.<br />
The gradient method is predetermined for efficient combination with the other methods of HL<br />
characterization, preferably separation methods. Individual fractions obtained by the RPHPLC<br />
method can be analyzed by separation methods acting on different and independent separation<br />
principle or mechanism as is e.g. size-exclusion chromatography (SEC), ligand-exchange<br />
chromatography (LEC), immobilized-metal affinity chromatography (IMAC) and etc.<br />
<strong>Vol</strong>. 2 Page - 184 -
15th IHSS Meeting- <strong>Vol</strong>. 2<br />
Figure 1: RP-HPLC profile using step-wise gradient of DS J sample (3.02 mg/ml, injection volume<br />
400 µL), using FLD (ex. 470 nm, em. 530nm). Arabic numbers 1-11 represented number of collected<br />
fractions<br />
Figure 2: Background corrected RP-HPLC profiles of all collected fractions of DS J sample, using<br />
step-wise gradient. FLD (ex. 470 nm, em. 530 nm).<br />
<strong>Vol</strong>. 2 Page - 185 -
15th IHSS Meeting- <strong>Vol</strong>. 2<br />
Figure 3: Background corrected RP-HPLC profiles of all collected fractions of DS J sample using<br />
linear gradient. FLD (ex. 470 nm, em. 530 nm)<br />
4. Conclusions<br />
Obtained data indicate, that this mode of application of RP-HPLC system could be employed<br />
as a separation system for more detailed characterization of such complicated natural<br />
macromolecules as analysed HAs and obtain so more information about their attributes.<br />
Acknowledgements<br />
This work was supported by the financial support of projects VEGA 1/0870/09, APVV-0595-<br />
07 and VVCE-0070-07.<br />
References<br />
1. Hayes M.H.B., MacCarthy P., Malcolm R.L., Swift R.S. (Eds.), Search of St<strong>ru</strong>cture, Humic<br />
Substances, <strong>Vol</strong>. II, Wiley, New York, 1989.<br />
2. Lombardi A.T., Morelli E., Balesteri E., Seritti A., Environ. Technol, 13 (1992) 1013.<br />
3. Woelki G., Friedrich S., Hanschmann G., Salzer G., Fresenius J. Anal. Chem., 357 (1997) 548.<br />
4. Namjesnik-Dejanovic K., Cabaniss S.E., Environ. Sci. Technol., 38 (2004) 1108.<br />
5. Hutta M., Góra R., J. Chromatogr. A, 1012 (2003) 67.<br />
6. Góra R., Hutta M., J. Chromatogr. A, 1084 (2005) 39.<br />
7. Kandráč J., Hutta M., Foltin M., J. Radioanal. Nucl. Chem., Articles, 208 (1996) 577.<br />
8. Prochácková T., Góra R., Kandráč J., Hutta M., J. Radioanal. Nucl. Chem., 229 (1998) 61.<br />
<strong>Vol</strong>. 2 Page - 186 -
15th IHSS Meeting- <strong>Vol</strong>. 2<br />
Analysis of Fluorescence Parameters of Alkaline Peat Extracts<br />
in Dependence from Their Origin<br />
Bejger Romualda * , Golebiowska Dorota<br />
Department of Physics and Agrophysics, West Pomeranian University of Technology<br />
s. Papieza Pawla VI/3 71-459 Szczecin, Poland<br />
E-mail: Romualda.Bejger@zut.edu.pl<br />
1. Introduction<br />
Within some last year the dynamic development in the inst<strong>ru</strong>mental methods is observed<br />
therefore studies on the chemical nature of humic substances (HS) has become possible.<br />
Molecular spectroscopy is the method of especially great importance in the studies on<br />
st<strong>ru</strong>ctural properties of HS. Spectroscopic measurements within the various electromagnetic<br />
spect<strong>ru</strong>m ranges bring the information about physicochemical properties of HS and show<br />
mechanisms of interaction between HS and the environmental factors [8, 9]<br />
The methods using the luminescence properties of substances is considered to be very<br />
promising nowadays, because luminescence measurements are quite simple, quick and<br />
characterize high sensitivity.<br />
Fluorescence phenomenon is characteristic for all humic compounds [7]. Fluorophores<br />
"activities" depend on degree of humification [1, 5, 6] and on degree of aggregation of<br />
macromolecules of humic acids (HA) as well as on the origin of HA [4].<br />
The aim of this work was the comparison of fluorescence parameters of HS and HA solutions<br />
isolated from two peat species belonging to two different types.<br />
2. Materials and Methods<br />
The examined humic substances were extracted from low-moor (L-M) and high-moor (H-M)<br />
peat samples collected from peatlands: Bloto Krakov and Olszanka, belonging to huge<br />
peatland complex in Dolna Odra Valley (53 0 37 ’ 50 ” up to 53 0 36 ’ 20 ” N and 14 0 37 ’ 35 ” up to<br />
14 0 41 ’ 05 ” E). Places of sampling were selected in such a way that sedge peat occupied<br />
subsurface layers of low-moor peat and sphagnum peat occupied subsurface layers of highmoor<br />
peat. The samples of peat were taken from 50-70 cm of depth.<br />
HS were extracted from natural moisture peat samples by extraction with 0.1 mol·dm -3 and<br />
with 0.5 mol·dm -3 NaOH according to Schnitzer and Sapek [2, 3]. Preparations of humic acids<br />
(HA) were obtained from previously isolated alkaline peat extracts.<br />
<strong>Vol</strong>. 2 Page - 187 -
15th IHSS Meeting- <strong>Vol</strong>. 2<br />
HS and HA solutions were characterized by fluorescence spectroscopy. T<strong>ru</strong>e emission<br />
spectra of fluorescence (FL) were recorded at room temperature using Hitachi MPF 4<br />
spectrofluorimeter. In order to decreasing of inner filter effect measurements were performed<br />
in triangular cell. The fluorescence emission spectra were recorded using four excitation<br />
wavelengths: 260, 320, 380, and 465 nm. The measurements were performed in concentration<br />
of 0.01 mgC·cm -3 in HS and HA solutions. As solvent was used NaHCO 3 in concentration of<br />
0.05 mol·dm -3 .<br />
3. Results and Discussion<br />
Fluorescence emission spectra showed the differences between HS and HA solutions<br />
extracted from peat samples belonging to two different types. Integral FL intensity of HA in<br />
integral FL intensity of whole alkaline peat extract, excited definite wavelength, was<br />
λ1<br />
calculated as: ∑I FL ∫ I<br />
FL Δλ (tab. 1)<br />
λ 2<br />
It was noted that (47-74) % of integral FL intensity of whole alkaline peat solutions extracted<br />
by NaOH solution in concentration of 0.1 mol·dm -3 from low-moor peat samples originated<br />
from HA, which are the main fraction of HS. In case of whole alkaline solutions extracted<br />
from high-moor peat samples by the same concentration of NaOH solution range was between<br />
79-143 %. It would indicate a more “inflexible” st<strong>ru</strong>cture of HA originated from high-moor<br />
peat samples and connected with this higher FL emission yield.<br />
Table 1: Part of integral FL intensity (%) of HA in integral FL intensity of whole alkaline peat<br />
extract<br />
Próbki<br />
∑I 1HA/∑I 1HS<br />
[%]<br />
∑I 2HA/∑I 2HS<br />
∑I 3HA/∑I 3HS<br />
∑I 4HA/∑I 4KHS<br />
[%]<br />
[%] [%]<br />
0,1 (L-M) 64 47 71 74<br />
0,5 (L-M) 75 52 69 91<br />
0,1 (H-M) 143 100 104 79<br />
0,5 (H-M) 74 53 66 95<br />
∑I 1 – area under a curve of FL emission by λ exc = 260 . nm<br />
∑I 2 – area under a curve of FL emission by λ exc = 320 nm<br />
∑I 3 – area under a curve of FL emission by λ exc = 380 nm<br />
∑I 4 – area under a curve of FL emission by λ exc = 465 nm<br />
0,1 i 0,5 – concentrations of NaOH solution<br />
<strong>Vol</strong>. 2 Page - 188 -
15th IHSS Meeting- <strong>Vol</strong>. 2<br />
Comparing of FL emission spectra excited by λ exc =260 nm (HA from low-moor and highmoor<br />
peat samples) it was noted, observed also early [1], phenomenon of short-wavelength<br />
FL emission originated from „young HA”. This band occurs only in HA extracted NaOH<br />
solution in concentration of 0.1 mol·dm -3 . It doesn’t „record” in case of HA originated from<br />
low-moor peat samples and also extracted NaOH solution in concentration of.0.5 mol·dm -3 . It<br />
is possible that fluorophores emitted short-wavelength in this condition are degraded or<br />
according this solvent (0.5 mol·dm -3 NaOH) are exposed st<strong>ru</strong>ctures which in “unradially” way<br />
can transfer exciting energy to long-wavelength fluorophores? It could testify about this<br />
increase of long-wavelength FL emission in HA extracted from high-moor peat samples by<br />
NaOH solution in concentration of.0.5 mol·dm -3 (tab. 1 position ∑I 4HA /∑I 4HS ) which value<br />
increased 79 % for HA isolated NaOH solution in concentration of.0.1 mol·dm -3 to 95 % for<br />
HA isolated by higher concentration of NaOH solution.<br />
4. Conclusions<br />
1. All studied solutions of humic substances and high-molecular fraction of humic substances<br />
– humic acids showed phenomenon of fluorescence at λ max. - 480 nm.<br />
2. Humic acids extracted with 0.1 mol·dm -3 NaOH from high-moor peat samples are<br />
characterized by additional band of short-wavelength fluorescence emission at λ max. - 350 nm.<br />
3. Responsible fluorophores for phenomenon of fluorescence emission of alkaline pest<br />
extracts originated from humic acids.<br />
References<br />
1. J. Miklewska, D. Gołębiowska, H. Dziadowiec, in N. Senesi, T. M. Miano (Ed), Humic substances<br />
in the Global Environment and Implications on Human Health, Elsevier, 1994, 317-322.<br />
2. A. Sapek and B. Sapek, Methods of chemical analysis of organic soils (in Polish). Falenty, IMUZ,<br />
1997, p.80.<br />
3. M. Schnitzer and S. Khan, Soil organic matter (Ed.), Elsevier, New York, 1978, p. 319.<br />
4. N. Patel-Sorrentino, S. Mounier, J.Y Benaim, Water Research, 36 (2002) 2571-2781.<br />
5. D. M. B. P. Milori, L. Martin-Neto, C. Bayer, J. Mielniczuk, Soil Science, 11 (2002) 167<br />
p. 739 – 749.<br />
6. A. Zsolnay, E. Baigar, M. Jimenez, B. Steinweg, F. Saccomandi, Chemosphere, 1 (1999) 38, p.<br />
45-50.<br />
7. N. Senesi, T. M. Miano, M. R. Provenzano, in B. Allard, H. Boren, A. Grimvall. (Ed), Humic<br />
substances in the Aquatic and Terrastrial Environment, Springer-Verlag, 1991,<br />
p. 63-73.<br />
8. A. A. Kovalev, Z. A. Nichiporovich, Journal of Applied Spectroscopy, 3 (2003) 70, p. 365-371.<br />
9. K. Kalbitz, W. Geyer, S. Geyer, Biogeochemistry, 47 (1999), p. 219-238.<br />
<strong>Vol</strong>. 2 Page - 189 -
15th IHSS Meeting- <strong>Vol</strong>. 2<br />
The Separation of Humic Substances on Aggregatively Stable Groups<br />
Alexander I. Popov a , Ludmila Yu. Golovenkina b , Sofia E. Zalmanova c<br />
a The Saint Petersburg State University, 16 th line 29, 199127 Saint Petersburg, Russian<br />
Federation; b The Baltic Institute of Ecology, Politics and Law, 18 th line 3, 199127 Saint<br />
Petersburg, Russian Federation; c The Saint Petersburg State Agrarian University, Petersburg’s<br />
Road 2/1a, 196600 Saint Petersburg – Pushkin, Russian Federation<br />
E-mail: paihumic@gmail.com; lisofang@yandex.<strong>ru</strong><br />
1. Introduction<br />
Humic substances (HS) are high-molecular-weight organic nitrogen-containing random redox<br />
polymers, they are polyfunctional polyampholytes, possessing characteristics of colloidal<br />
dispersions (7). Humic substances are biogeopolymers, such operationally definable<br />
materials, which composed from a set of "similar parts" that exhibits characteristic polymer<br />
behavior including properties dependent upon tertiary and quaternary st<strong>ru</strong>cture (2).<br />
Main approach to deciding the problems of separation of HS on groups is the use of direct<br />
interfacial mass transfer in that variants of dissolution-precipitation, which are based on<br />
distribution macromolecules between solution and sediment (gel) depending on their size and<br />
composition (1, 3, 4, 9, 10). Usually HSs are divided into two groups: humic and fulvic acids.<br />
On our opinion (7), an alkaline solution of HS is stable free disperse system. The disperse<br />
phase (HS) distributes equally in all volume of this solution. The acidification of alkaline<br />
solution of HS lead to precipitation of aggregatively unstable HS (humic acids).<br />
Aggregatively stable HS (fulvic acids) remain in liquid phase.<br />
The aim of this publication was to demonstrate a possibility of separation of HS on groups<br />
(fractions), having different aggregative stability in different ranges of acidity.<br />
2. Materials and Methods<br />
Sampling<br />
As object of our study were choose three virgin soils: (i) Eutric Podzoluvisol (soddy podzolic<br />
soil) from the Leningrad region; (ii) Ortic Greyzem (dark gray soil) and (iii) Haplic<br />
Chernozem (carbonate micellaric chernozem) from the Belgorod region (the State Nature<br />
Reserve “Belogor’e”). A short characterization of these soils is provided in the Table 1.<br />
Methods of soil organic matter characterization<br />
Humic substances were extracted from soil by alkaline pyrophosphate (100 mmol Na 4 P 2 O 7 +<br />
100 mmol NaOH) solution (5).<br />
<strong>Vol</strong>. 2 Page - 190 -
15th IHSS Meeting- <strong>Vol</strong>. 2<br />
Table 1: Characteristics of soil humus horizons<br />
Object<br />
pH<br />
A content of<br />
CEC, mmol(+)/ TOC,<br />
fraction<br />
H 2 O KCl /100 g of soil %<br />
< 0.01 mm, %<br />
Eutric Podzoluvisol 4.3 3.6 13.5 2.42 21.2<br />
Haplic Chernozem 6.7 6.3 41.4 3.74 41.0<br />
Ortic Greyzem 6.4 5.5 31.6 4.17 43.4<br />
Notes: CEC – cation exchange capacity, TOC – total organic carbon.<br />
A content of organic carbon in soil samples and HS solution aliquots was determined by<br />
Tyurin’s method (10).<br />
Method of separation of humic substances on aggregatively stable groups<br />
The separation of HS on groups, which distinguished by aggregative stability under certain<br />
value of pH, was conducted as follows: the solution of HS was acidified by sulfuric acid<br />
before pH~1 and then it was placed on sorbent. In this case HS were sorbed and lowmolecular<br />
components (supposedly organic acids, carbohydrates, phenols and etc.) were<br />
eluted. Whereas HS were desorbed by a lot of solution with different pH: 3, 5, 7, 9, 11 and 13,<br />
accordingly.<br />
3. Results and Discussion<br />
A series of HS fractions with different pH were obtained: the first faction (pH = 1), second<br />
faction (pH = 3), third faction (pH = 5), fourth faction (pH = 7), fifth faction (pH = 9), sixth<br />
faction (pH = 11) and seventh faction (pH = 13). These fractions (groups) were differed from<br />
each other by coloration, i.e. biochemical composition (1, 3, 4, 9), oxidation degree of organic<br />
matter and they were probably presented a continual discrete row of HS (from fulvic acids<br />
before humic acids). Results of studies are shown in the Fig. 1.<br />
<strong>Vol</strong>. 2 Page - 191 -
15th IHSS Meeting- <strong>Vol</strong>. 2<br />
60<br />
Eutric Podzoluvisol<br />
60<br />
Ortic Greyzem<br />
40<br />
40<br />
%<br />
20<br />
%<br />
20<br />
0<br />
1 3 5 7 9 11 13<br />
pH of fractions<br />
0<br />
1 3 5 7 9 11 13<br />
pH of fractions<br />
60<br />
Haplic Chernozem<br />
40<br />
%<br />
20<br />
0<br />
1 3 5 7 9 11 13<br />
pH of fractions<br />
Figure 1: Results of separation of humic substances on aggregatively stable groups<br />
In both forest soils the distribution of organic carbon in fractions was similar. The correlations<br />
between the values of optical density of HS solution, which contained 1 mg C OX per ml, and<br />
the oxidation degree of organic matter (± d) were disclosed: r = 0.71. r = 0.81 and r = 0.86 for<br />
Eutric Podzoluvisol (soddy podzolic soil), Ortic Greyzem (dark gray soil), Haplic Chernozem<br />
(carbonate micellaric chernozem), accordingly.<br />
The basis of new method of humus acids separation is surface activity of HS. Obtained<br />
experimental results are preliminary. For detection of general relationships of separation of<br />
HS extracted from different types of soils further research is required.<br />
4. Conclusions<br />
Thus, the new simple method of HS separation was worked up. The fractions (groups) of HS<br />
were differed from each other by aggregative stability under certain value of pH. These<br />
<strong>Vol</strong>. 2 Page - 192 -
15th IHSS Meeting- <strong>Vol</strong>. 2<br />
fractions were characterized by coloration, degree of oxidation and they were probably<br />
presented a continual discrete row of HS (from fulvic acids before humic acids).<br />
Acknowledgements<br />
The work was carried out by the financial support of RFBR, grant: 07-04-00308.<br />
References<br />
1. L.N. Alexandrova, Soil Organic Matter and Processes of its Transformation, Nauka, Leningrad,<br />
1980, p. 287 (in Russian).<br />
2. R.L. Cook, C. H. Langford, Understanding Humic Substances. Advanced Methods, Properties and<br />
Applications, E. A. Ghabbour and G. Davies (Eds.), Royal Society of Chemistry, Cambridge<br />
(1999) 31.<br />
3. W. Flaig, H. Beutelspacher, E. Rietz, Soil Components. Organic Components, Springler-Verlag;<br />
Berlin, Heidelberg, New York, Chapter 1 (1975) 1.<br />
4. M.M. Kononova, Soil Organic Matter: Its Role in Soil Formation and in Soil Fertility. Pergamon<br />
Press, New York, 1966, p. 544.<br />
5. M.M. Kononova, N.P. Bel’chikova. Pochvovedenie, 10 (1961) 75 (in Russian).<br />
6. V.V.Ponomareva, T.A. Plotnikova, Pochvovedenie, 7 (1967) 85 (in Russian).<br />
7. A.I. Popov, The Humic Substances: Properties, Const<strong>ru</strong>ction, Formation. E. I. Ermakov (Ed.),<br />
Saint Petersburg University Press, Saint Petersburg, 2004, p. 248 (in Russian).<br />
8. A.I. Popov, E.V. Abakumov, Book of scientific works of Saint Petersburg State Agrarian<br />
University, Saint Petersburg, 2001, 50 (in Russian).<br />
9. M. Schnitzer, Soil Organic Matter. Developments in Soil Science (No. 8), M. Schnitzer and S.U.<br />
Khan (Eds.), Ottawa, Chepter 1, 1978, 1.<br />
10. I.V. Turin, The Soil Organic Matter and its Role in Fertility, Nauka, Moscow, 1965, p. 320 (in<br />
Russian).<br />
<strong>Vol</strong>. 2 Page - 193 -
15th IHSS Meeting- <strong>Vol</strong>. 2<br />
Application of the 2D Heterospectral Correlation Spectroscopy ( 13 C NMR ×<br />
EPR) in Brazilian Soils from Reclaimed Oil Shale Mining Area<br />
Jeniffer V. dos Santos a , Antônio S. Mangrich b , Betânia F. Pereira a *, Carlos A.P. da Silveira c ,<br />
Clenio N. Pillon c , Etelvino H. Novotny d<br />
a FAPEG/Embrapa Clima Temperado, BR 392, Km 78, CEP 96001-970, Pelotas, RS, Brazil;<br />
b Universidade Federal do Paraná, Departamento de Química, Centro Politécnico, Jardim das<br />
Américas, 81531-990, Curitiba, PR, Brazil; c Embrapa Clima Temperado, BR 392, Km 78,<br />
96001-970, Pelotas, RS, Brasil; d Embrapa Solos, Rua Jardim Botânico 1024, Jardim Botânico,<br />
22460-000, Rio de Janeiro, RJ, Brazil.<br />
E-mail: betaniapereira@yahoo.com.br<br />
1. Introduction<br />
Currently, the world population is mobilized looking for methods to minimize the<br />
accumulation of wastes without stopping the industrial development. A major concern has<br />
manifested in the agriculture sector, through the reuse of wastes from agricultural and<br />
industrial activity as soil conditioners [1, 2] since the environment risks assessment caused by<br />
their use are respected and known.<br />
The soil organic matter (SOM) is considered essential in the development of soil biological<br />
activity, stabilizing the st<strong>ru</strong>cture and capturing organic and inorganic pollutants, been the<br />
main focus of several studies [3, 4]. In the SOM studies, the treatment of soil samples with<br />
solutions of HF to extract silicates and concentrate the organic material improves the quality<br />
of EPR and 13 C NMR spectra [5]. During the reaction, the F - ion is released to break links<br />
such Al-O, Fe-O and Si-O, forming soluble complexes. Residual paramagnetic metals can<br />
interfere in spectroscopic analysis, but also can serve as paramagnetic probes [6]. In this<br />
sense, methods of correlation between EPR and 13 C NMR spectral data are of great<br />
importance in the SOM study and its interaction with paramagnetic metal ions remaining in<br />
the soil samples after extraction [6].<br />
Reserves of oil shale occur in several Brazilian regions, an impressive outcrop occurs in the<br />
region of São Mateus do Sul city (PR, Brazil) where the Oil Shale Industrialization Unit from<br />
PETROBRAS / SIX is located. The recovery of the degraded areas after the oil shale mining<br />
is made arranging the mining by-products in a systematical form, followed by the recovering<br />
of the area with clay and soil. This recovery soil relief process has being made for more than<br />
30 years [7].<br />
<strong>Vol</strong>. 2 Page - 194 -
15th IHSS Meeting- <strong>Vol</strong>. 2<br />
In this sense, the objective of this work was to study the nature of interactions between<br />
inorganic and organic st<strong>ru</strong>ctures of the SOM from Brazilian oil shale mining reclaimed soils<br />
through the 2D heterospectral correlation spectroscopy ( 13 C NMR × EPR).<br />
2. Materials and Methods<br />
The studied samples were collected at different depths from the soil profile in the Petrobras<br />
mining area, city of São Mateus do Sul (PR), Brazil. It was collected six samples from the<br />
mining reclaimed area and five samples from a native forest as reference soil samples.<br />
For the study of SOM and its interaction with the paramagnetic metal ions, the treatment of<br />
the soil samples with 10% HF solution to extract silica composts and concentrate the organic<br />
material was applied [5]. After this HF treatment that improves the quality of the spectra, the<br />
EPR and 13 C NMR analysis were performed. The EPR spectra were recorded at room<br />
temperature (~ 300 K) and liquid N 2 (77 K), in a B<strong>ru</strong>ker EMX micro spectrometer operating<br />
at X-band (9.5 GHz), using 100 kHz of modulation frequency.<br />
For the 13 C NMR spectra it was carried out experiments of Cross Polarization with Magic<br />
Angle Spinning (CPMAS), using the Variable Amplitude Cross Polarization (VACP)<br />
technique. It was used the Total Spinning Sidebands Suppression (TOSS) technique of four<br />
pulses to eliminate the rotational sidebands. The experiments of Chemical Shift Anisotropy<br />
(CSA) filter and quantification of aromatic st<strong>ru</strong>ctures were performed using a five-pulse CSA<br />
dephasing filter, and four-pulse TOSS [8].<br />
The EPR and 13 C NMR spectra analysis were correlated using 2D heterospectral correlation,<br />
which provides information about the interaction between organic groups and paramagnetic<br />
ions of SOM.<br />
3. Results and Discussion<br />
In the EPR spectra it was observed: a) signals of rhombic Fe 3+ (g ~ 4.3 and 8.9); b) broad line<br />
attributed to associated Fe 3+ ions (concentrated domains) in g ~ 2.0 and c) narrow line<br />
attributed to the organic free radicals (OFR) in g ~ 2.0) [9]. Because the soils are classified as<br />
Oxisoil type, hence the presence of intense signal of Fe 3+ ions.<br />
By the 13 C NMR spectra, evidence of typical SOM chemical groups was observed as: alkyl,<br />
N-alkyl (aminoacids) and methoxyl (lignin), O-alkyl and di-O-alkyl (cellulose), aryl, O-aryl,<br />
carboxyl and amide [6,8]. In the samples of reclaimed areas, especially those collected at<br />
deeper layers, there was a predominance of hydrophobic groups (alkyl and aryl), probably<br />
<strong>Vol</strong>. 2 Page - 195 -
15th IHSS Meeting- <strong>Vol</strong>. 2<br />
from fossil organic matter. These samples are composed specially by oil shale by-products.<br />
During this restoration process, soil and oil shale by-products can be in contact among others,<br />
which may explain the presence of fossil organic matter in the soils collected in the deeper<br />
reclaimed area.<br />
Correlating the two techniques, EPR and 13 C NMR, (Fig. 1), it was obtained: a) positive<br />
correlation between hydrophilic groups (mainly uronic acids) and associated Fe 3+ ions in<br />
rhombic st<strong>ru</strong>ctures, and b) negative correlation of the same hydrophilic groups with the OFR<br />
signal, indicating the involvement of these hydrophilic groups in the complex formation of<br />
Fe 3+ ions which probably lead to the suppression of the OFR signs [6,8]. Alternatively, the<br />
lower content of OFR and higher content of hydrophilic compounds may be associated to a<br />
more labile SOM (less humified).<br />
The data correlating in the OFR region (ΔB = 5 mT) showed at least two different<br />
paramagnetic species: a) the spin density is probably located upon O atoms (g = 2.0042) and,<br />
b) the density is probably upon C atoms (g = 2.0029). The specie with higher g was<br />
negatively correlated with hydrophilic groups (higher content of Fe 3+ ), reinforcing the<br />
hypothesis of paramagnetic suppression [6, 8].<br />
0.8<br />
0.6<br />
0.4<br />
0.2<br />
0.0<br />
-0.2<br />
-0.4<br />
-0.6<br />
-0.8<br />
-1.000<br />
-0.7500<br />
-0.5000<br />
-0.2500<br />
0<br />
0.2500<br />
0.5000<br />
0.7500<br />
1.000<br />
180 160 140 120 100 80 60 40 20 0<br />
0.8<br />
0.6<br />
0.4<br />
0.2<br />
0.0<br />
-0.2<br />
-0.4<br />
-0.6<br />
-0.8<br />
2000<br />
2000<br />
1800<br />
1800<br />
1600<br />
1400<br />
1200<br />
1000<br />
800<br />
600<br />
400<br />
EPR (point), ΔB = 500 mT<br />
1600<br />
1400<br />
1200<br />
1000<br />
800<br />
600<br />
400<br />
2.0<br />
4.3<br />
200<br />
200<br />
8.9<br />
180 160 140 120 100 80 60 40 20 0<br />
13<br />
C Chemical Shift (ppm)<br />
Figure 1: Correlation between the data of EPR and 13 C NMR spectra of the soil samples<br />
<strong>Vol</strong>. 2 Page - 196 -
15th IHSS Meeting- <strong>Vol</strong>. 2<br />
4. Conclusion<br />
It was observed that the soils from the native area were composed specially of more labile<br />
SOM st<strong>ru</strong>ctures, probably related to the degradation of plant st<strong>ru</strong>ctures. And the soils from the<br />
reclaimed area showed st<strong>ru</strong>ctures probably related to the fossilized organic matter. The<br />
hydrophobic aromatic st<strong>ru</strong>ctures were positively correlated with the OFR associated with C<br />
atoms. The OFR signal associated with O atoms was correlated inversely with the<br />
concentration of Fe 3+ ions and with hydrophilic organic st<strong>ru</strong>ctures, indicating the involvement<br />
of these hydrophilic st<strong>ru</strong>ctures in the formation of complexes with these metal ions. This<br />
suggests the suppression of the OFR signal by paramagnetic ions.<br />
Acknowledgements<br />
DQ/UFPR, FAPEG/ Embrapa/Petrobras, FINEP, CNPq, Brazil.<br />
References<br />
1. M.E. Winter Sydnor and E.F. Redente. J. Environ. Qual., 31 (2002), 1528 – 1537.<br />
2. M. Pietrzykowski and W. Krzaklewski. Ecol. Engineer., 30 (2007), 341 – 348.<br />
3. A. Segnini, L.M. Dos Santos, W.T.L. Da Silva, L. Martin-Neto, C.E. Borato, W.J. De Melo, D.<br />
Bolonhezi, D. Química Nova, 31:1 (2008), 94 – 97.<br />
4. D.A.N. Ussiri and C.E Johnson. Forest Ecol.Manage., 240 (2007), 131 – 142.<br />
5. D.P. Dick, C.N. Gonçalves, R.S.D. Dalmolin, H. Knicker, E. Klamt, I. Kögel-Knaber, M.L.<br />
Simões, L. Martin-Neto. Geoderma, 124 (2005), 319.<br />
6. E.H. Novotny, H. Knicker, L. Martin-Neto, R.B.V. Azeredo, M.H.B. Hayes. Eur. J. Soil Sci., 59<br />
(2008), 439.<br />
7. H.S.N. Rodrigues, J. Skalski Jr., L.F. Sosinski. 10° Prêmio de Excelência da Indústria Minero-<br />
Metalúrgica Brasileira. Revista Minérios & Minerales (on-line), 303 (2008).<br />
8. E.N. Novotny, M.H.B. Hayes, E.R. De Azevedo, T.J. Bonagamba. Naturwissenschaften, 93<br />
(2006), 447.<br />
9. A.S. Mangrich. Thesis (Inorganic Chemistry), Universidade Federal do Rio de Janeiro, Rio de<br />
Janeiro. 1983.<br />
<strong>Vol</strong>. 2 Page - 197 -
15th IHSS Meeting- <strong>Vol</strong>. 2<br />
Soil Organic Matter Characterization by Modified Rock-Eval Pyrolysis in a<br />
Calcic Chernozem Profile<br />
Tünde Nyilas a* , Imre Czinkota b<br />
a Department of Mineralogy, Geochemistry and Petrology, University of Szeged, H-6701<br />
Szeged, PO.Box 651., Hungary; b Department of Soil Science and Agrochemistry, Szent<br />
István University, 2103 Gödöllő, Páter K. str. 1., Hungary<br />
E-mail: nyilas@gmail.com<br />
1. Introduction<br />
Soil organic matter is not homogenous but is a mixture of many organic matters with different<br />
chemical compositions and physical qualities. This chemically and kinetically heterogeneous<br />
material comprises a mixture of plant and microbial residues of various compositions and with<br />
different decomposition rates, as well as their transformation products, in addition to refractory,<br />
long-residence-time macromolecular organic substances (kerogen, black carbon). Humification of<br />
biopolymers is determined by those environmental parameters (relief, climatic conditions), which<br />
define soil types too.<br />
Rock-Eval pyrolysis was designed for petroleum exploration to determine the type and quality<br />
of organic matter in rock samples. Nevertheless, this technique can be used for bulk<br />
characterization of the immature organic matter in soil samples [1] and recent sediments [2].<br />
Deconvolution of Rock-Eval pyrograms gives information about organic matter fractions with<br />
different thermal stability [3, 4].<br />
Aim of our work was to examine soil organic matter conditions of a Calcic Chernozem profile<br />
and to certify Rock-Eval pyrolysis is usable method for determination soil horizons,<br />
supplements the routine classical measurement techniques.<br />
2. Materials and Methods<br />
Samples were collected from a Calcic Chernozem profile (Józsefmajor Demonstration Farm,<br />
Szent István University, North-Plain, Hungary). Diagnostic horizons are Mollic, Calcic and<br />
Cambic. Chemical parameters show classical Chernozem horizons (Table 1).<br />
The Rock-Eval data of the soil samples were determined with Delsi Oil Show Analyzer:<br />
heating at 180 o C for 3 min, programmed pyrolysis at 25 o C/min up to 600 o C under helium<br />
flow and oxidation at 600 o C for 7 min under an air flow [4]. The following parameters can be<br />
obtained from one single measurement: S2 the current potential of a rock sample, represents<br />
the total amount of oil and gas a source rock can still produce during subsequent complete<br />
<strong>Vol</strong>. 2 Page - 198 -
15th IHSS Meeting- <strong>Vol</strong>. 2<br />
thermal maturation in an open system (expressed in mg HC/g of rock). Total organic carbon<br />
(TOC) content (expressed in weight %) is defined as the sum of the pyrolysed organic carbon<br />
content and organic carbon residue content. Hydrogen index (HI) is defined as carbon<br />
normalized S2 and expressed in mg HC/gTOC.<br />
Soil<br />
genetic<br />
horizon<br />
Depth<br />
Table 1: Chemical parameters of examined soil profile [5]<br />
pH<br />
Organic<br />
carbon<br />
CaCO 3<br />
CEC<br />
Base<br />
saturation<br />
Silt % Clay %<br />
<strong>Vol</strong>ume<br />
weight<br />
Szint (cm) H 2 O (%) (%) cmol c /kg % 2–0.05 mm
15th IHSS Meeting- <strong>Vol</strong>. 2<br />
3. Results and Discussion<br />
Changes are shown by vertical profiles of bulk Rock-Eval details (TOC, HI), in the relative<br />
contribution of the bio- and geo-macromolecules (F1; F2; F3; F4) and by their derivable details<br />
(C I ; C I /TOC; R; I) in different fractions of soil organic matter (Fig. 2).<br />
Figure 2: Vertical profile of labile biological constituents (F1), resistant biological constituents (F2),<br />
immature non-biotic constituents (F3), mature refractory fraction (F4), relative evolution of the two “bio-<br />
classes (R ratio), quantify the degradation of immature organic matter (I index), Total<br />
macromolecule”<br />
Organic Carbon (TOC), inert carbon (C I ), C I /TOC ratio and Hidrogen Index (HI)<br />
<strong>Vol</strong>. 2 Page - 200 -
15th IHSS Meeting- <strong>Vol</strong>. 2<br />
Figure 3 Functionalities of the four constituents<br />
There is a border-line in depth 50–60 cm. We can obtain detailed information about profile<br />
with relationship between (a) stabile bio-macromolecules (F2) and immature geomacromolecules<br />
(F3); (b) labile bio-macromolecules (F1) and refractory geo-macromolecules<br />
(F4); (c) relationship between components F1, F2, F3 and (d) F1+F2, F3 and F4 components<br />
(Fig. 3). According to ones three zones can be well separated. Consequently the horizons<br />
prognosticated by pedological description are identifiable from Rock-Eval details as well.<br />
4. Conclusions<br />
Rock-Eval pirolysis proved to be suitable for efficient examination of soil organic matter and<br />
estimation the measurement of humification. Further advantages, slight sample need to<br />
measure (0.1 g), doesn’t require preparation, fast measure (25 min.), and we can detect many<br />
parameters from one single measurement (e.g. S2, TOC, HI) which we can use perfectly in<br />
evaluations. We can escape the lengthy and many chemicals requiring laboratory separates.<br />
Rock-Eval pyrolysis is useable method for determination for determination soil horizons,<br />
supplements the routine classical measurement techniques. The method gives us excessinformations<br />
compared to traditional organic matter measure. Accordingly Rock-Eval<br />
pyrolysis is capable define parameters, which help determination of unknown paleosoil type<br />
and allow identify minor occurrences within genetical horizons.<br />
Acknowledgements<br />
This work was funded by the Hungarian National Science Foundation (OTKA) through Grant<br />
K 81181.<br />
References<br />
1. Di Giovanni C., Disnar J. R., Bichet V., Campy M., Guillet B., Earth Surf. Proc. Landforms, 23<br />
(1998) 1057–1069.<br />
2. Sanei H., Stasiuk L. D., Goodarzi F., Org. Geochem., <strong>Vol</strong>. 36,/8 (2005) 1190–1203.<br />
3. Disnar, J.R., Guillet, B., Keravis, D., Di-Giovanni, C., Sebag D., Org. Geochem. , <strong>Vol</strong>. 34, (2003)<br />
327–343.<br />
4. M. Hetényi, T. Nyilas and T. M-Tóth, J. Anal. Appl. Pyrolysis, 74 (2005) 45–54.<br />
5. Szegi T., Michéli E., Gál A., Tombácz E., Agrokémia és Talajtan 53, 1–2 p (2004) 239–250.<br />
6. D. Sebag, J.R.Disnar, B.Guillet, C. Di Giovanni, E.P Verrechia and A. Durand, Eur J. Soil Sci., 57<br />
(2006) 344–355.<br />
<strong>Vol</strong>. 2 Page - 201 -
15th IHSS Meeting- <strong>Vol</strong>. 2<br />
Determination of Organic Matter Humification by Laser Induced<br />
Breakdown Spectrometry and Artificial Neural Network<br />
Edilene C. Ferreira a* , Débora M.B.P. Milori a , Ednaldo J. Ferreira a , Ladislau Martin-Neto b<br />
a Embrapa Agricultural Inst<strong>ru</strong>mentation, Rua XV de novembro, 1452, CEP 13560-970, São<br />
Carlos-SP, Brazil; b Embrapa/Labex - USDA/ARS/OIRP - 5601 Sunnyside Ave Room 4.1193-<br />
Beltsville, MD 20705-5141 - USA<br />
E-mail: edilene@cnpdia.embrapa.br<br />
1. Introduction<br />
The humic substances are the largest reservoir of organic carbon in soil. The carbon that<br />
makes up the humic substances can be degraded by the action of different factors, including<br />
the practices of soil management. Moreover, the incorporation of carbon in the humic<br />
substance constitutes an important soil property, which can contribute significantly to reduce<br />
atmospheric CO 2 (a gas causing the greenhouse effect) [1]. Accordingly is highlighted the<br />
importance of determining the stability of the humic substances.<br />
Nowadays, Laser-Induced Fluorescence (LIF) can be applied to evaluate the humification of<br />
organic matter in whole soil [2]. In this method, the area of the LIF spect<strong>ru</strong>m of each soil<br />
sample is divided by the corresponding carbon concentration and then a normalized<br />
fluorescence signal is obtained, which is considered being the index of soil organic matter<br />
humification (H LIF ). However LIF is a clean and simple method, the determination of H Fil<br />
depends on another analytical technique able to determine the total carbon.<br />
Laser Induced Breakdown Spectroscopy (LIBS) is spectroscopy technique that has shown<br />
great potential for elemental determination and also has found application for organic<br />
compounds. This technique is based on the observation of the radiation emitted by atoms, ions<br />
and molecular species from a microplasma, which is generated by a laser pulse [3]. In a LIBS<br />
spect<strong>ru</strong>m, the identification of the species is based on the wavelength of emission, which is<br />
characteristic for each element, and the number of species can be determined by the intensity<br />
of the emission signals [4]. The current LIBS potential to perform in situ analysis is<br />
enthusiastic. The technique presents features such as the possibility of elemental direct<br />
analysis, rapid and simultaneous.<br />
In the present study LIBS potential was evaluated to determinate the organic matter<br />
humification in whole soil.<br />
<strong>Vol</strong>. 2 Page - 202 -
15th IHSS Meeting- <strong>Vol</strong>. 2<br />
2. Materials and Methods<br />
A set of samples was constituted by thirty six samples from Brazilian Cerrado region<br />
(Argisoil). The samples were collected in six depths (0–10 cm, 10–20 cm, 20–40 cm, 40–60<br />
cm, 60–80 cm and 80–100 cm) from an experimental area submitted to six distinct treatments:<br />
without irrigation and fertilization, irrigation with treated sewage effluent and without<br />
nitrogen fertilization, irrigation with treated sewage effluent and fertilization with 171.6 kg<br />
ha -1 year -1 of nitrogen, irrigation with treated sewage effluent and fertilization with 343.2 kg ha -1<br />
year -1 of nitrogen, irrigation with treated sewage effluent and fertilization with 520 kg ha -1 year -1 of<br />
nitrogen and irrigation with water consumption and fertilization with 520 kg ha -1 year -1 of<br />
nitrogen.After collection the samples were transported to the laboratory, where a manual<br />
cleaning procedure was carried out to remove parts of roots and leaves. Then, the samples<br />
were submitted to a process of cryogenic grinding to reduce heterogeneity and three pellets of<br />
each sample were prepared by applying 15 ton of pressure during three minutes. The LIBS<br />
spectra of pellets were captured by using the system model LIBS2500, from Ocean Optics.<br />
Twenty spectra were captured from different regions of each pellet, being each spect<strong>ru</strong>m<br />
corresponding to two accumulated laser pulses. A previous laser pulse was always used to<br />
clean the pellets surface, before capturing a spect<strong>ru</strong>m. The average of spectra was obtained<br />
after individual spect<strong>ru</strong>m offset correction.<br />
Aiming to correlate the LIBS spectra with the index of soil organic matter humification<br />
(H LIF ), LIF was used as reference method [2]. For LIF measurements it was used a portable<br />
LIF system, developed at Embrapa Agricultural Inst<strong>ru</strong>mentation (a Brazilian research center).<br />
Three LIF spectra were obtained for each sample and the ratio between the areas above<br />
spectra and the total carbon were calculated. The total carbon content in the samples was<br />
previously determined by the method of dry combustion using a Total Organic Carbon (TOC)<br />
from Shimadzu, model TOC-V. The average of three measurements of each sample was<br />
performed.<br />
Multilayer Perceptron (MLP), a kind of artificial neural network, was used to calibrate and<br />
validate the proposed LIBS method. The selected variables from LIBS spectra for MLP<br />
training were the following emission lines and ratios between them: Ni, Co, Mn, Mg, Al, C/H,<br />
C/O, N/H, S/O, N/O, P/O, H/O, C/N, C/P, N/S, H/(PO), Ca/O.<br />
The Weka system (Waikato Environment for Knowledge Analysis) version 3.5.7 was used for<br />
MLP training and validation. The strategy of cross validation in ten folds was used.<br />
<strong>Vol</strong>. 2 Page - 203 -
15th IHSS Meeting- <strong>Vol</strong>. 2<br />
3. Results and Discussion<br />
The selection of LIBS variables to be used for calibration was performed based on factors<br />
controlling humification and mineralization of soil organic matter [5]. The selected emission<br />
lines and ratios between some interesting emission lines were experimented to training the<br />
calibration system, built with a MLP. To MLP training it was used the Back-Propagation<br />
algorithm and the combinations among Back-Propagation parameters were: training time =<br />
500, momentum= 0.2 and learning rate= 0.3.<br />
In Fig. 1 are showed the results obtained by the correlation among the LIF reference values<br />
and LIBS predicted values. The Pearson’s correlation coefficient was 0.9, indicating good<br />
agreement between the organic matter humification determined by LIF and that obtained by<br />
the proposed LIBS method, even though the relative absolute error.<br />
1000<br />
800<br />
600<br />
400<br />
200<br />
200 400 600 800 1000<br />
H LIF<br />
Figure 1: Correlation between the results of organic matter humification determined by LIF reference<br />
method and LIBS proposed method<br />
This preliminary result seems to be very promising, since LIBS dispenses the use o another<br />
technique for carbon determination. However, future efforts will be spent for improvement of<br />
prediction and minimization of errors. These efforts could bring important contribution for<br />
soil analysis, since with a single LIBS spect<strong>ru</strong>m many other analytical demands for soil can<br />
be satisfied, such as determination of contaminants, nutrients and carbon concentration.<br />
4. Conclusions<br />
A new method using LIBS and MLP is proposed to determinate organic matter humification.<br />
The results obtained showed 90% of correlation between LIF reference method and LIBS<br />
proposed method. The results are promising due to the LIBS potential to determine organic<br />
matter humification dispensing carbon determination. Moreover a single LIBS spect<strong>ru</strong>m can<br />
be used to determine other elements in soil.<br />
<strong>Vol</strong>. 2 Page - 204 -
15th IHSS Meeting- <strong>Vol</strong>. 2<br />
Acknowledgements<br />
The authors thank Fundação de Amparo a Pesquisa do Estado de São Paulo (FAPESP) for<br />
financial support and fellowship.<br />
References<br />
1. D.M.B.P. Milori, C. Bayer, V.S. Bagnato, J. Mielniczuk, and L. Martin-Neto, Soil Science 167<br />
(2002) 739.<br />
2. D.M.B.P. Milori, H.V.A. Galeti, L. Martin-Neto, J. Dieckow, M. González-Pérez, C. Bayer and J.<br />
Salton, Soil Sci. Soc. Am. J. 70 (2006) 57.<br />
3. C. Pasquini, J. Cortez, L.M.C. Silva and F.B. Gonzaga, J. Braz. Chem. Soc. 18 (2007) 463.<br />
4. F. Ferioli and S.G.Buckley, Combust. Flame 144 (2006) 435.<br />
5. W. Zech, N. Senesi, G. Guggenberger, K. Kaiser, J. Lehmann, T.M. Miano, A. Miltner and G.<br />
Schroth, Geoderma 79 (1997) 117.<br />
<strong>Vol</strong>. 2 Page - 205 -
15th IHSS Meeting- <strong>Vol</strong>. 2<br />
Dynamics of Soil Organic Matter Degradation Studied by Low<br />
Temperature Ashing Coupled to DRIFT-FTIR Spectroscopy<br />
Piedra Buena, A. a *, Pucci, A. b , Tinoco, P. a , Almendros, G. a , D’Acqui, L. P. b<br />
a Centro de Ciencias Medioambientales-CSIC, Serrano 115B 28006 Madrid, Spain; b Istituto<br />
per lo Studio degli Ecosistemi-CNR, via Madonna del Piano 10, Sesto Fiorentino, Italia<br />
E-mail: soilmanage@gmail.com<br />
1. Introduction<br />
Characterization of soil organic matter (SOM) is usually carried out by methods involving the<br />
use of dis<strong>ru</strong>ptive techniques such as extraction, fractionation and purification of the organic<br />
substances [1]. Since these methods destroy soil aggregates, it is very difficult to assess the<br />
relationships between SOM and st<strong>ru</strong>cture [2]. It has been suggested that SOM degradation is<br />
closely related to soil aggregate stability, which plays a key role both in the access of SOM by<br />
decomposer microorganisms and in the diffusion of hydrolytic enzymes. Thus, soil aggregates<br />
would be exerting a protective function on SOM, leading to physical preservation of<br />
encapsulated particulate fractions. In the last few years, the technique of Low Temperature<br />
Ashing (LTA) has been proposed by several authors to analyze the physical speciation<br />
patterns of SOM [3–5], therefore allowing to study its dynamics and protection mechanisms.<br />
In this work, undisturbed soil aggregates were subjected to increasing times of LTA<br />
application. The objective was assessing the potential of this technique combined with<br />
elemental analysis and diffuse reflectance infrared Fourier transform spectroscopy (DRIFT-<br />
FTIR) in the appraisal of SOM st<strong>ru</strong>ctural features related to its physical speciation patterns.<br />
2. Materials and Methods<br />
2.1. Experimental design. Soil samples representative of the seminatural and final status of six<br />
forest ecosystems from the mountain area of Madrid (Spain) were studied. The samples were<br />
labeled as: C1, evergreen oak forest (Quercus ilex); C2, the cleared evergreen oak forest, used<br />
for cereal cultivation; B3, evergreen oak forest (Q. ilex); B4, the degraded evergreen oak<br />
forest, with bush vegetation (Cistus ladanifer); R1, evergreen oak forest (Q. ilex), and R2, the<br />
cleared evergreen oak forest, reforested with pine (Pinus pinea).<br />
2.2. Low Temperature Ashing. The soil samples were gently sieved to obtain undisturbed<br />
aggregates (0.5–1.0 mm size) and LTA was applied for 1, 5 and 24 h using an apparatus<br />
assembled according to D’Acqui et al. [6]. The aggregates were placed in a 2-L quartz glass<br />
reactor, which was evacuated to -0.1 kPa. A radiofrequency (RF) generator (13.56 MHz<br />
<strong>Vol</strong>. 2 Page - 206 -
15th IHSS Meeting- <strong>Vol</strong>. 2<br />
Advance Energy) was used to supply power to the external electrode, and RF glow discharges<br />
were applied in the reactor. The power input of the RF level was set to 100 W with a reflected<br />
power maximum of 5 W. The oxygen flow rate in the asher was 20 mL min -1 .<br />
2.2. Analytical methods. The soil samples were grinded to
15th IHSS Meeting- <strong>Vol</strong>. 2<br />
The soil under bush vegetation (B4) showed a<br />
similar behavior, with higher C/N ratio (17.2)<br />
compared to the seminatural soil under oak forest<br />
(12.1). The reduced humification degree of SOM in<br />
this degraded ecosystem seems to be partly related to<br />
the effect of the secondary b<strong>ru</strong>shwood vegetation on<br />
the performance of the biogeochemical cycle. This is<br />
also suggested by the greater depletion of C and N in<br />
B4 (-40.4%C, -51.9%N) compared to B3 (-37.2%C,<br />
-36.5%N) after 1 h LTA, probably indicating more<br />
readily degradable plant organic matter in B4.<br />
In the case of the soil under cereal crop (C2), the<br />
SOM showed to be highly resistant to LTA<br />
degradation, as could correspond to enhanced<br />
biodecomposition and humification induced by<br />
mechanical tillage. Carbon depletion was similar in<br />
C1 and C2 (-61.3 and -65.1%, respectively), but N<br />
depletion was higher in C1 (-60.8 %N vs. -31.2%N<br />
in C2) after 24 h LTA. The reduced C/N ratio of C2<br />
compared to C1 (-1.9) suggests that formation of<br />
organo-mineral complexes is favored in these calcic<br />
Figure 2: Infrared spectra of soils soils, leading to increased recalcitrance of SOM.<br />
subjected to 0, 1, 5 and 24 h of LTA.<br />
The progressive treatment times are The correlation between the intensity of the<br />
presented for each soil series from top to<br />
diagnostic peak at 2920 cm -1 in the DRIFT spectra<br />
bottom. Labels refer to Fig. 1<br />
and the content of C determined by elemental<br />
analysis (Fig. 3a) was quite significant (r 2 = 0.63), suggesting that this band could be used for<br />
forecasting SOM content. However, this correlation varied for the different soils: 0.85 for C1-<br />
C2, 0.83 for R1-R2, and 0.65 for B1-B2. The correlation between N content and the intensity<br />
of the band at 1650 cm -1 (Fig. 3b) was in general not significant (r 2 = 0.089), showing limited<br />
use for predicting N forms. Nevertheless, in some of the studied soils this correlation was<br />
good: 0.70 for C1-C2, and 0.90 for R1-R2.<br />
<strong>Vol</strong>. 2 Page - 208 -
15th IHSS Meeting- <strong>Vol</strong>. 2<br />
100<br />
100<br />
Peak intensity at 2920 cm -1<br />
R2= 0.6294<br />
Peak intensity at 1650 cm-1<br />
R 2 = 0.0892<br />
0<br />
0.0 2.0 4.0 6.0 8.0<br />
% C<br />
0<br />
0.0 0.1 0.2 0.3 0.4 0.5<br />
% N<br />
Figure 3. Correlations between the intensities of the diagnostic bands in the IR spectra (at 2920 cm -1 for C<br />
and at 1650 cm -1 for N), and the content of C and N determined by elemental analysis.<br />
4. Conclusions<br />
The combined application of analytical and spectroscopic methods showed to be useful for the<br />
study of the humification degree of SOM and the protection mechanisms involved in SOM<br />
resistance against degradation. The kinetics and depletion ratio of C and N throughout<br />
progressive LTA application was considered to be inversely related to SOM humification<br />
degree. This could be explained either by SOM origin (vegetation type) or by SOM interactions<br />
with the soil mineral constituents, although these factors are not exclusive one to each other.<br />
The intensity of diagnostic bands in the DRIFT spectra can be used to predict C and N contents<br />
in SOM. However, their correlations are highly dependent on the soil type, and thus calibration<br />
should be performed for each soil.<br />
Acknowledgements<br />
Dr. A. Piedra Buena post-doctoral position at the CCMA-CSIC (I3P Program) was supported<br />
by the European Social Fund. Her post-doctoral stay at the ISE-CNR was funded by a José<br />
Castillejo grant (Ministry of Science and Innovation, Spain).<br />
References<br />
1. F. J. Stevenson, in F. J. Stevenson (Ed.) <strong>Humus</strong> Chemistry. Genesis, Composition, Reactions, Wiley,<br />
1982, pp. 26–53.<br />
2. M. Schnitzer, in A.L. Page, R. H. Miller, D. R. Keeney (Eds.) Methods of Soil Analysis: Part. 2.<br />
Chemical and Microbiological Properties, 2nd edn., Agronomy 9 ASA, SSSA, Madison, WI, 1982,<br />
pp. 581–594.<br />
3. J. M. Marcoen and J. M. Delecour, Pedologie 26 (1976), 5–14.<br />
4. L. A. Sullivan and A. J. Koppi, Geoderma 40 (1987), 317–332.<br />
5. L. P. D'Acqui, C.A. Santi, E. Sparvoli, J. G. Churchman and G. G. Ristori, 1998. Proc. World<br />
Congr. Soil Sci. Int. Soil Soc., Montpellier, 1988 (CD).<br />
6. L.P. D'Acqui, G.J. Churchman, L.J. Janik, G.G. Ristori and D.A Weissmann, Geoderma 93 (1999),<br />
311–324.<br />
<strong>Vol</strong>. 2 Page - 209 -
15th IHSS Meeting- <strong>Vol</strong>. 2<br />
Humic Matter as a Conceptual Mixture of Model Compounds: an<br />
Application of the Molecular Mixing Model to Humic Acids From a<br />
Mediterranean Semiarid Wetland (Las Tablas de Daimiel, Central Spain)<br />
Rodríguez-Murillo, J.C. a* , Almendros, G. a , Knicker, H. b<br />
a Centro de Ciencias Medioambientales, CSIC, Serrano 115B, 28006-Madrid, Spain;<br />
b Instituto de Recursos Naturales y Agrobiología, CSIC, P.O. Box 1052, 41080-Seville, Spain.<br />
E-mail: jcmurillo@ccma.csic.es<br />
1. Introduction<br />
Molecular mixing model (MMM) represents a practical, empirical approach proposed by<br />
Nelson [1], and further developed by Nelson and Baldock [2] in an attempt to describe the<br />
molecular composition of natural organic matter from quantitative data based on the different<br />
carbon types determined by 13 C-NMR spectroscopy. These authors have shown that detrital<br />
organic matter, either terrestrial or aquatic, coming from different sources, could be described<br />
in terms of up to six generic organic components (carbohydrate, protein, lignin, lipid, “pure<br />
carbonyl”, and char), assuming that the experimental spectra of the organic matter could be<br />
reproduced from a linear combination of spectra of these six generic organic components. In<br />
the present work, we apply the MMM to pure humic acids (HAs) isolated from the sediments<br />
of the Mediterranean semiarid wetland (Las Tablas de Daimiel, Central Spain) to check<br />
whether their molecular composition may be successfully expressed as a mixture of<br />
biomacromolecules.<br />
2. Materials and Methods<br />
Eighteen samples of surface soil and/or sediments from Las Tablas de Daimiel, corresponding<br />
to different local environments in the wetland, were collected, and the HAs extracted<br />
following standard procedures. The elementary composition (C, H, N) was determined with a<br />
Perkin-Elmer 2400 Series 2 CNHS/O elemental analyzer; O content was calculated as the<br />
difference. The IR and visible spectra were also recorded. The solid-state CPMAS NMR 13 C<br />
spectra of the HAs were acquired with a spectrometer B<strong>ru</strong>ker MSL 100, and spectral areas of<br />
the seven regions described in Table 1 were measured as percentages of the total 13 C- NMR<br />
signal.<br />
3. Results and Discussion<br />
Signal intensities for the six components in the seven 13 C NMR spectral ranges have been<br />
defined from Baldock et al. [3] for soil ecosystems. These authors also supplied the elemental<br />
<strong>Vol</strong>. 2 Page - 210 -
15th IHSS Meeting- <strong>Vol</strong>. 2<br />
atomic ratios (normalized against C) H/C, N/C and O/C ratios for the six organic components.<br />
Using these data and the measured areas in the NMR spectra, we have obtained the HA<br />
compositions in terms of the six generic biomacromolecules by solving a system of equations<br />
for each sample using the Generalized Reduced Gradient nonlinear optimization code in the<br />
Solver add-in of Microsoft Excel with two restrictions: i) the sum of component fractions<br />
must be 100, ii) the component fractions must be equal or greater than zero (Fig. 1).<br />
Table 1: Spectral regions used for the MMM model<br />
Spectral region<br />
Chemical shift<br />
“Carbonyl”<br />
210–165 ppm<br />
O-aromatic<br />
165–145 ppm<br />
Aromatic<br />
145–110 ppm<br />
O 2 -alkyl<br />
110–95 ppm<br />
O-alkyl<br />
95–60 ppm<br />
N-alkyl/methoxy<br />
60–45 ppm<br />
Alkyl<br />
45–0 ppm<br />
Figure 1: Humic acid composition, as calculated with the MMM. Samples are ordered from higher<br />
aromaticity (top) to lower aromaticity<br />
<strong>Vol</strong>. 2 Page - 211 -
15th IHSS Meeting- <strong>Vol</strong>. 2<br />
In order to assess the performance of the MMM in this case, the errors of predicted spectral<br />
areas were evaluated for each spectral zone in each sample. The biggest errors (about 30% of<br />
measured vs experimental area, mean of all samples) are recorded in the O 2 -alkyl region (95–<br />
110 ppm) in all the samples. For each sample, the sum of absolute values of the differences<br />
between the measured and the calculated signal intensities for all seven spectral ranges are<br />
represented in Fig. 2.<br />
Figure 2: Total error for each sample (horizontal figures) of calculated spectral areas compared to<br />
experimental spectral areas<br />
An additional assessment of model performance is to compare predicted and experimental<br />
H/C ratios. A good correlation between MMM calculated and experimental H/C ratios is<br />
obtained but there is a bias; estimated H/C ratios are bigger than measured H/C ratios (Fig. 3).<br />
4. Conclusions<br />
The composition of the AHs from Las Tablas de Daimiel wetland could be approximated by a<br />
mixture of biomacromolecules. One of the advantages of this approach over the<br />
straightforward use of 13 C-NMR signal areas, in addition to the indirect, semiquantitative<br />
identification and determination of compounds of interest, like char, is the improved analysis<br />
of the origin of HAs from different precursor macromolecular entities. Incomplete<br />
concordance between experimental and simulated spectra might be attributed to experimental<br />
errors in 13 C-NMR spectra of HAs, but giving the better concordance obtained in many cases<br />
using natural organic materials [2, 4] instead of HAs, the occurrence in HAs of specific<br />
chemical st<strong>ru</strong>ctures with special 13 C-NMR signatures could be an important factor explaining<br />
<strong>Vol</strong>. 2 Page - 212 -
15th IHSS Meeting- <strong>Vol</strong>. 2<br />
Figure 3: Correlation between predicted and<br />
experimental and H/C ratios in HAs from Tablas de<br />
Daimiel wetland<br />
discrepancies. Spectral ranges with<br />
particularly poor reproducibility may<br />
also add to this variance.<br />
The six organic components of HAs are<br />
widespread in the wetland, but clear<br />
differences are evident between HAs.<br />
Whereas st<strong>ru</strong>ctural components as<br />
carbohydrate, protein, and lipid<br />
dominate HA composition across the<br />
wetland, variable quantities of lignin<br />
and char are also present in all HA.<br />
Presently, we are trying to use this<br />
wealth of st<strong>ru</strong>ctural information to characterize the wetland sedimentary organic matter,<br />
identifying the origin and humification paths experimented by detrital organic matter in Las<br />
Tablas de Daimiel.<br />
Acknowledgements<br />
We are indebted to the management and staff of Tablas de Daimiel National Park, to our<br />
colleagues of CCMA (M.J. Llorente, R. Rey, L. Parrilla, J.L. Ayala, and the Analytical<br />
Service) and to Organismo Autónomo de Parques Nacionales and CICyT by granting the<br />
project “Fuentes y sumideros de carbono en el Parque Nacional Las Tablas de Daimiel<br />
(81/2005)” under the direction of Dr M. Álvarez-Cobelas.<br />
References<br />
1. P.N. Nelson, J.A. Baldock, P. Clarke, J.M. Oades, and G.J. Churchman, Aust. J. Soil Res., 37<br />
(1999) p. 289.<br />
2. P.N. Nelson, and J.A. Baldock, Biogeochemistry, 72 (2005) p.1.<br />
3. J.A. Baldock, C.A. Masiello, Y. Gélinas, and J.I. Hedges, Mar. Chem. 92 (2004) p. 39.<br />
4. J.C. Rodríguez-Murillo, G. Almendros, and H. Knicker, work in progress.<br />
<strong>Vol</strong>. 2 Page - 213 -
15th IHSS Meeting- <strong>Vol</strong>. 2<br />
Natural Organic Matter and Humic Substances in Terrestrial<br />
Systems Including Soils<br />
<strong>Vol</strong>. 2 Page - 214 -
15th IHSS Meeting- <strong>Vol</strong>. 2<br />
<strong>Humus</strong> of Epilitic and Endolitic Soils from the Antarcitc Dry Valley<br />
Evgeny Abakumov<br />
Saint-Petersburg State University, 198504, 16-line 29, Vasilyevskiy Island, Saint-Petersburg,<br />
Russia<br />
E-mail: e_abakumov@mail.<strong>ru</strong><br />
1. Introduction<br />
Soils of Antarctica are very different, there are many full-profile soils with 30–50 cm<br />
thickness and also some very short-profile soils, which are known as leptosols or regosols [1].<br />
These soils show evident accumulations of organic matter in fine earth, e.g. the humus content<br />
here is about 0.1–3.0 %. <strong>Humus</strong> of such soils characterizes by dominance of fulvic acids and<br />
very low content of humic acids. These soils, with expressed humification processes are<br />
widely dispersed in sub-antarcitc islands and Antarctic Peninsula and also in co-called oasis’s<br />
(Shirmacher, Banger and Larsemann). But this abstract is about micro soils, which form on<br />
the surface of stones, parent materials and inside of rocks and sediments. These micro soils<br />
are typical for epilitic and endolitic communities of microorganisms which were described by<br />
Friedmann [2] and Gaad [3]. Organic matter under these communities accumulates<br />
intensively and shows intensive features of humification.<br />
2. Materials and Methods<br />
Epilitic communities of lichen Usnea antarctica were investigated on the stones of andesitic<br />
basalt which were sampled in Dry valley close to the Russian polar station Russkaya (74-45-<br />
57 S, 136-48-50 W, 124 m.a.s.l.).<br />
Here the annual precipitation is less than 50 mm, the above-zero temperature holds at about<br />
12–15 days per year. The maximum wind speed is 277 km/h due to katabatic winds blowing<br />
from the central part of Antarctica (glaciers, plateau and mountains). Landscape surfaces<br />
consist of coarse gravel of andesitic basalts with fine earth content less than 4 %.<br />
Stones of coarse gravel soil were sampled and put into containers were then studied under the<br />
optical microscope and by micro zond analisator.<br />
Real soils here are not developed due to strong climate. Meanwhile the weathering leads to<br />
the formation of cavities and cracks in stones. These mirco depressions accumulate organic<br />
matter of dyed endolitic microorganisms and residues of epilitc plants.<br />
<strong>Vol</strong>. 2 Page - 215 -
15th IHSS Meeting- <strong>Vol</strong>. 2<br />
3. Results and Discussion<br />
Accumulations of organic matter were revealed on the surface of stones in cavities and cracks.<br />
Not decomposed organic matter accumulates just under the lichen, carbon content here is<br />
about 40–60 %. The thickness of organic here is about 1 millimeter. 50–60 mm far from the<br />
lichen colony the thickness of organic layer decreases to 0.05 m or lesser, organic matter here<br />
is more decomposed, presented by fine textured detritus with some portions of mineral fine<br />
earth. Organic matter assists to accumulation of fine earth by colloidal association of mineral<br />
parts. Carbon content here is not more than 10–15 %. These accumulations of organic matter<br />
can be described as organic horizons of epilitc soils. Endolitic soils were revealed by bimodal<br />
distribution of organic carbon in porous space of stones. Thus, just under the epilitic film<br />
(layer) by 1 mm thickness with 10–15 % of carbon changes by low organic content layer and<br />
then by organic rich layer again (C content is 7–8 %). This fact shows an evident endolitic<br />
humus accumulations which need to be investigated in details as well as a fact of epilitic<br />
humification phenomena.<br />
4. Conclusions<br />
<strong>Humus</strong> accumulation and humification were revealed even in dry Antarctic valleys, that is<br />
why detailed investigation of these processes needs to be taken in aim to explain the nature of<br />
initial humification and soil formation.<br />
Acknowledgements<br />
A great acknowledgement are made to Russian Antarctic Expedition<br />
References<br />
1. Abakumov E.V., Pomelov V.N., Vlasov D. Yu., Krylenkov V.A., Morphological<br />
organization of soils form Lesser Antarctic, Transactions of S-Petersburg University, 3,<br />
(2003), 102–116.<br />
2. Friedmann E.I. Endolothic microorganisms in the Antarctic Cold desert, Science, 215,<br />
(1982), 1045–1053.<br />
3. Gaad G.M. Geomycology: biogeochemical transformations of rocks, minerals, metals and<br />
radionuclides by fungi, bioweathering and bioremediation. Mycol. Res., 111, (2007), 3–<br />
49.<br />
<strong>Vol</strong>. 2 Page - 216 -
15th IHSS Meeting- <strong>Vol</strong>. 2<br />
Humic Acid Properties in A Peat Profiles<br />
Jānis Šīre*, Māris Kļaviņš<br />
Dept. of Environmental Sciences, Univ. of Latvia, Raiņa blvd. 19, LV1586, Rīga, Latvia<br />
E-mail: janis.sire@lu.lv<br />
1. Introduction<br />
A comparative and complex characterization of humic acids (HAs) isolated from peat profiles<br />
of different origin in Latvia was carried out. The aim of the research was to analyze the<br />
elemental and functional composition, spectral characteristics of humic acids isolated from<br />
peat profiles to evaluate the impact of the character of humification processes on the peat HA<br />
properties.<br />
2. Materials and Methods<br />
Elemental and functional analysis of the isolated HAs was done, their acidity and molecular<br />
weights estimated. Spectral characterization included UV–Vis, IR, and electron spin<br />
resonance and fluorescence spectra. St<strong>ru</strong>ctural characterization of HAs was done by both 1 H<br />
and 13 C nuclear magnetic resonance spectra. Properties of HAs isolated from the Latvian peat<br />
were compared with HA from other sources (soil, water, coal and synthetic humic<br />
substances).<br />
3. Results and Discussion<br />
There was significant variation in elemental composition of HAs within the peat profiles,<br />
most probably caused by the increase of aerobic decomposition and oxidation in the topmost<br />
layers. In general, C and H concentrations increased with depth. N concentrations decreased<br />
with depth, but S concentration was very variable down the profile. The elemental<br />
composition of HAs from peat in Latvia is of similar magnitude to those for peat HAs from<br />
other regions of the world.<br />
The most dominant functional groups in the st<strong>ru</strong>cture of HAs were carboxyl and phenolic<br />
hydroxyl groups, total acidity was usually higher for HAs from upper peat layers. The found<br />
molecular masses of HAs were all comparatively high, up to 37 000 Da.<br />
The UV–Vis absorption ratios were measured to provide information about the humification<br />
state of peat samples, reflecting generally low variability, which can be explained by the<br />
overall low decomposition degree and similar botanical composition within peat samples.<br />
Spectral analyses gave insight into st<strong>ru</strong>ctural changes of HAs isolated from peat columns. The<br />
<strong>Vol</strong>. 2 Page - 217 -
15th IHSS Meeting- <strong>Vol</strong>. 2<br />
UV–Vis and fluorescence spectra did not demonstrate significant changes in character of<br />
spectra of HAs from peat columns, possibly due to the thickness of the peat layers. Changes<br />
in the IR spectra of HAs isolated from peat columns, especially if compared with spectra of<br />
peat-forming plants, gives insight into the genesis of peat HA st<strong>ru</strong>cture. 1 H NMR and 13 C<br />
NMR spectra gave similar results, confirming that residues of carbohydrates in peat HAs had<br />
a significant role and supports the hypothesis that aromatic st<strong>ru</strong>ctures in peat HA are much<br />
less important than olefinic st<strong>ru</strong>ctures. The ESR spectra demonstrated that the free radical<br />
concentration was fairly similar in all HA samples from peat, indicating that HA st<strong>ru</strong>cture has<br />
reached present chemical composition in equally anaerobic conditions.<br />
4. Conclusions<br />
The elemental, functional, mass-molecular and spectral characterization of peat HAs<br />
demonstrate the impact of the peat properties onto properties of HAs. The spectral analysis of<br />
HAs from a peat columns supports the hypothesis that the genesis of peat HAs takes place in<br />
the upper bog layer (acrotelm), however within the bulk peat mass (catotelm) the changes in<br />
the st<strong>ru</strong>cture of peat HSs are not very significant. In waterlogged environments, under the<br />
impact of anaerobic and acidic conditions, the humification process of the saturated peat<br />
layers is very much retarded. Nevertheless, in peat it is possible to follow the humification<br />
process for very long periods (more than several thousand years). The results demonstrate that<br />
it is possible to study the stage of humification of organic matter in peat according to its age<br />
and apply the methods of analysis to the estimation of peat humification.<br />
<strong>Vol</strong>. 2 Page - 218 -
15th IHSS Meeting- <strong>Vol</strong>. 2<br />
Comparison of C Mineralization Rates in Forest Ecosystems Under<br />
Continental (Russia) and Mediterranean (Spain) Conditions<br />
I.N. Kurganova a , J.F. Gallardo-Lancho b* , V.O. Lopes de Gerenyu a , C. Oehm c<br />
a Institute of Physicochemical & Biological Problems in Soil Science, RAS, Institutskaya 2,<br />
Pushchino 142290, Moscow Region, Russia; b Institute of Natural Resources & Agro-Biology<br />
of Salamanca, CSIC, Apartado 257, Salamanca 37071, Spain; c Institute for Geosciences,<br />
Eberhard Karls University Tübingen, Sigwartstraße 10, Tübingen 72074, Germany<br />
E-mail: jgallard@usal.es<br />
1. Introduction<br />
Decomposition and mineralization of soil organic matter (SOM) is a key stage of its<br />
transformation. SOM-decomposition is mainly induced by microbial activity, being the final<br />
products of this process CO 2 and H 2 O. Therefore, the rate of C-mineralization in soils is<br />
usually estimated by measuring the CO 2 emission rate. The intensity of SOM-decomposition<br />
process depends on the type of soil, the soil hydrothermal regime, vegetation, and the<br />
biochemical composition of organic residues. It is difficult to separate and estimate the<br />
influence of each factor, but the effect of soil temperature seems to be an important driving<br />
factor in temperate forests. The temperature dependence of SOM decomposition is of<br />
considerable ecophysiological importance, especially in the context of possible climate<br />
change feedback effects [6]. In this context, the present study was aimed to compare: (1) the<br />
C mineralization rates in the forest ecosystems under Continental (Russia) and mild<br />
Mediterranean (Spain) conditions; and (2) the temperature sensitivity of SOM-decomposition<br />
at contrasted levels of soil moisture in Russian and Spanish forest soils.<br />
2. Materials and Methods<br />
We investigated superficial layers (0-10 cm) of soil A h horizons in natural or reforested forest<br />
systems located in the European part of Russia (Albeluvisols, Phaeozems, Chernozems, and<br />
Kastanozems), and in the Central-Western part of Spain (Acrisols, Phaeozems, and<br />
Umbrisols). Short descriptions of sites and soils are presented on Table 1. The potential rates<br />
of SOM mineralization (R min ) were measured in free-root soil samples, sieved through 2-mm<br />
mesh, at 22 o C and a soil moisture content of 60 % of their water holding capacity (WHC).<br />
Immobilized C in soil microbial biomass (C mic ) was determined by the substrate-induced<br />
respiration (SIR) method [2]. Metabolic coefficient (qCO 2 ) was calculated as a ratio between<br />
the basal soil respiration rate (R br ) and the SIR-rate [4]. To describe the dependence of SOMdecomposition<br />
on temperature, the Q 10 relationship was used [5]; for this, soil samples were<br />
<strong>Vol</strong>. 2 Page - 219 -
15th IHSS Meeting- <strong>Vol</strong>. 2<br />
adjusted to three different levels of moisture (corresponding to 30, 60, and 90 % of their<br />
WHC) and then incubated sequentially at 2, 12, 17, 22, and 27 o C. The dependence of SOM<br />
decomposition on temperature (Q 10 function) was expressed by a simple linear model, using<br />
natural logarithm of R min and temperature [1, 8]: ln R min = kT + b; where k and b are the<br />
regression coefficients, and T the incubation temperature.<br />
Value of Q 10 was calculated as: Q 10 = exp 10k .<br />
Table 1: General climatic parameters and characteristics of the forest soils studied.<br />
Precipitation<br />
(mm/yr)<br />
Mean annual T<br />
( o C)<br />
Soil units<br />
(FAO)<br />
Cenosis or<br />
dominant species<br />
С OS<br />
(mg/g)<br />
Soil<br />
C/N<br />
pH<br />
(H 2 O)<br />
640 5.5 Albeluvisols Mixture forest 19.0 11.9 5.6<br />
640 5.5 Phaeozems Deciduous forest 30.0 13.0 6.4<br />
570 5.7 Chernozems Quercus robur 48.4 8.49 6.6<br />
300 6.9 Kastanozems Ulmus primula 47.0 17.4 7.2<br />
400 10.5 Acrisols Q. rotundifolia 48.8 13.8 6.3<br />
720 12.9 Phaeozems Q. pyrenaica 44.1 16.4 5.4<br />
1580 10.4 Umbrisols Q. pyrenaica 107 21.5 5.0<br />
1152 14.2 Umbrisols Castanea sativa 66.2 23.6 5.1<br />
C OS : soil organic carbon.<br />
3. Results and Discussion<br />
The soils studied significantly differed in C OS contents; their values were low (19-30 mg C g -<br />
1 ) in the Russian Southern-taiga soils (Albeluvisols and Phaeozems) and reached higher values<br />
(66-107 mg C g -1 ) in the Spanish Mediterranean Umbrisols (Table 1). The superficial layers<br />
of the Russian forest-steppe and steppe soils (Chernozems and Kastanozems) under<br />
reforestation and the drier Spanish soils (Acrisols and Phaeozems) under forest vegetation<br />
contained equal amount of C OS (44-48 mg C g -1 ). Potential rate of SOM decomposition varied<br />
between 25 and 69 mg С kg -1 soil day -1 in Continental forest soils and was appreciably higher<br />
(50-105 mg С kg -1 soil day -1 ) in Mediterranean soils (Table 2). A positive correlation (R =<br />
0.75, F
15th IHSS Meeting- <strong>Vol</strong>. 2<br />
microbial biomass responds faster than the C OS to external impacts or changes; as a general<br />
<strong>ru</strong>le, C mic /C OS values should be lower in young than in mature ecosystems; in the last, a higher<br />
C mic / C OS ratio can be caused by the increase of microbial biodiversity.<br />
Table 2: Potential C mineralization rate (R min ) and other characteristics of the microbial community of<br />
Continental and Mediterranean topsoils.<br />
Soils units Cenosis or dominant R min С mic<br />
species<br />
(mg С/kg (mg С/g qCO 2 С mic /C org<br />
(FAO)<br />
soil/day) soil)<br />
(%)<br />
Continental climate (European Russia)<br />
Albeluvisols Mixture forest 38.4 0.19 0.34 1.01<br />
Phaeozems Deciduous forest 32.5 0.39 0.14 1.29<br />
Chernozems Quercus robur 68.6 0.28 0.42 0.57<br />
Kastanozems Ulmus primula 24.5 0.35 0.12 0.75<br />
Avearage 41.0 0.30 0.26 0.90<br />
Mediterranean climate (Central-Western Spain)<br />
Acrisols Q. rotundifolia 77.5 1.40 0.18 3.13<br />
Phaeozems Q. pyrenaica 45.7 0.57 0.23 1.35<br />
Umbrisols Q. pyrenaica 104.9 1.13 0.29 1.05<br />
Umbrisols Castanea sativa 50.6 1.00 0.16 1.52<br />
Average 69.7 1.03 0.21 1.76<br />
For abbreviations, see text.<br />
Values of metabolic coefficients (qCO 2 ) in the soils studied changed from 0.12 to 0.42.<br />
Accordingly to the observed values of qCO 2, they are in the range of optimal hydrothermal<br />
conditions and sufficient available nutrients for microbial communities [4] in these forest<br />
soils.<br />
Table 3: Temperature dependence of SOM mineralization in forest soils under Continental and<br />
Mediterranean conditions.<br />
Soil units Cenosis or 30 % WHC 60 % WHC 90 % WHC<br />
(FAO) dominant species Q 10 R 2 Q 10 R 2 Q 10 R 2<br />
Continental climate (European Russia)<br />
Albeluvisols Mixture forest 2.90 0.98 3.31 0.99 3.11 0.97<br />
Phaeozems Deciduous forest 3.18 0.97 3.05 0.98 3.20 0.95<br />
Chernozems Quercus robur 4.99 0.98 4.12 1.00 3.95 0.99<br />
Kastanozems Ulmus pimula 5.19 0.95 4.51 0.97 4.77 0.90<br />
Mediterranean climate (Central-Western Spain)<br />
Acrisols Q. rotundifolia 2.15 0.92 2.26 0.94 2.27 0.94<br />
Phaeozems Q. pyrenaica 2.18 0.89 2.06 0.89 1.95 0.87<br />
Umbrisols Q. pyrenaica 2.05 0.94 2.15 0.93 2.15 0.92<br />
Umbrisols Castanea sativa 2.15 0.94 2.26 0.92 2.30 0.93<br />
Experiments on SOM-dependence on temperature demonstrated that the R min values increased<br />
when the temperature grows for all soil moisture contents considered. The SOMmineralization<br />
is sensible to temperature; consequently, Q 10 (Table 3) varied widely in the<br />
Continental forest soils (from 2.90 to 5.19), indicating a progressive mineralization of labile<br />
SOM, but not in Mediterranean forest soils, having narrow range of Q 10 values (from 1.95 to<br />
<strong>Vol</strong>. 2 Page - 221 -
15th IHSS Meeting- <strong>Vol</strong>. 2<br />
2.3), due to a more recalcitrant SOM [7]. For all soils studied, the soil moisture contents<br />
selected had no significant effect on the Q 10 values, i. e., on the SOM-mineralization rate<br />
(Table 3).<br />
The results obtained allow us to assume that the supposed change in climate (announcing a<br />
temperature increase) will result in a higher acceleration of SOM mineralization in the<br />
Continental forest soils in comparison to the Mediterranean ones, where the recalcitrant<br />
fractions are dominant in the SOM [7].<br />
4. Conclusions<br />
The soils studied differed significantly in C OS contents and microbial activity. Potential rate of<br />
SOM mineralization in Mediterranean forest soils was appreciably higher in comparison with<br />
Continental ones. A positive correlation was observed between the potential R min and C OS<br />
contents for all set of forest soils. Soil microbial activity in A h horizon of forest soils under<br />
Continental and Mediterranean climates is high, pointing out that hydrothermal conditions are<br />
close to the optimal, having enough contents of available nutrients, accordingly to the in-vitro<br />
responses. The sensitivity of the SOM mineralization to temperature in Mediterranean forests<br />
was significant lower than that found in Continental forest soils. It may be supposed that the<br />
expected climate change will result in a higher acceleration of the SOM mineralization in the<br />
Continental forest soils than in Mediterranean ones.<br />
Acknowledgements<br />
This study was supported by Russian Foundation for Basic Researches and Spanish C.S.I.C.<br />
Authors thank the agreement between both National Organizations for scientist exchanges.<br />
References<br />
1. J.S. Amthor, in R.E. Wilkinson, M. Decker (Eds.) Plant-Environment interactions, New<br />
York, 1994, p. 501-554.<br />
2. J.P.E. Anderson and K.H. Domsch, Soil Biol. Biochem., 10 (1978) 215-221.<br />
3. T.H. Anderson, in K Rits, J. Dighton, K.E. Giller (eds.), Beyond the Biomass, British<br />
Society Soil Sci., A Wiley Sayce Publ., London, 1994, Chapter 7, p. 67-76.<br />
4. E.V. Blagodatskaya, N.D. Ananyeva, T.N. Myakshina, Eurasian Soil Sci., 2 (1995) 205-<br />
210.<br />
5. T. Kätterer, M. Reichstein, O. Andren, A. Lomander, Biol Fertil Soils. 27 (1998) 258-262.<br />
6. M.U.F. Kirschbaum, Soil Biol. Biochem. 38 (2006) 2510-2518.<br />
7. A. Moyano, J.F. Gallardo, I. Santa Regina, Soil Res. & Rehabil., 5 (1991) 47-54.<br />
8. M. Pavelka, M. Acosta, M.V. Marek, W. Kutsch, D. Janous, Plant & Soil, 292 (2007)<br />
171-179.<br />
<strong>Vol</strong>. 2 Page - 222 -
15th IHSS Meeting- <strong>Vol</strong>. 2<br />
Characteristic of HA in the System of Oligotrophic Landscapes of Vasyugan<br />
Mire Spurs<br />
Inisheva L.I. a , Yudina N.V. b , Saveljeva A.V. b<br />
a Testing Agroecology Laboratory, State Pedagogical University; b Institute of Petroleum<br />
Chemistry SB RAS, Tomsk, Russia<br />
E-mail: inisheva@mail.<strong>ru</strong><br />
1. Introduction<br />
It is of interest to study properties of HA in peat deposits of landscape profile with the aim of<br />
gaining new knowledge in biochemistry of peat genesis.<br />
Goals and objectives of investigation. To determine the <strong>ru</strong>les of formation process of peat HA<br />
in peat deposit of landscape profile.<br />
2. Materials and Methods<br />
As an investigation object we took peat deposits of oligotrophic landscapes basin in spurs of<br />
Vasyugan mire. Landscape profile crosses main kinds of swampy biogeocoenosis (BGC):<br />
paludal tall mixed forest, pine undersh<strong>ru</strong>b Sphagnum (high riam, trans-accumulative part of a<br />
profile, point (p.)-2), pine-undersh<strong>ru</strong>b Sphagnum (low riam, transit part, p.3), sedge-moss<br />
swamp (eluvial part, p. 5).<br />
Group composition of peat was researched by Instrof’s method. Humic acids (HA) separation<br />
was made on the following scheme: from air-dry samples water-soluble components, lipids<br />
were removed one after another by extraction of chlorophorm (1:3). Humic matters were<br />
extracted by decimolar solution of natrium hydroxide. Then HA is precipitated by treatment<br />
of 4% solution of HC1. Humic acids were washed till pH 6.5–7 and dried in vaccum drying<br />
cabinet at room temperature. IS-spect<strong>ru</strong>m of HA was researched by IK- Fourier-spectrometer<br />
Vector-22 of “B<strong>ru</strong>ker” firm in tablets with KBr in the ratio 1:300 corespondingly in all limits<br />
of frequency from 400 cm -1 to 4000 cm -1 .Molecular-mass distribution of HA of peat was<br />
received with the help of gel-chromatographic division with Sephadex G-75 using 0.1M<br />
NaOH as solvent and elution agent. Optical density was registered on spectrophotometer<br />
Spekol-21 for the wave length of 465 nm. Measurement of paramagnet sites content were<br />
made with the help of apparatus SPR Spektrometor SE/X 2544 under cover of Radipan<br />
(Poland). As a model Mg +2 in MgO at atmosphere pressure and room temperature was used.<br />
<strong>Vol</strong>. 2 Page - 223 -
15th IHSS Meeting- <strong>Vol</strong>. 2<br />
3. Results and Discussion<br />
In transit and trans-accumulative parts of landscape profile in peat layer to 100 cm (Mollisoil)<br />
it is marked an increase of EH and DH.<br />
At the same time the growing of these fractions content closer to the zone of water unloading<br />
(p. 2–geochemical barrier of landscape profile). Redistribution of water soluble compounds is<br />
observed along all the landscape with the greatest content in trans-accumulative part of a<br />
landscape. This confirms an existence of the process of lateral matter removal.<br />
Humic acids. The most distinct fractionating of molecular weight is reached with solution<br />
filtration of HA through Sephadex G-75. Sorbent capability of HA depends on an existence in<br />
their st<strong>ru</strong>cture of metals and microelements. According to the chain-length distribution<br />
researched peat can be divided into two main groups. HA woody grass and grass kinds refer<br />
to the first group. Predomination of low-polymeric fraction is their characteristic. Correlation<br />
of low- and high-polymeric fraction is approximately 3:1. HA of moss and woody moss kinds<br />
of peat refer to the second group. The least polydisperse and high-molecular are HA grass and<br />
woody grass peat. In HA spect<strong>ru</strong>m were discovered intensive absorption bands with wave<br />
length of 3500–3400 cm -1 – compounds containing hydroxyl, 2920, 1460 and 730–720 cm -1 –<br />
methylene chains, 2870 cm -1 – methyl groups, 1780–1720 cm -1 – compounds containing<br />
carbonyl, 1610, 1510 and 1380 cm -1 – testify about an existence of benzene-like st<strong>ru</strong>cture<br />
(C=C), 1270 –C–O– group, 1150 –OH– carbohydrates, 1070 –CO– carbohydrates. Maximum<br />
intensity of absorption bands in HA spect<strong>ru</strong>m of peat is marked for hydroxyl, carboxyl groups<br />
and aromatic fragments.<br />
Hydroxyl, carboxyl groups, C–O – links with 1270 cm -1 and CO– and OH-carbohydrates are<br />
one of the main forms of HA containing oxygen. Their relative content depends on the degree<br />
of HA transformation. Correlation of optical density of absorption bands of active functional<br />
oxygen groups and alkyl substitutes to aromatic fragments showed that in molecules of peat<br />
HA there is marked prevalence of aromatic over alkyl (2920 cm -1 ) and C–O–groups (1250<br />
cm -1 ). It was fixed an alteration of relative content of carboxyl groups along vertical and<br />
horizontal profile of a researched area. With depth of peat deposit and in swamp deposit their<br />
content increases. On the basis of multivariate statistical analysis there were discovered stable<br />
and significant correlations between st<strong>ru</strong>ctural parameter of HA with depth of peat deposit.<br />
For eluvial part of a landscape profile relationship of optical density D 3400 /D 2920 (r= 0,87),<br />
D 1720 /D 2920 (r= 0.95), D 1250 /D 2920 (r= 0.99) grow with depth. For transit part of a profile there<br />
was also marked with depth an increase of spectral ratio of D 1250 /D 2920 (r= 0.91) and decrease<br />
<strong>Vol</strong>. 2 Page - 224 -
15th IHSS Meeting- <strong>Vol</strong>. 2<br />
of D 2920 /D 1610 (r= -0.83), D 1720 /D 1610 (r= -0.90). In a trans-accumulative part of the value of<br />
spectral ratio D 1250 /D 2920 grows with depth (r= 0.89), and D 1250 /D 1620 (r= -0.92) decreases. On<br />
the whole for HA peat of all landscape profile there are found stable tight correlation between<br />
D 1250 /D 2920 and depth of peat deposit.<br />
Compared content of paramagnetic centers (PMC) in peat HA of olygotrophic landscape<br />
showed an existence of significant differences. That is especially marked for HA of high riam<br />
(table 1). As was mentioned above, high riam (point 2) stand for geochemical barrier of<br />
matter flows. It influences on high content of PMC in peat HA (0.53·10 18 –0.65·10 18 ds/g).<br />
Table 1: Influence of demineralization on st<strong>ru</strong>ctural peculiarities of peat HA<br />
Depth cm Kind of peat D 465 Content of PMC. Relation<br />
10 18 ds/g D 1720 /D 1610 D 1070 /D 1610<br />
initial demin initial demin initial demin<br />
eluvial part - point 5<br />
0–50 Sphagnum peat of bog 0.3893 0.62 0.49 1.04 0.86 1.62 1.69<br />
hollows grass<br />
100–150 Sedge-moss peat 0.7316 0.38 0.29 0.98 0.85 1.00 1.09<br />
200–250 Grass 0.7531 0.55 0.98 1.04 0.84 1.51 1.61<br />
transit part – point 3<br />
0–50 Fuscum 0.7549 0.35 0.32 1.14 0.95 0.87 0.95<br />
75–100 Medium 0.5100 0.35 0.49 1.16 1.02 0.64 0.79<br />
150–200 Pine cotton-grass peat 0.7549 0.49 0.30 1.00 0.95 0.68 1.06<br />
200–250 Sedge 0.7250 0.66 0.54 1.00 0.87 0.61 0.75<br />
250–300 Grass 0.7512 0.49 0.90 1.00 0.89 0.77 0.88<br />
trans–accumulative part – point 2<br />
0–25 Pine cotton-grass peat 0.3080 0.43 0.41 1.14 1.07 0.71 0.94<br />
25–50 Woody cotton-grass peat 0.4312 0.63 0.33 1.07 1.00 0.77 0.84<br />
50–75 Woody cotton-grass peat 0.6803 0.65 0.25 1.00 0.93 0.62 0.77<br />
75–100 Woody cotton-grass peat 0.7042 0.53 0.30 1.06 1.00 0.86 0.92<br />
Note: initial–humic acids not treated by acid; demin–humic acids after treatment by 4% HСl;<br />
On the whole, there is observed a tendency of number of PMC HA increase with depth of peat<br />
deposit. The exception is HA of Sphagnum peat of bog hollows of upper layer of peat deposit<br />
of sedge-Sphagnum swamp (table 1). It is marked by maximum content of PMC (0,62*10 18<br />
ds/g), that, evidently, is explained by abnormally high content of carboxyl groups relative to<br />
aromatic st<strong>ru</strong>cture.<br />
Aimed at determination of the role of paramagnetic iron in the st<strong>ru</strong>cture of HA, they were<br />
isolated by different methods: HA – 1was isolated by triple peat treatment of 0,1 – n solution<br />
of NaOH, HA – 2 was extracted by 0,1- n solution of NaOH with following treatment by 4%<br />
HC1 during two hours on water bath. In EPR-spect<strong>ru</strong>m of demineralized samples of peat HA<br />
signal Fe 3+ сdoesn’t nearly registered with g~ 4. It is observed the decrease of PMC quantity<br />
in 1,5-2 times, that is connected with change of HA fragment composition under HC1<br />
influence.<br />
<strong>Vol</strong>. 2 Page - 225 -
15th IHSS Meeting- <strong>Vol</strong>. 2<br />
Acid hydrolysate happens when HA is treated by hydrochloric acid. It promotes to opening of<br />
glycosidic linkage and formation of saccharides remains. Besides, the content of carboxyl<br />
groups may decrease in HA st<strong>ru</strong>cture. It is followed from the data of table 2, that changing of<br />
PMC content under acid hydrolysate can be connected with st<strong>ru</strong>cture change of peat HA.<br />
Modification of HA st<strong>ru</strong>cture under acid hydrolysate is connected with quantity decrease of<br />
carboxyl, hydroxyl groups and increase of carbohydrates fragments in respect of aromatic<br />
connected systems. In the process of demineralization of HA there was not discovered<br />
influence of paramagnetic Fe 3+ on the number of free radicals. This fact may be explained by<br />
low content of paramagnetic Fe 3+ and change of fragment composition of HA.<br />
4. Conclusions<br />
There are discovered regularities in distribution of organic and mineral components of peat in<br />
the system of oligotrophic landscapes. Concentration of chemical compounds is observed in<br />
trans-accumulative part of peat deposit by lateral removal.<br />
The peculiarity of peat HA of oligotrophic kind is significant quantity of lignin and<br />
carbohydrates components with highly condensed aromatic fragments. The content of<br />
carboxyl groups, aromatic degree and their oxidability increase in HA with depth of peat of<br />
peat deposit. Alteration of PMC content under acid hydrolysate is explained by st<strong>ru</strong>ctural<br />
changes of peat HA. These changes appear in carboxyl and hydroxyl groups quantity decrease<br />
and increase of carbohydrates fragments in relation to aromatic connected systems.<br />
Acknowledgements<br />
The work is done by means of support of RFFR (№ 09-05-00235, № 09-05-99007), Minister<br />
of education and science (№ 02.740.11.0325).<br />
<strong>Vol</strong>. 2 Page - 226 -
15th IHSS Meeting- <strong>Vol</strong>. 2<br />
Content of Polycyclic Aromatic Hydrocarbons in Podzolic and Peaty<br />
Podzolic Gleyey Soils<br />
Vasily Beznosikov, Dmitriy Gabov, Boris Kondratenok, Anatoliy Taskaev<br />
Institute of Biology of Komi Scientific Centre of the Ural Branch of the Russian<br />
Academy of Sciences, Kommunisticheskaya St., 28, Syktyvkar, 167982, Russia<br />
E-mail: beznosikov@ib.komisc.<strong>ru</strong><br />
1. Introduction<br />
The study of polycyclic aromatic hydrocarbons (PAHs) in soils is necessitated by the toxicity<br />
of these compounds and the widespread soil contamination with them. Soil is the main<br />
storage medium of PAHs in the landscapes. Soil properties determine the intensity of the<br />
accumulation, the migrational characteristics, and the possibility for conservation and<br />
subsequent mobilization of this group of organic compounds in the environment. The PAH–<br />
soil system is very informative: on the one hand, soils represent a relatively stable medium in<br />
which one can trace the transformation of PAHs and use them as specific labels for studying<br />
humus-formation processes; on the other hand, the study of PAHs in soils shows promise for<br />
obtaining information about the ways of formation of different PAHs, the specificity of their<br />
accumulation and redistribution in soils of background and polluted territories, and about the<br />
functional state of soils containing PAHs [1–4]. The study of the composition of PAHs and<br />
their migrational properties in northern soils in relation to the character of the soil formation<br />
in this region is of particular interest. The aim of our study was to characterize the qualitative<br />
and quantitative composition of PAHs and the regularities of their accumulation and<br />
migration in the background podzolic and peaty podzolic gleyey soils in the northwestern part<br />
of European Russia.<br />
2. Materials and Methods<br />
We studied Podzolic and Peaty Podzolic Gleyey soils of the middle taiga zone<br />
(61°39’44.6”N, 50°41’10.4”E) and Gley-Podzolic and Peaty Podzolic Gleyey soils of the<br />
northern taiga zone (62°41’21.0”N, 56°08’59.1”E). These soils were developed from the<br />
homogenous mantle loams with similar chemical and mineralogical characteristics. The<br />
extraction of PAHs from the soil samples was performed with methylene chloride and<br />
ultrasonic treatment of the extraction system in a Branson 5510 bath (USA) (power 469 Wt,<br />
working frequency 42 KHz). Chemically pure hexane and benzene were used in the<br />
elutriating mixtures. The purity was controlled by the absence of peaks in the chromatogram<br />
of the blank test. The extracts were fractionated using the method of column chromatography<br />
<strong>Vol</strong>. 2 Page - 227 -
15th IHSS Meeting- <strong>Vol</strong>. 2<br />
to remove admixtures impeding the determination of the PAHs. Aluminum oxide (produced<br />
by the Neva Reaktiv Company) and silica gel (Silica gel 60 for column chromatography,<br />
Fluka Co., particle size 0.063–0.2 mm) were used. A standard mixture of 16 PAHs (Fluka<br />
Co.) in concentrations of 10 µg/cm 3 was used to prepare standard PAH solutions. The<br />
qualitative and quantitative determination of the PAHs in the soil samples was performed<br />
with the method of inverse-phase HELC in the gradient regime and with spectrofluorometric<br />
detection using a Fluorat- 02-Panorama device (Lumeks Company, Russia). The<br />
chromatography was performed at 25°C in a Supelcosil TM LC-PAH 5µm column (25 cm ×<br />
2.1 mm). The acetonitrile–water gradient was used as the mobile phase. The 10 µl samples<br />
were introduced with a dosing cock. The identification of PAHs was performed on the basis<br />
of data on the time of their retention and via the comparison of fluorescence spectra of the<br />
components from the column with the spectra of standard PAHs. The quantitative analysis<br />
was performed with the method of an external standard. The chromato-mass spectrometric<br />
study was performed using a QP 5050A device of the Shimadzu Company (Japan). A column<br />
Supelco Co. SPB-5 (60 cm × 0.32 mm) was used for the hromatography. The thickness of the<br />
immobile-phase layer was 0.25µm. The mode of temperature programming from 50 to 300 °C<br />
with a rate of 5 °C/min was used. The temperature of the injector was 300 °C, and the<br />
temperature of the ion source was 250 °C. The samples were injected in volumes of 1µl. To<br />
increase the sensitivity of the measurements, mass-fragmentograms were taken under the<br />
mode of scanning by ions with molecular weights of 166, 178, 202, 228, 252, and 278 Da<br />
corresponding to the standard solutions of PAHs.<br />
3. Results and Discussion<br />
The redistribution of PAHs in the soil profiles was assessed via calculation of the so-called<br />
eluvial–accumulative coefficient (K ea ) representing the ratio of the substance (PAH)<br />
concentration in the given soil horizon to its concentration in the parent material. The<br />
distributions of PAHs in the profiles of podzolic and peaty podzolic gleyey of the middle and<br />
northern taiga zones have similar patterns, which is explained by the similarity of the soilforming<br />
rocks in the studied regions and the common regularities of the pedogenesis. In both<br />
soil types, the distribution of PAHs in the soil profiles has an eluvial–illuvial character.<br />
Organic and illuvial horizons are the biogeochemical barriers retaining PAHs in the vertical<br />
soil profile. The distribution of PAHs in the automorphic podzolic soils is more differentiated<br />
than that in the profiles of peaty podzolic gleyey soils. The illuvial horizons with a higher<br />
content of clay minerals with increased sorption capacity are the geochemical barriers for<br />
<strong>Vol</strong>. 2 Page - 228 -
15th IHSS Meeting- <strong>Vol</strong>. 2<br />
PAHs. The values of the correlation coefficients (at n = 6–8, and P = 0.95) between the clay<br />
content (ω1) and the content of polyarenes (ω2) vary from 0.76 to 0.97. The peaty podzolic<br />
gleyey soil is characterized by a lower differentiation of PAHs in the profile because of the<br />
stagnic–percolative soil water regime. There is no correlation between the contents of clay<br />
and PAHs in the illuvial horizon of these soils (r ω1-ω2 = –0.3–0.6). In the typical automorphic<br />
podzolic soils, the gleyzation processes are short; the soil formation mainly proceeds under<br />
aerobic conditions, and the degree of organic matter mineralization increases. This results in a<br />
more significant accumulation of PAHs in the organic horizons in comparison with the gleypodzolic<br />
soils. The concentration of PAHs in the AO horizon of the podzolic soil reaches<br />
227.0 ng/g, which is more than five times higher than in the gley-podzolic soils. In the peaty<br />
podzolic gleyey soils, the maximum accumulation of PAHs takes place in the organic (O)<br />
horizon and reaches 85 % of the total mass of PAHs in the soil profiles of the middle taiga<br />
zone and 55 % in the northern taiga. The decomposition of plant residue matter under<br />
conditions of the soil overmoistening and the presence of heterotrophic microflora results in<br />
the formation of benzo[a]pyrene, benzo[a]anthracene, phenanthrene, fluoranthene, and other<br />
PAHs. Their total content in the organic horizon of the peaty podzolic gleyey soil of the<br />
middle taiga is three times higher than that in the northern taiga (158.6 and 53.6 ng/g,<br />
respectively). Distribution patterns of the most typical representatives of light (phenanthrene)<br />
and heavy (benzo[a]pyrene) PAHs in the soil profiles are shown in Fig. A predominance of<br />
phenanthrene in all the genetic horizons is typical of the studied soil profiles. Its portion in the<br />
total content of PAHs reaches 18–36% in the organic horizons and increases up to 86% in the<br />
mineral horizons with a low concentration of other PAHs. The absolute content of<br />
phenanthrene gradually decreases down the soil profile parallel to a decrease in the humus<br />
content. Benzo[a]pyrene is accumulated mostly in the organic horizons and does not migrate<br />
down the soil profile. Its relative content in the organic horizons reaches 4–6% of the total<br />
sum of PAHs; in the mineral horizons, this PAH is absent. The decrease in the degree of<br />
podzolization and the increase in the degree of gleyzation of peaty podzolic gleyey soils from<br />
the southern to northern taiga affect the accumulation and individual composition of PAHs in<br />
these soils. The highest concentrations of PAHs are seen in the organic horizon; the 5–6-<br />
ringed heavy polyarenes are mainly accumulated in the organic horizon (0–18 cm); their<br />
absolute and relative contents decrease below 20–30 cm, which attests to the low migration<br />
capacity of these compounds under conditions of a stagnic–percolative soil water regime. The<br />
predominant PAHs in the organic horizon of the peaty podzolic gleyey soil are the same as<br />
those in the organic horizon of the typical podzolic soil. The composition of the PAHs was<br />
<strong>Vol</strong>. 2 Page - 229 -
15th IHSS Meeting- <strong>Vol</strong>. 2<br />
confirmed with the method of chromate mass spectrometry. In the organic horizon, PAHs<br />
with molecular weights (Da) of 166 (fluorine), 178 (anthracene), 202 (fluoranthene, pyrene),<br />
228 (chrysene), 252 (benzo[a]pyrene, benzo[e]pyrene), and 278 (dibenzo[a,h]anthracene)<br />
were identified; PAHs with molecular weights of 166, 178, and 202 were identified in the<br />
mineral (A2hg and A2'g) horizons.<br />
4. Conclusions<br />
The following PAHs have been identified by the method of highly efficient liquid<br />
chromatography and chromato mass spectrometry in the background (unpolluted) soils of the<br />
northeastern part of European Russia: phenanthrene, anthracene, fluoranthene, pyrene,<br />
benzo[a]anthracene, chrysene, benzo[b]fluoranthene, benzo[k]fluoranthene, benzo[a]pyrene,<br />
dibenzo[a,h]anthracene, benzo[ghi]perylene, and indeno[1,2,3-cd]pyrene. The total content of<br />
PAHs is significantly higher in the organic horizons of the middle taiga soils than that in the<br />
northern taiga soils, though the mechanisms of the formation of polyarenes in course of<br />
pedogenesis are similar in both bioclimatic zones. The distribution of PAHs in the studied soil<br />
profiles has an eluvial–illuvial pattern. Light-fraction PAHs (phenanthrene, fluoranthene,<br />
pyrene, benzo[a]anthracene, and chrysene) migrate to the deeper horizons, while heavyfraction<br />
PAHs (benzo[a]pyrene, dibenzo[a,h]anthracene, benzo[ghi]perylene, and<br />
indeno[1,2,3-cd]pyrene) are mainly accumulated in the upper organic horizons. The<br />
maximum accumulation of PAHs takes place on the biogeochemical barriers represented by<br />
the organic horizon and the clay-enriched illuvial horizon. The most pronounced<br />
differentiation of PAHs in the soil profile is typical of the automorphic podzolic soils.<br />
Acknowledgements<br />
This work was supported by grant of the Russian Foundation for Basic Research (№ 07-04-<br />
00285).<br />
References<br />
1. D.N. Gabov, V.A. Beznosikov, B.M. Kondratenok, and D.A. Bushnev, Eur. Soil Sci., 37 (2004),<br />
p. 1156–1162.<br />
2. M. Blumer, Sci. Am., 234 (1976), p. 35–45.<br />
3. A.D. Campiglia and E.D. Hagestuen, Talanta, 49 (1999), p. 547–560.<br />
4. M. Ericsson and A. Colmsjo, J. Chromatogr. A., 964 (2002), p. 11–20.<br />
<strong>Vol</strong>. 2 Page - 230 -
15th IHSS Meeting- <strong>Vol</strong>. 2<br />
Specific Features of the st<strong>ru</strong>cture of humic substances of podzolic and peaty<br />
podzolic gleyey soils<br />
Evgeny Lodygin*, Vasyliy Beznosikov<br />
Institute of Biology of Komi Scientific Centre of the Ural Branch of the Russian Academy of<br />
Sciences, Kommunisticheskaya St. 28, Syktyvkar, 167982, Russia<br />
E-mail: lodigin@ib.komisc.<strong>ru</strong><br />
1. Introduction<br />
One of the pressing problems in fundamental knowledge about humic substances is a study of<br />
their st<strong>ru</strong>ctural and functional parameters, the transition from the fractional group composition<br />
to the molecular fragment level [1], and the creation of the theoretical basis of a science<br />
concerned with st<strong>ru</strong>cturally complex, natural high-molecular-weight substances of soils.<br />
Investigations of the principles of the st<strong>ru</strong>cture of humic substances makes possible a<br />
quantitative description of the st<strong>ru</strong>cture-molecular mass interrelation, which serves as the base<br />
for developing a theory of soil stability as well as the creation of substances (preparations)<br />
with a controllable composition and reproducible indices for their practical use in the field of<br />
environmental protection and agriculture [2, 3].<br />
The purpose of the investigations was to reveal the characteristics of the st<strong>ru</strong>ctural (qualitative<br />
and quantitative) composition of organic matter and concentration of free radicals of humic<br />
substances of podzolic and peaty podzolic gleyey soils of the middle taiga subzone of<br />
northeastern European Russia.<br />
2. Materials and Methods<br />
The investigations were carried out on virgin soils of a microcatena (typical podzolic, surface<br />
gleyey podzolic, peaty podzolic gleyey) laid out on the summit of the hill at the Maksimovskii<br />
Field Station of the Institute of Biology, 6 km west of the city of Syktyvkar. The high location<br />
of the catena in the relief permits assessing the effect of the degree of hydromorphism on<br />
individual attributes of soil humic substances. Preparations of humic and fulvic acids (HAs<br />
and FAs) were singled out in accordance with M.M. Kononova and N.P. Bel'chikova's<br />
method [4]. The elemental composition of HAs was determined on a CHNS-O-elemental<br />
analyzer EA 1110 (Italy). The 13 C-NMR spectra of preparations of humic substances were<br />
recorded on a B<strong>ru</strong>ker CXP-100 pulse NMR spectrometer with an operating frequency of<br />
25.18 MHz in a solid-phase CPMAS technique. For recording the EPR spectra of the<br />
<strong>Vol</strong>. 2 Page - 231 -
15th IHSS Meeting- <strong>Vol</strong>. 2<br />
preparations, we used a Radiopan SE/X2547 spectrometer. The physicochemical soil analyses<br />
were carried out by the conventional methods presented in works published earlier [5].<br />
3. Results and Discussion<br />
An analysis of the 13 C-NMR spectra of preparations of humic substances made it possible to<br />
single out the ranges of chemical shifts belonging to carbon atoms of various functional<br />
groups and molecular fragments of HAs and FAs [6, 7]. The relative content of carbon atoms<br />
of their main st<strong>ru</strong>ctural fragments was assessed by integrating the absorption lines in the<br />
appropriate ranges of chemical shifts.<br />
A comparative analysis of the molecular st<strong>ru</strong>cture of preparations of HAs and FAs showed:<br />
FAs are enriched with oxygen-containing fragments, which explains their better solubility in<br />
water and migration ability. The high content of carboxyl groups (up to 27.1 %) causes acid<br />
aggressiveness of FAs relative to soil minerals and the ability to form complex compounds<br />
with cations of iron, aluminum, and other metals, converting them into soluble forms. As a<br />
consequence of an increased amount of carbohydrate fragments (up to 23.2 %), FA molecules<br />
are subjected to greater degradation by soil microorganisms than HA molecules, which<br />
consist more than half of aliphatic chains and aromatic fragments.<br />
An assessment of functional groups and molecular fragments of HAs indicated substantial<br />
differences in their molecular composition on passing from the organogenic to the mineral<br />
horizon in all investigated soils. A high degree of aromaticity of humic substances of the<br />
upper horizons (A 0 and O 1 ) was noted. It was established as a result of comparing the<br />
molecular st<strong>ru</strong>cture of HAs of soils with a different degree of hydromorphism that HAs<br />
isolated from podzolic soil are enriched with aromatic fragments, unlike HAs of peaty<br />
podzolic gleyey soil. Furthermore, the relative content of oxygen-containing functional<br />
groups (–COOH, C ar =O, and –C=O) in their molecules from horizon A 0 toward A 1 A 2 h in<br />
podzolic soil increased. The content of analogous groups in the st<strong>ru</strong>cture of HAs of peaty<br />
podzolic gleyey soil decreased from horizon O 1 toward A 2 hg. The transition from typical<br />
podzolic toward peaty podzolic gleyey soils led to a decrease in the degree of aromaticity of<br />
FA preparations. The content of oxygen-containing groups increased by 14.5 % from horizon<br />
A 0 toward A 1 A 2 h in podzolic soil and decreased by 5.2 % in horizon O 1 compared with<br />
horizon A 2 hg in peaty podzolic gleyey soil.<br />
Thus, processes of humification of plant residues in automorphic podzolic soil occurred more<br />
intensely, which promoted the formation of aggressive HAs enriched with oxygen-containing<br />
<strong>Vol</strong>. 2 Page - 232 -
15th IHSS Meeting- <strong>Vol</strong>. 2<br />
functional groups with a high content of aromatic fragments. Humic substances of peaty<br />
podzolic gleyey soil have a lower degree of aromaticity and contain mainly unoxidized<br />
aliphatic fragments.<br />
The results obtained by the 13 C-NMR spectroscopy method were compared with the data of<br />
the elemental composition of HAs. It was established that HAs contain (wt %) 52.6–58.8<br />
carbon, 5.02–8.24 hydrogen, 2.01–3.83 nitrogen, and 30.3–39.3 oxygen. Characteristic for<br />
FAs are a lower content of carbon, nitrogen, and hydrogen, respectively, 40.2–45.6, 0.82–<br />
2.42, and 3.56–4.89 %, and increased content of oxygen, 47.7–54.5%.<br />
An analysis of the elemental composition of the preparations showed that HAs and FAs of<br />
typical podzolic soil are most humified, which causes a low value of the (H:C) evap atomic ratio<br />
and a high O:C ratio. A decrease of the (H:C) evap ratio indicates an increase of the proportion<br />
of aromatic fragments in the st<strong>ru</strong>cture of HAs on passing from the organogenic to the mineral<br />
horizons in all investigated soils. According to the result of calculating the degree of<br />
oxidation, HAs of podzolic and peaty podzolic gleyey soils are weakly reduced (degree of<br />
oxidation from –0.91 to –0.09), whereas for FAs it is 0.40–0.76, i.e., they are weakly oxidized<br />
compounds. A graphic statistical analysis by van Krevelen's method confirmed a high degree<br />
of oxidation and lower degree of carbonization of FAs compared with HAs, which indicates<br />
considerable substitution of aromatic rings and development of aromatic side chains.<br />
According to the literature data, both zonal bioclimatic and anthropogenic factors strongly<br />
affect the concentration of free radicals in humic compounds [8]. The EPR spectroscopy<br />
method was used for assessing the effect of the degree of hydro morphism on paramagnetic<br />
properties of HA and FA preparations extracted from podzolic and peaty podzolic gleyey<br />
soils. An intense broad line with magnetic splitting factor g = 2.003 was identified on spectra<br />
of all investigated preparations, which indicated the presence of free radical in the st<strong>ru</strong>cture of<br />
humic substances. The g-factor obtained is close to its value for a free electron (g = 2.0023)<br />
and indicates a strongly delocalized molecular orbital or a state in which the orbital<br />
component of the molecular moment of the electron is close to zero [9].<br />
The number of paramagnetic centers in HAs is 1.5–5 times great than in FAs, i.e., HAs are<br />
more capable of polymerization and complexation reactions by the radical mechanism. In the<br />
three-component complex of the soil cover st<strong>ru</strong>cture (typical podzolic-podzolic surface<br />
gleyey-peaty podzolic gleyey soils), a similarity of podzolic surface gleyey and typical<br />
podzolic soils in content of paramagnetic centers in HA and FA preparations was found,<br />
which is due to the similar biohydrothermic conditions of formation of humic substances. A<br />
<strong>Vol</strong>. 2 Page - 233 -
15th IHSS Meeting- <strong>Vol</strong>. 2<br />
decrease of free radical content in HA preparations across the profile or great<br />
biothermodynamic stability of HA molecules of mineral horizons compared with HAs of<br />
organogenic horizons was established for all soils.<br />
Acknowledgements<br />
This work was supported by grant of the Russian Foundation for Basic Research (№ 07-04-<br />
00285).<br />
References<br />
1. A.D. Fokin, D.A. Knyazev and Ya.Y. Kuzyakov, Eura. Soil Sci., 25 (1993), 109–122.<br />
2. L.V. Perminova, F.H. Frimmel, D.V. Kovalevskii, G. Abbt-Braun, A.V. Kudryavtsev and<br />
S. Hesse, Water Res., 32 (1998),. 872–881.<br />
3. E.D. Lodygin, VA. Beznosikov and S.N. Chukov, in I.V. Zaboeva (Ed.), St<strong>ru</strong>ctural and<br />
Functional Parameters of humic Substances of Podozlic and Bog-Podzolic Soils, Nauka,<br />
St. Petersburg, 2007, 145 (in Russian).<br />
4. M.M. Kononova and N.P. Bel'chikova, Pochvovedenie, 10 (1961), 75–87. (in Russian).<br />
5. E.D. Lodygin and V.A. Beznosikov, Geoderma, 127 (2005), p. 253–262.<br />
6. J.W. Emsley, J. Feeney and L.H. Sutcliffe, High Resolution Nuclear Magnetic Resonance<br />
Spectroscopy, Pergamon Press, 1966, 630 p.<br />
7. B.C. Liang, E.G. Gregorich, M. Schnitzer and H.R. Shulten, Soil Sci. Soc. Amer. J., 60<br />
(1996), 1758–1763.<br />
8. S.N. Chukov, Euras. Soil Sc., 31 (1998), 979-986.<br />
9. J.E. Wertz and J.R. Bolton, Electron spin resonance: Elementary theory and Practical<br />
Applications, McGraw Hill, New York, 1972, 548 p.<br />
<strong>Vol</strong>. 2 Page - 234 -
15th IHSS Meeting- <strong>Vol</strong>. 2<br />
Carbon of Particulate Organic Matter Fraction in Differently Managed<br />
Agricultural Soil<br />
Inga Liaudanskiene a , Alvyra Slepetiene a *, Aleksandras Velykis b<br />
a Institute of Agriculture, Instituto al.1, Akademija, Kedainiai distr., LT 58344, Lithuania;<br />
b Joniskelis Research Station of the Institute of Agriculture, Joniskelis, Pasvalys distr., LT<br />
3930, Lithuania<br />
E-mail: alvyra@lzi.lt<br />
Summary<br />
A field experiment was established on a glacial lacustrine clay loam on a silty clay<br />
Endocalcari-Endohypogleyic Cambisol. The study investigated two soil tillage systems:<br />
conventional (CT) and sustainable (ST). The study also encompassed crop rotations with<br />
different st<strong>ru</strong>ctures: 0, 25, 50, 75 and 100% of winter crops in a crop rotation. The content of<br />
particulate organic matter carbon (C POM ) was significantly higher in the topsoil layer at<br />
sustainable tillage compared with conventional tillage. Carbon of the POM was highly related<br />
with carbon of humic and fulvic acids fractions (C HA1 ; C HA2 ; C ΣHA ; C ΣFA ; C ΣHA+FA ).<br />
1. Introduction.<br />
The quantity and quality of soil organic matter provides an important diagnostic link between<br />
management and sustainability of soil function [1]. However, there is no consistent opinion on<br />
the effect of sustainable tillage and st<strong>ru</strong>cture of the crop rotation on the carbon of the POM.<br />
2. Materials and Methods.<br />
Experiment was designed to study the feasibility of extension of winter crop area in the crop<br />
rotation and soil tillage systems. The design was: Factor A. Crop rotations with different area<br />
of winter and spring crops: 1. Without winter crops (1. Annual grasses; 2. Spring wheat; 3.<br />
Spring triticale; 4. Spring barley). 2. 25% winter crops (1. Perennial grasses; 2. Spring wheat;<br />
3. Spring triticale; 4. Spring barley, undersown crop). 3. 50% winter crops (1. Perennial<br />
grasses; 2. Winter wheat; 3. Spring triticale; 4. Spring barley, undersown crop). 4. 75% winter<br />
crops (1. Perennial grasses; 2. Winter wheat; 3. Winter triticale; 4. Spring barley, undersown<br />
crop). 5. 100% winter crops (1. Perennial grasses; 2. Winter wheat; 3. Winter triticale; 4.<br />
Winter barley, undersown crop). Factor B. Soil tillage systems: 1. Conventional (primary soil<br />
tillage is mouldboard ploughing). 2. Sustainable (after grasses, the soil for wheat is ploughed<br />
using a mouldboard plough; after cereals ploughless soil tillage is applied for all crops). Soil<br />
analysis were done at the LIA’s Chemical Research Laboratory. Particulate organic matter<br />
<strong>Vol</strong>. 2 Page - 235 -
15th IHSS Meeting- <strong>Vol</strong>. 2<br />
was isolated according to Franzluebbers and Stuedemann [2]. Carbon content and C:N of<br />
POM was determined using elemental analyser Vario EL III.<br />
3. Results and Discussion<br />
The content of particulate organic matter carbon (C POM ) was significantly higher in the topsoil<br />
layer at ST compared with CT, 1.58 g kg -1 and 1.33 g kg -1 respectively (+8.8 % in relative<br />
value) [Table 1]. Increasing proportion of winter crops in the crop rotation increased POM<br />
content and C POM . At the ST C:N ratio in this fraction was significantly lower in the bottom<br />
soil layer compared with CT.<br />
Table 1: The influence of soil tillage systems and crop rotation st<strong>ru</strong>cture on the C POM content g kg -1 of<br />
soil. Averaged data of 2004 and 2006<br />
Proportion of<br />
Soil tillage system (B)<br />
Mean across<br />
winter crops, Depth<br />
proportion of<br />
% (A) (cm) Conventional Sustainable<br />
winter crops (A)<br />
0<br />
0–15 1.10 1.47 1.29<br />
15–25 0.80 0.84 0.82<br />
25<br />
0–15 1.29 1.53 1.41<br />
15–25 0.94 0.94 0.94<br />
50<br />
0– 15 1.32 1.53 1.42<br />
15–25 1.06 1.02 1.04<br />
75<br />
0– 15 1.42 1.58 1.50<br />
15–25 1.15 1.03 1.09<br />
100<br />
0–15 1.53 1.81 1.67<br />
15–25 1.19 1.06 1.13<br />
Mean across 0–15 1.33 1.58<br />
tillage (B)<br />
15–25 1.03 0.98<br />
LSD 05 0–15 cm 15–25 cm<br />
A 0.058 0.031<br />
B 0.029 0.015<br />
AB 0.088 0.046<br />
4. Conclusions<br />
Particulate organic matter fraction, important in macroaggregate formation, accumulated more<br />
in the topsoil layer. Increasing proportion of winter crops in the crop rotation increased POM<br />
content and C POM . Carbon of the POM was highly related with carbon of humic and fulvic<br />
acids fractions (C HA1 ; C HA2 ; C ΣHA ; C ΣFA ; C ΣHA+FA ).<br />
References<br />
1. Franzluebbers A.J., Stuedemann J.A. // Soil & Tillage Research 66 (2002), 95–106.<br />
2. J. L. Pikul, Jr.Sh. Osborne, M. Ellsbury, W. Riedell // SSSAJ 71 (2007), 766–776.<br />
<strong>Vol</strong>. 2 Page - 236 -
15th IHSS Meeting- <strong>Vol</strong>. 2<br />
Humic Substances and Their Information Importance in Biosphere<br />
Maria Dergacheva<br />
Institute of Soil Science and Agrochemistry SB RAS, Sovetskaya str., 18, Novosibirsk,<br />
Russia<br />
E-mail: mid555@yandex.com<br />
1. Introduction<br />
The processes occurring in the biosphere have resulted to appearing specific carbonic<br />
compounds – humic substances which in soils and ecosystems do a row of functions<br />
participating in life supplying on the Earth. One of the main biosphere functions of humus<br />
like that of soil is to create conditions less depending on environment functioning that<br />
provides more sustainability of plant communities. Another not less important function of<br />
humus substances is their participation in formation of soil humus memory which promotes<br />
preservation of the information on ecosystem forming conditions and functioning. Among soil<br />
humus substances three main groups are distinguished: humic acids, fulvic acids and humin<br />
which are tightly connected by the processes of interactions and stream of substances, energy<br />
and information. Combination of humus substances presents a system. This is compound<br />
natural system of the molecules of organic (biogenic) and non-organic (non-biogenic) origin.<br />
The system self-const<strong>ru</strong>cting leads to nanoparticles formation presenting dissipative organicmineral<br />
systems or associations of some chemical particles united in the systems due to<br />
intermolecular non-valency interactions. Since humus is a system, it reflects changes in<br />
environment in its interior states. This appears in its composition and st<strong>ru</strong>cture peculiarities of<br />
humus substances. But reflecting the environment in its interior states humus substances code<br />
the information on external conditions in their composition, st<strong>ru</strong>cture and properties and keep<br />
some part of this information in time. In particular humic acids reflect peculiarities of their<br />
forming conditions coding combination of water and warm supplying in their composition<br />
and st<strong>ru</strong>cture. All abovementioned statements and also principles and <strong>ru</strong>les of information<br />
decoding about environment, coded in humic acids st<strong>ru</strong>cture have been described earlier [1-<br />
3]. The purpose of the paper is to demonstrate the possibilities of using humic acids and their<br />
ratios to other humus components as a source of environment information and its changes.<br />
2. Material and methods<br />
Humic acids were extracted from modern soils and Pliocene-Holocene paleosols. General<br />
standard method was used for receiving of humic acids preparations [4]. Preparation receiving<br />
<strong>Vol</strong>. 2 Page - 237 -
15th IHSS Meeting- <strong>Vol</strong>. 2<br />
included the following steps: soils were released from calcium; the humic acids were<br />
extracted 0,1 N NaOH and precipitated with 2N HCl; the precipitations were separated with<br />
centrifuge, dissolved once more and precipitated with 2N HCl again. Additional purification<br />
with HF and/or 6N HCl was not carried out as preparation purification from mineral<br />
components by these reagents diminishes differences between humic acids different forming<br />
conditions [5]. Besides, share and composition of humic mineral components have clear<br />
connection with ecological conditions of their formation.<br />
There were studied humic acid preparations having been formed under different ecological<br />
conditions on continental Eurasian. Element composition, ratio of their hydrolyzed and nonhydrolyzed<br />
parts, contents and composition of mineral elements in humic acids were<br />
determined. Humic acid st<strong>ru</strong>cture peculiarities were also investigated by 13 C NMR.<br />
All paleosols and/or their forming conditions were preliminary diagnosed by different<br />
paleogeographic methods. After that the data characterizing humic acids composition and<br />
st<strong>ru</strong>cture were generalized. Then humic acids both of paleosols and modern soils were<br />
compared and analogues between them were found.<br />
3. Results and Discussion<br />
Humic acids are the most specific part of humus substance system, their amount correlate<br />
closely with temperature conditions of their forming [6]. For soils of Siberian highlands this<br />
correlation is described by the equation: ΣHA(%)=29.497+1.402·T(С ◦ ), where ΣHA – the<br />
sum of humic acids, %; T – the mid-annual air temperatures, C ◦ .<br />
The basic parameters of composition, st<strong>ru</strong>ctural features and properties of modern soil humic<br />
acids have close correlations with climate characteristics (tab. 1– 2, fig. 1) and landscape<br />
conditions as a whole (table 3).<br />
As it is seen from the given data, main soil humic acids of different landscape zones have got<br />
rather specific average statistical fluctuation limits of H:C value. Humic acid preservation in<br />
diagenesis is illustrated by similarity of Н:С average values in modern soils and similar to<br />
them paleosols, which have been diagnosed by a complex of paleogeographical and<br />
geoecological independent methods (fig. 2).<br />
<strong>Vol</strong>. 2 Page - 238 -
15th IHSS Meeting- <strong>Vol</strong>. 2<br />
Table 1: Coefficients of correlation humic acids parameters and ∑ t>10°C<br />
Humic acid parameters Coefficient of<br />
correlation<br />
Humic acid<br />
parameters<br />
Coefficient of<br />
correlation<br />
aliphatic carbon (C), % +0.68 Loss of HA mass at –0.67<br />
t°C: 20-200°<br />
polysaccharide C, % –0.54 200-300° –0.92<br />
aromatic carbon, % +0.84 300-400° –0.74<br />
carbon of COOH, % –0.17 400-500° –0.36<br />
Atomic %: С +0.82 500-600° +0.78<br />
H –0.90 20-400° –0.89<br />
N +0.65 400-700° +0.79<br />
O +0.63<br />
Hydrolyzed 6 N +0.88<br />
H:C –0.90<br />
HCl part, mass%<br />
C:N +0.40 Hydrolyzed 6 N<br />
HCl part, mass%<br />
–0.82<br />
Table 2: Connection of humic acids H:C and period with t>10°C of Yakutia alas soils<br />
Soil zones of Alas Period with t>10°C, days H:C of HA<br />
Alas marshy soils 65-70 1,39±0,05<br />
Alas meadow soils 75-80 1,21±0,05<br />
Alas steppe-like soils 85-95 1,10±0,02<br />
H:C<br />
1.8<br />
1.6<br />
1.4<br />
1.2<br />
1.0<br />
0.8<br />
0.6<br />
0.4<br />
60 80 100 120 140 160 180<br />
PBA, d a ys<br />
Figure 1: Connection of humic acids H:C with biological activity period<br />
Table 3: Humic acid characteristics of A1 modern soil horizon of Western Siberia different landscapes<br />
(limits for 8-12 objects)<br />
Landscapes Н:С Non-hydrolyzed<br />
6 n HCl part, %<br />
Aliphatic<br />
carbon<br />
Aromatic<br />
carbon<br />
Tundra 1.32 – 1.58 20 – 45 47 – 60 18 – 26<br />
Taiga 1,03 – 1,29 48 – 55 35 – 57 20 – 30<br />
Wooded steppe 0,89 – 0,98 56 – 65 24 – 30 45 – 50<br />
Steppe 0,75 – 0,90 64 – 75 12– 26 50 – 65,<br />
Dry steppe 0,58 – 0,75 74 – 82<br />
<strong>Vol</strong>. 2 Page - 239 -
15th IHSS Meeting- <strong>Vol</strong>. 2<br />
1,5<br />
Mean Plot (KSGAраб 32v*255c)<br />
1,5<br />
1,4<br />
1,4<br />
1,3<br />
1,3<br />
1,2<br />
1,2<br />
1,1<br />
1,1<br />
H:C<br />
1,0<br />
H:C<br />
1,0<br />
0,9<br />
0,9<br />
0,8<br />
0,8<br />
0,7<br />
0,7<br />
А<br />
0,6<br />
1 2 3 4 5<br />
LANDSCH<br />
Средство<br />
±0,95 Conf. Interval<br />
B<br />
0,6<br />
1 2 3 4 5<br />
LANDSCH<br />
Средство<br />
±0,95 Conf. Interval<br />
Figure 2: Average statistic fluctuation limits of H:C ratio within humic acids of modern soils (A) and<br />
some paleosols of Gorny Altai which were diagnosed by a complex of independent paleogeographical<br />
and geoecological methods (B)<br />
4. Conclusions<br />
Natural open self-adjustable system of humus substances plays an essential information role<br />
as a source of data on forming conditions in the biosphere<br />
The ability specific to humic substances to preserve information on environment of their<br />
formation is the matter of great importance while solving applied problems concerned<br />
necessity of environment retrospective analysis and basing forecasts of its behaviour in the<br />
nearest and remote prospects.<br />
References<br />
1. M.I. Dergacheva, Organic matter of soils: static and dynamic, Siberian Branch of Russian<br />
Academy of Science, Novosibirsk, Russia, 1984, 151. (in Russian).<br />
2. M.I. Dergacheva, System of humus substances: space and time aspects, Siberian Branch<br />
of Russian Academy of Science, Novosibirsk, Russia, 1989, 110 (in Russian).<br />
3. M.I. Dergacheva, Soil memory: soil as a Memory of Biosphere-Geosphere-Antroposphere<br />
Interactions. Moskow: LKI Publishers, 2008, Pp. 530–560 (in Russian).<br />
4. D.S. Orlov, L.A. Grishina. Practical work in chemistry of humus, MGU publish, 1981,<br />
270.<br />
5. V. D. Tikhova, V. P. Fadeeva, M. I. Dergacheva, M. M. Shakirov, Russian J. of Applied<br />
Chemistry, 81 (2008), 11, 1841<br />
6. M.I. Dergacheva, N.N. Ryabova, Bulletin of Tomsk State University, 15 (2005), 68<br />
<strong>Vol</strong>. 2 Page - 240 -
15th IHSS Meeting- <strong>Vol</strong>. 2<br />
The Features of <strong>Humus</strong> St<strong>ru</strong>cture of Locally Hydromorphic Chernozems of<br />
the South of Russia<br />
Svetlana. A. Tischenko *, Olga S. Bezuglova<br />
a The Southern Federal University, 105, B.Sadovaya, Rostov-on-Don, Russia<br />
E-mail: stischenko@mail.<strong>ru</strong><br />
1. Introduction<br />
During the last decades soils in a steppe zone are characterized by development of some<br />
degradation processes. Special place among them occupies process of expansion of areas of<br />
soils periodically saturated with water. This phenomenon is paradoxial for a steppe zone<br />
which is in most cases characterized by insufficient humidifying. Expansion of areas of the<br />
locally hydromorphic soils is connected to replacement initial automorphic soils on<br />
hydromorphic soils which has a low level of fertility The local water saturating of the soil<br />
profile influences on the genesis of gleic or solonetzic soils. Transformation occurs quickly<br />
and results in complication of soil cover st<strong>ru</strong>cture. It necessary to note, that the given<br />
phenomenon is distributed on soils, which is situated outside of irrigating territories.<br />
2. Materials and Methods<br />
The soil sample used in this study was collected from an agricultural field. The object of<br />
research was the ordinary calcareous chernozems with a different duration of waterlogging.<br />
The total humus content was obtained by wet combustion method with spectrophotometric<br />
finishing [1]. The definition of group and fractional st<strong>ru</strong>cture of soil humus were determined<br />
according to the method of Ponomareva and Plotnikova. [5].<br />
3. Results and Discussion<br />
The humidifying of chernozems is accompanied by change of humus conditions. As various<br />
authors [2, 3 ,4] and our earlier investigation have shown increase in of the content of the<br />
common carbon in humus profile. Many soils pass from a category powerful in a category<br />
super powerful thanks to ability of the humic substances to migrate down of the soil profile.<br />
There are statistical confidence of increase of common carbon content in investigated soils (in<br />
1, 5-2 times in comparison with non-waterlogging chernozem). The significant humus<br />
accumulation is related with deceleration of mineralization processes and occurrence greater<br />
quantity of another type of the vegetation. Character of profile distribution of humus is<br />
changed too. Development of the local humidifying causes in some cases sharp decrease of<br />
<strong>Vol</strong>. 2 Page - 241 -
15th IHSS Meeting- <strong>Vol</strong>. 2<br />
humus quantity on depth from 30 up to 50 cm. Some humus accumulation is often found out<br />
in an average part of soil profile. The qualitative of humus st<strong>ru</strong>cture of waterlogging<br />
chernozems also undergoes changes. The changes of the ecological conditions direct<br />
transformation on a way of increase in stability rise of chernozems. The simplification of the<br />
st<strong>ru</strong>ctures of humic acids molecules and fastening of humus by soil mineral part are found<br />
out. The following tendencies in changes of humus st<strong>ru</strong>cture of the hydromorphic soils in<br />
comparison with chernozems are carry out. The increase of fulvic acids amount and reduction<br />
of humic acids amount are found out. The reduction of the ratio humic acids to fulvic acids is<br />
reveal. The reduction of the share non-hydrolyzed part of humus is also observed. In<br />
fractional st<strong>ru</strong>cture the relative accumulation of mobile humus fractions was observed, but in<br />
some cases there was a lack of it. The substantial growth of humic acids strongly related to<br />
clay minerals were found that indicate fastening of humus by soil minerals. This increasing<br />
will be defined by transformation of soil mineralogical st<strong>ru</strong>cture caused by waterlogging. At<br />
the same time the content of humic acids related with calcium changes in small limits.<br />
Probably it occurs because such humic acids are possessed of high stability in consequence of<br />
the chemical nature. In general, the degree of humus change depends not only on duration and<br />
intensity of waterlogging, but also from a primary condition of humus substances system.<br />
4. Conclusions<br />
Change of properties and rezimes of chernozems after waterlogging goes on the certain way,<br />
irrespective of features of the soil formation factors and the humidifying reasons. The degree<br />
of soil change directly depends on duration of waterlogging condition and partly from initial<br />
state of chernozems.<br />
References<br />
1. D.S. Orlov, L.A. Grishina The practical work in humus chemistry. Moscow, Publishing<br />
house of the Moscow State University 1981, 271 p. (in Russian) .<br />
2. K.S. Kazeev, S.E. Fomin, S.I. Kolesnikov, V.F. Val’kov Eurasian Soil Sci. J. 3, (2004)<br />
361–372.<br />
3. L.P. Ilyina The humus state of mochar soils of the Eastern Donbass. Author's abstract of<br />
thesis on a competition of Cand. Agricul. Sci. Degree, Krasnodar, (1995) pp. 21. (in<br />
Russian).<br />
4. O.S. Bezuglova, O.G. Nazarenko, Eurasian Soil Sci. J. 12, (1998) 1423–1430.<br />
5. V.V. Ponomareva, T.A. Plotnikova, The definition of group and fractional st<strong>ru</strong>cture of<br />
soil humus according to the scheme N.V.Tyurin in: Ponomarevoj, V. V., Plotnikovoj, T. A.<br />
(Eds.): The Agrochemical Methods of Soil Research. Moscow: Publishing House<br />
«Science», 1975, pp. 47-55. (in Russian) .<br />
<strong>Vol</strong>. 2 Page - 242 -
15th IHSS Meeting- <strong>Vol</strong>. 2<br />
Distribution of 14 C-Pentachlorophenol Residues in Different Organic<br />
Carbon Fractions of Soils<br />
Haizhen Wang a, b, c, d , Scott R. Yates c, d , Jay Gan d , Jianming Xu a, b* , Jincai Ma c, d<br />
a<br />
Institute of Soil and Water Resources and Environmental Science, Zhejiang University,<br />
Hangzhou 310029, China; b Zhejiang Provincial Key Lab of Subtropical Soil and Plant<br />
Nutrition, Hangzhou 310029, China; c USDA-ARS, U.S. Salinity Laboratory, Riverside, CA<br />
92507, USA; d Department of Environmental Sciences, University of California, Riverside,<br />
CA 92521<br />
E-mail: jmxu@zju.edu.cn<br />
1. Introduction<br />
Pentachlorophenol (PCP) was widely used as a pesticide, herbicide, and disinfectant, which<br />
led to severe PCP contamination problems [1]. It has been recognized as a priority pollutant<br />
because of its toxicity and persistence in the environment [2]. Previous studies have focused<br />
on the adsorption, degradation, remediation, and ecotoxicity of PCP in the environment [3–7],<br />
however, little information is available on the distribution of PCP residues in soils. In this<br />
study, we investigated the dynamics of 14 C-PCP residues distribution in different soil organic<br />
matter (SOM) fractions of five soils. The findings would be helpful to better evaluate the fate<br />
and assess the potential ecological risk of PCP in soil.<br />
2. Materials and Methods<br />
Five soils were sampled at a depth of 0–20 cm from the uncultivated sites of eastern China.<br />
The soil samples were incubated under 21±1 o C with soil moisture contents of 40% water<br />
holding capacity, and the initial 14 C-PCP concentration of 5 mg/kg soil. Liquid scintillation<br />
counter was used to analyze the radioactivity of 14 C-PCP residues in the different soil organic<br />
carbon fractions, including water soluble organic carbon (WSOC), fulvic acid (FA), humic<br />
acid (HA), and humin. Soil basic properties were measured according to routine methods.<br />
3. Results and Discussion<br />
The results showed that the affinity of SOM fractions to 14 C-PCP residues vary greatly. The<br />
amounts of 14 C-PCP residues in soil organic components increased in the order of humin >><br />
FA, HA>WDOC. The 14 C-PCP residues in WDOC decreased rapidly over the incubation<br />
period of 210 days, while the amount of 14 C-PCP residues in humin increased significantly<br />
within the same incubation time. The amounts of 14 C-PCP residues in FA steadily increased<br />
until 126 days followed by a slight decrease thereafter. The highest amounts of 14 C-PCP<br />
residues in HA were observed at the 21–56 days after application. Lower bioactivity and<br />
<strong>Vol</strong>. 2 Page - 243 -
15th IHSS Meeting- <strong>Vol</strong>. 2<br />
longer persistence of PCP residues in soil was observed when the residues bound to soil<br />
humus, especially to soil humin fraction. In contrast to the dynamics of metsulfuron-methyl<br />
residues in soil humus [8], more PCP residues were associated with soil humin and HA. The<br />
amounts of PCP residues bound to SOM, especially to humin fraction, is the most important<br />
factor to dominate the persistence of PCP in the environment.<br />
Stepwise multiple regression analysis of 14 C-PCP residue and soil properties revealed that the<br />
distribution of 14 C-PCP residues in soil organic fractions was controlled by different soil<br />
properties. The distribution of 14 C-PCP residues in WDOC fraction was positively correlated<br />
to soil pH, sand content and WDOC content. Free Fe 2 O 3 , WDOC, and MBC (microbial<br />
biomass carbon) play important role in the distribution of 14 C-PCP residues in FA fraction;<br />
while soil pH, amorphous Fe 2 O 3 , and HA are major factors affecting the distribution of 14 C-<br />
PCP residues in HA fraction. The distribution of 14 C-PCP residues in humin fraction was<br />
significantly influenced by TOC, amorphous Fe 2 O 3 , and surface area.<br />
4. Conclusions<br />
The distribution of PCP residues in soils varied with SOM fractions and soil properties, it was<br />
strongly correlated to soil pH, SOM, ferric oxides, and surface area. The fact that the stronger<br />
binding capacity of PCP residues to humin and the longer persistence of PCP residues in<br />
humin, would enhance the accumulation of PCP residues in soil and increase their potential<br />
ecological risk in the environment.<br />
Acknowledgements<br />
This research was supported by the National Natural Science Foundation of China (Nos.<br />
40701075, 20977077), the National Basic Research Program of China (2005CB121104), and<br />
Science and Technology Project of Zhejiang Province (2009C33119, 2008C13024-3).<br />
References<br />
1. R. McGrath and I. Singleton. Soil Biol. Biochem., 32 (2000) 1311.<br />
2. U.S. Environmental Protection Agency. 1980. Health and Environmental Effects Profile<br />
No. 135. Washington, DC.<br />
3. Y. He, J.M. Xu, H.Z. Wang, et al. Chemosphere, 65 (2006) 497.<br />
4. Y. He, J.M. Xu, H.Z. Wang, et al. Environ. Res., 101 (2006) 362.<br />
5. M. Cea, J.C. Seaman, A. Jara, et al. Chemosphere, 78 (2010) 86.<br />
6. B. Wen, R.J. Li, S.Z. Zhang, et al. Environ. Pollut., 157 (2009) 968.<br />
7. 7. Y.He, J.M. Xu, X.F. Lv, et al. Soil Biol. Biochem., 41 (2009)1807.<br />
8. 8. H.Z. Wang, J.M. Xu, Z.M. Xie, et al. Acta Scientiae Circumstantiae, 22 (2002) 257.<br />
<strong>Vol</strong>. 2 Page - 244 -
15th IHSS Meeting- <strong>Vol</strong>. 2<br />
Evaluation of SOM in different size fractions in Mexican soils<br />
Amelia Moyano Gardini a , Claudia Hidalgo M. a * and Jorge Etchevers a,b<br />
a<br />
Universidad de Valladolid, Campus Universitario, 42004 Soria, España; b Colegio de<br />
Postgraduados, Laboratorio de Fertilidad de Suelos y Química Ambiental, 56230 Montecillo,<br />
México<br />
E-mail: hidalgo@colpos.mx<br />
1. Introduction<br />
A better understanding of the key processes that control the stabilization of carbon (C) in soil<br />
at spatial and temporal scales is fundamental for a clearer notion of this element's cycle<br />
(Percival et al., 2000).<br />
The physical and chemical stabilization of C has been associated with changes in the turnover<br />
time of organic matter (OM) (Wattel-Kookkoer et al., 2003). This is a major factor to be<br />
defined in the studies currently being undertaken on the issue of carbon sequestration and<br />
climate change. Texture has been considered to be a key factor in controlling the physical<br />
stabilization of C in the soil (Percival et al., 2000). Approximately 30 to 60 % of C in the soil<br />
is located in the clay-sized fraction (< 2 μm) forming clay-organic associations (Chenu et al.,<br />
1998), and the secondary organic-mineral associations are involved in the physical protection<br />
of OM by occlusion (Christensen, 1996). However, it is difficult to find unambiguous<br />
evidence confirming the major role of clay in the stabilization of OM (Oades, 1988). Theng<br />
(1979) pointed to associations of OM with silt and clay particles as key factors of its physical<br />
protection. The high correlations between total C and silt+clay fractions were used to define<br />
the protective capacity and the maximum amount of C stabilized in the soil by Hassink (1997)<br />
and Hassink and Whitmore (1977). For these reasons it is important to continue studying the<br />
associations of OM and silt and clay fractions to define the exact relationship between the<br />
two. The aim of this study was to obtain humic acids (HA), fulvic acids (FA) and humins (H)<br />
of clay and silt fractions from six Mexican soils, with different physical, chemical and<br />
mineralogical characteristics and under two different soil use and management systems.<br />
2. Materials and Methods<br />
This research involved studies conducted two geographical areas in Central and Southern<br />
areas of Mexico (Báez, 2007; Estrada, 2003). In the first area selected, in the central part,<br />
three soils were sampled: Cambisol epidistric (La Cortina), Acrisol distric (Atécuaro) (FAO-<br />
ISRIC-SICS, 1998) and a Tepetate (Tlalpan, see Etchevers et al. 2006). In these three sites the<br />
<strong>Vol</strong>. 2 Page - 245 -
15th IHSS Meeting- <strong>Vol</strong>. 2<br />
management treatments sampled were: traditional cropping (TC) and organic (OC). In the<br />
second area, located in the State of Oaxaca, three Ferralic soils (non-volcanic) were sampled:<br />
Humic-Ferralic, Ortieutric-Ferralic and Umbrihumic-Ferralic (Estrada 2003). In these cases<br />
the management treatments sampled were: traditional cropping (TC) and forests (F).<br />
Sampling was conducted in the uppermost 20 cm; soils were air dried, homogenized, sieved<br />
to 2 mm and stored. The fractions obtained by Baez (2007) and Estrada (2003) by applying<br />
ultrasonic energy (at 910 and 1.365 J mL -1, power output 37.3 W) were used. These authors<br />
obtained four physical fractions: coarse sand (> 250 µm), fine sand (50–250 µm), silt (2–50<br />
µm) and clay (0–2 µm), after removing the light fraction (LF w , floatable in water). In the<br />
present study only clay and silt-fractions ultrasonically obtained were used. Clay, silt and<br />
particle-size fine sand were obtained by gravity sedimentation applying the Stoke’s law at<br />
room temperature with a solid density of 2.65 Mg m -3 .<br />
The fractioning of OM in HA, FA and H was performed using the classic approach to this<br />
end, based on the solubilization in acidic or alkaline environments. To extract the AF + AH an<br />
extracting solution of NaOH+Na 4 P 2 O 7·10H 2 O NaOH + 0.1 M adjusted to pH 10 was used; the<br />
residue of this operation corresponded to humins. Subsequently acidification with HCl 0.1M<br />
and 0.01 M from the solution obtained above, to obtain a pH value below 2, allowed to<br />
solubilize the AF. The residue of this stage was solubilized with 0.1 M NaOH to separate the<br />
AH. The total carbon of the three organic fractions was determined with an automatic carbon<br />
analyzer (TOC-Shimadzu).<br />
3. Results and Discussion<br />
The amount of C measured in the silt and clay fractions and organic fractions (AH, AF, H) are<br />
presented in Table 1. In all cases the amount of C present in both size fractions (clay and silt)<br />
was similar, indicating that the type of management does not lead to significant changes in the<br />
accumulation of carbon. Higher percentages of C were found in the AH fractions than in the<br />
AF one. In the clay fraction, most of the OM is presented as part of the more labile fractions<br />
such as AH and AF. A small C percentage was found in the H fraction irrespective of the soil<br />
type and management, being the exception the soils from the Mixe and La Cortina sites.<br />
Only in the case of Andosol (La Cortina) and the Mixe site C is present in a small amount as<br />
part of the more stable fraction (H). This behavior was not influenced by management, since<br />
both in the LT and in the forest or organically managed sites the same situation occurred. This<br />
contrasts with the fragmentation of OM in the silt since in the case of all soils C is present in<br />
fraction H, the most stabilized.<br />
<strong>Vol</strong>. 2 Page - 246 -
15th IHSS Meeting- <strong>Vol</strong>. 2<br />
Table 1: Carbon in silt and clay-fractions and carbon in humic (HA), fulvic (FA) and humins (H)<br />
isolated from the clay fraction in soils from traditional cropping, organic and forest managements.<br />
Site Silt Clay HA FA H<br />
g kg-1<br />
Traditional<br />
Mixe 113 138 46.7 21.1 59.4<br />
Cuicateca 23 30 23.8 3.2 T<br />
Mazateca 33 36 30.7 5.3 T<br />
Atécuaro 27 17 11.9 3.1 T<br />
Tlalpan 7 10 9.3 0.7 T<br />
La Cortina 57 54 25.0 10.0 22.0<br />
Forest<br />
Mixe 59 66 35.0 14.0 17.0<br />
Cuicateca 28 35 17.1 4.2 T<br />
Mazateca 39 45 36.0 9.0 T<br />
Organic<br />
Atécuaro 29 19 13.5 3.4 T<br />
Tlalpan 5 7 31.7 1.2 T<br />
La Cortina 58 52 38.2 8.9 21.4<br />
4. Conclusions<br />
This indicates that OM is more stable in the silt than in the clay fraction. This could point to<br />
the stabilizing function of larger aggregates in the soil, allowing C preservation, which is<br />
desirable regarding the capture of C in the soil.<br />
Acknowledgements<br />
Our thanks to CONACYT (Mexico), the European Union (REVOLSO Project) and the World<br />
Bank (PMSL Project) for partially funding this study.<br />
References<br />
1. 1. H. J. Percival, R.L. Parfitt and N A. Scott. Soil Sci. Soc. Am. J. 64: (2000) 1623-1630.<br />
2. E.J.W Wattel-Koekkoek., P. Buurman, J. Van der Plicht, E. Wattel, and N. Van<br />
Breemen... Eur. J. Soil Sci. 54 (2003) 269–278.<br />
3. C. Chenu, P. Puget and J. Balesdent. Clay-organic matter associations in soils :<br />
Microst<strong>ru</strong>cture and contribution to soil physical stability In Proceedings of 16 th World<br />
Congress of Soil Science, ISSS, Montpellier (1998) (CD-ROM)<br />
4. B. T. Christensen. Carbon and primary and secondary organomineral complexes. In: M.<br />
R. Carter and B. A. Stewart (Eds.) St<strong>ru</strong>cture and Organic Matter Storage in Agricultural<br />
Soils. CRC Press. Boca Raton, 1996, pp. 97–165.<br />
5. J. M. Oades. Biogeochemestry 5 (1988) 35–70..<br />
6. B.K.G Theng, Formation and Properties of Clay-Polymer Complexes. Elsevier, Amsterdam<br />
(1979).<br />
7. J. Hassink,. Plant Soil 191 (1997) 77–87.<br />
8. J, Hassink and A P Whitemore, Soil Sci. Soc. Am. J., 61 (1997) 131–139.<br />
<strong>Vol</strong>. 2 Page - 247 -
15th IHSS Meeting- <strong>Vol</strong>. 2<br />
9. A. Báez. Formación de agregados y captura de carbono en materiales de origen volcánico<br />
de México. Colegio de Postgraduados, México (Ph. D. Thesis) 2008.<br />
10. I. Estrada. Carbono del Suelo Acumulado en Sistemas Agrícolas en Tres Microcuencas<br />
del Estado de Oaxaca. Universidad Autónoma Chapingo, Suelos, México (B. S. Thesis)<br />
2003..<br />
11. J. D Etchevers, C. Hidalgo, C. Prat and P. Quantin. Tepetates of Mexico. In R. Lal (Ed.)<br />
Encyclopedia of Soil Science. Dekker, New York, 2006, pp. 1745–1748.<br />
<strong>Vol</strong>. 2 Page - 248 -
15th IHSS Meeting- <strong>Vol</strong>. 2<br />
Positive Effect of “Aguaje” (Mauritia flexuosa L.f.) Agro-forestal Managed<br />
Systems on Carbon Storage in Pe<strong>ru</strong>vian Amazonian Soils<br />
J. A. González-Pérez a * , B. Sales b , J. M. de la Rosa a,c , T. Verdejo a , F. J. González-Vila<br />
a IRNAS, CSIC, P.O. Box 1052, 41080 Sevilla, Spain; b Estación Experimental Agraria<br />
Pucallpa, Instituto Nacional de Investigación y Extensión Agraria (EEAP-INIA), Pe<strong>ru</strong>,<br />
c Instituto Tecnológico e Nuclear, Estrada Nacional 10, 2686-953, Sacavém, Portugal<br />
E-mail: jag@irnase.csic.es<br />
1. Introduction<br />
Amazonian ecosystems are estimated to account for ~10% of the world’s terrestrial primary<br />
productivity and 10% of the carbon stored in terrestrial ecosystems [1] and therefore a major<br />
sink for atmospheric CO 2 on Earth. However, there is scarce information neither on its real C<br />
storage potential nor on the influence of land use or local agroforestal management practices<br />
on the accumulation and stabilization of C forms.<br />
An example of sustainable management in Amazonia is the aguaje palm (Mauritia flexuosa<br />
L.f.) agro-forestal system. The aguaje palm provides food, fiber, oil, medicinals, materials for<br />
const<strong>ru</strong>ction and fishing equipment, and fallen stems serve as a substrate for raising of edible<br />
larvae of the palm beetle (suri, Rhynchopho<strong>ru</strong>s palma<strong>ru</strong>m). The habitats of the aguaje are<br />
swamp and soils of the flood plains, although it can grow in any soil with sufficient water<br />
supply. Aguajes cover 6-8 million ha in the Pe<strong>ru</strong>vian Amazonia [2 and referenced therein]<br />
This communication analyses the influence of aguaje agro-forestall system on C storage<br />
capacity of soils from r the Pe<strong>ru</strong>vian Amazonian Ucayali region [3]. The start hypotheses are<br />
that the amount and quality of the soil organic matter (SOM) pools may be influenced by land<br />
use and management practices, and that the st<strong>ru</strong>ctural features of soil humic acids (HA’s) may<br />
provide specific information on the mechanisms and processes that influence the<br />
accumulation and stabilization of OM forms.<br />
2. Materials and Methods<br />
Soils were sampled at two different depths (0-20 cm and 20-40 cm) under “aguaje” palm<br />
(Mauritia flexuosa L.f.) agro-forestal systems and other areas from the Pe<strong>ru</strong>vian region of<br />
Ucayali but under natural vegetation or different crops. Samples were subjected to routine<br />
preparation before sequential extraction of lipid and humic fractions. Some pedological,<br />
geographical and chemical characteristics of the selected soils studied are shown in Table 1.<br />
The isolation of the extractable humic fractions was carried out after previous extraction of<br />
the soil lipid fraction by Soxhlet extraction with a mixture of dichloromethane: methanol<br />
<strong>Vol</strong>. 2 Page - 249 -
15th IHSS Meeting- <strong>Vol</strong>. 2<br />
(2:1). The soil OM was separated into humic (HA) and fulvic acid (FA) fractions following<br />
standard procedures in humus chemistry [4, 5]. Total organic carbon and organic carbon<br />
distribution into the different fractions were determined by wet oxidation with potassium<br />
dichromate as described above.<br />
Table 1: Location and general characteristics of the soil samples<br />
UTM Coord. Depth Sand Silt Clay<br />
Code X Y (cm) ………...............% …...........……… pH<br />
Aguaje palm agro-forestal system<br />
P.NUEVA-1.1 545776 9114394 0-20 30 58 12 5.34<br />
P.NUEVA-1.2 20-40 22 62 16 5.72<br />
NUEVA REQ-1 516656 9078082 0-20 72 20 8 4.52<br />
NUEVA REQ-2 20-40 76 18 6 4.92<br />
IPARÍA-1 445839 9081594 0-20 34 56 10 4.35<br />
IPARÍA-2 20-40 30 44 26 4.63<br />
YARINACO-1 539704 9085260 0-20 54 22 24 4.25<br />
YARINACO-2 20-40 52 22 26 4.16<br />
IRAZOLA-1 476201 9023688 0-20 62 30 8 6.32<br />
IRAZOLA-2 20-40 50 26 24 6.90<br />
CURIMANÁ-1 489145 9067118 0-20 36 50 14 5.20<br />
CURIMANÁ-2 20-40 50 32 18 4.89<br />
PE.PURÚS-1 312284 8919126 0-20 74 22 4 5.26<br />
PE.PURÚS-2 20-40 78 18 4 4.95<br />
RAYMONDI-1 635315 8814434 0-20 54 40 6 5.62<br />
RAYMONDI-2 20-40 76 20 4 4.96<br />
SEPAHUA-1 --------- --------- 0-20 18 48 34 4.85<br />
SEPAHUA-2 20-40 16 36 48 4.91<br />
TMK25 –1 528621 9068300 0-20 43 35 22 5.61<br />
TMK25 –2 20-40 33 41 26 5.75<br />
TACV2NR -1 520698 9065836 0-20 47 29 24 5.57<br />
TACV2NR -2 20-40 33 31 36 5.41<br />
Other crops and natural vegetation<br />
BVA –1 550850 9077708 0-20 0 71 29 7.55<br />
BVA –2 20-40 6 69 25 7.47<br />
PNJ –1 560300 9071780 0-20 84 3 13 7.91<br />
PNJ –2 20-40 86 1 13 7.90<br />
PFPP-1 554589 9074842 0-20 84 3 13 7.92<br />
PFPP-2 20-40 86 1 13 7.85<br />
RMVAM L-1 551994 9077956 0-20 1 54 45 7.07<br />
RMVAM L-2 20-40 53 29 18 7.59<br />
RMVAM M-1 551994 9078056 0-20 3 48 49 7.24<br />
RMVAM M-2 20-40 55 28 17 7.68<br />
RMAPF F-1 549520 9077146 0-20 0 49 51 7.13<br />
RMAPF F-2 20-40 2 51 47 7.01<br />
RMAPM M-1 549520 9077046 0-20 0 47 53 5.98<br />
RMAPM M-2 20-40 2 45 53 6.56<br />
TMK21 –1 530895 9068877 0-20 40 35 25 5.34<br />
TMK21 –2 20-40 34 33 33 5.45<br />
TAVHA I -1 494168 9023980 0-20 50 23 27 5.06<br />
TAVHA I -2 20-40 42 23 35 5.30<br />
TAVHA II -1 494117 9023958 0-20 36 21 43 5.21<br />
TAVHA II -2 20-40 32 29 39 5.29<br />
TAVH E –1 494256 9024146 0-20 39 28 33 4.84<br />
TAVH E –2 20-40 31 22 47 5.16<br />
TAVH C –1 494175 9023910 0-20 45 24 31 5.07<br />
TAVH C –2 20-40 33 24 43 5.23<br />
CSAK 100 -1 484952 9021132 0-20 5 20 75 6.09<br />
CSAK 100 -2 20-40 3 20 77 6.27<br />
<strong>Vol</strong>. 2 Page - 250 -
15th IHSS Meeting- <strong>Vol</strong>. 2<br />
3. Results<br />
Our results shows that soils from aguaje agro-forestal systems maintain higher quantities of<br />
carbon (2,51 % ± 1,35) than other soils under other crops or natural vegetation (1,64 % ±<br />
0,69). This occurs not only for surface soil layers but also deeper in the soil profile down to<br />
40 cm (Fig. 1).<br />
5<br />
4<br />
4<br />
3<br />
SOM (%)<br />
3<br />
2<br />
2<br />
2,87<br />
2,15<br />
1,94<br />
1<br />
1,33<br />
1<br />
0<br />
Soils under Aguaje crop (n=11)<br />
Soils under other crops (n=13)<br />
0-20 cm 20-40 cm<br />
Figure 1: Distribution of SOM (% dry weight) in Pe<strong>ru</strong>vian Amazonian soils at two depths<br />
Soils under Aguaje<br />
(0-20 cm)<br />
Soils under other crops<br />
(0-20 cm)<br />
6%<br />
40%<br />
21%<br />
37%<br />
54%<br />
Soils under Aguaje<br />
(20-40 cm)<br />
5%<br />
44%<br />
42%<br />
19%<br />
Soils under other crops<br />
(20-40 cm)<br />
35%<br />
51%<br />
46%<br />
Fulvic acids Humic acids Lipids<br />
Figure 2: Distribution of SOM fractions in Pe<strong>ru</strong>vian Amazonian soils at two depths<br />
The quantity of extractable humic and fulvic acids, although variable among the different<br />
sites, was quite high under aguaje systems (AH: 0,57% ± 0,53; AF: 0,45% ± 0,26) as<br />
compared with soils sustaining other vegetation type (AH: 0,13% ± 0,11; AF: 0,11% ± 0,9).<br />
The lipid fraction extracted is very similar in both systems (0,05 % in aguaje and 0,06 % in<br />
other crops).<br />
<strong>Vol</strong>. 2 Page - 251 -
15th IHSS Meeting- <strong>Vol</strong>. 2<br />
Differences were also detected in the relative distribution of the different carbon fractions in<br />
the soils. Soils under aguaje retained carbon in more refractory forms like humic and fulvic<br />
acids that soils under other sytems wher a higher proportion of carbon is stored in more labile,<br />
lipidic, forms (Fig.2).<br />
4. Conclusions<br />
Certain management practices i.e. the maintenance of aguaje crops, seem to increase and<br />
favor organic matter accumulation of in Amazonian soils. This is particularly reflected by the<br />
high subsoil organic mater content especially in humified forms.<br />
This positive effect of aguaje agro-ecosystem favoring carbon sequestration in soil is probably<br />
related with the need to maintain enough soil conditions to sustain this water demanding crop.<br />
In fact the palm grows in acidic soils in permanently or temporarily flooded areas.<br />
Therefore aguaje agroecological features may be affecting soil carbon dynamics that is<br />
protected from mineralization by soil’s hydromorphic conditions. This is an interesting<br />
environmental characteristic and an example of the potential capacity for sequestration of<br />
stable forms of C in Pe<strong>ru</strong>vian Amazonia that depends upon land management and use. Shifts<br />
from aguaje agro-forestal system to traditional crops will certainly affect soil hydrological<br />
conditions exerting, in turn, soil carbon loses by mineralization.<br />
Acknowledgments.<br />
To the project “Desarrollo de tecnología, en Ecosistemas Naturales de Aguajales (Mauritia<br />
flexuosa L.f), para secuestrar carbono en la Amazonía Pe<strong>ru</strong>ana” Fondo para la innovación, la<br />
técnica y la tecnología del Perú, Ref: 024-FINCyT-PIBAP-2007, Perú.<br />
References<br />
1. Melillo, J. M. et al.: Global climate change and terrestrial net primary production. Nature 363,<br />
234–240 (1993).<br />
2. Manzi, M. and O.T. Coomes. Managing Amazonian palms for community use: A case of aguaje<br />
palm (Mauritia flexuosa) in Pe<strong>ru</strong>. Forest Ecology and Management 257: 510–517 (2009).<br />
3. Campbell, K. E. Jr., C.D. Frailey, L. Romero-Pittman: The Pan-Amazonian Ucayali Peneplain,<br />
late Neogene sedimentation in Amazonia, and the birth of the modern Amazon River system.<br />
Palaeo. 239: 166-219 (2006).<br />
4. G. Almendros, A. Polo and E. Dorado, Anales INIA 18 (1982), pp. 29–42.<br />
5. F.J. González-Vila, G. Almendros and F. Madrid, Sci. Total Environ. 236: 215–22. (1999).<br />
<strong>Vol</strong>. 2 Page - 252 -
15th IHSS Meeting- <strong>Vol</strong>. 2<br />
Effects of Different Systems in Use on the Contents of Organic Carbon<br />
(TOC) and Nitrogen (N) in the Different Classes and Stability of Aggregates<br />
Caio Batista Müller a , Oscarlina Lúcia dos Santos Weber b<br />
a Faculdade de Sorriso, Rua Noemia Tonelo Dalmolin 2499, Sorriso, MT – Brasil;<br />
b Universidade Federal do Mato Grosso, Av. Fernando Correa s/nº, Cuiabá, MT - Brasil<br />
E-mail: oscsanwb@cpd.ufmt.br<br />
1. Introduction<br />
The amount of soil organic matter (SOM) and their compartments are important in the<br />
availability of nutrients, soil aggregation and the flow of gases between the atmosphere and<br />
land surface. This study aimed to evaluate the effects of different systems for use on the<br />
contents of organic carbon (TOC) and nitrogen (N) in the different classes of aggregates,<br />
calculate the stability of aggregates in the different systems in use. The SOM is all organic<br />
fraction present in the soil in the form of fresh or waste in various stages of decomposition,<br />
compounds decomposed and charred materials, with or without the mineral fraction and the<br />
other part consisting of living organisms such as roots and constituents of soil fauna (4).<br />
2. Materials and Methods<br />
The systems in use were: the forest (reference), the consortium with agroforestry grazing<br />
(teak, cocoa and grass), the agroforestry (teak and cocoa), and the teak forest and pasture. In<br />
each system were opened three little trenches at depths of 0 to 5, 5 to 10, 10 to 20 cm. One<br />
area under native vegetation (forest) adjacent to the soil samples were collected as a reference.<br />
The samples were transferred to aluminum cans, slowly, with deionized water. After two<br />
hours past the start of wetting, the samples were transferred to the recording (5), with a set of<br />
sieves in mesh 2.0, 1.0, 0.5, 0.25 and 0.125 mm aperture.<br />
Upon completion of the oscillations, the amount of material retained on each sieve was dried<br />
in an oven at 105 ° C for 24 hours, and then weighed. Class less than 0.125 mm was<br />
calculated by difference, taking the initial weight, the less residual moisture, and the weight of<br />
other classes as the base. Were calculated: the mean weight diameter (DMP), the geometric<br />
mean diameter (DMG), and the index of aggregate stability of the class (IEA). The DMP and<br />
the IEA were obtained using formulas proposed by Castro Filho et al. (2) (equation 2 and 3),<br />
and the IEA was adapted by Perin et al., (3). The DMG was calculated according to Schaller<br />
and Stockinger (1953) (equation 1), mentioned by Alvarenga et al. (1).<br />
<strong>Vol</strong>. 2 Page - 253 -
15th IHSS Meeting- <strong>Vol</strong>. 2<br />
Equation:<br />
DMG antilog = Σ (n log d) / Σn (1)<br />
DMP = Σ = (wi d) (2)<br />
IEA = (Ps - wp
15th IHSS Meeting- <strong>Vol</strong>. 2<br />
Variation of Humic Acid Properties Within Eipurs Peat Profile<br />
1. Introduction<br />
Oskars Purmalis, Maris Klavins<br />
University of Latvia, Latvia<br />
E-mail: oskars.purmalis@lu.lv; maris.klavins@lu.lv<br />
Humic substances (HS) are the dominating naturally occurring organic substances. Humic<br />
substances are a general category of naturally occurring, biogenic, heterogeneous organic<br />
substances that can generally be characterized as being yellow to black in color, of high<br />
molecular weight, and refractory. Humic substances form most of the organic component of<br />
soil, peat and natural waters, they influence the process of formation of fossil fuels, and they<br />
play a major role in the global carbon geochemical cycle [1]. The aim of the present paper is<br />
to analyse the properties peat humic substances isolated from peat.<br />
2. Materials and Methods<br />
Peat sampling. 15 peat samples from Eipurs peat profile in Latvia were collected.<br />
Isolation of humic substances. Humic acids were extracted and purified using procedures<br />
recommended by the International Humic Substances Society (IHSS).<br />
Characterization of humic substances. Elemental analysis (C, H, N, S, and O) was carried out<br />
using an Elemental Analyzer Model EA-1108 (Carlo Erba Inst<strong>ru</strong>ments).<br />
3. Results and Discussion<br />
Peat is dark colored mostly organic material (mineral mater usually is less than 25 %) formed<br />
in water saturated, anaerobic wetland environment from decomposition of mosses, sedges,<br />
grasses, reeds, sh<strong>ru</strong>bs and trees [2].<br />
In peat the transformation and decay process of living organic matter (humification) is<br />
retarded in acidic and anaerobic environment, but at the same time the peat can provide<br />
information on environmental and paleo-environmental conditions of past.<br />
Higher E 4 /E 6 ratios are characteristic for humic substances with higher degree of condensed<br />
aromatic systems and smaller particle sizes or molecular weights measured [3]. For the<br />
studied peat humic acids hydrophobicity significantly increases with increasing peat age<br />
(sampling depth and decomposition degree, Fig. 1).<br />
<strong>Vol</strong>. 2 Page - 255 -
15th IHSS Meeting- <strong>Vol</strong>. 2<br />
Figure. 1: Peat stratigraphy and peat decomposition degree in Eipurs Bog.<br />
Table 1: Elemental and functional composition of humic substances used in the study<br />
mEq COOH,<br />
Humic acid C, % H, % N, % S, % g Kpeg/w E 4 /E 6<br />
0.0 - 0.25 51,59 5,31 2,40 1,48 2,7 1,66 5<br />
0.25 - 0.50 52,49 5,09 2,38 1,46 5,10 1,51 7,2<br />
0.50 - 0.70 53,09 5,37 2,51 1,08 4,50 1,61 5,86<br />
0.70 - 1.20 51,83 5,22 2,41 1,85 4,40 3,93 6,28<br />
1.20 - 1.35 43,59 4,41 2,06 0,89 3,90 5,09 6,86<br />
1.35 - 1.70 52,88 4,77 2,12 1,04 4,70 11,80 6,23<br />
1.70 - 1.87 54,01 4,73 1,81 1,37 4,60 9,58 6,58<br />
1.87 - 2.20 53,30 4,90 1,90 0,96 4,20 12,25 5,92<br />
2.20 - 2.30 53,63 4,91 1,79 0,78 4,40 13,77 6,36<br />
2.30 - 2.40 54,40 5,01 1,86 0,86 4,60 10,82 6,4<br />
2.40 - 2.50 54,33 5,01 1,97 0,77 4,70 19,07 6,77<br />
2.50 - 3.20 51,17 4,99 1,58 0,51 4,10 18,63 6,2<br />
3.20 - 3.58 52,54 4,32 2,24 0,83 6,20 8,19 8<br />
3.58 - 3.62 54,63 4,22 2,08 0,82 6,60 4,32 6,69<br />
3.62 - 3.95 55,61 4,79 2,51 0,96 4,70 7,09 7,22<br />
<strong>Vol</strong>. 2 Page - 256 -
15th IHSS Meeting- <strong>Vol</strong>. 2<br />
4. Conclusions<br />
The similarity in the st<strong>ru</strong>cture and properties of humic substances from peat column suggests<br />
the importance of intensity of biological transformation of organic matter on their st<strong>ru</strong>cture.<br />
Comparatively, the studied peat humic acids are at the start of the transformation process of<br />
living organic matter.<br />
References<br />
1. Falkowski P., Scholes R.J., Boyle E., Canadell J., Canfield D., Elser J., G<strong>ru</strong>ber N.,<br />
Hibbard K., Hogberg P., Linder S., Mackenzie F.T., Moore B., Pedersen T., Rosenthal Y.,<br />
Seitzinger S., Smetacek V., Steffen W. (2000) The global carbon cycle: a test of our<br />
knowledge of Earth as a system. Science, 290(5490, 291-296<br />
2. Zaccone C., Miano T.M., Shotyk W. (2007) Qualitative comparison between raw peat and<br />
related humic acids in an ombrotrophic bog. Profile. Org. Geochem., 38, 151-160<br />
3. Chen, Y., Senesi, N., Schnitzer, M. (1977) Information provided on humic substances by<br />
E 4 /E 6 ratios. Soil Sci. Soc. Amer J., 41(2), 352-358.<br />
<strong>Vol</strong>. 2 Page - 257 -
15th IHSS Meeting- <strong>Vol</strong>. 2<br />
Impact of Litter Quality on Mineralization Processes in Managed and<br />
Abandoned Pasture Soils in Southern Ecuador<br />
Potthast, Karin, Hamer, Ute * , Makeschin, Franz<br />
Dresden University of Technology, Piennerstr. 19, 01737 Tharandt, Germany<br />
E-mail: potthast@forst.tu-dresden.de<br />
1. Introduction<br />
Southern Ecuador currently undergoes deforestation at one of the highest rates in South<br />
America. Over the past several decades, vast areas of forest have been converted into cattle<br />
pastures by slash and burn practice. Frequently these pasture sites are invaded by bracken<br />
fern, when bracken becomes dominant pasture productivity decreases and the sites are<br />
abandoned. The land use change from productive pastures towards abandoned pasture sites is<br />
accompanied by altered litter inputs to soil which may influence microbial processes of<br />
natural organic matter (NOM) turnover [1].<br />
2. Materials and Methods<br />
To investigate the impact of invasive bracken on mineralization processes, soil samples (0–5<br />
cm) were taken from an active pasture with Setaria sphacelata as predominant grass and from<br />
an abandoned pasture overgrown by bracken. Grass (C 4 plant) and bracken (C 3 plant) litter,<br />
differing in C:N ratio (33 and 77, respectively), C:P ratio (1188 and 308, respectively) and<br />
lignin content (Klason lignin: 18% and 45%, respectively), were incubated in soils of their<br />
corresponding sites for 28 days at 22 °C. Unamended microcosms containing only the<br />
respective soil or litter were taken as controls. During incubation, the amount of CO 2 and its<br />
δ 13 C-signature were determined at different time intervals. Thus, the C-source of the NOM<br />
(litter versus soil organic matter) mineralized preferentially by the microorganisms was<br />
identified. Additionally, the soil microbial biomass (CFE-method), the soil microbial<br />
community st<strong>ru</strong>cture (PLFA-analysis) as well as the readily available organic carbon and<br />
nitrogen fraction (KCl-extraction), were monitored. Further information about the laboratory<br />
experiment is given elsewhere [1].<br />
3. Results and Discussion<br />
The applied short-term laboratory incubation experiment showed significant effects of litter<br />
addition on mineralization processes in active and abandoned pasture soils.<br />
Regarding the whole incubation period, the amendment of grass litter induced a significant<br />
<strong>Vol</strong>. 2 Page - 258 -
15th IHSS Meeting- <strong>Vol</strong>. 2<br />
retardation of the soil organic matter mineralization confirming that within the decomposition<br />
process, copiotrophic microorganisms prefer to metabolize grass-derived C (see Fig. 1). This<br />
observed negative “priming effect (PE)” was described by Kuzyakov and Bol [2] as the first<br />
step of mechanisms of priming effects, which was generally referred to as “preferential<br />
substrate utilization”. This negative PE was only observed after addition of grass litter which<br />
supplied easily available substrate to the soil microbes due to a lower lignin content and lower<br />
ratios of C:N and C:P compared to the bracken litter. Hence, organic N compounds of the<br />
microcosms amended with grass litter could be mineralized rapidly indicating significantly<br />
higher N-immobilization rates (about 20 times) compared to the control soil. Consequently, it<br />
can be assumed that the significantly higher amounts of microbial biomass found in the<br />
control soils of active versus abandoned pasture are related to the higher amounts of easily<br />
available C compounds and nutrients allocated through grass litter.<br />
4. Conclusions<br />
The massive displacement of Setaria-grass by bracken in the abandoned pasture site induced a<br />
significant decrease in the amounts of readily available soil organic carbon and nitrogen, a<br />
significant decline in the soil microbial biomass content and activity as well as in the pH<br />
value compared to the active pasture. This can be linked to the different quality of grass and<br />
bracken litter since even in the present short-term study complex interactions between the<br />
dynamics of the soil microbial community and mineralization processes were detected. The<br />
differences in litter quality between grass and bracken are important triggers of changes in<br />
soil biogeochemical and soil microbial properties after land use conversion [1].<br />
<strong>Vol</strong>. 2 Page - 259 -
15th IHSS Meeting- <strong>Vol</strong>. 2<br />
Acknowledgements<br />
We gratefully acknowledge the German Research Foundation (DFG) for financial support<br />
(HA 4597\1-1).<br />
References<br />
1. K. Potthast, U. Hamer, F. Makeschin, Impact of litter quality on mineralization processes<br />
in managed and abandoned pasture soils in Southern Ecuador, Soil Biol. Biochem., 42<br />
(2010) 56–64.<br />
2. Y. Kuzyakov and R. Bol, Sources and mechanisms of priming effect induced in two<br />
grassland soils amended with slurry and sugar, Soil Biol. Biochem, 38 (2006) 747–758.<br />
<strong>Vol</strong>. 2 Page - 260 -
15th IHSS Meeting- <strong>Vol</strong>. 2<br />
Contribution of microbial biomass to SOM formation: bacterial cell<br />
envelops as a source for SOM<br />
Anja Miltner a *, Reimo Kindler b , Christian Schuring a , Petra Bombach c , Burkhardt Schmidt-<br />
Brücken d , Matthias Kästner a<br />
a UFZ - Centre for Environmental Research, Department Environmental Biotechnology,<br />
Permoserstr. 15, 04318 Leipzig, Germany; b Technische Universität Berlin, Department of<br />
Ecology, Franklinstr. 29, 10587 Berlin, Germany; c UFZ - Centre for Environmental Research,<br />
Department Isotope Biogeochemistry, Permoserstr. 15, 04318 Leipzig, Germany; d Papier<br />
technische Stiftung, Abteilung Nanotechnologie, Pirnaer Str. 37, 01809 Heidenau, Germany<br />
E-mail: anja.miltner@ufz.de<br />
1. Introduction<br />
Soil organic matter (SOM) is an important factor for soil quality. It favorably influences soil<br />
chemical and physical properties, such as nutrient supply, sorption and transformation<br />
capacity for pollutants, water holding capacity and thermal properties of the soil. Therefore<br />
SOM needs to be maintained or even enhanced for a sustainable management of soils. This is<br />
only possible if the processes of SOM formation and stabilization are known. The complexity<br />
of the soil system and SOM in particular has prevented a thorough understanding of SOM<br />
chemical composition and processes involved in its formation and stabilization until now. In<br />
the past, a number of theories have been developed how SOM is formed and stabilized,<br />
mainly from plant residues. Recently, however, evidence has shown that microbial residues<br />
also contribute significantly to SOM formation [e.g. 1,2]. We therefore conducted an<br />
incubation experiment with 13 C-labelled model microorganisms to trace the fate of microbial<br />
C in the soil and to elucidate its contribution to SOM formation.<br />
2. Materials and Methods<br />
We added 13 C-labelled model microbial biomass (Escherichia coli RFM 443) to an<br />
agricultural soil and incubated the mixture for 224 days at 20°C and 60% of the water holding<br />
capacity of the soil [1,3,4]. The 13 C was analyzed in the CO 2 , in the bulk soil and in the total<br />
and microbial fatty acids and amino acids. These data were used to make up a mass balance of<br />
the labeled C in the system.<br />
Additionally, SEM micrographs were taken from selected samples to visualize the cells and<br />
their fragments in the soil.<br />
3. Results and Discussion<br />
At the end of the experiment, about 50% of the labeled C originating from the microbial<br />
biomass has been mineralized. Labeled fatty acids (both total fatty acids and the microbial<br />
<strong>Vol</strong>. 2 Page - 261 -
15th IHSS Meeting- <strong>Vol</strong>. 2<br />
polar lipid acids) were degraded faster than the bulk biomass C. The same was t<strong>ru</strong>e for the<br />
labeled amino acids in the biomass-enriched fraction. In contrast, there was no significant<br />
change in the labeled total amino acids. This apparent stability of proteins in soils has already<br />
been reported earlier [5]. These data indicate that part of the biomass-derived C was<br />
transformed into non-living SOM and stabilized in soil. At the end of the experiment, about<br />
10% of the 13 C initially added remained in the microbial biomass; the remaining 40% have<br />
been transformed to non-living SOM [2]. The processes taking place are schematically<br />
summarized in Fig. 1.<br />
% of 13 C<br />
CO 2<br />
50%<br />
SOM<br />
40%<br />
E. coli microbial biomass (other than E. coli) 10%<br />
time<br />
Figure 1: Scheme of the fate of microbial biomass C in soil<br />
To avisualize the microbial residues in the samples, b SEM micrographs were taken. Intact cells<br />
were only rarely found, but the soil particles were completely covered with patchy fragments<br />
of a few hundred nm size (Fig. 2). In order to explore the origin of these fragments, we<br />
compared the soil SEM micrographs with micrographs from in-situ microcosms which had<br />
been exposed to groundwater [6]. These microcosms consist of microporous beads with an<br />
enormous internal surface from which all biomass and biomolecules are removed before<br />
exposition to the groundwater by an appropriate pretreatment. They are then loaded with a<br />
compound of interest and can be used to enrich microorganisms which are able to grow on<br />
this particular substrate. The SEM micrographs show that after exposure to groundwater the<br />
c<br />
d<br />
beads were densely colonized with a very diverse microbial community (Fig. 3). However,<br />
they do not only show intact cells, but a continuum from intact cells over empty cell envelops<br />
to fragmented cell envelops and finally to fragments similar to those found in the soil<br />
samples. Many of the fragments on the beads are embedded in a spider web-like st<strong>ru</strong>cture.<br />
<strong>Vol</strong>. 2 Page - 262 -
15th IHSS Meeting- <strong>Vol</strong>. 2<br />
Figure 2: SEM micrographs of soil particles from the microbial biomass turnover experiment: a) soil<br />
overview, b) fragmented envelope of a dead cell, c) empty cell without cytosol d) fragment of a cell<br />
envelope; arrows indicate patchy organic material<br />
This st<strong>ru</strong>cture forms from extracellular polymeric substances during critical point drying. The<br />
fragments found in the in-situ microcosms therefore can only derive from the microbial<br />
biomass which grew on the beads during groundwater exposition. This suggests that also the<br />
fragments in the soil originate from microbial cell envelop fragments. The abundance of the<br />
fragments in the soil samples together with the data from the incubation experiment further<br />
suggests that a major portion of SOM is derived from these cell envelope fragments. These<br />
fragments can trap other cell components and they sometimes are piled up on top of each<br />
other. In addition, they provide a surface for adsorption of natural and anthropogenic<br />
compounds. These adsorbed or entrapped compounds are then protected from biodegradation.<br />
Formation of SOM from bacterial cell envelops therefore explains a number of properties of<br />
SOM which are difficult to explain otherwise, e.g. the low C/N ratio of SOM, its complex<br />
chemical composition, the abundance of microbial biomass-derived moieties, the extracellular<br />
enzyme activity in soil, the stabilization of theoretically labile biomass components (e.g.<br />
proteins) in soil, and the formation of bound residues from pollutants.<br />
<strong>Vol</strong>. 2 Page - 263 -
15th IHSS Meeting- <strong>Vol</strong>. 2<br />
Figure 3: SEM micrographs of groundwater-exposed beads: a) patchy organic material from microbial<br />
cells walls embedded in the matrix of the EPS (forms spider-web like st<strong>ru</strong>cture during critical point<br />
drying), f) piles of flat patchy fragments<br />
4. Conclusions<br />
Our results show that microbial biomass is a significant source for SOM. In particular,<br />
fragments of cell envelops are attached to soil minerals and thus protected from degradation.<br />
These patchy fragments provide a material which is already very similar to SOM and thus<br />
explain most of the properties of SOM. This knowledge can be the basis of a sustainable soil<br />
management with the focus on C sequestration and stabilization.<br />
Acknowledgements<br />
This study has been financially supported by the DFG. The Department of Plant Nutrition of the<br />
Martin-Luther-University in Halle, Germany, granted access to its long-term agricultural experiment<br />
"Ewiger Roggenbau" for soil sampling, and Claudia Hoffmann-Jäniche, Kevin Kuntze, and Kerstin<br />
Ethner helped with the setup of the incubation experiment and with analysis of the samples.<br />
References<br />
1. 1. R. Kindler, A. Miltner, H.-H. Richnow and M. Kästner, Soil Biol. Biochem., 38 (2006) 2860–<br />
2870.<br />
2. 2. A.J. Simpson, M.J. Simpson, E. Smith and B.P. Kelleher, Environ. Sci. Technol., 41 (2007)<br />
8070–8076.<br />
3. 3. R. Kindler, A. Miltner, M. Thullner, H.-H. Richnow and M. Kästner, Organic Geochemistry,<br />
40 (2009) 29–37.<br />
4. 4. A. Miltner, R. Kindler, H. Knicker, H.-H. Richnow and M. Kästner, Organic Geochemistry,<br />
40 (2009) 978– 985.<br />
5. 5. T.W.-M. Fan, A.N. Lane, E. Chekmenev, R.J. Wittebort and R.M. Higashi, Journal of Peptide<br />
Research, 63 (2004) 253–264.<br />
6. 6. R. Geyer, A.D. Peacock, A. Miltner, H.-H. Richnow, D.C. White, K.L. Sublette and M.<br />
Kästner, Environ. Sci. Technol., 39 (2005) 4983–4989.<br />
<strong>Vol</strong>. 2 Page - 264 -
15th IHSS Meeting- <strong>Vol</strong>. 2<br />
Quantity and St<strong>ru</strong>ctural Characteristics of Humic Acid in Soil Aggregates<br />
under Different Land Uses<br />
Xiangxiang Hao, Sen Dou*<br />
College of Resource and Environmental Science, Jilin Agricultural University, No. 2888.<br />
Xincheng Street, Changchun, Jilin Province, China<br />
E-mail: dousen@tom.com<br />
1. Introduction<br />
The relationship between humic substance (HS) and soil aggregate is mutual. Aggregate<br />
offers the reserve place for HS which is important for the fertility of soil. HS could keep<br />
stability only it was preserved by aggregate and it will be decomposed by microorganism with<br />
the dest<strong>ru</strong>ction of aggregate (1, 2). Reversely, HS contributes to the soil st<strong>ru</strong>cture by serving<br />
as a major and persistent cementing agent for the aggregate formation which is effective in<br />
improving aggregate stability (3). Land use patterns not only controls the amount of soil<br />
organic matter (SOM), but also influences the composition and st<strong>ru</strong>ctural characteristics of<br />
organic matter in soils. However, only few studies focus on the effect of land use on the<br />
composition of different SOM fractions (4), and there is still insufficient information on the<br />
effect of land use on the st<strong>ru</strong>ctural characteristics of HS in soil aggregates. In this study, we<br />
reported the quantitythermal properties and IR spectra of HA of black soil aggregates under<br />
different land uses. Our aim was to determine the effects of land uses on the HS within<br />
aggregate st<strong>ru</strong>cture.<br />
2. Materials and Methods<br />
Black soil samples (Argiudolls in USDA Soil Taxonomy) were collected from the field<br />
experiment(started in 2005) of Jilin Agricultural University, Changchun city, Jilin Province,<br />
China in 2008. There were three land use types in the field experiment: fallow land (FL),<br />
cultivated land (CL) and bare land (BL). The soil samples were all from 0-20cm topsoil. The<br />
water-stable aggregates of the soils were isolated through the method described by<br />
Cambardella and Elliott (5) and the humic acid (HA) sample was isolated through the revised<br />
Kumada method (6). Differential thermal analysises (DTA) were carried out with Shimazu<br />
TG-60 (Japan). The IR spectra were measured with KBr pellet method by a Nicolet AVATAR<br />
360 inst<strong>ru</strong>ment (USA).<br />
<strong>Vol</strong>. 2 Page - 265 -
15th IHSS Meeting- <strong>Vol</strong>. 2<br />
3. Results and Discussion<br />
Quantity of HA in aggregates. The quantity of HA in soil aggregates are during the range of<br />
1.59 to 2.42 g kg -1 (Table 1). In the FL, HA quantity in >2mm aggregates fractions are higher<br />
than in other fractions, whereas, HA quantity in 2-0.25mm aggregates fractions is the highest<br />
in all size classes in CL and BL. Among land types, the quantity of HA in soil aggregates are<br />
typically larger under FL than under other lands in all size classes. This is because there were<br />
numerous roots and hyphae in FL, which not only increased the content of orgnic carbon in<br />
aggregates, but also promoted the stabilization of aggregates.<br />
Table 1: Quantity of HA in soil aggregates under different land uses (g kg -1 )<br />
Aggregates<br />
Land type<br />
>2mm 2-0.25mm 0.25-0.053mm 2mm aggregates are the<br />
highest in all size aggregates; H3/H2 ratio of HA in all size aggregates in BL are lower than<br />
CL and FL. This showed that HA in >2mm aggregates had the highest aromatic/aliphatic ratio<br />
compared with other size aggregates; aromatic/aliphatic ratio for HA of BL are lower than CL<br />
and FL.<br />
Figure 1: The DTA of HA in soil aggregates under cultivated land (CL) and fallow land (FL) (a. CL;<br />
b. FL). Number 1 to 4 represent >2mm, 2-0.25mm, 0.25-0.053mm and
15th IHSS Meeting- <strong>Vol</strong>. 2<br />
macroaggregates (>0.25mm). Compared with IR spectra of HA within 2-0.25mm aggregates<br />
under different land uses, the sequence of 2920/1620 and 2920/2850 ratios are<br />
CL(0.697)>FL(0.412)>BL(0.074) and BL(8.67)>FL(4.16)>CL(3.70), respectively. This<br />
showed that HA in CL was more aliphatic than which in FL and BL.<br />
Figure 2. The IR spectra of HA in soil<br />
aggregates in cultivated land (CL).<br />
Note: Same with figure 1.<br />
4. Conclusions<br />
Figure 3. The IR spectra of HA in 2-0.25mm<br />
aggregates under different land uses.<br />
Note: CL, FL and BL represent cultivated land,<br />
fallow land and bare<br />
land, respectively.<br />
Under different land types, the quantity of HA in soil aggregates was typically larger under<br />
FL than under other lands in all size classes, and BL was favorable to decreasing the complex<br />
degrees of HA in aggregates, HA in CL were more aliphatic than FL and BL.<br />
Acknowledgements<br />
This research was supported with funds provided by National Natural Science Foundation of<br />
China (NSFC) (40471076, 40871107, 40971141).<br />
References<br />
1. Piccolo, A., Pietramellara, G.M., Bagwu, J.S.C., 1997. Use of humic substances as soil<br />
conditioners to increase aggregate stability.Geoderma 75, 267-277.<br />
2. Bongiovanni, M.D., Lobartini, J.C., 2006. Particulate organic matter, carbohydrate, humic acid<br />
contents in soil macro- and microaggregates as affected by cultivation. Geoderma 136, 660-665.<br />
3. Six, J., Eilliott, E.T., Paustian K., Doran J.W., 1998. Aggregation and soil organic matter<br />
accumulation in cultivated and native grassland soils. Soil. Sci. Soc. Am. J. 62, 1367-1377.<br />
4. Mirjam Helfrich, Ludwig B., Buurman P., Flessa H., 2006. Effect of land use on the composition<br />
of soil organic matter in density and aggregate fractions as revealed by solid-state 13C NMR<br />
spectroscopy CPMAS and solution 13C NMR analysis. Geoderma 136, 331-341.<br />
5. Cambardella, C.A, Elliott E.T., 1993. Carbon and nitrogen distribution in aggregates from<br />
cultivated and native grassland soils. Soil Science Society of America Journal 57, 1071-1076.<br />
6. Kumada K., Sato O., Ohsumi Y., et al. 1967. <strong>Humus</strong> composition of main type humic acid. Soil<br />
Science and Plant Nutrition 13,151-158.<br />
<strong>Vol</strong>. 2 Page - 267 -
15th IHSS Meeting- <strong>Vol</strong>. 2<br />
Characterization of Humic Acid Extracted from <strong>Humus</strong> Soil Collected<br />
Under Rhododendron ponticum L. in Northwest Turkey<br />
1. Introduction<br />
Ahmet Tutar * , Abdil Özdemir, Selcuk Karakaya, Gülnur Yazıcı<br />
Department of Chem., Faculty of Arts and Science, Sakarya University,<br />
54187 Sakarya, Turkey<br />
E-mail: atutar@sakarya.edu.tr<br />
Humic substances (HS) are the most important source of organic carbon in both terrestrial and<br />
aquatic environments [1], and play a key role in nature. They contribute to the growth of<br />
plants, are responsible for the st<strong>ru</strong>cture and physical–chemical properties of soil, and are<br />
involved in the majority of surface phenomena that occur in soil [2]. Humic substances can be<br />
divided into three components: fulvic acids (FAs), humic acids (HAs) and humin. One of the<br />
most important parts of HS is HAs [2]. Rhododendron is a highly celebrated ornamental<br />
genus because of its spectacular flowers, species-richness, ease of hybridization and broad<br />
geographical range [3]. Approximately 1000 species inhabit a vast geographical range, from<br />
the tropics to the polar zone and alphine to sea level [4]. Rhododendron ponticum L has been<br />
documented throughout the Black Sea Region of Turkey (Figure 1) [5].<br />
Black Sea<br />
Mediterranea Sea<br />
Figure 1: General Distribution range of purple-flowered Rhododendron (R. ponticum L) in the<br />
Marmara and Black Sea Regions of Turkey<br />
<strong>Vol</strong>. 2 Page - 268 -
15th IHSS Meeting- <strong>Vol</strong>. 2<br />
The goal of this work is to characterize the HA fractions isolated humus soil collected under<br />
the R. ponticum L. in Turkey by a combination of spectroscopic techniques comprising ESI-<br />
MS, solid-state 13 C NMR, and Fourier-transformed infrared (FTIR) spectroscopies.<br />
2. Materials and Methods<br />
Soil sampling. In the North West region of Turkey, total 125 samples were collected. In this<br />
work only five of the soil samples were investigated. The soil samples collected from surface<br />
horizons (A horizons) layers from the minimum-tilled soils were sieved to 2 mm, air-dried,<br />
and stored at room temperature till they were characterized.<br />
Extractions of Has. The extractions of HAs were carried out according to literature [6] with<br />
minor modifications: in a 150 mL plastic bottle 20 g of soil were refilled to a volume of 200<br />
mL with 1 M Na OH, shaken over night and centrifuged at 25,900 g. The extraction was<br />
replicated twice, followed by the precipitation of the HAs with 37% HCl. For purification of<br />
the HAs, the first washing step was performed with 20 mL 1M NaOH, refilling to a volume of<br />
150 mL and a following acidification with 3 mL 37% HCl, the second one with 5 mL 1M<br />
NaOH and 1.5 mL 37% HCl and in the third washing step the precipitated HAs were<br />
elutriated with water and acidified with 10 drops of 37% HCl from a pasteur pipette. The<br />
purified HAs were transferred with a little amount of H 2 O into 25 mL plastic-bottles and<br />
freeze-dried without dialyzing. The dried samples were stored in desiccators.<br />
Inst<strong>ru</strong>mentation. 13 C CPMAS NMR spectra (Figure 2) were prepared by dissolving 30 mg of<br />
HA were prepared by dissolving 30 mg of HA in 0.5 mol L -1 of the NaOH-D 2 O solvent. 13 C<br />
CPMAS NMR spectra (Figure 2) on solid samples were obtained using a B<strong>ru</strong>ker AMX 300<br />
spectrometer (B<strong>ru</strong>ker BioSpin GmbH, Rheinstetten, D) operating at 75.47 MHz. Fourier<br />
transform infrared (FTIR) spectra (Fig. 3) were recorded by using a IRPrestige-21 FTIR<br />
Spectrometer equipped with a diamond ATR unit with KRS-5 crystal. The ions generated by<br />
ESI-MS were collected and detected by an Esquire 3000 plus ion-trap mass spectrometer<br />
(B<strong>ru</strong>ker Daltonics, Bremen, Germany).<br />
3. Results and Discussion<br />
Solid-state CP-MAS 13C NMR spectra of the HAs are shown in Fig. 2, and the comparison of<br />
relative peak areas from the 13 C NMR spectra shows the alkyl content and aromatic C content<br />
of the HAs. These data revealed that alkyl C and O–alkyl C were the dominant C components<br />
in HAs in five sampling regions.<br />
<strong>Vol</strong>. 2 Page - 269 -
15th IHSS Meeting- <strong>Vol</strong>. 2<br />
38<br />
24<br />
172<br />
153<br />
129<br />
102<br />
72<br />
56<br />
30<br />
16<br />
M1<br />
M2<br />
M3<br />
M4<br />
M5<br />
250 200 150 100 50<br />
0<br />
δ ppm<br />
Figure 2: 13 C CPMAS NMR spectra of HA extracted humus soil of forest rose (R. Ponticum L) in the<br />
Marmara and Black Sea Regions of Turkey<br />
The FTIR spectra of the HAs (Fig. 3) showed intense adsorption bands in the 1720, 1621,<br />
1206, and 1028 cm -1 . This indicates that a larger content of carboxyl groups in all the samples.<br />
M5 sample spect<strong>ru</strong>m shows higher 1720 relative peak intensity. This is most probably due to<br />
acid and salt forms of COOH group. Conversion of COOH groups to their COO - salts causes<br />
intensity increase of 1620 and 1380 cm -1 band. However, the FTIR spectra did not reveal<br />
significant differences between the HA samples collected from different regions.<br />
M1<br />
M2<br />
M3<br />
Transmission<br />
M4<br />
M5<br />
2922<br />
3300<br />
1706 1621<br />
1207<br />
1028<br />
4000<br />
3500<br />
3000<br />
2500 2000<br />
Wavenumber 1/cm<br />
Figure 3: FTIR spectra of HA extracted humus soil of forest rose (R..Ponticum L) in the Marmara and<br />
Black Sea Regions of Turkey<br />
1500<br />
1000<br />
The spectra of HA extracted from soil sample from the north-west region of Turkey are<br />
shown in Fig. 4. A molecular distribution about 750 Da is observed for HAs in both positive<br />
and negative ion spectra. The MS/MS experiments showed the losses of 18 amu (H 2 O) and 44<br />
amu (CO 2 ) for HAs. Insets in Fig. 2 show the MS/MS spect<strong>ru</strong>m of the ions at m/z 331.1,<br />
<strong>Vol</strong>. 2 Page - 270 -
15th IHSS Meeting- <strong>Vol</strong>. 2<br />
659.5 and 761.6. The important part of MS/MS spectra of experiment shows peaks above the<br />
parent ions. These are most probably because of doubly or multiply charged HAs molecules<br />
or dimmer or monomers of them. Numerous values for the molecular weight range of humic<br />
substances have been determined using size exclusion chromatography (SEC) (e.g. 1500–<br />
5000 amu [7]; 800–18,000 amu [8]). Recent reports have suggested that humic and fulvic<br />
acids may be aggregates of lower molecular weight material instead of covalently-linked<br />
macromolecules [9]. Obtained MS-MS studies also support this idea by producing higher<br />
positive ions.<br />
Figure 4: ESI-MS spectra of HA extracted humus soil of forest rose (R. ponticum L) in the Marmara<br />
and Black Sea Regions of Turkey<br />
4. Conclusions<br />
Our preliminary experimental results revealed that HAs extracted from humus soils collected<br />
from different regions does not show significant differences between them. For the<br />
characterization of HAs three methods were utilized and they did not show significant<br />
differences from the literature results. Individually FTIR spectra of HAs in 1028 cm -1 region<br />
shows higher peak intensity from the literature results. This is most probably dues to higher<br />
polysaccharide and similar compounds and silicates contents of samples. In ESI-MS studies<br />
Has protonated ions are populated around 750 m/z. This result also shows some difference<br />
from the literature results.<br />
<strong>Vol</strong>. 2 Page - 271 -
15th IHSS Meeting- <strong>Vol</strong>. 2<br />
Acknowledgements<br />
The authors are indebted to the Department of Chemistry, Sakarya University and The<br />
Scientific and Technical Research Council of Turkey (TUBITAK, Grant No: TBAG-<br />
108T073) for financial support of this work.<br />
References<br />
1. N. Senesi, E. Loffredo, in: D.L. Sparks (Ed.), Soil physical chemistry, CRC Press, Boca Raton,<br />
1999, p. 239.<br />
2. F.J. Stevenson, <strong>Humus</strong> Chemistry: Genesis, Composition and Reactions, John Wiley and Sons,<br />
New York, 1994.<br />
3. (a) Cox KNE (2003) Riddle of the Tsangpo Gorges: retracing Frank Kingdon-Ward’s<br />
1924 expedition. In: Argent G, McFarlane M (eds) Rhododendrons in Horticulture and<br />
cience, Royal Bot Garden, Edinburg, the UK, pp 2-7.<br />
4. Chamberlain DF, Hyam R, Argent G, Fairwater G, Walter KS (1996) The Genus Rhododendron:<br />
Its Classification and Synonyms, Royal Botanic Garden, Edinburg.<br />
5. Eşen D, Zedaker SM, Kirwan JL, Mou P (2004) Soil and site factors influencing purple-flowered<br />
Rhododendron (PFR L.) and eastern beech (Fagus orientalis Lipsky) forests in Turkey. Forest<br />
Ecology and Management 203, 229-240<br />
6. Tatzber M, Stemmer M, Spiegel H, Katzlberger C, Haberhauer G, Mentler A, et al. FTIR<br />
spectroscopic characterization of humic acids and humin fractions obtained by advanced NaOH,<br />
Na 4 P 2 O 7 and Na 2 CO 3 extraction procedures. J Plant Nutr Soil Sci 2007;170:522.<br />
7. Chin, Y.-P., Aiken, G.R., Danielsen, K.M., 1997. Binding of pyrene to aquatic and commercial<br />
humic substances: The role of molecular weight and aromaticity. Environmental Science and<br />
Technology 31, 1630–1635.<br />
8. Muller, M.B., Schmitt, D., Frimmel, F.H., 2000. Fractionation of natural organic matter by size<br />
exclusion chromatography—properties and stability of fractions. Environmental Science and<br />
Technology 34, 4867–4872.<br />
9. Piccolo, A., Conte, P., 1999. Molecular size of humic substances. Supramolecular associations<br />
versus macromolecular polymers. Advances in Environmental Research 3, 511–521<br />
<strong>Vol</strong>. 2 Page - 272 -
15th IHSS Meeting- <strong>Vol</strong>. 2<br />
St<strong>ru</strong>ctural and Functional Parameters of Humic Substances of<br />
Postagrogenic Soils<br />
Irina Kechaykina*<br />
Saint-Petersburg State University, 16 line V.O., 29, 199178, Saint-Petersburg, Russia<br />
E-mail: Irina_Kechaykina@mail.<strong>ru</strong><br />
1. Introduction.<br />
During the last years the area of farmlands in Russia was essentially reduced, therefore the<br />
former arable soils moved in the category of abandoned soils. Properties and the processes<br />
proceeding in these soils are at the moment studied not enough. The basic attention in the<br />
literature is given to change of a morphological st<strong>ru</strong>cture of soil profiles, transformation of<br />
physical and chemical properties more often. The questions of change humus content and<br />
composition and also transformations of organic substance are opened insufficiently in detail<br />
and the data often has controversial character.<br />
2. Materials and Methods.<br />
The chronosequence of abandoned sod-podzolic soils (15, 60, 90-years and control) from<br />
Novgorod region, Russia was investigated. The total organic carbon content was defined by<br />
Tuyrin dichromate-oxidation method, the group composition of humus was determinated<br />
according to Ponomareva and Plotnikova, then the CHA/CFA ration was calculated. The<br />
humic acids (HA) are extracted from 5-cm layers of humus horizons with help 0.1 M solution<br />
of sodium hydroxide and following stage of cleaning, then precipitation in sulfuric acid<br />
medium. The elemental analysis of HA was conducted on CHN-analyzer, the CPMAS 13C-<br />
NMR spectra were registered on B<strong>ru</strong>cker-spectrometer.<br />
3. Results and Discussion.<br />
In process of increase in term of stay of soil in abandoned condition we observe the tendency<br />
to reduction of the content of carbon with depth against increase of absolute values of<br />
indicators in the top part of a humus profile. According to index of humus type by Orlov 1 ,<br />
characterized on CHA/CFA ration, all investigated soils were classified to soil with humicfulvic<br />
type humus, in the bottom humus-accumulative layers of a control variant of soil it is<br />
predominance FAs.<br />
The difference between HAs extracted from postagrogenic soils on elemental composition<br />
was not statistically significant. But with increase in age of abandoned soil in limits humus<br />
<strong>Vol</strong>. 2 Page - 273 -
15th IHSS Meeting- <strong>Vol</strong>. 2<br />
horizon was revealed the tendency of increase of heterogeneity of properties HAs. This is<br />
connected with differentiation former arable horizon under influence wood type of vegetation.<br />
Coefficient of variation of nitrogen content increase from 1.9% in 15-year-old abandoned soil<br />
to 6,7 % in 90-year-old, while coefficient of variation in a virgin variant is 20,6 %. Data<br />
processing of elemental composition on Van-Krevelen has shown that during regenerative<br />
stage of zonal type of vegetation are developed processes of dehydrogenation and<br />
demethylation.<br />
Table 1. Carbon species of HAs on 13C-NMR spectra, percentage of each carbon species in molecule<br />
Carbon species<br />
ppm<br />
Sample of HA<br />
15 years 60 years 90 years Control<br />
Carboxylic 171 6,08 14,26 4,93 4,19<br />
Condense and O-Aromat. C 145 32,44 2,29 31,07 32,58<br />
Aromatic C 129 37,49 64,53 43,51 36,56<br />
Alcoholic 72 4,78 2,75 13,26 19,53<br />
Ester 55 7,08 5,97 1,44 1,06<br />
Aliphatic (alkene) 25 11,04 - 5,78 3,11<br />
Aliphatic (alkane) 20 1,10 10,20 - 2,96<br />
The comparative analysis of molecular st<strong>ru</strong>cture HAs on the basis of the NMR-spectra extracted<br />
from a layer of 5-10 cm of chronosequence abandoned soils has shown (Tab.1) that the significant<br />
part of carbon species in all preparations HAs is aromatic st<strong>ru</strong>ctures (ppm 145 and 129), included<br />
simple aromatic, condensed aromatic and O-aromatic st<strong>ru</strong>cture 2 . Among abandoned soils the<br />
carbon content of alcoholic groups in these fragments shows the tendency to raise with increase in<br />
age of a postagrogenic soils from 4,8 % in 15-year-old soil to 13,3 % in 90-year-old and 19,5 % in<br />
control soil. With increase in age of removal of ploughing from soils the carbon content of all<br />
aliphatic species decreases on 7 %.<br />
4. Conclusions.<br />
The main result of our investigation demonstrate that HAs of postagrogenic soils are slightly<br />
differ from each other and show the trend of all transformational changes of HAs to initial virgin<br />
type of soils. Degree of level-by-level differentiation HAs depends on character of vegetative<br />
association and st<strong>ru</strong>cture of the vegetative rests – the wood type of vegetation makes stronger<br />
impact on differentiation HAs in 20-centimetric layer in comparison with meadow associations.<br />
References<br />
1. D.S. Orlov. Soil Chemistry. Moscow State Univ., Moscow, Russia, 2005, p. 325.<br />
2. S.N. Chukov. St<strong>ru</strong>ctural-functional parameters of soil organic matter органического in<br />
conditions of antropogenic influences. Saint-Petersburg Univ., Russia, 2001, p, 216.<br />
<strong>Vol</strong>. 2 Page - 274 -
15th IHSS Meeting- <strong>Vol</strong>. 2<br />
Humic Acids Transformation in Young Buried Soils<br />
Alexander G. Ryumin<br />
Saint-Petersburg State University, 16 line V.O., 29, 199178, Saint-Petersburg, Russia<br />
E-mail: paris55@yandex.<strong>ru</strong><br />
1. Introduction<br />
The work attempts to estimate the processes developing in soil organic material (SOM) in<br />
soils with short burial age (below 100 years.) Quite significant changes develop in soils after<br />
the burial, which reflects in the qualitative and quantitative state of organic compounds in the<br />
soil. While buried soils do not cover important areas, understanding is necessary for the<br />
processes evolving in them, for using in modern balance models for carbon.<br />
2. Materials and Methods<br />
Samples withdrawn from 5 cuts are used for the study. Three of these cuts are located in<br />
Belgorod Oblast, and two others in Tula Oblast (Russia.) Buried soils with the burial ages of<br />
30, 60 and 70 years are investigated. Two more soils are used as a reference. Samples across<br />
5-cm layers are withdrawn in the limits of humus-accumulative horizon. The Tyurin method<br />
is used to determine the content of organic carbon in soil samples. The ratio C HA /C FA is<br />
determined in the limits of humus profile for all cuts via the Kononova-Belchikova method.<br />
Biological activity under controlled conditions is determined for all cuts with the method of<br />
gas chromatography. The tests for active humic compounds and organic-mineral “matrix” is<br />
performed by the method of electron paramagnetic resonance (EPR) directly in soil samples.<br />
HA preparation is extracted from the soil sample of Belgorod Oblast. Content of functional<br />
(carboxyl and phenol hydroxyl) groups is determined, elementary composition is found,<br />
content of paramagnetic centers is measured via the method of EPR.<br />
3. Results and Discussion<br />
Expected decrease of carbon content with depth can be observed for all studied profiles, and<br />
has been characterized as exponential. Small differences in carbon content among studied<br />
soils are observed in upper 20–30-cm layers, or in so called active root layer. The speed of<br />
carbon extinction is decreasing with increasing burial age. The low speeds for carbon<br />
extinction are typical also in the lower part of humus profile, where the difference between<br />
virgin and buried soils in carbon content is no longer visible.<br />
Burials lead to growing content fraction of humic acids in comparison to fulvic acids. This<br />
<strong>Vol</strong>. 2 Page - 275 -
15th IHSS Meeting- <strong>Vol</strong>. 2<br />
difference is most clearly visible for 70-years-old buried soil and can be explained by higher<br />
exposure of fulvic acids to decomposition and mineralization with microorganisms.<br />
Clearly visible is the decay of biological activity in the profile of buried soils, which reflects<br />
in decreasing emission of carbon dioxide as a function of burial age. This evidences the<br />
decreasing in the content of organic carbon available for biota in buried soils.<br />
According to EPR data, the maximum number of active organic fractions is detected in the<br />
humus horizon of virgin soils, while organic-mineral matrix is expressed weakly. After burial,<br />
a significant decrease in total number of active fractions takes place and their content in the<br />
lower part of humus profile equalizes, similarly as with organic carbon. Content of passive<br />
fractions increases in more than 10 times during 70 years.<br />
The specific concentration of active organic fractions, calculated per 1% of carbon, increases<br />
with growing burial age, suggesting a conclusion that macromolecules of humic acids<br />
increase the number of chemically conjugated fragments and their stability.<br />
Results on elementary composition of samples of humic acids indicate the growth of carbon<br />
content and the number of chemically conjugated fragments in the macromolecules, leading<br />
also to a relative growth in the HA energy stored in buried soils, evidenced by increasing<br />
calculated combustion heat with growing burial age.<br />
4. Conclusions<br />
The study shows that almost all investigated parameters of soil organic matter undergo<br />
changes after burial. The degree of these changes depends on the burial age, while the rate for<br />
the changes of a certain parameter decreases with growing burial age and depth.<br />
<strong>Vol</strong>. 2 Page - 276 -
15th IHSS Meeting- <strong>Vol</strong>. 2<br />
Humic Substances in Tropical Ecosystem Soils and the Land-Use Changes<br />
Rosa Mary Hernández-Hernández a* , Mansonia Pulido b , Ronelly Caballero b , Ignacio Castro a ,<br />
Elizabeth Ramírez a , Tatiana Rondón b , Zenaida Lozano b , Betty Mendoza b<br />
a<br />
Universidad Simón Rodríguez, IDECYT, Laboratorio de Biogeoquímica, Caracas,<br />
Venezuela; b Universidad Central de Venezuela, FAGRO, Maracay, Venezuela<br />
E-mail: rosa.hernandez@unesr.edu.ve<br />
1. Introduction<br />
The tropical and sub-tropical regions of the world, comprising an extremely complex array of<br />
ecosystems, support more than 70 per cent of the world's biota in a complex network of<br />
ecological interactions. These regions are also home to nearly half of the world's human<br />
population and thus experience tremendous pressure. In the recent past there has been a<br />
growing concern over the accelerating rates of deforestation in tropical forests and savannas<br />
and the consequent loss of biodiversity. Dramatic changes in land-use have had enormous<br />
effects on maintenance and people´s life quality in the tropical latitudes. The magnitude of the<br />
change is affecting their biological diversity depleting the fertility of soils and nature's ability<br />
to replenish that fertility, especially due to the effects over the organic matter (OM)<br />
transformation processes. Savannah and forest ecosystems soils can respond in different<br />
proportion to any perturbation occasioned by land-use change. One of the most important<br />
could occur in the humic and non-humic substances of the OM. The objective of this study<br />
was to compare how these substances of savannah and forest soils respond to different landuse<br />
changes.<br />
2. Material and Methods<br />
This work was made in tropical ecosystems localized in the Venezuela Central Region that<br />
have suffered the impact by land-use changes. These ecosystems were: 1.- Natural savannah<br />
with Trachypogon vestitus converted to pastures of Brachiaria dyctioneura (StoP), 2.- Natural<br />
savannah cultivated with a perennial leguminous Centrosema macrocarpum (StoL), 3.- Premountain<br />
forest transformed to citric trees monoculture in inceptisoles soil (FtoCi), 4.- The<br />
same conversion but in ultisol soil (FtoCu), 5.- Secondary savanna produced by action of fire<br />
in a mountain forest (FtoSS), 6.- Mountain forest transformed into a pine monoculture (Pinus<br />
caribaea) (FtoPi), and 7.- The same mountain forest converted into a eucalyptus monoculture<br />
(Eucalyptus robusta) (FtoEu). In general, the soils were sandy and sandy loam, acidic,<br />
aluminum rich and low in available phospho<strong>ru</strong>s and nitrogen and with a high-low range of<br />
OM content in the topsoil. In each ecosystem studied, three plots (20x30 m) were located and<br />
<strong>Vol</strong>. 2 Page - 277 -
15th IHSS Meeting- <strong>Vol</strong>. 2<br />
were the sites for the soil samples. In each experimental unit (plot) three composed samples<br />
were obtained, each with 10 subsamples taken at 0-10 cm depth. The soil sample was air dried<br />
(approximately 25 o C) and sieved through a 2mm mesh to analyze OM chemical fractionation.<br />
The humic (HAC) and fulvic (FAC) acid content was determined using an extraction of 10 g<br />
of soil with a solution of NaOH/Na 4 P 2 O 7 (Merck) (Schnitzer and Schuppli, 1989). To separate<br />
humic and fulvic acids and non-humic substances (NHSC), an acid medium (H 2 SO 4 at 50%)<br />
was used to precipitate the humic acids, and an insoluble polyvinylpyrrolidone (Sigma P6755)<br />
column was used to purify the fulvic acids of the non- humic substances (Ciavatta and Govi,<br />
1993). Organic carbon (OC) was measured using wet-oxidation method in each chemical<br />
fraction obtained (Anderson and Ingram, 1993). Several humification indexes were<br />
determined: HI= MHSC/HAC+FAC, HG=HAC+FAC/CET*100, RI=HAC+FAC/OC*100.<br />
Correlations with Spearman’s coefficient (p≤0.05) were done. To determine the difference of<br />
the land-use change impacts in the ecosystems evaluated, a K<strong>ru</strong>skal-Wallis test was used with<br />
the respective comparing means by Duncan test (p≤0.05) (SSPS version 17 th ).<br />
1. Result and Discussion<br />
In the tropical ecosystem soils studied, the total extractable carbon (TEC) was the dominant<br />
chemical fraction of OC, being the non-humic substances carbon (NHSC), followed by humic<br />
acid carbon (HAC); the main forms present in the TEC. In general, those soils that evidenced<br />
more OC, TEC, NHSC and specially fulvic acid carbon (FAC), had a higher humification<br />
index (HI) (Table 1). As OC and FAC were related to the mineral particles size; the clay and<br />
silt content affected positively the OC and FAC content, but the sand was negatively related<br />
(p
15th IHSS Meeting- <strong>Vol</strong>. 2<br />
Table 1: Correlation among humic substances, humification indexes and soil particles distribution.<br />
p
15th IHSS Meeting- <strong>Vol</strong>. 2<br />
Figure 1: Variations in the humic and non-humic substances of tropical ecosystem soils by different<br />
land-use changes (luc). Different letters indicate significant differences among distinct luc for the<br />
same humic fraction. Test Duncan (p
15th IHSS Meeting- <strong>Vol</strong>. 2<br />
Organo-Geochemical Characteristics of Podzols from the Santa Catarina<br />
Littoral<br />
Tomasz Boski a Mukesh Kumar a , Heike Knicker b , Francisco J. González-Vila b , Rodolfo<br />
Angulo c , Maria Cristina Souza c , Trinidad Verdejo b , José A. González-Pérez b<br />
1. Introduction<br />
a CIMA, Universidade do Algarve, Campus de Gambelas, 8000 FARO, Portugal;<br />
b IRNAS-CSIC., P.O. Box 1052, 41080-Sevilla,, España;<br />
c Laboratório de Estudos Costeiros, Universidade Federal do Paraná, Brasil<br />
E-mail: tboski@ualg.pt<br />
Podzols occur along the South Eastern costal zone of Brazil between Rio Grande do Sul and<br />
Rio de Janeiro States. They are formed as a result of cementation of the soil B horizon formed<br />
on mostly sandy littoral sediments covered by the lush Atlantic forest. The cementing material<br />
is composed by the mixture of sesquioxides (2-4%) and humic material exhibiting the<br />
elemental C content between 1 and 3%, calculated per dry weight of the sediment.<br />
The first 14 C dating of the humic material prove the coherence of the accretion model<br />
proposed for the local costal barrier and opens new perspectives for the development of a new<br />
geochronological tool. On the other hand, the solid state 13 C Nuclear magnetic resonance has<br />
shown marked compositional differences between the organic matter spectra of different ages.<br />
The most spectacular seems to be the time dependent decrease in the carbohydrates, most<br />
probably mediated by bacterial respiration (1).<br />
In order to confirm the noted alterations of the podzols organic matter with their ages, we use<br />
in this communication two additional approaches: i) the behaviour against pyrolytic<br />
techniques of a sequence of 14 podzol samples taken from the B horizon of soils along a<br />
transect perpendicular to the coast line, and at the same time being the progradation front of<br />
the coastal barrier, and ii) the composition of the total lipid extracted from the same podzol<br />
soils sequence.<br />
2. Material and Methods<br />
Data on the geological setting and previous analysis of the podzol soils were published<br />
elsewhere (1-3). Pyrolysis-GC-Ms analysis of the whole soil samples were performed as<br />
detailed in a previous work (4). The lipids were extracted in Soxhlet apparatus using<br />
toluol:dichloromethane (2:1) mixtures during 18 hours. Before their analysis by GC-MS, the<br />
total lipid extracts were methylated by using trimethylsilyldichloromethane. GC-MS<br />
conditions used were similar as previously described (5).<br />
<strong>Vol</strong>. 2 Page - 281 -
15th IHSS Meeting- <strong>Vol</strong>. 2<br />
3. Results<br />
The first 14 C datings of the humic material prove the coherence of the accretion model<br />
proposed for the local costal barrier and opens new perspectives for the development of a new<br />
geochronological tool. The solid state 13 C Nuclear magnetic resonance and pyrolytic<br />
behaviour of the samples (Fig. 1) has shown marked compositional differences between the<br />
organic matter spectra of different ages. The most spectacular seems to be the time dependent<br />
decrease in the carbohydrates, most probably mediated by bacterial respiration.<br />
Figure 1: NMR spectra (left) and pyrograms (right) of dated samples showing polysaccharide domains<br />
4. Conclusions<br />
Additional dating measurements and a more detailed characterization of the OM are necessary<br />
to validate the proposed hypotheses. If they can be confirmed, dating of B horizons from<br />
Spodosol forming Holocenic barriers my be an useful tool for the paleoenvironmental<br />
reconst<strong>ru</strong>ction of the barriers evolution and for creating valid age models for soil organic<br />
matter diagenesis studies.<br />
References<br />
1. Angulo, R.J.; Lessa, G.C.; Souza, M.C.(2006). A critical review of the mid- to late Holocene sealevel<br />
fluctuations on the Eastern Brazilian coastline. Quaternary Science Reviews, 5-6: 486-506.<br />
2. Souza, M.C., Angulo R.J., Pessenda, L.C.R. (2001). Evolução paleogeográfica da planície<br />
costeira de Itapoá, litoral norte de Santa Catarina. Revista Brasileira de Geociências, São Paulo,<br />
31: 223-230.<br />
3. Santin C., de la Rosa J.M., Knicker H., Otero X.L., Alvarez M.A., Gonzalez-Vila F.J. (2009).<br />
Effects of reclamation and regeneration processes on organic matter from estuarine soils and<br />
sediments. Organic Geochemistry 40: 931-941.<br />
<strong>Vol</strong>. 2 Page - 282 -
15th IHSS Meeting- <strong>Vol</strong>. 2<br />
Humification of Pyrogenic Organic Plant Residues in Soil<br />
André Hilscher a* and Heike Knicker b<br />
a Lehrstuhl für Bodenkunde, Technische Universität München, Freising-Weihenstephan,<br />
Germany; b Instituto de Recursos Naturales y Agrobiología de Sevilla (IRNAS-CSIC), Seville,<br />
Spain<br />
E-mail: hilscher@wzw.tum.de<br />
1. Introduction<br />
Incomplete combustion of vegetation results in pyrogenic organic material (PyOM) which<br />
occurs ubiquitously in soils and sediments. Pyrogenic organic material is considered highly<br />
recalcitrant and an important sink for carbon (C). To understand the C sequestration potential<br />
of PyOM in environmental systems knowledge is required about the respective degradation<br />
and humification mechanisms and the stability of the different chemical PyOM st<strong>ru</strong>ctures.<br />
Since the fire events do not only affect the C but also the nitrogen (N) cycle by conversion of<br />
the labile N pool to more stable heterocyclic N forms (black nitrogen). This N fraction needs<br />
to be more carefully considered if a complete understanding of the role of PyOM as a N sink<br />
in soils is sought. In order to bring some light on those questions, the present study focuses on<br />
the microbial recalcitrance of PyOM on molecular scale. Microcosm incubation experiments<br />
were performed to obtain insights about the involved humification mechanisms at different<br />
stages the PyOM degradation process. With the obtained data we hope to extract some<br />
important aspects of the C and N sequestration potential and the fate of aged PyOM in soils<br />
and sediments.<br />
2. Materials and Methods<br />
In this study the PyOM was produced from highly isotopically enriched 13 C (23.5 atom%) and<br />
15 N (62.8 atom%) rye grass (Lolium perenne) at 350°C under oxic conditions for one (1M)<br />
and four minutes (4M) to obtain residues with a different charring degree. The chars (400 mg)<br />
were mixed with a soil matrix of a B horizon of a Cambisol and incubated for up to 2.3 years<br />
at 30 °C under aerobic conditions. The water content of the soil samples was adjusted to<br />
approximately 60% of the maximum water holding capacity. To simulate the input of fresh<br />
unburned litter derived from the dying fire-destroyed vegetation, 400 mg of unburned and<br />
finely ground rye grass was added as a co-substrate (CS) to one of the two replicates of each<br />
series after 4, 10 and 16 months of incubation. With this design it was intended to identify a<br />
possible co-metabolic priming effect during the PyOM decomposition.<br />
<strong>Vol</strong>. 2 Page - 283 -
15th IHSS Meeting- <strong>Vol</strong>. 2<br />
The C and N contents were measured in duplicates by dry combustion (975 °C) using an<br />
Elementar Vario EL microanalyzer detecting N as N 2 and C as CO 2 . The 13 C and 15 N contents<br />
of the samples were measured with a quad<strong>ru</strong>pole mass spectrometer (InProcess Inst<strong>ru</strong>ments<br />
GAM 200) connected to the Elementar Vario EL. The chemical st<strong>ru</strong>cture of the PyOM were<br />
analysed using solid-state 13 C NMR spectrometer (B<strong>ru</strong>ker DSX 200) operating at a resonance<br />
frequency of 50.32 MHz. The cross polarisation magic-angle spinning (CPMAS) technique<br />
was applied with a spinning speed of 6.8 kHz. Solid-state 15 N NMR spectra for selected<br />
PyOM incubates were obtained using a B<strong>ru</strong>ker DMX 400 operating at 40.56 MHz.<br />
The total 13 C and 15 N amount of the incubated PyOM was calculated by mass balance using<br />
the sample weight and respective total C and N concentrations as well as the 13 C and 15 N<br />
contribution given in atom%. The natural 13 C and 15 N background was corrected by<br />
subtraction. To calculate the amount for each C and N group of the PyOM incubate, the<br />
proportion of the integrated signal area of the respective chemical shift region of the NMR<br />
spectra was multiplied by the total 13 C and 15 N amount of the incubate.<br />
The decomposition dynamic of the C groups of the PyOM was described with a first order<br />
decay model y = a × e (–k1×t1) and using the software SigmaPlot 2000, version 11.0 (SPSS Inc.).<br />
The term a describe the C pool, whereas k displays the turnover constant rate at the respective<br />
time t. Half-life periods of C groups were calculated with t 1/2 = ln2 / k.<br />
3. Results and Discussion<br />
In total up to 38% of the bulk PyOM C was mineralized during the 28 months of incubation.<br />
The O/N-alkyl C and alkyl C residues which survived the charring process were effectively<br />
decomposed. At the end of the incubation up to 73% and 57% of the initial O/N-alkyl C and<br />
alkyl C amount were mineralized or converted to other C groups, respectively. The calculated<br />
t 1/2 for the O/N-alkyl C was the shortest one with only up to 1.3 years and residence times<br />
between 6.8 and 8.8 years. The biodegradability of this potentially readily decomposable C<br />
source was strongly reduced by the factor 34 to 45 in relation to unburnt fresh grass material.<br />
The reduced microbial availability may be caused by chemical alterations during the charring<br />
process, e.g. the formation of anhydrosugars and/or physical protection by entrapment of<br />
more charred domains. The decomposition kinetic for t 1/2 of the alkyl C group is in the range<br />
of 2.1 and 2.5 years. In comparison with the decomposition rate of fresh grass material this<br />
times increased by factor 6 to 7. The total aryl C group recovery of the PyOM decreased<br />
significantly during the 28 months of incubation (p ≤ 0.001; Fig. 1A and B). After 20 months<br />
of incubation between 26% and 40% of the initial aryl C amount was lost (Fig. 1B). For this<br />
<strong>Vol</strong>. 2 Page - 284 -
15th IHSS Meeting- <strong>Vol</strong>. 2<br />
group, relative short t 1/2 e in the range of 3.0 and 3.8 years were obtained. The observed loss<br />
of aromatic C st<strong>ru</strong>ctures could be attributed to two simultaneous processes, the mineralization<br />
to CO 2 and the conversion to other C groups by partial oxidation. The latter may occur in two<br />
steps. The first includes the modification of the aryl st<strong>ru</strong>ctures by substitution of the aromatic<br />
ring C with hydroxyl groups to catechol like st<strong>ru</strong>ctures. This is in agreement with the fact, that<br />
the oxygen-substituted aromatic st<strong>ru</strong>ctures (O-aryl C) show small or no total decrease and a<br />
relative enrichment in spite of the considerable bulk C loss (Fig. 1C and D). Thereafter, in a<br />
second step the O-aryl ring st<strong>ru</strong>ctures will be oxygenated and cleaved, leading to increasing<br />
carboxyl/carbonyl C amounts (Fig. 1E and F). The strong correlation between the oxygensubstituted<br />
aromatic st<strong>ru</strong>ctures and carboxyl/carbonyl C groups supports this degradation<br />
path.<br />
The presence of a co-substrate (CS), e.g. supported by recovered vegetation and fire<br />
unaffected plant residues, showed no significant changes in the degradation pattern of the<br />
different PyOM (Fig. 1), possibly because decomposable sources were already available in<br />
the starting PyOM. The effective mineralization of the pure PyOM incubates confirms, that<br />
microbial degradation of strongly fire-altered plant residues can occur already in the initial<br />
post-fire phase even without supply of co-substrate. Further, this indicates that, even after<br />
intensive fires leaving almost no thermally unaltered plant residues, the newly developed<br />
microorganism communities need no additional nourishing substrate.<br />
Most of the organic bound N of the fresh PyOM was assignable to heterocyclic aromatic<br />
compounds such as pyrrole and indole-like st<strong>ru</strong>ctures with contributions of 62% and 72% for<br />
PyOM 1M and PyOM 4M, respectively. The other part of the 15 N NMR signal intensity was<br />
assignable to amid-like st<strong>ru</strong>ctures. No major alteration of the amide and heterocyclic N<br />
contribution was detected for the PyOM 1M incubates for all stages of the incubation<br />
experiment. For the more charred PyOM 4M, the relative heterocyclic N contribution<br />
decreased. After the 28 months of incubation no significant difference in the chemical N<br />
composition of PyOM 4M related to the PyOM 1M treatments could be observed (P=0.472).<br />
This trend was confirmed by an increase of the amide to heterocyclic N ratio which was in the<br />
range of 0.6 to 0.8 for the PyOM 4M incubates compared to 0.4 for the fresh PyOM 4M.<br />
Further, we detect a continuous degrease of the total amounts for the amide and heterocyclic<br />
N compounds. After 20 months, only 49% to 59% of the heterocyclic N compounds were<br />
recovered. The respective amid N recoveries were larger with 59% to 87%.<br />
<strong>Vol</strong>. 2 Page - 285 -
15th IHSS Meeting- <strong>Vol</strong>. 2<br />
4. Conclusions<br />
It can be concluded, that PyOM may not be as highly refractory as it is commonly assumed.<br />
During the efficient degradation not only a considerable PyOM amount is mineralized, but<br />
also the chemical st<strong>ru</strong>cture of the remaining PyOM is strongly modified. This includes the<br />
formation of O-containing functional groups and the loss of aromatic C and N containing<br />
heterocyclic domains by mineralization and conversion to other C and N groups The<br />
modification has implications for the PyOM properties and makes it more available for further<br />
microbial attack. The observed humification processes of the PyOM could make it<br />
complicated to distinguish some parts of aged PyOM from not fire-derived humified soil<br />
organic matter and explain the uncertainty in black carbon quantification.<br />
%<br />
% %<br />
55<br />
50<br />
45<br />
40<br />
35<br />
30<br />
25<br />
Aryl C<br />
24<br />
20<br />
16<br />
12<br />
8<br />
4<br />
0<br />
mg<br />
0 2 4 6 8 10 12 14 16 18 20 22 24 26 28 0 2 4 6 8 10 12 14 16 18 20 22 24 26 28<br />
C<br />
O‐Aryl C<br />
D<br />
16<br />
6<br />
12<br />
8<br />
4<br />
mg<br />
0<br />
0<br />
0 2 4 6 8 10 12 14 16 18 20 22 24 26 28<br />
0 2 4 6 8 10 12 14 16 18 20 22 24 26 28<br />
E<br />
Carboxyl/ Carbonyl C<br />
F<br />
20<br />
6<br />
16<br />
12<br />
8<br />
4<br />
0<br />
A<br />
Relative 13 C distribution (%)<br />
Initial 1M<br />
Initial 4M<br />
1M<br />
4M<br />
0 2 4 6 8 10 12 14 16 18 20 22 24 26 28<br />
Months<br />
1MCS<br />
4MCS<br />
mg<br />
4<br />
2<br />
4<br />
2<br />
0<br />
Total 13 C recovery (mg)<br />
0 2 4 6 8 10 12 14 16 18 20 22 24 26 28<br />
Months<br />
Figure 1: Time course of the relative distribution and total recovery of PyOM C groups during 28<br />
months of incubation.<br />
Acknowledgements<br />
We are grateful to Xiao Chen, Petra Müller and Josef Fischer for technical assistance and help<br />
with laboratory work. The project was financially supported by the Deutsche<br />
Forschungsgemeinschaft (DFG, KN 463/5-1,2).<br />
B<br />
<strong>Vol</strong>. 2 Page - 286 -
15th IHSS Meeting- <strong>Vol</strong>. 2<br />
Peculiarities of Geochemical Migration of Organic Matter in the System the<br />
Amur River – the Amur Liman<br />
Svetlana Levshina<br />
Institute of Water and Ecology Problems, Far Eastern Branch, Russian Academy of Sciences,<br />
65, Kim Yu Chen, 680000, Khabarovsk, Russia<br />
E.mail: levshina@ivep.as.khb.<strong>ru</strong><br />
1. Introduction<br />
Evacuation of organic matter (ОМ) by rivers exerts essential influence on development of the<br />
World Ocean. Study of ОМ in waters of the system river—Liman—the sea allows one to<br />
reveal peculiarities of its transport and transformations from rivers to seas and oceans. For<br />
proper understanding of the role the river <strong>ru</strong>noff plays in geochemistry of the ocean, the<br />
knowledge of its quantitative and qualitative compositions is of importance and we need also<br />
to understand complicated and diverse physical-chemical and biological processes occurring<br />
at the contact of free-salined river and saline marine waters. Information on evacuation of OM<br />
by waters of the Amur River to the marginal seas of the Pacific Basin is extremely<br />
constrained, as for such information on evacuation of humic substances, it is almost missing.<br />
The goal of the paper is to bring out principally new data on the amount and distribution of<br />
ОМ and, particularly, of humus acids in the Amur River mouth and in the mixing zone<br />
between the river and marine waters.<br />
2. Materials and Methods<br />
Studies were carried out in the Amur River, the Amur Liman, the Tatar Strait and the<br />
Sakhalin Bay in June, 2007. Water samples were taken in the Amur River mouth and in the<br />
mixing zone of river and marine waters. The total number of observation stations was as large<br />
as 30, more than 70 water samples have been analyzed. To separate suspension from solution the<br />
water samples were filtered via membrane filters with a pore diameter of 0.45 µm. Total (TOC) and<br />
dissolved (DOC) organic carbon were determined in the water samples using standard techniques<br />
applied for chemical analysis of natural waters [1]. <strong>Humus</strong> acids (HFA), i.e., humic and fulvic acids<br />
were determined by DEAE-method [2].<br />
3. Results and Discussion<br />
As a result of the studies, it was determined that the organic carbon was mainly dissolved in<br />
the waters under study (77.0–97.7% from TOC). The amount of DOC varied from 2.1 to 8.4<br />
<strong>Vol</strong>. 2 Page - 287 -
15th IHSS Meeting- <strong>Vol</strong>. 2<br />
mg C·L -1 . The greatest amount was detected in the Amur mouth water with a salinity of <<br />
0.1‰ and it was related to influx of OM with river <strong>ru</strong>noff. Amount of humic acids was the<br />
maximum and reached 4.65 mg C·L -1 . Such high concentrations of humic acids are rather<br />
typical of the Amur water [3, 4].<br />
TOC, mg L -1<br />
12<br />
10<br />
8<br />
6<br />
4<br />
2<br />
0<br />
0 10 20 30 40<br />
S, ‰<br />
A<br />
mg CL -1<br />
10<br />
DOC<br />
8<br />
HFA<br />
6<br />
4<br />
2<br />
0<br />
0 10 20 30 40<br />
S, ‰B<br />
Figure: ТОС (A), DOC and HFA (B) in the Surface Water Layer in the Amur Liman, the Tatar Strait<br />
and the Sakhalin Bay in Correlation with Water Salinity in June, 2007. Note. Water salinity<br />
concentrations are given for 1–2 m depth<br />
In the mixing zone intense sedimentation of OM evacuated by the river occurs at a salinity of<br />
water already reaching 1.0 ‰. The amount of humic acids in the water decreases to 2.80 mg<br />
C·L -1 . A diversity of processes occurring in the mixing zone (biogeochemical transformations,<br />
adsorption-desorption interactions, flocculation, etc.) at different stages of free-salined and<br />
saline water mixing result not in immediate dilution but in transformation of dissolved<br />
(DOM) to water-soluble organic matter, and inversely. The most intense transformation of<br />
DOC to weighted OM occurs in the Amur Liman at a salinity of water attaining to 3–10 ‰.<br />
The amount of humic acids decreases sharply to 0.38 mg C·L -1 . Probably, an increase in the<br />
water salinity results in intensification of dissociation of humic acids which have undergone<br />
sedimentation in an area of geochemical barrier as a consequence of flocculation processes<br />
due to impact of mineral components of marine waters. The amount of OM in the waters of<br />
the Tatar Strait reaches 2.2 mg C·L -1 as the water salinity increases (close to marine water<br />
salinity) and it does not vary significantly within the water area.<br />
4. Conclusions<br />
Thus, it has been concluded that the Amur waters evacuated to the Amur Liman undergo<br />
significant changes in the mixing zone between the river and marine waters at a salinity of 3–<br />
10 ‰, the amount of humic acids decreasing by an order of magnitude and higher. The area of<br />
<strong>Vol</strong>. 2 Page - 288 -
15th IHSS Meeting- <strong>Vol</strong>. 2<br />
distribution of desalinated waters enriched to a maximum degree by river-origin OM extends<br />
from the Amur River mouth in the northeastern (Okhotsk) direction.<br />
Acknowledgements<br />
The author is thankful to the researcher V.M. Shulkin for his assistance in data acquisition<br />
during the expedition, the researchers of the Pacific Oceanology Institute, FEB RAS for<br />
providing with water salinity concentration data and to the expedition chief D.A. Nekrasov.<br />
References<br />
1. O.A. Alekin A.D. Semenov and B.A. Skopintsev, Rukovodstvo po khimicheskomu analizu vod<br />
sushi (Manual on Chemical Analysis Continental Water), Leningrad: Gidrometeoizdat, 1973.<br />
266p.<br />
2. V.N. Krasyukov and I.A. Lapin. USSR Inventor’s Certificate No. 1385041, Byull. Izobret., 1988,<br />
no. 12.<br />
3. S.I. Levshina. Humic Acids in River Waters in the Amur Region, Geogr. Prir. Res., 2006, no. 2,<br />
pp. 101–105.<br />
4. S.I. Levshina Dissolved and Suspended Organic Matter in the Amur and Songhua Water, Water<br />
Res., 2008, vol. 35, no 6. pp. 716–724.<br />
<strong>Vol</strong>. 2 Page - 289 -
15th IHSS Meeting- <strong>Vol</strong>. 2<br />
Relationship Between PARAFAC-Derived Compositional Heterogeneity of<br />
Fluorescent Water-Soluble Soil Organic Matter and Soil-St<strong>ru</strong>cture Stability<br />
Guy J. Levy * , Anna Lordian, Mikhail Borisover<br />
Institute of Soil, Water and Environmental Sciences, Agricultural Research Organization,<br />
The <strong>Vol</strong>cani Center, Bet Dagan, Israel<br />
E-mail: vwguy@volcani.agri.gov.il<br />
1. Introduction<br />
Soil organic matter (SOM) is considered as an effective cementing agent that contributes to<br />
the stabilization of soil aggregates and st<strong>ru</strong>cture [1,2]. However, there are also indications that<br />
under certain conditions SOM and especially humic substances (HS), which comprise a<br />
significant portion of SOM, can enhance clay dispersion and aggregate breakdown [3,4]. The<br />
opposing findings of the impact of SOM on aggregate stability could be related to the<br />
heterogeneity in the chemical composition of dissolved organic matter (DOM) in general, and<br />
that of dissolved HS in particular. Due to the DOM fluorescent properties, its compositional<br />
heterogeneity can be evaluated by 3D excitation emission fluorescence spectroscopy coupled<br />
with chemometric analysis (parallel factor analysis; PARAFAC) [5]). The objectives of this<br />
study were to characterize, with 3D fluorescence spectroscopy, the compositional<br />
heterogeneity of DOM and seek possible relationships between properties associated with soil<br />
st<strong>ru</strong>cture and the composition of DOM.<br />
2. Materials and Methods<br />
Samples from four Israeli soils (sandy loam, loamy sand, sandy clay and clay), were collected<br />
from two layers (0–15 and 15–30 cm) of fields with a different history of irrigation, i.e.<br />
irrigated by fresh water and by treated wastewater (TWW). The DOM was obtained from<br />
aqueous soil extracts (at soil:water ratio of 1:2) and then characterized using concentrations of<br />
dissolved organic carbon, UV absorbance and excitation emission matrices of fluorescence<br />
analyzed using PARAFAC [5]. Variability in the DOM composition was obtained from<br />
PARAFAC-based scores that are proportional to concentrations of fluorescent DOM<br />
components. Soil-st<strong>ru</strong>cture stability was characterized by measurements of saturated<br />
hydraulic conductivity and aggregate stability.<br />
3. Results and Discussion<br />
PARAFAC analysis identified three major components that account for most of variability of<br />
DOM fluorescent properties. Two components (numbered 1 and 2; Fig. 1) were considered to<br />
<strong>Vol</strong>. 2 Page - 290 -
15th IHSS Meeting- <strong>Vol</strong>. 2<br />
represent HS and the third to represent proteinaceous matter (containing tryptophan).<br />
Concentrations of the fluorescent DOM components were influenced by the type of water<br />
used for irrigation, with the impact of the latter being affected by soil type (Fig. 1). In the<br />
sandy clay and clay soils, samples irrigated with TWW yielded smaller concentrations of<br />
dissolved DOM components compared with samples irrigated with freshwater (Fig. 1B). In<br />
the loamy sand and sandy loam, the opposite trend was noted (Fig. 1A).<br />
1.20<br />
1.00<br />
A. Loamy sand<br />
Fesh water<br />
TWW<br />
0.35<br />
0.30<br />
B. Clay<br />
Fresh water<br />
TWW<br />
Concentration score<br />
0.80<br />
0.60<br />
0.40<br />
Concentration score<br />
0.25<br />
0.20<br />
0.15<br />
0.10<br />
0.20<br />
0.05<br />
0.00<br />
1a 1b 2a 2b 3a 3b<br />
0.00<br />
1a 1b 2a 2b 3a 3b<br />
Figure 1: Concentration scores of the three major DOM fluorescent components (1,2,3) in aqueous<br />
extracts from soils irrigated by fresh water and TWW, sampled at two depths of (a) 0–15 cm and (b)<br />
15–30 cm<br />
The st<strong>ru</strong>ctural stability determinants of the soils studied correlated significantly (at the P
15th IHSS Meeting- <strong>Vol</strong>. 2<br />
Changes in Dissolved Organic Matter Losses From Soils Under Different<br />
Management<br />
Corinna M. Byrne a* , Michael H.B. Hayes a , Andre J. Simpson b .<br />
a<br />
University of Limerick, Limerick, Ireland; University of Toronto at Scarborough, Canada.<br />
E-mail: corinna.byrne@ul.ie<br />
1. Introduction<br />
Dissolved organic matter (DOM) represents the largest fraction of mobile carbon (C) on earth.<br />
Despite its importance; the st<strong>ru</strong>ctural components of soil DOM and the variations of these<br />
components with different land management practices have not been well resolved. In this<br />
study the DOM formed from two Irish grassland soils, one well drained and the second poorly<br />
drained, each amended with fertiliser and with fertiliser and urine, are characterised using<br />
advanced multidimensional nuclear magnetic resonance spectroscopy (NMR).<br />
2. Materials and Methods<br />
Soil cores from a well drained (WD) Brown Podzolic soil and from a poorly drained (PD)<br />
Gley were installed in 2004 in lysimeters in a pasture field at the Teagasc Environmental<br />
Research Centre (ERC), Wexford, Ireland. Each soil was sown with perennial ryegrass<br />
(Lolium perenne L.). In order to replicate typical Irish grazed grassland, some of the lysimeter<br />
soils were amended with fertiliser and some with fertiliser plus bovine urine. Unamended<br />
soils served as controls. With the exception of the controls, the lysimeter soils received in<br />
2004 and 2005, 291 kg N ha -1 yr -1 as fertiliser and 310 kg N ha -1 yr -1 as urine. A series of pipes<br />
transported the drainage water (DW) from each lysimeter to storage vessels housed below<br />
ground level. Drainage water samples, 200 L from each treatment and control, were collected<br />
between June and December, 2005. The procedure by Hayes et al. [1] was used to isolate<br />
DOM from the drainage waters. For this paper the Ho acids will be referred to as Drainage<br />
Water Dissolved Organic Matter (DW-DOM).<br />
Samples (40 mg) for solution state NMR were dissolved in 600 μL of deuterium oxide (D 2 O)<br />
and titrated to pH 12 using NaOD to ensure complete solubility (spectra not shown).<br />
Additional samples (40 mg) were dissolved in 600 μL DMSO-d 6 . Samples were analysed<br />
using a B<strong>ru</strong>ker Avance 500 MHz NMR spectrometer equipped with a 1 H- 19 F- 15 N- 13 C 5 mm,<br />
quad<strong>ru</strong>ple resonance inverse probe with actively shielded z-gradient (QXI). 1D solution state<br />
1 H NMR spectra were obtained by the procedures outlined in [2]. In addition<br />
multidimensional NMR experiments (Heteronuclear multiple quantum coherence (HMQC),<br />
Total correlation spectroscopy (TOCSY) and Nuclear Overhauser Effect Spectroscopy<br />
<strong>Vol</strong>. 2 Page - 292 -
15th IHSS Meeting- <strong>Vol</strong>. 2<br />
(NOESY) spectra (not shown) were obtained in order to confirm suggested assignments in the<br />
1D spectra.<br />
3. Results and Discussion<br />
Figure 1A shows the 1 H NMR spect<strong>ru</strong>m in DMSO-d 6 for the DW-DOM isolated from the PD<br />
soil treated with fertiliser with the major st<strong>ru</strong>ctural components labelled. Figure 1B is the<br />
diffusion edited (DE) NMR spect<strong>ru</strong>m of the same sample. The DE spect<strong>ru</strong>m produced<br />
contains only signals from larger molecules or rigid molecular associations. Because the<br />
majority of the signals remain after diffusion editing, it can be considered that the components<br />
in the DW-DOM are likely to be larger molecules or very stable aggregates. Figures 1B and<br />
1C compare the DE spect<strong>ru</strong>m of the DW-DOM with that obtained for microbes cultured from<br />
a Canadian dark grey Chernozem soil [3]). The similarities between the spectra highlight the<br />
input of microbial biomass to the DW-DOM isolated from the drainage waters. Comparison<br />
of the spect<strong>ru</strong>m for DW-DOM (Fig 1B) with that of the Organosolv lignin (Fig 1D) clearly<br />
indicates the contributions of lignin to the DW-DOM. Thus it can be concluded that the DW-<br />
DOM is likely to be a mixture of soil derived plant and microbial materials that have<br />
previously been identified in a range of NOM samples [4].<br />
Both of the control soils had similar exports of Ho acids in their DW (1.62 mg L -1 WD and<br />
1.54 mg L -1 PD). However, the application of fertiliser gave rise to large increases. Exports of<br />
DW-DOM were 1.5 times greater from the WD soil, and were almost 2.5 times greater from<br />
the PD soil. The NMR spectra indicate that there is an increase in the lignin contribution to<br />
the DW-DOM (Figure 2A vs. B, D vs. E) as the result of fertiliser applications. Semiquantitative<br />
analysis indicates that, compared to the control, treatment of the soil with<br />
fertiliser increased the lignin-derived components in the WD DW-DOM by ca 50% and ca<br />
300% in the case of the PD DW-DOM. The increases in total DW-DOM exported and in<br />
lignin-derived materials are likely to have resulted from the increased vegetative growth<br />
arising from the fertiliser-N amendments.<br />
Applications of fertiliser plus urine (F+U) caused less DW-DOM losses than the treatment<br />
with fertiliser alone, (2.25 mg L -1 for WD and 1.87 mg L -1 for PD) but greater than from the<br />
control. 1 H NMR spectra show a significant decrease in the lignin-derived signal in the DW-<br />
DOM isolated from both F+U treated soils (Fig. 2: B vs. C, E vs. F). This correlates well with<br />
the semi-quantitative analysis that suggested a decrease of 70 % (in comparison to the<br />
control) in the lignin-derived OM signal for the WD DW-DOM and a decrease of 3% for the<br />
PD DW-DOM as the result of treatment of the soil with F + U. It is probable that this decrease<br />
<strong>Vol</strong>. 2 Page - 293 -
15th IHSS Meeting- <strong>Vol</strong>. 2<br />
in C export in the drainage water from the F+U treated soils resulted from increased microbial<br />
activity in the soil from the addition of urine. The relative contributions from aliphatic<br />
components compared to the lignin components in spectra for both PD and WD plots<br />
increased with applications of F+U (Fig. 2, C and F, see arrows) corresponding to an<br />
accumulation of aliphatic components in the DW-DOM. Such may result from a decrease in<br />
the more readily degradable fraction (i.e. lignin), resulting in higher concentrations of the<br />
‘less digestible’ cuticular fraction in the soil. Part of the DOC in the soil solution from<br />
beneath urine patches can arise from root damage which may explain the greater contribution<br />
of methylene units, possibly from suberin in the root material, to the spectra of the DW-DOM<br />
isolated from the DW of the soils treated with F+U.<br />
Aliphatic<br />
DMSO<br />
Aromatic<br />
Anomeric<br />
protons<br />
in Carb<br />
Lig OCH 3 /<br />
Carb<br />
A<br />
P<br />
P<br />
Lig<br />
P<br />
P<br />
WC/L<br />
P<br />
B<br />
N-H<br />
Phe<br />
α-protons<br />
SC<br />
CH 3<br />
C<br />
Methoxyl<br />
Aromatic<br />
D<br />
9 8<br />
7<br />
6<br />
5<br />
4<br />
3<br />
2<br />
1 ppm<br />
Figure 1: (A), 1 H NMR spect<strong>ru</strong>m in DMSO- d 6 for DW-DOM isolated from the PD soil treated with Fertiliser .<br />
(B), Diffusion edited 1 H NMR spect<strong>ru</strong>m in DMSO- d 6 for the DW-DOM. (C), Cultured soil microbes. (D),<br />
Organosolv Lignin. Assignments include lignin (Lig), carbohydrates (Carb), proteins/peptides (P), waxes,<br />
cuticles and lipids (WC/L), protein/peptide sidechains (SC), phenylalanine (Phe) and amide (N–H).<br />
The drainage regime affected the responses of each soil to the treatments. Application of<br />
fertiliser caused a greater increase in the exports of DW-DOM from the PD soil. That<br />
reflected the decreased aeration (compared to the WD soil) in the PD soil which resulted in a<br />
lesser decomposition of the increased OM input in the DW-DOM. In contrast, the fertiliser<br />
plus urine application gave rise to a decrease in the DW-DOM from the PD soil, compared to<br />
the treatment with fertiliser alone. A plausible explanation for this might be that the urine may<br />
have been transported more slowly through the PD soil resulting in a higher level of microbial<br />
activity, increased decomposition, and a lower export of DW-DOM.<br />
<strong>Vol</strong>. 2 Page - 294 -
15th IHSS Meeting- <strong>Vol</strong>. 2<br />
4. Conclusions<br />
Irrespective of the causes of these changes it appears land management practices significantly<br />
alter the composition of DOM released into drainage water. This study shows that the<br />
stimulation of microbial activity by amendment with urine decreased the recalcitrance of the<br />
lignin components, indicating that lignin is more readily degradable than previously thought.<br />
This work will help to understand the movement of C between the terrestrial and aquatic<br />
environments.<br />
Aromatic<br />
P<br />
Lig<br />
DMSO<br />
P*<br />
(CH 2<br />
) n<br />
CH 3<br />
Aromatic<br />
Lig<br />
CH 3<br />
DMSO<br />
(CH 2<br />
) n<br />
A<br />
D<br />
B<br />
E<br />
C<br />
F<br />
9 8 7 6 5 4 3 2 ppm<br />
9 8 7 6 5 4 3 2 ppm<br />
Figure 2: 1 H NMR spectra for DW-DOM in DMSO- d 6 , differing by soil and treatment. (A), WD Control; (B),<br />
WD Fertiliser; (C), WD Fertiliser + Urine; (D), PD Control; (E), PD Fertiliser; and (F), PD Fertiliser + Urine.<br />
Simple assignments for spectra indicate strong contributions from aromatic functionalities, from P,<br />
proteins/peptides; Lig, lignin; Carb, Carbohydrate; (CH 2 ) n , aliphatic methylene units consistent with aliphatic<br />
st<strong>ru</strong>ctures from plant-derived waxes, cuticles and lipids, in addition to contributions from microbial lipids;<br />
(CH 3 ), could be due to methylated amino acid side residues plus contributions from terminal methyl groups from<br />
plant-derived residues.<br />
Acknowledgements: Financial support provided by Teagasc, EPA and SFI Ireland.<br />
References<br />
1. Hayes, T. M.; Hayes, M. H. B.; Skjemstad, J. O.; Swift, R. S., Compositional relationships<br />
between organic matter in a grassland soil and its drainage waters. Eur. J. Soil Sci. 2008, 59, 603–<br />
616.<br />
2. Byrne, C. M.; Hayes, M. H. B.; Simpson, A. J.; Baer, A.; Kumar, R.; Novotny, E. H.; Lanigan, G.;<br />
Richards, K. G.; Fay, D., Compositional Changes in Drainage Water Dissolved Organic Matter<br />
under Different Land Management Practices. In review.<br />
3. Simpson, A. J.; Simpson, M. J.; Smith, E.; Kelleher, B. P., Microbially derived inputs to soil<br />
organic matter: Are current estimates too low? Environ. Sci. Technol. 2007, 41,, 8070–8076.<br />
4. Lam, B.; Baer, A.; Alaee, M.; Lefebvre, B.; Moser, A.; Williams, A.; Simpson, A. J., Major<br />
st<strong>ru</strong>ctural components in freshwater dissolved organic matter. Environ. Sci. Technol. 2007, 41<br />
8240–8247.<br />
<strong>Vol</strong>. 2 Page - 295 -
15th IHSS Meeting- <strong>Vol</strong>. 2<br />
Distribution of Humic Substances and their Association with Fe and Al in<br />
Subtropical Oxisol Under Different Pasture Management Systems<br />
Deborah Pinheiro Dick a* , Graciele Sarante Santana b , Aino V.A. Jacques b ,<br />
Guilherme S. Chitarra a<br />
a Institute of Chemistry, UFRGS, Av. Bento Gonçalves, 9500, 91501-970, Porto Alegre,<br />
Brazil; b Soil Science Department, Agronomy Faculty, UFRGS, Avenida Bento Gonçalves,<br />
7712, 91501-970, Porto Alegre, Brazil<br />
E-mail: debby.dick@gmail.com<br />
1. Introduction<br />
Cattle rising is one of the main economic activity of the region located at the northeastern part<br />
of Rio Grande do Sul State, South Brazil, also known as Campos de Cima da Serra. Burning<br />
of vegetation residues at the end of the winter season is a common and ancient practice, which<br />
aims to promote the pasture regrowth in a shorter time compared to an unburned field [1]. In<br />
order to preserve biodiversity and to mitigate the greenhouse effect this practice has been<br />
forbidden approximately 10 years ago. Other strategies for pastures management, employing<br />
lower grazing intensity and frequency, introduction of new forage species, grassland cutting<br />
and soil liming and fertilization, are currently also used, resulting in a better quality and<br />
higher production of forage in comparison to the non-managed native pasture [2]. Conflicting<br />
results about the impact of fire on the quantity and quality of the soil organic matter (SOM)<br />
are found in the literature. Both increases [3] and decreases of SOM [4] have been reported<br />
after vegetation burning. Regarding SOM quality, the increase of its molecular recalcitrance<br />
depends on fire intensity and duration [5]. So far, no study has been conducted to investigate<br />
the SOM distribution in humic compartments in soils from the Campos region. The chemical<br />
compartment approach in the SOM analysis enables the characterization of its functionality<br />
and the evaluation of its reaction potential with cations. As a matter of fact, complexes of<br />
SOM-Fe and of SOM-Al play an important role in the cation mobility and disponibility, as<br />
well as in the pedogenesis [6, 7]. The present study aimed to evaluate the effect of three<br />
pasture managements on the distribution and composition of humic substances and their<br />
interaction with Fe and Al, in profiles of an Oxisol (800 m.a.s.l, 28 0 38’ S / 51 0 34’ W) under<br />
pasture. The SOM of the same soil under native forest was also analyzed for comparison<br />
purpose.<br />
<strong>Vol</strong>. 2 Page - 296 -
15th IHSS Meeting- <strong>Vol</strong>. 2<br />
2. Materials and Methods<br />
Soil samples (triplicates)were collected in four layers (0–5 cm, 0–20 cm, 20–40 cm, 40–60<br />
cm) of a Red Oxisol (heavy clayey soil) under: non-managed native pasture without burning<br />
in the last 41 years and grazed with 1.2 animal ha -1 (NP), native pasture without burning in<br />
the last 8 years and grazing of 0.5 animal ha -1 (BP), native pasture without burning in the last<br />
41 years, grazed with 1.2 animal ha -1 and ameliorated by liming and fertilization in the last 17<br />
years (AP) and native forest (NF). All pasture environments were submitted to biennial<br />
burning for more than 100 years before ceasing fire. Soil samples were analyzed by elemental<br />
analyses (Perkin Elmer 2400). Humic substances were fractionated employing HCl 0.1 M and<br />
NaOH 0.5 M solutions [8]. The carbon concentration was quantified in the acid (C HCl ),<br />
alkaline (C HS ) and in the fulvic acid (C FA ) extracts. The proportion of humic acids (C HA ) was<br />
obtained by the difference of (C HS –C FA ) and that of humin (C HU ) by (C soil - C HS - C HCl ). HA<br />
were purified by treatment with 5% HF/HCl (v/v), HU by treatment with 10% HF solution<br />
and FA by passing through XAD-8 resin [9]. Contents of Fe and Al were determined in the<br />
HCl, HS and FA extracts and in the purified FA suspension. Purified humic substances were<br />
analyzed by Fourier Transformed Infrared spectroscopy (FTIR) (Shimadzu 8300). From the<br />
FTIR spectra the relative intensities of the main absorptions were obtained [10] and an<br />
aromaticity index was calculated by dividing the intensity of absorption at around 1630 cm -1<br />
by the intensity of absorption at 2920 cm -1 (I 1630 /I 2920 ) [11].<br />
3. Results and Discussion<br />
In all studied environments, C content in the 0-5 cm layer surpassed that of the respective 0–<br />
20 cm layer, evidencing the higher contribution of the surface layer to the C sequestration in<br />
the first 20 cm soil depth (Table 1). The ameliorated pasture presented the highest C content<br />
in the first 5 cm among the pasture sites, exceeding that verified in BP. This result is assigned<br />
to the higher residue input in AP, as a consequence of its higher forage production which<br />
resulted from the better fertility condition in comparison to the BP site [1]. The contents of<br />
C HCl varied between 0.3 and 2.5 g kg -1 (Table 1) and contributed with 1.1 a 7.6% to the soil<br />
carbon. This compartment encompasses hydrophilic compounds of lower molecular weight<br />
than that of the HS st<strong>ru</strong>ctures. In the BP site both C HCl values (Table 1) and C HCl /C ratio were<br />
lower than in the NP and similar to those of the AP site. The increase in the fertility originated<br />
from amelioration (long term) or by vegetation burning (short term effect) may promote the<br />
<strong>Vol</strong>. 2 Page - 297 -
15th IHSS Meeting- <strong>Vol</strong>. 2<br />
Table 1: Contents of C and N, C/N ratio and contents of C in the acid extract, in the humic substances<br />
and in the humin fraction of the studied environments<br />
Site<br />
Depth C N C HCl C HS C HU<br />
(cm) g kg -1 C/N<br />
g kg -1<br />
0 – 5 48.5 ± 8.5 2.8 ± 0.5 17 ± 3.0 1.9 ± 0.1 20.3 ± 3.2 26.3 ± 8.4<br />
0 – 20 32.2 ± 3.7 1.7 ± 0.3 19 ± 1.3 2.5 ± 0.7 19.3 ± 2.6 10.5 ± 5.0<br />
NP 20 – 40 25.7 ± 1.1 1.0 ± 0.4 30 ± 12.6 1.5 ± 0.4 13.0 ± 1.3 11.2 ± 1.2<br />
40 – 60 18.3 ± 1.4 0.5 ± 0.1 36 ± 9.8 1.1 ± 0.5 10.1 ± 1.9 7.0 ± 3.0<br />
Mean 1.7 15.7 13.7<br />
0 – 5 42.7 ± 4.4 2.3 ± 0.1 19 ± 1.7 0.9 ± 0.1 20.0 ± 4.9 21.8 ± 8.3<br />
BP 0 – 20 31.9 ± 0.6 1.0 ± 0.2 34 ± 7.2 0.7 ± 0.1 17.1 ± 3.7 14.1 ± 4.0<br />
20 – 40 25.1 ± 2.4 1.1 ± 0.2 24 ± 5.1 0.3 ± 0.1 19.7 ± 4.3 5.2 ± 3.1<br />
40 – 60 19.6 ± 2.1 0.9 ± 0.4 24 ± 11.7 0.3 ± 0.1 10.9 ± 3.8 8.4 ± 4.9<br />
Mean 0.5 16.9 12.4<br />
0 – 5 56.5 ± 8.8 3.4 ± 0.4 16 ± 1.4 1.3 ± 0.7 20.2 ± 3.3 34.9 ± 4.9<br />
0 – 20 31.5 ± 2.6 1.5 ± 0.2 21 ± 3.1 0.3 ± 0.2 11.7 ± 0.2 19.4 ± 2.4<br />
AP 20 – 40 24.2 ± 1.6 1.1 ± 0.4 26 ± 13.3 0.3 ± 0.3 9.5 ± 0.3 14.4 ± 1.6<br />
40 – 60 19.7 ± 0.4 0.5 ± 0.1 40 ± 9.2 1.1 ± 0.2 10.6 ± 0.1 8.0 ± 0.2<br />
Mean 0.7 13.0 19.2<br />
0 – 5 60.4 ± 7.9 4.5 ± 1.1 14 ± 2.1 1.9 ± 0.3 23.2 ± 1.0 35.3 ± 7.2<br />
0 – 20 41.0 ± 5.6 2.7 ± 0.5 15 ± 0.7 1.2 ± 0.6 15.1 ± 2.0 24.7 ± 3.4<br />
NF 20 – 40 24.2 ± 2.8 1.3 ± 1.0 25 ± 13.4 1.3 ± 0.8 9.7 ± 0.8 13.2 ± 4.2<br />
40 – 60 18.8 ± 0.5 0.7 ± 0.2 28 ± 5.6 1.2 ± 0.5 9.6 ± 1.1 8.1 ± 2.1<br />
Mean 1.4 14.4 20.3<br />
Table 2: Contents of Fe and Al associated with the low molecular weight fraction (HCl), HS fraction,<br />
HA and FA (mean values obtained form the 4 analyzed layers), Al/Fe molar ratio in the HA, FA and<br />
purified FA fractions and FTIR indexes<br />
Fe (HCl) Fe (HS) Fe (FA) Fe (HA) Al (HCl) Al (HS) Al (FA) Al (HA)<br />
NP 0.92 0.34 0.04 0.29 3.02 22.30 18.93 3.38<br />
BP 0.77 0.32 0.07 0.26 3.75 21.97 20.81 1.33<br />
AP 0.31 0.44 0.10 0.46 1.77 17.78 15.07 2.6<br />
NF 0.27 0.65 0.11 0.54 1.66 13.60 13.47 1.96<br />
Al/Fe . (mol /mol) HA I 1630 /I 2920 HU I 1630 /I 2920<br />
HA FA PFA 0-5 cm 40-60 cm 0-5 cm 40-60 cm<br />
NP 24 912 90 1.2 ± 0.1 4.6 ± 1.0 0.9 ± 0.6 1.9 ± 1.2<br />
BP 11 977 424 1.2 ± 0.6 3.1 ± 0.2 0.9 ± 0.4 1.7 ± 0.8<br />
AP 16 325 47 1.0 ± 0.4 4.4 ± 0.5 1.7 ± 0.3 2.3 ± 1.8<br />
NF 8 261 73 1.5 ± 0.1 1.5 ± 0.4 0.7 ± 0.2 1.8 ± 1.6<br />
decrease of this SOM fraction, either by reducing its production or by promoting its<br />
precipitation in larger micells via cationic bridges. The content of HS did not differ relevantly<br />
among the environments in each layer (Table 1), but considering the average of the whole<br />
profile, the AP site tended to present higher HU and lower HS content than BP.<br />
The C AH /C FA ratio decreases in general in the order: PN (≥ 1.8) > AP ( ≈1.4) > BP (≤ 1),<br />
indicating that in the undisturbed pasture, the HA formation is favoured at the expenses of<br />
that of FA. In all environments and in both fractions, the index I 1630 /I 2920 increased with depth<br />
<strong>Vol</strong>. 2 Page - 298 -
15th IHSS Meeting- <strong>Vol</strong>. 2<br />
(Table 2). An increase of the SOM aromaticity along the profile has been reported previously<br />
for subtropical oxisols [12]. The relative intensity of the 1720 band (IR 1720 ) in the HA samples<br />
was higher in the AP environment, indicating a higher carboxylic degree of this humic<br />
fraction in comparison to the other environments. This result may derive from the more<br />
intense microbial activity and lower SOM stabilization due to the neutralization of the<br />
exchangeable Al [13] in the limed pasture. The HA from BP presented the highest IR 1070<br />
indicating a greater proportion of carbohydrate moieties and agrees with the findings of [3]. In<br />
the NP and BP environments, the content of Fe associated to low molecular weight SOM<br />
(Fe HCl ) was greater than Fe HS , while in the other two sites the inverse occurred (Table 2). This<br />
result suggests a different Fe dynamics in the ameliorated environment. In all studied sites<br />
Fe HA was greater than Fe FA and with Al the opposite occurred: Al FA ,> Al HA (Table 2). After<br />
purification of FA, the Al/Fe molar ratio still remained greater than that in HA, confirming<br />
that Fe has a higher affinity for HA and Al is complexed preferentially with FA.<br />
4. Conclusions<br />
In comparison to the non-managed pasture and to the recently fire affected pasture, pasture<br />
amelioration increased the soil C content only superficially and this occurred mainly due to<br />
the increase of the humin fraction. This management also altered SOM distribution in the<br />
humic compartments favouring the formation of smaller micelles (fulvic acids) in comparison<br />
to larger st<strong>ru</strong>ctures (humic acids). Humic acids and fulvic acids possess different affinity for<br />
Al and Fe, which may impart an effect on the pedogenesis process.<br />
Acknowledgements<br />
The authors aknowledge CAPES and CNPq for their support.<br />
References<br />
1. I. Heringer, MSc. Thesis, Universidade do Estado do Rio Grande do Sul, Brazil, 2000.<br />
2. I. Heringer and A.V.A. Jacques, Rev. Bras. Zootec., 31 (2002) 599.<br />
3. M.L. Potes, D.P. Dick, R.S.D. Dalmolin, H. Knicker, A.S. Rosa, Rev. Bras. Ci. Solo, in press (2010).<br />
4. J. M. De la Rosa, J.A. González-Pérez, R. González-Vázquez, H. Knicker, E. Lopez-Capel, D.A.C.<br />
Manning, F.J. González-Vila, Catena, 74 (2008) 296.<br />
5. C. Santín, H. Knicker, S. Fernández, R. Menéndez-Duarte, M.A. Álvarez, Catena, 74 (2008) 286.<br />
6. P. Buurman and A.G. Jongmans, Geoderma, 125 (2005) 71.<br />
7. M. González-Perez, P.V. Torrado, L.A. Colnago, L. Martin-Neto, X.L. Otero, D.M.B.P. Milori, F.H.<br />
Gomes, Geoderma, 146 (2008) 425.<br />
8. D.P. Dick, J. Gomes, P.B. Rosinha, Rev. Bras. Ci. Solo, 22 (1998) 603.<br />
9. D.P. Dick, P. Burba, H. Herzog, J. Braz. Chem. Soc., 10 (1999) 140.<br />
10. H.M. Gerzabek, R.S. Antil, I. Kögel-Knabner, H. Knicker, H. Kirchmann, G. Haberhauer, Eur. J. of Soil<br />
Sci., 57 (2006) 485.<br />
11. B. Chefetz, P. Hatcher, Y. Hadar, Y. Chen, J. Environ. Quali., 25 (1996) 776.<br />
12. D.P. Dick, C.N. Gonçalves, R.S.D. Dalmolin, H. Knicker, E. Klamt, I. Kögel-Knabner, M.L. Simões, L.<br />
Martin-Neto, Geoderma, 124 (2005) 319.<br />
13. L.B. Silva, D.P. Dick, A.V. Inda Junior, Ci. Rural, 38 (2008) 1167.<br />
<strong>Vol</strong>. 2 Page - 299 -
15th IHSS Meeting- <strong>Vol</strong>. 2<br />
Properties of Humic Acids in Soils Under Different Management Regimes<br />
Slawomir S. Gonet a* , Bozena Debska b , Andrzej Dziamski b , Magdalena Banach-Szott b ,<br />
Anton Zaujec c , Nora Szombathova c<br />
a Nicolaus Copernicus University, Department of Soil Science, 9 Gagarina St., 87-100 To<strong>ru</strong>n,<br />
Poland; b University of Technology and Life Sciences, Department of Environmental<br />
Chemistry, 6 Bernardynska St., 85-029 Bydgoszcz, Poland; c Slovak Agricultural University,<br />
Department of Geology and Pedology, Tr. A. Hlinku 2, 949-76 Nitra, Slovakia<br />
E-mail: gonet@umk,pl<br />
1. Introduction<br />
The content and properties of the organic matter are conditioned not only by the soil parent<br />
material and climatic conditions, but also the methods of soil management. Undoubtedly the<br />
change in the kind of soil management (post-arable land forestation, agricultural use of<br />
forests) results in changes in their properties [1, 5]. In forest soils one of the basic factors<br />
affecting the properties of the organic horizon is the forest stand species composition. The<br />
species composition of the forest stand also affects the properties of deeper horizons due to<br />
the migration of nutrients from surface layers. In arable soils the essential role in the<br />
development of soil humus is played by the post-harvest residue left after crop harvesting. In<br />
meadow soils the accumulation of humic acids (HAs) and the quantitative composition<br />
depend on the species composition of meadow sward [4].<br />
The intensity of mineralization and humification processes and the properties of humic<br />
substances produced, plant material which remains in the soil (post-harvest residue in arable<br />
soils, plant litter in forests) is much determined by their chemical composition and<br />
morphology [2, 3].<br />
The aim of the present paper was to determine the effect of the method of soil use on humus<br />
properties, including humic substances.<br />
2. Material and methods<br />
Forest soil samples from under oak (Quercus cerris L.) (O) and sp<strong>ru</strong>ce (Picea abies Karst.)<br />
(S) monocultures and meadow soil (M) samples were taken from the area of the arboretum in<br />
Mlynany (Slovakia); arable soil (A) samples were taken from the arable field next to the<br />
arboretum. The arboretum, set up in 1892, is located about 200 m above sea level, with<br />
changes in the altitude of about 20 m. The soils are Stagni-Haplic Luvisols. Humic acids were<br />
<strong>Vol</strong>. 2 Page - 300 -
15th IHSS Meeting- <strong>Vol</strong>. 2<br />
extracted and purified according to standard method using 0.5M NaOH, and analysed for<br />
elemental composition, UV-VIS absorption spectra and susceptibility to oxidation with H 2 O 2 .<br />
3. Results and Discussion<br />
The carbon content ranged from 32.4% (HAs from meadow soil 0–20 cm layer) to 35.5%<br />
(forest soil on oak stand 3–15 cm). The carbon content of HAs in arable soil was higher, and<br />
of hydrogen lower, than these elements in HAs from meadow soil and HAs from soil on<br />
sp<strong>ru</strong>ce stand from 0 to 30 cm and HAs from 0–3 cm from the oak stand. The HAs from the<br />
forest soil surface layer were poorer in nitrogen than the HAs from arable and meadow soil. It<br />
was observed that, the greater the depth, the higher the HAs carbon the lower that of the<br />
nitrogen content; additionally, in forest soil HAs the nitrogen content increased.<br />
As a result of changes in elemental composition, there were changes in atomic ratios and<br />
degree of internal oxidation (ω). The lowest value of the H/C ratio in the surface layer was<br />
found for HAs from arable soil and the highest for HAs from meadow soil (Table 1). The<br />
greater the depth, the greater the degree of HAs aromaticity (decrease in H/C ratio), for the<br />
oak stand already in the 5–20 cm layer and for the sp<strong>ru</strong>ce stand in the layers below 20 cm.<br />
The lowest O/C, O/H and ω values, as compared to HAs from meadow and forest soils, both<br />
in the surface and deeper layers, were found for arable soil HAs. The highest values were<br />
found in HAs from the oak stand soil.<br />
Elemental composition shows some variability and is conditioned by both habitat and<br />
anthropogenic factors [1]. However, much more information about the st<strong>ru</strong>cture and<br />
properties is provided by the ratios of respective elements. The atomic ratios allow for an<br />
approximate determination of the HAs by evaluating the degree of aromaticity (H/C ratio) and<br />
the degree of maturity (O/C, O/H, ω). A lower carbon content and higher hydrogen content<br />
and, as a result, higher H/C values in HAs from the surface layer of forest and meadow soils,<br />
than in HAs from arable soil, can point to their ‘chemically young age’ [2]. A lower nitrogen<br />
content and lower N/C ratio in the HAs from the surface layer of the forest soils are due to a<br />
lower content of this element in the plant residue undergoing decomposition. In arable soils<br />
both post harvest residue and the organic and mineral fertilization applied are the sources of<br />
nitrogen. Increasing nitrogen content of HAs in deeper layers of forest soils points to a higher<br />
degree of humification [2].<br />
Table 1 presents the absorbance values and the values of the A 2/4, A 2/6 , A 4/6 ratios. These<br />
parameters are frequently used to evaluate the degree of the organic matter humification and<br />
<strong>Vol</strong>. 2 Page - 301 -
15th IHSS Meeting- <strong>Vol</strong>. 2<br />
to determine the characteristics of the humic substances formed. The lowest HAs A 2/6 and A 4/6<br />
ratios for surface samples were for arable soil and the lowest HAs A 2/4 values for oak stand<br />
soil. Humic acids from the sp<strong>ru</strong>ce stand had higher values of the absorbance coefficients than<br />
HAs from the oak stand. It was also observed that the higher the depth, the lower the<br />
absorbance coefficients.<br />
Table 1: Characteristics of humic acids<br />
Soil H:C O:C O:H N:C ω A 2/4 A 2/6 A 4/6 %A 600<br />
A<br />
0–30 cm 1.27 0.548 0.431 0.078 0.059 5.87 32.5 5.54 71.9<br />
M<br />
0–20 cm<br />
20–30 cm<br />
O<br />
0–3 cm<br />
3–15 cm<br />
15–50 cm<br />
S<br />
0–5 cm<br />
5–20 cm<br />
20–30 cm<br />
30–50 cm<br />
1.37<br />
1.30<br />
1.30<br />
1.17a<br />
1.18a<br />
1.32a<br />
1.32a<br />
1.26b<br />
1.24b<br />
0.621<br />
0.578<br />
0.606<br />
0562a<br />
0.579a<br />
0.590ab<br />
0.616b<br />
0.578a<br />
0.572a<br />
0.452<br />
0.446<br />
0.464<br />
0.479<br />
0.493<br />
0.447a<br />
0.467c<br />
0.457b<br />
0.460bc<br />
0.088a<br />
0.084a<br />
0.072<br />
0.082a<br />
0.081a<br />
0.075<br />
0.084a<br />
0.082a<br />
0.083a<br />
0.134<br />
0.114<br />
0.122<br />
0.195<br />
0.226<br />
0.086<br />
0.164<br />
0.135<br />
0.139<br />
5.65<br />
4.92<br />
5.43<br />
4.83<br />
4.05<br />
6.33<br />
5.33<br />
4.85<br />
4.51<br />
35.7<br />
24.5<br />
35.6<br />
25.9<br />
19.6<br />
52.9<br />
32.1<br />
27.5<br />
25.2<br />
6.32<br />
4.99<br />
6.66<br />
5.37<br />
4.84<br />
8.53<br />
6.02<br />
5.67a<br />
5.60a<br />
77.2<br />
68.8<br />
85.3<br />
71.6<br />
66.7<br />
89.8c<br />
79.8b<br />
77.1ab<br />
74.6b<br />
H:C, O:C, O:H, N:C, ω=(2O+3N-H):C; in atomic%, from elemental analysis. A 2/4 , A 2/6 , A 4/6 ; absorbance ratios<br />
at 280 nm, 465 nm and 665 nm, respectively. %A 600 ; reduction of absorbance value at 600 nm after oxidation<br />
with H 2 O 2 (in %). a, b, c: only those relations were marked for which the Duncan’s test did not show significant<br />
difference.<br />
As it is seen from the literature, ‘young’ HAs, generally of lower molecular weight and degree<br />
of condensation of aromatic st<strong>ru</strong>ctures, show higher values of A 2/4, A 2/6 and A 4/6 than HAs<br />
with a high degree of humification [2,3]. The absorbance values and absorbance coefficients<br />
obtained herein indicate then that HAs isolated from soil sampled from the sp<strong>ru</strong>ce stand have<br />
the lowest degree of humification and that the degree of humification of HAs depends not<br />
only on the soil management but also on the depth at which they occur.<br />
The differences in the HAs properties were confirmed by the results of their susceptibility to<br />
oxidation with H 2 O 2 . This results in a dest<strong>ru</strong>ction of HAs, accompanied by a decrease in the<br />
absorbance of the solution. The results suggest that the highest susceptibility to oxidation is<br />
found for HAs isolated from samples taken from the sp<strong>ru</strong>ce stand. Humic acids from the<br />
meadow and arable soils showed a greater resistance to decomposition than HAs from forest<br />
soils. It is noteworthy that with depth, the susceptibility to oxidation is lower.<br />
If we assume that the aliphatic part of HAs is more susceptible to oxidation and the aromatic<br />
one more resistant [2], then the results demonstrate that HAs from arable and meadow soils<br />
<strong>Vol</strong>. 2 Page - 302 -
15th IHSS Meeting- <strong>Vol</strong>. 2<br />
show a greater participation of aromatic st<strong>ru</strong>ctures resistant to the effect of H 2 O 2 than HAs<br />
from forest soils and that the greater the depth, the lower the participation of aliphatic<br />
st<strong>ru</strong>ctures. The dendrogram (Fig. 1) show clearly that the main factor determining the soil<br />
properties analyzed is soil management.<br />
45<br />
Ward method<br />
36<br />
27<br />
Distance<br />
18<br />
9<br />
0<br />
S(0-5) O(0-3) O(3-15) S(5-20) M(0-20) A(0-30)<br />
Figure 1: Cluster analysis of humic acids determined on their characteristics<br />
4. Conclusions<br />
Organic matter properties of the soils and their HAs depended on the soil management use:<br />
HAs isolated from the surface layer of meadow soil showed a higher H/C ratio and higher<br />
values of the absorbance ratios A 2/6 and A 4/6 than HAs from arable soil. HAs from forest soils<br />
recorded a lower resistance to the effect of H 2 O 2 than HAs from meadow and arable soils.<br />
Acknowledgement<br />
This study was conducted within the research project PB-699/P06/2003/25 financed by the<br />
Polish Ministry of Scientific Research and Information Technology.<br />
References<br />
1. S.S. Gonet, Humic Subst. Environ., 1 (1997) 17.<br />
2. S.S. Gonet and B. Debska, Environ. Int., 24 (1998) 603.<br />
3. P.J.A. Howard, D.M. Howard and L.E. Lowe, Soil Biol. Biochem., 30 (1998) 285.<br />
4. G. Johansson, G., Soil Biol. Biochem., 24 (1992) 427.<br />
5. H. Smal, S. Ligeza, and M. Olszewska, Rocz. Glebozn., 55 (2004) 139.<br />
<strong>Vol</strong>. 2 Page - 303 -
15th IHSS Meeting- <strong>Vol</strong>. 2<br />
Changes in SOM Composition as a Function of Land-use<br />
M. Hetényi*, T. Nyilas<br />
Department of Mineralogy, Geochemistry and Petrology, University of Szeged, H-6701<br />
Szeged, PO.Box 651., Hungary<br />
E-mail: hetenyi@geo.u-szeged.hu<br />
1. Introduction<br />
Soil organic matter (SOM) being the largest reservoir of the terrestrial carbon, plays an<br />
important role in the global carbon cycle. SOM, which is acting as a carbon-dioxide source<br />
and sink, contains a wide range of chemically and kinetically different organic matters and<br />
exhibits large variations in relation to land use. Consequently, changes both in the abundance<br />
of SOM and in the proportion of SOM pools with different stability result in changes in the<br />
fluxes of carbon-dioxide between atmosphere and soil.<br />
Several authors have described that forest clearing and cultivation result in essential changes<br />
in SOM abundance [1, 2] and in the amount and composition of its refractory fraction<br />
inherited from the forest soil [3].<br />
Recently Rock-Eval pyrolysis has been used to follow organic matter transformation in soil<br />
and recent sediments [e.g. 4, 5, 6]. Rock-Eval pyrolysis has been applied for the rapid<br />
estimation of the relative contribution of major classes of heterogeneous organic matter<br />
differring in origin and thermal stability [7] only for topsoils (litter layers and A horizons).<br />
This work presents the changes in the composition of SOM and in the transformation of the<br />
source biomass from topsoil to subsoil horizons of Chernozem soil under forest use and under<br />
33 years of agricultural use after clearing. The relative contribution of the labile and resistant<br />
bio-macromolecules, immature and highly refractory geo-macromolecules has been<br />
determined by the mathematical deconvolution of Rock-Eval pyrograms.<br />
2. Materials and Methods<br />
Samples were collected from Chernozem soils from the temperate zone under continental<br />
influence (north-west Hungary). In this area the average precipitation is 550-600 mm year -1 ,<br />
the mean annual temperature is 9.5-9.8 o C. The topsoil and subsoil horizons of the nearly<br />
neutral (pH: 6.8) forest soil under mixed oak vegetation and the adjacent cultivated soil (pH:<br />
8.0), with calcium-carbonate concretions in the subsoil, were sampled (referred to as F t , F s<br />
and A t , A s , respectively). The A t and A s samples were taken after 33 years of wheat cropping<br />
following the clearing.<br />
<strong>Vol</strong>. 2 Page - 304 -
15th IHSS Meeting- <strong>Vol</strong>. 2<br />
Rock-Eval pyrolyses were performed with an Oil Show Analyzer: heating at 180 o C for 3<br />
min, programmed pyrolysis at 25 o C/min up to 600 o C under helium flow and oxidation at 600<br />
o C for 7 min under an air flow. The relative contribution of labile (fresh plant and litter) and<br />
resistant (lignin and cellulose) bio-macromolecules, immature geo-macromolecules (humic<br />
substances sensu lato) and highly refractory geo-macromolecules (naturally stable biological<br />
compounds, OM stabilized by physical-chemical processes and black carbon) was calculated<br />
by the mathematical deconvolution of Rock-Eval pyrograms.<br />
3. Results and Discussion<br />
Influence of land-use on the amount and composition of the studied SOM is shown both by<br />
bulk Rock-Eval data [5] and the relative contribution of the major classes of the organic<br />
matter differring in origin and thermal resistance (Table 1).<br />
Table 1: Changes in the relative contribution of the bio- and geo-macromolecules and in<br />
the preservation of the biomass from topsoil to subsoil horizons.<br />
Land – use Horizons BP l BP r GP i GP m BP l / BP r D iOM<br />
Topsoil (A t ) 20.1 18.6 23.0 38.3 1.08 0.23<br />
Agricultural Subsoil (A s ) 19.7 24.8 18.1 37.4 0.79 0.39<br />
Topsoil (F t ) 31.8 23.7 31.7 12.8 1.34 0.24<br />
Forest Subsoil (Fs) 11.8 18.3 18.9 51.0 0.64 0.20<br />
BP l : labile bio-macromolecules, BP r : resistant bio-macromolecules,<br />
GP i : immature geo-macromolecules (humic substances), GP m : highly refractory geo-macromolecules,<br />
D iOM : the degree of the preservation of the primary biomass: log [(BP l + BP r )/GP i ]<br />
The low organic carbon contents in the topsoil of the forest (3.9 %) and cultivated soil (1.6 %)<br />
are characteristic of the temperate zone under continental influence and are consistent with the<br />
general decreasing trend of SOM due to deforestation and cultivation. Similar values (3.5 and<br />
1.5 %) for Bulgarian Chernozem forest and cultivated topsoils have been reported [4].<br />
Results obtained from the mathematical deconvolution of pyrograms, in agreement with the<br />
bulk Rock-Eval data, reveal a moderate transformation of the source biomass to humic<br />
substances from the forest topsoil to the subsoil. It is shown by the slight decrease in the<br />
degree of the preservation rate (Table 1) and in the proportion of the bio-macromolecules<br />
(Table 2), as well as by the parallel increase in the proportion of the immature geomacromolecules<br />
(humic substances) (Table 2). Additionally, these observations are confirmed<br />
by the high decrease in the ratio of the labile and resistant bio-macromolecules and by the<br />
substantial increase in the relative contribution of the highly refractory geo-macromolecules<br />
(Table 1). The significant change in the HI values, together with the HI/OI ratios, also display<br />
the early stage of the humification processes [5].<br />
<strong>Vol</strong>. 2 Page - 305 -
15th IHSS Meeting- <strong>Vol</strong>. 2<br />
The vertical decrease in TOC content and HI values reflects more limited changes for<br />
cultivated soil than forest soil. The drop in the TOC content is twice as high for the forest soil<br />
as for the cultivated soil, 69 and 34 %, respectively. The markedly lower difference between<br />
HI values measured for the two horizons of the cultivated soil (131 and 102 mgHC/g TOC)<br />
compared with forest soil (144 and 80 mgHC/g TOC) is in good agreement with the<br />
proportion of labile bio-macromolecules in the SOM (Table 2). The labile biomass accounted<br />
for about one-third of the immature fraction both in agricultural topsoil and subsoil.<br />
Conversely, a markedly reduced storage of labile bio-macromolecules and a moderate<br />
degradation of the total immature fraction were observed from the forest topsoil to the subsoil.<br />
Differences in the downward decreasing proportion of labile bio-macromolecules relative to<br />
resistant ones (BP l / BP r in Table 1) suggest a slightly higher importance of resistant<br />
biopolymers in the forest subsoil than in agricultural subsoil.<br />
Table 2: The proportion of the labile (BP l ) and resistant (BP r ) bio-macromolecules<br />
and humic substances (GP i ) in the immature organic matter.<br />
Land – use Horizons BP l BP r GP i<br />
Agricultural Topsoil (A t ) 32.6 30.1 37.3<br />
Subsoil (A s ) 31.5 39.6 28.9<br />
Forest Topsoil (F t ) 36.5 27.2 36.4<br />
Subsoil (F s ) 24.1 37.3 38.6<br />
Comparing topsoil and subsoil horizons to each other, deforestation and agricultural<br />
cultivation resulted in dissimilar changes in the composition of SOM. Differences detected in<br />
the amount and composition of SOM between two horizons of the forest soil decrease during<br />
agricultural use. While no differences are observed in the transformation rate of the biomass<br />
for topsoils, the degree of the preservation of the primary vegetal input (Table 1) is nearly<br />
twice as high in the cultivated subsoil as in the forest subsoil. This conspicuously better<br />
preservation rate of the source biomass could be a consequence of the higher proportion of<br />
bio-macromolecules in the immature organic matter (Table 2).<br />
4. Conclusion.<br />
Bulk Rock-Eval data and the results of the mathematical deconvolution of pyrograms,<br />
monitored on the forest topsoil, show a characteristic Chernozem soil developed in the<br />
temperate zone under continental influence.<br />
Results, presented here, reveal a moderate increase in the transformation of the source<br />
biomass to humic substances from the forest topsoil to the subsoil.<br />
<strong>Vol</strong>. 2 Page - 306 -
15th IHSS Meeting- <strong>Vol</strong>. 2<br />
Forest clearing and cultivation did not result in changing the evolution of the humification<br />
process in the topsoil. Independently of land-use, a similar degree of the preservation of the<br />
primary biomass and a similar proportion of humic substances in the immature organic<br />
fractions (sum of bio-macromolecules and humic substances) were found for both topsoils.<br />
The higher proportion of labile bio-macromolecules and the lower proportion of resistant biomacromolecules,<br />
detected in the cultivated topsoil, could be a consequence of the different<br />
vegetation.<br />
Differences observed in the amount and composition of SOM between the two horizons of the<br />
forest soil decreased during agricultural use.<br />
Acknowledgements<br />
This work was funded by the Hungarian National Science Foundation (OTKA) through Grant<br />
K 81181.<br />
References<br />
1. D. Arrouays and P. Pelessier, Plant and Soil, 160 (1994) 215-223.<br />
2. D. Murty, M.F. Kirschbaum, R.E. Mc Mutrie and H. Mc Gilvray, Global Change Biology, 8<br />
(2002) 105-123.<br />
3. K. Quénéa, S. Derenne, C. Largeau, C. Rumpel and A. Mariotti, Geoderma, 136 (2006) 136-151.<br />
4. J.-R. Disnar, B. Guillet, D.Keravis, C. Di-Giovanni and D. Sebag, Organic Geochemistry, 34<br />
(2003) 327-343.<br />
5. M. Hetényi, T. Nyilas and T. M-Tóth, J. of Anal. Appl. Pyrolysis, 74 (2005) 45-54.<br />
6. C. Marchand, E. Lallier-Verges, J.-R. Disnar and D. Kéravis, Organic Geochemistry, 39 (2008)<br />
408-421.<br />
7. D. Sebag, J.R.Disnar, B.Guillet, C. Di Giovanni, E.P Verrechia and A. Durand, Eur J. Soil Sci., 57<br />
(2006) 344-355.<br />
<strong>Vol</strong>. 2 Page - 307 -
15th IHSS Meeting- <strong>Vol</strong>. 2<br />
NOM quality in forest soils from the NW of Spain: differences between<br />
Quercus robur L. and Betula alba L. plantations<br />
Irene Fernández*, Beatriz Carrasco, Ana Cabaneiro<br />
Departamento de Bioquímica del Suelo, Instituto de Investigaciones Agrobiológicas de<br />
Galicia, Consejo Superior de Investigaciones Científicas (CSIC), Apartado de Correos 122, E-<br />
15780 Santiago de Compostela, Spain<br />
E-mail: ifernandez@iiag.csic.es<br />
Natural organic matter from forest soils have a significant influence on the ecosystem<br />
sustainability as well as on the ecosystem fertility and productivity. Hence, the study of soil<br />
organic matter composition (Fernández et al., 2001; Ussiri y Johnson, 2003), in addition to the<br />
processes involved in soil organic matter transformations (Carballas et al., 1979, 1980, 1983;<br />
Fernández et al., 1999), appears as a recommended research line when we want to know the<br />
present and future status of the nutrient cycles in forest ecosystems (Nilsson et al., 1995;<br />
Sánchez et al., 1997; Fernández et al., 1999). Even though in recent times concerns about the<br />
C retention capacity of soils and their contribution to climate change mitigation by acting as<br />
CO 2 sinks (Dewar y Cannell, 1992; Hoen and Solberg, 1994; Huntington, 1995; Nabuurs y<br />
Mohren, 1995, Malhi et al., 1999, etc.) are increasing, data on the soil organic matter<br />
mineralization kinetics in the different types of forest ecosystems typical of the temperate<br />
zones are clearly insufficient, factors determining the potential C retention capacity of soils<br />
remaining practically unexplored (Murillo, 1994). Therefore, the objective of this research is<br />
to study the soil organic matter dynamics of two different types of deciduous forests of the<br />
temperate-humid zone (Quercus robur L. or Betula alba L.) located in Galicia (northwestern<br />
Spain) in order to compare their potential C mineralization activity.<br />
Forest ecosystems<br />
n = 24<br />
Quercus robur<br />
n = 12<br />
Betula alba<br />
n = 12<br />
Mature<br />
n = 6<br />
Young<br />
n = 6<br />
Mature<br />
n = 6<br />
Young<br />
n = 6<br />
High S.I.<br />
n = 3<br />
Low S.I.<br />
n = 3<br />
High S.I.<br />
n = 3<br />
Low S.I.<br />
n = 3<br />
High S.I.<br />
n = 3<br />
Low S.I.<br />
n = 3<br />
High S.I.<br />
n = 3<br />
Low S.I.<br />
n = 3<br />
<strong>Vol</strong>. 2 Page - 308 -
15th IHSS Meeting- <strong>Vol</strong>. 2<br />
With this purpose, 24 permanent forest plots (500 m 2 to 1000 m 2 ) were established according<br />
to the experimental design showed below and, in every plot, multiple soil samples were taken<br />
from the upper 0–15 cm of the A horizon. For each forest plot, a long term incubation of<br />
representative soil samples was carried out under controlled conditions (28 ºC and 75% field<br />
capacity) and de C mineralized was periodically determined by measuring the CO 2 produced<br />
during the biodegradation processes. To estimate labile and recalcitrant C pools in soils,<br />
cumulative data of soil CO 2 potential effluxes were fit to a double exponential kinetic model<br />
that considers two C pools of different lability and instantaneous mineralization rates.<br />
Differences on the total soil C content as well as on the soil organic matter mineralization<br />
kinetics between both forest types were found and the implications of the results obtained in<br />
the global warming mitigation strategies, are discussed. The results obtained are useful not<br />
only to evaluate the quantity of CO 2 released to the atmosphere from these Atlantic forests but<br />
also to contribute to a better prediction of the C balance in a global warming scenario.<br />
Acknowledgements<br />
This research was done in part in project AGL2007-66739-C02-02 Spanish Government<br />
(Ministerio de Ciencia e Innovación). We thank both the Dpto. Ingenería Agroforestal and the<br />
Dpto. Producción Vegetal (USC), for assistance in plot selection. We also thank Jose<br />
Salmonte, Ana Argibay and Cesar González for their technical assistance in the laboratory<br />
and fieldwork. Finally, we wish to thank Dr. Antonio de María, President of SILVANUS<br />
(Asociación Profesional de Selvicultures) and Dr. Javier Portela, Director de Producción U.N.<br />
Tablero, Financiera Maderera S.A. (FINSA) for their interest in this research.<br />
References<br />
1. M. Carballas, A. Cabaneiro, F. Guitian-Rivera and T. Carballas An. Edafol. Agrobiol 39 (1980)<br />
1034.<br />
2. M. Carballas, T. Carballas and F. Jacquin, An. Edafol. Agrobiol. 38 (1979) 1699.<br />
3. M. Carballas, T. Carballas, A. Cabaneiro, M. C. Villar, M. C.Leiros and F. Guitián Ojea, An.<br />
Edafol. Agrobiol 42 (1983) 1781.<br />
4. R. C. Dewar and M.G.R. Cannell, Tree Physiol. II (1992) 49.<br />
5. I. Fernández, A. Cabaneiro and T. Carballas, Soil Biol.Biochem. 31 (1999), 1853.<br />
6. I. Fernández, A. Cabaneiro, T. Carballas, Geoderma 104 (2001), 281.<br />
7. H. F. Hoen and B.Solberg, Forest Science 40 (1994), 429.<br />
8. T. G. Huntington, Soil Science Soc.Am. J.59 (1995) 1459.<br />
9. Y. Malhi, D. D. Baldocchi and P. G. Jarvis, Plant, Cell Environ. 22 (1999) 715.<br />
10. J. C. R. Murillo, Biogeochemistry 25 (1994) 197.<br />
11. G. J. Nabuurs and G. M. J. Mohren, Can J. Forest Resour. 25 (1995) 1157.<br />
12. L. O. Nilsson, R. F. Hüttl, V. T. Johansson and H. Jochheim Plant Soil, 168-169 (1995) 5.<br />
13. P. A. Sanchez, R. J. Buresh and R. R. B. Leakey, Phil.Trans.Royal Soc. London Series B -<br />
Biological Sciences 352 (1997), 949.<br />
14. D. A. N. Ussiri and C. E. Johnson , Geoderma 111 (2003), 123.<br />
<strong>Vol</strong>. 2 Page - 309 -
15th IHSS Meeting- <strong>Vol</strong>. 2<br />
Organic Matter Evolution in Northern Peatlands: A Multidisciplinary<br />
Approach<br />
Juliana D’Andrilli a , Malak Tfaily a , Elizabeth Corbett b , Jeff Chanton b , Soumitri S. Dasgupta c ,<br />
Donald I. Siegel c , Paul H. Glaser d , Bill Cooper a<br />
a Department of Chemistry and Biochemistry Florida State University, Tallahassee, FL 32306-<br />
4390, USA; b Department of Oceanography, Florida State University, Tallahassee, FL 32306-<br />
4320, USA; c Department of Earth Sciences, Syracuse University, Syracuse, NY, 13244-1070,<br />
USA; d Department of Geology and Geophysics, University of Minnesota–Twin Cities,<br />
Minneapolis, MN, 55455-0231, USA<br />
E-mail: jules.dandrili@gmail.com<br />
1. Introduction<br />
Peatland soils are virtually pure organic matter that is fixed and accumulated at the surface.<br />
Dissolved organic matter (DOM) in the porewaters is a complex mixture of polydisperse<br />
organic compounds formed by the breakdown of the solid material, with molecular weights<br />
typically between 300–700 Dalton as determined by Fourier Transform Ion Cyclotron<br />
Resonance Mass Spectrometry (FT-ICR-MS) [1]. Because peat organic matter contributes to<br />
both carbon storage and greenhouse gas emissions, the balance between total production and<br />
decomposition is of great interest [2]. In this work we have combined radiocarbon analyses of<br />
carbon decomposition products, analyses of major solutes, radiogenic and stable isotopic<br />
measurements of water, optical spectroscopy, 13 C NMR spectroscopy and ultrahigh resolution<br />
mass spectrometry in a multidisciplinary study of the bulk characteristics and molecular<br />
composition of solid- and solution-phase organic matter from different sites within the Glacial<br />
Lake Agassiz Peatlands (GLAP) of northern Minnesota. In this presentation we will focus on<br />
the DOM component found in peatland porewaters.<br />
2. Materials and Methods<br />
Dissolved organic matter was collected from peat porewaters in fens and bogs at varying<br />
depths (0–3.5 m) of the Red Lake II system of the Glacial Lake Agassiz Peatland (GLAP) in<br />
northern Minnesota. Porewater for radiocarbon analysis was collected in glass syringes and<br />
filtered in the field and flash frozen for preservation. Samples were prepared for 14 C analysis<br />
by UV oxidation with subsequent acidification and carbon dioxide removal. The 13 C split was<br />
analyzed by the dual-inlet system on the Finnigan MAT IRMS and excess carbon dioxide<br />
from the prior sample preparation step was preserved and analyzed at NOSAMS [1].<br />
Samples for hydrologic analysis were filtered and aliquots preserved for metals analyses by<br />
adding nitric acid. Calcium and strontium concentrations were determined by direct-current<br />
<strong>Vol</strong>. 2 Page - 310 -
15th IHSS Meeting- <strong>Vol</strong>. 2<br />
plasma-emission spectroscopy using a Beckman Spectrospan-V DCP Spectrometer at<br />
Syracuse University. Stable isotopes ( 18 O/ 16 O, 2H/ 1 ) as well as tritium were measured using<br />
standard techniques at Environmental Isotope Laboratory, University of Waterloo [3].<br />
Porewaters collected for mass spectral analysis were filtered through 0.7μm glass fiber filter<br />
cartridges in the field and frozen for preservation. Prior to analysis, DOM was extracted with<br />
hydrophobic solid-phase adsorbents. Mass spectra of extracted DOM were collected using the<br />
custom-built 9.4 Tesla FT-ICR mass spectrometer located at the National High Magnetic<br />
Field Laboratory (NHMFL) in Tallahassee, Florida [4].<br />
3. Results and Discussion<br />
Radiocarbon Analysis: The 14 C content of DOM is relatively modern throughout the peat<br />
column, to depths of 3.0 m [1]. In Sphagnum-dominated bogs, the respiration products are<br />
also similar, but more intermediate between the 14 C content of solid phase peat and the DOM<br />
(Figure 1(a)). However, for sedge-dominated peatlands, the 14 C content of the respiration<br />
products, carbon dioxide and methane, are essentially the same as that of the DOM (Figure<br />
1(b)).<br />
depth, cm<br />
(a)<br />
Δ 14 C ‰<br />
-400 -300 -200 -100 0 100 200<br />
0<br />
50<br />
A<br />
100<br />
150<br />
200<br />
250<br />
300<br />
Figure 1: Radiocarbon distribution with<br />
depth for GLAP Red Lake II. (a) Bog; (b)<br />
Fen. Peat radiocarbon values are<br />
represented by (♦), carbon dioxide by (▲),<br />
methane by (Δ), and DOC by (■). Taken<br />
from [1].<br />
depth, cm<br />
(b)<br />
Δ 14 C ‰<br />
-400 -300 -200 -100 0 100 200<br />
0<br />
50<br />
100<br />
150<br />
200<br />
250<br />
300<br />
*<br />
Geochemical Analysis: The concentration profiles<br />
of major ions in the porewater of bogs increase<br />
from the water table to 2.5 m depth, below which,<br />
the concentrations increase steadily to the base of<br />
peat. The fen porewater in general had higher<br />
calcium concentrations than found in water at<br />
comparable depth in bogs, and within a narrow<br />
range from >0.10 mmol/L at the water table to ~ 1.50 mmol/L at the base of peat (~ 3 m<br />
depth) [3]. The stable isotopic signatures of porewater in bogs differed markedly from that in<br />
fens. The δ 18 O of porewater in the bog ranged from –10.4 o / oo to –12.7 o / oo , but had contrasting<br />
deuterium enrichment values (ranging between –73.9 o / oo to –90.1 o / oo ) closer to the surface<br />
<strong>Vol</strong>. 2 Page - 311 -
15th IHSS Meeting- <strong>Vol</strong>. 2<br />
(
15th IHSS Meeting- <strong>Vol</strong>. 2<br />
Long Term Impact of Conservation Tillage Under Semi-Arid<br />
Mediterranean Conditions: Effect on Soil Humic Substance Content<br />
Panettieri M., Murillo J.M., Moreno F., López R., Madejón E. *<br />
Institute for Natural Resources and Agrobiology of Seville (IRNAS), CSIC. Avenida Reina<br />
Mercedes, 10. P.O. Box 1052, 41080- Seville, Spain.<br />
E-mail: emadejon@irnase.csic.es<br />
1. Introduction<br />
Soil organic matter (SOM) has a strong influence on physical, chemical and biological<br />
properties of soil, representing a superficial reservoir for organic carbon and plant nutrients<br />
and preventing soil erosion and water evaporation [1]. Most reactive compounds of SOM are<br />
humic substances (HS) that provide to enhance water and oxygen soil contents and also<br />
enhance cationic interchange capacity. Soil content and quality of SOM may vary depending<br />
on many factors such as climatic conditions, plants type cultivation and soil management [2].<br />
A soil under traditional tillage shows a characteristic depletion of SOM with a related<br />
worsening of crops yield. Nowadays traditional tillage (TT) was being replaced with other<br />
conservation tilling (CT) systems that product a maintenance or an increase of SOM at<br />
surface and also have economical benefits. We have evaluated in a long term experiment (18<br />
years) differences on HS and humic acids fraction (AH) contents and their stratification ratio<br />
in soils under TT and under CT.<br />
2. Materials and Methods<br />
A homogeneous area of about 2500 m 2 was selected in 1991 to establish the experimental<br />
plots, which were cropped with wheat under rainfed conditions. Two treatments were<br />
established, i) traditional tillage, TT consisted of mouldboard ploughing (25–30 cm depth,<br />
approximately), and ii) conservation tillage (reduced tillage), RT characterized by not using<br />
mouldboard ploughing, by reduction of the number of tillage [3]. Wheat (Triticum aestivum,<br />
L.)-sunflower (Helianthus annuus, L.) crop rotation was established for both treatments. In<br />
2005 a fodder pea crop (Pisum arvense, L.) was included in the rotation. Soil samples were<br />
randomly collected at 0–5, 5–10 and 10–30 cm depth at each plot. Total organic C content<br />
was determined on 0.5-mm ground soil samples by dichromate oxidation followed by titration<br />
with (NH 4 ) 2 Fe(SO 4 ) 2 . Extractable carbon content in the HS was determined on 0.5-mm<br />
ground samples using a Total organic carbon (TOC) TOC-VE Shimazu analyser after<br />
extraction with 0.1M Na 4 P 2 O 7 using a sample-to-extractant ratio of 1:10. An aliquot of the<br />
extract was acidified to allow the precipitation of the HA fraction, the precipitate containing<br />
<strong>Vol</strong>. 2 Page - 313 -
15th IHSS Meeting- <strong>Vol</strong>. 2<br />
HA was dissolved with sodium hydroxide and the C content was determined by a TOC-VE<br />
Shimazu analyser.<br />
3. Results and Discussion<br />
In the most superficial layer (0–5 cm) HS and HA contents were higher under CT, indicating<br />
the increase not only of the quantity (see TOC values, Fig. 1) but also of the quality of the<br />
SOM under this tillage system. At deeper layer these differences were less significant. In this<br />
study, noticeable increases of stratification ratios for TOC, HS and HA were also observed in<br />
CT (Fig. 1). This corroborates the adequacy of the stratification ratios of other variables<br />
different to SOC for defining benefits derived from CT under semi-arid conditions. Reducing<br />
layers turnover, HS were not mixed with deeper layers keeping their natural stratification.<br />
14<br />
6<br />
3.0<br />
g C Kg -1<br />
12<br />
10<br />
8<br />
6<br />
4<br />
2<br />
0<br />
0-5 cm 5-10 cm 10-30 cm<br />
5<br />
4<br />
3<br />
2<br />
1<br />
0<br />
0-5 cm 5-10 cm 10-30 cm<br />
2.5<br />
2.0<br />
1.5<br />
1.0<br />
0.5<br />
0.0<br />
0-5 cm 5-10 cm 10-30 cm<br />
STR TT = 1,147<br />
STR CT = 1,757<br />
TT TOC<br />
CT TOC<br />
STR TT = 1.194<br />
STR CT = 1.534<br />
TT HS<br />
CT HS<br />
STR TT = 0.885<br />
STR CT = 1.679<br />
TT HA<br />
CT HA<br />
4. Conclusions<br />
Figure 1<br />
Long-term conservation tillage was more effective than traditional tillage for increase humic<br />
substances at the soil surface (0–5 cm depth) under rainfed conditions. This improvement may<br />
greatly contribute at long term to sustainability of agricultural systems under semi-arid<br />
conditions, by keeping soil quality.<br />
Acknowledgements<br />
Authors want to thank to Commission Interministerial de Ciencia y Tecnología (CICYT)<br />
through project (AGL2008- 00424) which allowed this work to be carried out. M. Panettieri<br />
thanks to CSIC for funding his grant (JAE-PreDoc).<br />
References.<br />
1. P. Kinchesh, D.S. Powlson, E.W. Randall, Eur. J. Soil Sci., 46 (1995), 125.<br />
2. F.J. Stevenson, <strong>Humus</strong> Chemistry: Genesis, Composition, Reactions, 2 nd ed., Wiley, New York,<br />
1994.<br />
3. F. Moreno, F. Pelegrín, J.E. Fernández, J.M. Murillo, Soil Tillage Res., 41 (1997), 25.<br />
<strong>Vol</strong>. 2 Page - 314 -
15th IHSS Meeting- <strong>Vol</strong>. 2<br />
New and Old C Dynamics in a Long-Term Experiment as Affected by<br />
Fertilization Treatments<br />
1. Introduction<br />
Paola Gioacchini * , Daniela Montecchio, Guido Baldoni and Claudio Ciavatta<br />
DiSTA University of Bologna, Italy<br />
E-mail: paola.gioacchini@unibo.it<br />
Long-term field experiments are c<strong>ru</strong>cial for studying the effects of different management<br />
practices on organic carbon (C) storage capacity of agricultural soils. Fertilization practices by<br />
affecting plant biomass production can influence the amount of C that enters the soil and that<br />
can be stored in the humic fraction (HF). One useful tool to study the C turnover in soil is the<br />
isotopic technique [1,2] that can be applied when there is an experimental design including C3<br />
and C4 monocultures plots as in the long-term field experiment at the Cadriano farm<br />
(University of Bologna, Italy). In this experiment different fertilization treatments have been<br />
compared for forty years on a continuous-wheat (used as a reference field) and a continuousmaize<br />
cropping. By using the delta 13 C technique we measured the amount of new input of<br />
maize-derived C retained over a 40-years period and that of the old C3-C in soil organic C<br />
(SOC) and in the HF that is referred as the most stable pool of SOC. Moreover some<br />
information about the st<strong>ru</strong>cture of HF was achieved by thermal analysis [3,4].<br />
2. Materials and Methods<br />
The experiment, started in 1966 and still in progress, compares three fertilization treatments:<br />
mineral (200 and 300 kg N ha -1 for wheat and maize, respectively), cattle manure (2 t ha -1 of<br />
manure applied to soil at the end of the summer at the ploughing) and a control unfertilized.<br />
The experimental design is a split-plot replicated twice. The crop yields and the whole aboveground<br />
biomass were removed at harvest, whereas the below-ground biomass remained in<br />
soil. Soil samples were collected in 1973 (the first available sample), 1980, 1989, 1995, 2002<br />
and 2008. The HF was extracted according to the method of Ciavatta et al. [5], total organic<br />
C (TOC) and δ 13 C of soil and HF were determined by Continuous Flow-Isotope Ratio Mass<br />
Spectrometry (Thermo Fisher Scientific). The TG-DTA analysis was carried out by a Setaram<br />
Inst<strong>ru</strong>ment as reported by Francioso et al. [4].<br />
3. Results and Discussion<br />
The amount of SOC was not significantly affected by the fertilization treatment, whereas the<br />
different fertilization did affect the HF which level was constantly higher in the plots<br />
<strong>Vol</strong>. 2 Page - 315 -
15th IHSS Meeting- <strong>Vol</strong>. 2<br />
fertilized with manure compared to the others, thus also the humification rate<br />
(HR%=HF/TOC × 100) was found to be higher in these plots with average values of 44%<br />
compared to 39% and 33% for the mineral treatment and the control, respectively. The<br />
percentage of maize-derived C in SOC linearly increased in a similar way in all treatments<br />
reaching values of 28%, 30% and 26% for the control, mineral and manure treatment<br />
respectively, such as similar was also the decrease of the old C3-C (Fig. 1). These values of<br />
maize-derived C in SOC are similar to those measured by other authors in long-term<br />
experiments where the aboveground biomass is removed. Gregorich et al. [6] for example<br />
measured 15–20% of maize-derived C in SOC in unfertilized plots and 22–30% in fertilized<br />
ones over a 30-yr period.<br />
9,0<br />
soil C3-C g kg -1<br />
6,0<br />
3,0<br />
Control<br />
Mineral<br />
Manure<br />
0,0<br />
1973 1980 1989 1995 2002 2008<br />
sampling time<br />
Figure 1: Dynamics of soil C3-C over 40 years of experiment. (Bars are standard errors n = 4)<br />
The maize-derived C in the HF linearly increased and the values measured after 40 years were<br />
higher in the control and mineral treatment (34% and 31%, respectively) than in the manure<br />
treatment (26%). However the treatments strongly influenced the turnover of the old C3-C<br />
(Fig. 2) that decreased over the studied period in both Control and Mineral treatment with a<br />
faster rate with the mineral fertilization, whereas in the manure treatment this C pool did not<br />
show any decrease, but it was always constant with a tendency to increase. Therefore the<br />
higher content of humic C in the presence of manure was not due to a higher amount of<br />
maize-derived C entering this pool, but to a greater storage capacity of the old C3-C.<br />
<strong>Vol</strong>. 2 Page - 316 -
15th IHSS Meeting- <strong>Vol</strong>. 2<br />
Humic C3-C g kg -1<br />
5,0<br />
4,0<br />
3,0<br />
2,0<br />
1,0<br />
Control<br />
Mineral<br />
Manure<br />
0,0<br />
1973 1980 1989 1995 2002 2008<br />
sampling time<br />
Figure 2: Dynamics of C3-C in the humic fraction over 40 years of experiment. (Bars are standard<br />
errors n = 4)<br />
The TG-DTA analysis of the HF showed the presence of two exothermic peaks, the first<br />
(Exo1) at lower temperature (< 350 °C) maily related to the loss of carbohydrates and<br />
carboxylic groups, and the second (Exo2) at higher temperature (> 350 °C) related to the loss<br />
of aromatic st<strong>ru</strong>ctures and cleavage of C–C bonds [7,8]. The thermostability index<br />
(R 1 =Exo2/Exo1) indicates the relative amount of thermally stable fraction of organic matter<br />
with respect to the less stable fraction [4] This index was similar for the HF extracted from the<br />
control and the mineral treated plots (0.9) and it was not significantly different from the value<br />
measured in the control plots in 1973 (0.85). On the contrary, the repeated addition of manure<br />
lead to a decrease of R 1 index (0.69) that highlights a higher content of labile components as<br />
referred to the recalcitrant ones.<br />
4. Conclusions<br />
Long-term field experiments are c<strong>ru</strong>cial for studying C dynamics especially when the isotopic<br />
technique can be used to quantify new and old C dynamics in different C pools. In our study<br />
the new C input in SOC or in the HF, was not significantly influenced by the different<br />
fertilization treatments as well as the loss of old C3-C in SOC. However the manure<br />
application positively affected the HF favoring the increase in humification rate and reducing<br />
the loss of old C3-C. Moreover this treatment seems to affect the st<strong>ru</strong>ctural composition of<br />
the HF with a decrease of the thermostability index. However further investigation is needed<br />
<strong>Vol</strong>. 2 Page - 317 -
15th IHSS Meeting- <strong>Vol</strong>. 2<br />
to better highlight this aspect that might be somehow related to a different level and/or kind of<br />
biomass responsible for C transformations.<br />
Acknowledgements.<br />
The research was carried out with funds provided by MIUR (PRIN prot. 2007J5Z9LK_003).<br />
The field experiment was partially financed by CARISBO Foundation. The authors thank Dr.<br />
G. Giordani and dr. A. Nastri for their field assistance.<br />
References.<br />
1. J.A. Balesdent, A. Mariotti and B. Guillet, Soil Biol. Biochem., 19 (1987) 25.<br />
2. R. Allmaras, D.R. Linden and C.E. Clapp, Soil Sci. Soc. Am. J., 68 (2004) 1366.<br />
3. A.F. Plante, J.M. Fernández and J. Leifeld, Geoderma 153 (2009) 1.<br />
4. O. Francioso, D. Montecchio, P. Gioacchini and C. Ciavatta, Applied Geochem. 20 (2005) 537.<br />
5. C. Ciavatta, M. Govi, L. Vittori Antisari and P. Sequi, J. Chromatogr. 509 (1990) 141.<br />
6. E.G. Gregorich, B.H. Ellert, C.F. D<strong>ru</strong>ry and B.C. Liang, Soil Sci. Soc. Am. J., 60 (1996) 472.<br />
7. H.R. Schulten and Leinweber Eur. J Soil Sci., 50 (1999) 237.<br />
8. N. P. Peuravouri, and K. Pihlaja, Thermochim. Acta 325 (1999) 181.<br />
<strong>Vol</strong>. 2 Page - 318 -
15th IHSS Meeting- <strong>Vol</strong>. 2<br />
The Organic Matter of the Jurassic-Cretaceous Deposits in the Yenisey-<br />
Khatanga Regional Trough (East Siberia) According to Geochemical Data<br />
Ludmila Boldushevskaya a , Yuri Philiptsov b , Aleksandr Fomin c<br />
a OOO «RN-KrasnoyarskNIPIneft», Krasnoyarsk, Russia<br />
b Administration of Krasnoyarskiy kray Subsurface Resource Use, Krasnoyarsk, Russia<br />
c<br />
Trofimuk Institute of Petroleum Geology and Geophysics SB RAS, Novosibirsk, Russia<br />
E-mail: BoldushevskaLN@kgf.<strong>ru</strong><br />
1. Introduction<br />
Within the Yenisey-Khatanga regional trough, Jurassic and Cretaceous st<strong>ru</strong>ctural stage<br />
consists of marine, coastal-marine, and lagoonal-continental sediments. The Mesozoic<br />
deposits in the study area are represented by stratified siltstone, sandstone, and mudstone<br />
interlayers with coalified plant detritus inclusions, with coal interlayers and lenses. A series of<br />
oil and gas fields have been discovered in the Yenisey-Khatanga regional trough.<br />
2. Material and Methods<br />
The investigation of deposits have been carried out on the basis of the detailed analysis of the<br />
organic matter (OM) of sedimentary rocks by means of organic geochemical methods (Rock-<br />
Eval pyrolysis, elemental composition of kerogen, vitrinite reflectance) on the plotting results<br />
for the 86 wells drilled in the different tectonic zones and numerous facts. During the research<br />
three main prognostic geochemical criteria have been studied: the organic carbon content and<br />
distribution in the rocks, the genetic type of OM and the degree of OM catagenesis. These<br />
criteria determine the oil and gas generating potential of OM and sedimentary rocks.<br />
3. Results and Discussion<br />
The OM of sedimentary rocks in the study area belongs to facial genetic type. This OM is<br />
characterized by a wide variety of microcomponent content. The humic component prevails in<br />
the OM content of Apt-Albian, Upper Valanginian, Upper Bajocian-Lower Callovian and<br />
Oxfordian deposits. There were continental conditions during the formation of these levels so<br />
this OM is derived mainly from higher plants remains. Unst<strong>ru</strong>ctured microcomponent vitrinite<br />
prevails in the content of carbonaceous inclusions (up to 99%). Its reflectance shows the<br />
maximum paleotemperature. The high percentage of sapropelic component in OM content<br />
(over 50 %) has been detected in siltstone and argillaceous rocks of Upper Jurassic period.<br />
The bulk of sapropelic (aquatic, neptunian) type of OM is derived from the remains of<br />
phytoplankton and zooplankton. In Lower Jurassic deposits the sapropelic OM is derived<br />
from products of algal conversion.<br />
<strong>Vol</strong>. 2 Page - 319 -
15th IHSS Meeting- <strong>Vol</strong>. 2<br />
The OM of Jurassic deposits has the best oil and gas generating potential according to Rock-Eval<br />
pyrolysis data – organic carbon content (Corg) and hydrogenous index (HI). The catagenesis<br />
degree was studied by the comparison of vitrinite reflectance and Tmax parameter of OM<br />
pyrolysis. This comparison is suitable for the under study regional deposits with humic<br />
component in OM. It has provided for eduction of catagenetic and oil-and-gas generating zonality<br />
for the whole geological section and the Yenisey-Khatanga regional trough.<br />
4. Conclusions<br />
The study of content and degree of the catagenesis of OM in carbonaceous inclusions has shown<br />
that within the large study area the paleogeothermal gradient was similar during the formation of<br />
Jurassic and Cretaceous sedimentary deposits of the basin. The modern st<strong>ru</strong>ctural plan with its<br />
bending flexures and uplifts was finally shaped by later neotectonic activities.<br />
These findings have a direct bearing on the prognosis of oil-and-gas content and are important for<br />
the basinal modeling of oil-and-gas bearing systems.<br />
5. Acknowledgements<br />
The authors are grateful to A.E. Kontorovich (Trofimuk Inst. Petroleum Geology & Geophysics<br />
SB RAS, Novosibirsk), V.A. Krinin (Vankorneft), I.D. Polyakova (Inst. Lithosphere RAS,<br />
Moscow), M.S. Zonn (Inst. Geology and Development of Fossil Fuels, Moscow), I.Y. Yakovlev<br />
(Siberian Federal Univ.), V.N. Melenevskiy (Trofimuk Inst. Petroleum Geology and Geophysics<br />
SB RAS, Novosibirsk), for their help and contribution.<br />
References<br />
1. Yu.A. Filiptsov, L.N. Boldushevskaya, A.A. Kontorovich, V.A. Krinin, V.N. Melenevskiy.<br />
Application of pyrolysis to study the catagenesis of organic matter of the Mesozoic deposits in the<br />
Yenisei-Khatanga and Northeastern Pur-Taz Petroliferous areas//Russian Geology and<br />
Geophysics. <strong>Vol</strong>. 40, № 12, pp. 1804–1810, 1999.<br />
2. L.N. Boldushevskaya, Yu.A. Philiptsov, V.A. Krinin, A.N. Fomin. The oil-and-gas potential of<br />
the Jurassic and Cretaceous deposits of the Yenisey-Khatanga regional trough from geochemical<br />
data//Russian Arctic, St. Petersburg. VNIIOkeangeology. – pp. 364–371. 2002.<br />
3. L.N. Boldushevskaya, S.V. Ladygin, G.D. Nazimkov, A.P. Romanov, Yu.A. Philiptsov, A.N.<br />
Fomin. Organic matter of the Western Taimyr Paleozoic deposits and the western part of the<br />
Yenisey-Khatanga regional trough, paleotectonic reconst<strong>ru</strong>ctions from the geologic-geochemical<br />
data// Basement, frame st<strong>ru</strong>ctures of the Western Siberian Mesozoic-Cenozoic sedimentary basin.<br />
Tyumen-Novosibirsk, pp. 23–25, 2008.<br />
4. L. Boldushevskaya, Yu. Philiptsov, S. Ladygin, E. Kostyreva, A. Romanov, A. Fomin. Organic<br />
geochemistry of the Paleozoic deposits in the Western Taimyr. Proc. at the 24 th International<br />
Meeting on Organic Geochemistry. Bremen, pp. -149, 2009.<br />
5. A.G. Voizechovskaya. About the OM content in the Jurassic and Cretaceous deposit of the<br />
Yenisey-Khatanga regional trough// Yenisey-Khatanga oil-and-gas bearing region, Leningrad,<br />
1974.<br />
6. I.D. Polyakova, M.M. Kolganova, E.I. Soboleva, G.F. Stepanenko. The oil-and-gas content<br />
geochemical criteria of the Northern Siberian platform // The geology and oil-and-gas content of<br />
the Yenisey-Khatanga sedimentary basin. Moscow, Publishing House "Nauka", 1983.<br />
<strong>Vol</strong>. 2 Page - 320 -
15th IHSS Meeting- <strong>Vol</strong>. 2<br />
Effect of Clay Minerals on the Fungal Degradation of Humic Acid<br />
Yukiko Yanagi a *, Sachiko Makino b , Te<strong>ru</strong>hisa Miyagawa a , Nobuhide Fujitake c<br />
a Laboratory of Soil Science, Faculty of Horticulture, Minamikyushu University, Tatsuno<br />
3764-1, Miyakonojo, Miyazaki 8850035, Japan; b Laboratory of Soil Science, Faculty of<br />
Agriculture, and c Laboratory of Soil Science, Graduate School of Agricultural Science, Kobe<br />
University, Rokkodai 1-1, Nada, Kobe, Hyogo 6578501, Japan<br />
E-mail: yanagi@nankyudai.ac.jp<br />
1. Introduction<br />
Humic acids are considered to be very stable compounds in soil. They are resistant to<br />
biological degradation and their mean residence time is known to be several centuries [1]. The<br />
resistance of humic acids is probably a direct consequence of their peculiar molecular<br />
st<strong>ru</strong>cture that is resistant to microbial attacks. There are some reports that the biological<br />
stability of humic acids related to this resistant st<strong>ru</strong>cture [2,3,4]. In addition, an important<br />
mechanism of the protection of humus against biological degradation is the formation of<br />
complexes through metal ions associated with clay surfaces [5,6]. Numerous investigators<br />
have noted that soils with higher clay contents retain more C in humus and that certain<br />
organic materials decompose more slowly when in intimate contact with clay [7,8,9].<br />
However, there are few reports detecting the direct relationships between the stability of<br />
humic acid and interactions with clay minerals.<br />
The purpose of this study is to examine the effect of clay minerals on the stability of humic<br />
acid in vitro experiments. We used the decolorization of humic acid as an indicator of<br />
degradation, and carried out the degradation of humic acids by humic acid-degrading fungus,<br />
Coriolus consors, using culture media, which added three different clay minerals.<br />
2. Materials and Methods<br />
2.1. Clay minerals<br />
Kaolinite (Kt), montomorlillonite (Mt), and vermiculite (Vt) were used in this study.<br />
Before the incubating experiments, the clay minerals were treated with sodium citrate,<br />
sodium bicarbonate, and sodium dithionite to remove the Fe ion [10], and then dried the<br />
clay minerals after washing with distilled water.<br />
2.2. Humic acid<br />
Humic acid was prepared according to the IHSS method from soil samples of Cambisol A<br />
horizon (Hanaore, Kobe, Hyogo, Japan).<br />
<strong>Vol</strong>. 2 Page - 321 -
15th IHSS Meeting- <strong>Vol</strong>. 2<br />
2.3. Fungal strain<br />
The fungus Coriolus consors was used as an inoculum. This fungus is known to be a<br />
decolorizer of humic acids.<br />
2.4. Cultural condition and detection of decolorization<br />
The decolorization of the humic acid by C. consors with clay was monitored on Czapek-<br />
Dox liquid medium containing humic acid at a concentration of 0.5 g L -1 . The growth<br />
medium with dissolved humic acid was adjusted to pH 6.8 and sterilized by membrane<br />
filtration (pore size 0.22 µm). Ten ml of the medium was added to the sterilized test tubes<br />
with 0.3 g of each clay, and shaken for 2 days. After shaking, a loopful of fungal hyphae<br />
was inoculated and tubes were kept at 25 ˚C for 21 d in shaking incubators. After<br />
incubation, the fungal culture was acidified with 1 mol L -1 HCl, and left overnight. The<br />
acidified medium was centrifuged and the precipitate was recovered. The precipitate was<br />
treated with 0.1 mol L -1 sodium pyrophosphate – 0.1 mol L -1 NaOH mixture (1:1)<br />
overnight for humic acid extracting. The supernatant (humic acid fraction) separated by<br />
centrifugation was filled up to 10 ml and the absorbance at 600 nm was measured. Noninoculated<br />
medium was used as the control. The decolorization is given as a percent of the<br />
non-inoculated control.<br />
In the case of the Kt, clay dose experiment (0 to 0.5 g was added) was conducted under the<br />
same conditions described above.<br />
3. Results and Discussion<br />
The decolorization of humic acid by C. consors is shown in Fig. 1. The decolorization values<br />
of the culture incubated without clay ranged from 35.8 to 36.8%. In contrast, those values of<br />
the cultures incubated with clays ranged from 4.9% for Vt to 21.2% for Mt. Since the<br />
decolorization values of all the cultures treated with clays were lower than those of the<br />
untreated cultures, our results indicate that the biological degradation of humic acid was<br />
inhibited by clay minerals. It is known that clay minerals absorb humic acids,<br />
microorganisms, and enzymes [11, 12]. These interactions may be involved in the mechanism<br />
of humic acid resistance against to biological degradation. The decolorization values differed<br />
for each of the clay minerals that were added to the medium. Therefore, it was suggested that<br />
the inhibiting effects on the microbial degradation of humic acid depend on the kind of clay<br />
minerals. In particular, in spite of Mt and Vt belonging the same 2:1 clay group, showing<br />
<strong>Vol</strong>. 2 Page - 322 -
15th IHSS Meeting- <strong>Vol</strong>. 2<br />
similar specific surface area and cation exchange capacity [13], their decolorization values are<br />
considerably different.<br />
<strong>Vol</strong>. 2 Page - 323 -
15th IHSS Meeting- <strong>Vol</strong>. 2<br />
80<br />
60<br />
•<br />
•<br />
•<br />
40<br />
Figure 1: Decolorization of humic acid by<br />
Coriolus consors with three clay minerals.<br />
: Untreated with clay<br />
•: Treated with clay<br />
20<br />
•<br />
0<br />
0 0.1 0.2 0.3 0.4 0.5<br />
Kt (g)<br />
Figure 2: Effect of the amount of<br />
kaolinite on the decolorization of humic<br />
acid by Coriolus consors<br />
As shown in Fig. 2, the percentages of decolorization decreased with increasing amounts of<br />
Kt. Because of the adsorption of the humic acid, microorganisms, and enzymes increased as<br />
the amount of clay minerals increased, we assumed that the humic acid was protected from<br />
the microbial attack more strongly or that the microbial attack became weaker.<br />
4. Conclusions<br />
In this research, decolorization experiments on humic acid using culture media both with and<br />
without clay minerals were performed. Among all three clay minerals, the decolorization of<br />
humic acid showed lower values in the presence of clay minerals. Moreover, it is suggested<br />
that the stability of humic acids depends on the kind and amount of clay minerals.<br />
References<br />
1. C.A. Campbell, E.A. Paul, D.A. Rennie and K.J. MacCallum, Soil Sci., 104 (1967) 217–224<br />
2. G. Almendros and J. Dorado, Eur. J. Soil Sci., 50 (1999) 227–236.<br />
3. Y. Yanagi, H. Tamaki, H. Otsuka, and N. Fujitake, Soil Biol. Biochem., 34 (2002) 729–731.<br />
4. Y. Yanagi, S. Hamaguchi, H. Tamaki, T. Suzuki, H. Otsuka, and N. Fujitake, Soil Sci. Plant Nutr.,<br />
49 (2003) 201–206.<br />
5. F.J. Stevenson, Soil Biol. Biochem., 11 (1979) 493–499.<br />
6. F.J. Stevenson, in G.R. Aiken, D.M. McKnight, R.L. Wershaw, P. MacCarthy (Eds.), Humic<br />
Substances in Soil, Sediment, and Water, Wiley, New York, 1985, pp13–52.<br />
7. F.E. Alison, Soil Organic Matter and its Role in Crop Production, Elsevier, Amsterdam.1973.<br />
8. D.L. Lynch and L.J. Cotnoir, Soil Sci. Soc. Am. Proc., 20 (1956) 367–370.<br />
9. L.H. Sorensen, Soil Biol. Biochem., 7 (1975) 171–177.<br />
10. O.P. Mehra and M.L. Jackson, Proc. 7 th Natl. Conf. Clay Minerals, Pergamon Press, 1958, p. 317.<br />
11. S.A. Boyd and M.M. Mortland, in J. M. Bollag and G. Stotzky (Eds), Soil Biochemistry <strong>Vol</strong>. 6,<br />
Marcel Dekker, Inc., New York, 1992, pp. 1–28.<br />
12. M. Robert and C. Chenu, in G. Stotzky, and J. M. Bollag (Eds), Soil Biochemistry <strong>Vol</strong>. 7, Marcel<br />
Dekker, Inc., New York, 1992, pp. 307–404.<br />
13. F.J. Stevenson, <strong>Humus</strong> Chemistry, 2nd ed., 1979, Wiley, New York, p. 430.<br />
<strong>Vol</strong>. 2 Page - 324 -
15th IHSS Meeting- <strong>Vol</strong>. 2<br />
Fixation of Organic Substance in Forms Resistant to Oxidative Degradation<br />
as the Universal Mechanism of Clay Transformation at Soil Formation in<br />
Forest-Steppe Conditions<br />
Alexander Shinkarev a , Kamil Giniyatullin a , Taliya Lygina b , George Krinari a<br />
a Kazan State University, ul. Kremlevskaya 18, Kazan, 420008, Russia; b Central Research<br />
Institute Geology of Industrial Minerals, ul. Zinina 4, Kazan, Russia<br />
E-mail: ashinkar@mail.<strong>ru</strong><br />
1. Introduction<br />
<strong>Humus</strong> substances and metastable secondary aluminosilicates are considered to be a spatially<br />
st<strong>ru</strong>ctured open nonequilibrium reacting self-organizing system of clay-metal-organic soil<br />
complex; a special role of illite-smectite (illite-vermiculite) minerals is emphasized [1].<br />
System functioning is reduced to maintenance of its kinetic stability. The system is one of the<br />
basic reservoirs adapted for organic carbon sequestration in the biosphere. In connection with<br />
the change of climate and growing emission of СО 2 there is a necessity of physicochemical<br />
modelling of its behaviour. Mechanisms of clay-organic interactions in soils, however, have<br />
not been adequately studied. Especially it concerns formations of an inert carbon pool. It is<br />
generally accepted that the inert pool is complex and tightly bound to clay minerals.<br />
Modern concepts about transformation of clay minerals in the early diagenetic zone, late<br />
diagenetic zone, anchizone and epizone conditions are rather consistent. But the mechanisms<br />
of transformation of mixed-layer phyllosilicates in a soil zone of the A horizon are becoming<br />
currently more and more debatable. For example, some researchers consider that the increase<br />
proportion of illite component in upper part of a soil profile is caused by preferential<br />
decomposition of an expansible phase. According to other researchers, though there is some<br />
evidence that illite may form pedogenically, but only in special circumstances [2]. Contrary to<br />
these points of view, as dominating forms of the transformation process in top of alteration<br />
soil profiles are considered to be both illite-to-smectite (simple “degradation” process) and<br />
smectite-to-illite (not fully understood “agradation” process). It is possible to admit [after 3],<br />
that the major difference, noticed by laboratory identification methods in upper part of a soil<br />
profile is the interlayer site occupancy and also that potassium fixation in closed (nonexpandable)<br />
layers can be a reversible process in some short periods of time. However, the<br />
explanations mentioned above do not take into account that the decrease in intensity of<br />
smectite basal diffractions can be caused by soil organic components tightly bound to<br />
interlayers. The possibility of this effect was investigated in experiments with artificial clay-<br />
<strong>Vol</strong>. 2 Page - 325 -
15th IHSS Meeting- <strong>Vol</strong>. 2<br />
humus complexes and in profiles of forest-steppe soils in natural environments.<br />
2. Materials and Methods<br />
Model experiments were conducted on “lingule clay” (P 2 kz 1 1 ) with high contents of<br />
dioctahedral micas formed from smectite. Change of its actual st<strong>ru</strong>cture after 3 years of<br />
interaction with decomposing plant residues has been investigated. In “field experiments” we<br />
analyzed mineral composition of clays in samples from profiles of chernozemic soils with<br />
different age of an archeological monument “ancient settlement – Big Klary” (Republic of<br />
Tatarstan).<br />
In samples with the size of particles
15th IHSS Meeting- <strong>Vol</strong>. 2<br />
As natural objects the profile samples of virgin forest-steppe soils have been used.<br />
Lithological homogeneity of soil profiles has been detected by X-ray diffraction phase<br />
analyses and total chemical analyses. X-ray diffraction patterns of basal reflexions appear to<br />
be the same as in the model experiments. There is depletion of X-ray diffraction patterns in<br />
the small angle area from the parent material to the upper part of a profile.<br />
Results of the elemental analysis have shown, that the content of resistant to H 2 O 2 treatment<br />
organic matter increases more than in 2 times in artificial clay-humus complexes (after<br />
incubation of “lingule clay” for 3 years with the decomposing plants residues). The content of<br />
resistant to oxidative degradation organic matter in profiles of forest-steppe soils essentially<br />
and significantly increases from parent material to the upper part of a profile.<br />
The characteristic of volatile components on all intervals of temperature in which weight<br />
losses could be connected with organic matter removal, given using methods of chromatomass<br />
spectrometry and TG-IR-Fourier spectrometry. IR-Fourier spectra is showing the<br />
presence in a composition of tightly bound organic matter of a wide spect<strong>ru</strong>m of bonds,<br />
functional groups and st<strong>ru</strong>ctural fragments (vibration of OH groups, amino groups, CH-bonds,<br />
absorption band of СО 2, etc.). Tightly bound organic matter in soils has a higher thermal<br />
stability. IR-Fourier spectra also specify on a greater relative contribution of СО 2 absorption<br />
band. Also they show the occurrence of intensive bands in the field of 3000–2820 cm -1 ,<br />
corresponding to stretching vibrations of СН, СН 2 and СН 3 -groups which were observed for<br />
artificial clay-humus complexes only in the rather low temperature areas (nearby 250 ºС).<br />
There is a considerable quantity of bands in “fingers-print” area (1300–625 cm -1 ).<br />
It is found, that the quantitative estimations of a smectite phase performed by X-ray<br />
diffraction method on the basis of the analysis of difference spect<strong>ru</strong>m between the air-dry and<br />
ethylene glycol-saturated preparations [6] disagree with quantitative estimations performed by<br />
the ALA method [5] not only in experimental, but also in soil profile samples. According to<br />
results of ALA labile packets of initial “lingule clay” are conserved almost completely in the<br />
process of incubation. In soil profiles the distinction in concentration of labile interlayers not<br />
detected out at all.<br />
4. Conclusions.<br />
By complex of modern methods it is shown, that fixation of organic substance in forms<br />
resistant to H 2 O 2 treatment is related to change of actual st<strong>ru</strong>cture of clay aggregates. At<br />
interaction of clay minerals with the products of transformation of plant residues in A horizon<br />
<strong>Vol</strong>. 2 Page - 327 -
15th IHSS Meeting- <strong>Vol</strong>. 2<br />
of forest-steppe soils such organic-mineral complexes as composites are formed. Penetrating<br />
into slits between thin particles of layer silicates and probably, also between smectite layers,<br />
organic molecules output from diffraction a considerable part of crystalline substance,<br />
breaking a constancy and (or) plane-parallel arrangement of its interlayer distances.<br />
Remaining principally crystal phases, these original organic-silicate compositions can not<br />
bring the contribution to X-ray diffraction of the oriented preparations. Formation organicsmectite<br />
complexes with hybrid st<strong>ru</strong>cture, disorder on c* axis, is the usual and universal<br />
mechanism of clay transformation at soil formation in forest-steppe conditions.<br />
Acknowledgements<br />
We thank Alfiya Gubaidullina for their help in TG-IR-Fourier analysis. This work was<br />
supported by the Russian Foundation for Basic Research, projects № 02-04-49981, 05-04-<br />
49196, 08-04-00952.<br />
References<br />
1. A.A. Shinkarev, K.G. Giniyatullin, G.A. Krinari and S.G. Gnevashev, Euras. Soil Sci., 36 (2003)<br />
p. 430.<br />
2. M.J. Wilson, Clay Miner., 34 (1999) p. 10.<br />
3. B. Velde and A. Meunier, The origin of clay minerals in soils and weathered rocks. Springer-<br />
Verlag, Berlin Heidelberg, 2008, p. 255.<br />
4. S.E. Galimova, G.A. Krinari and A.V. Semjenov, in Proceedings of the 3rd International<br />
Conference on Powder Diffraction and Crystal Chemistry, St. Petersburg, Russia, 1994. p. 172.<br />
5. M.V. Eirish, R.S. Batsko and N.S. Soldatova, USSR Inventor’s Certificate no. 478 245. Byull.<br />
Izobret. 27. (1975).<br />
6. G.A. Krinari, A.A. Shinkarev and K.G. Giniyatullin, Euras. Soil Sci., 39 (2006) p. 71.<br />
<strong>Vol</strong>. 2 Page - 328 -
15th IHSS Meeting- <strong>Vol</strong>. 2<br />
Pyrolysis-Gas Chromatography/Mass Spectrometry Characterization of<br />
Humic Acids in Spodosols Under Tropical Rain Forest in Southeastern<br />
Brazil<br />
Martha González-Pérez a,b* , Peter Buurman c , Pablo Vidal-Torrado a , Ladislau Martin-Neto b<br />
a Escola Superior de Agricultura “Luiz de Queiroz” (ESALQ-USP). Departamento de Ciência<br />
do Solo. C.P. 09, CEP 13418-900 Piracicaba-SP, Brazil. b Embrapa Inst<strong>ru</strong>mentação<br />
Agropecuária, C.P.741, CEP: 13560-970, São Carlos, SP, Brazil. c Earth System Sciences and<br />
Climate Change Group. Department of Environmental Sciences. Wageningen University.<br />
P.O. Box 47. 6700 AA. Wageningen. The Netherlands.<br />
E-mail: marta@cnpdia.embrapa.br<br />
1. Introduction<br />
The present study aims to contribute to a better understanding of the podzolization processes<br />
in intrazonal tropical podzols, specifically in the Restinga forest of São Paulo state.<br />
Podzolization is the main pedogenic process in Restinga and the most common soils are<br />
Spodosols (podzols) and Quartzipsamments (Arenosols) with incipient podzolization. This<br />
study addresses the same samples that were earlier studied by González-Pérez et al. [1] by 13 C<br />
Nuclear Magnetic Resonance Spectroscopy using Variable Amplitude Cross Polarization and<br />
Magic Angle Spinning Technique ( 13 C VACP/MAS NMR) and by Fourier Transform<br />
Infrared Spectroscopy (FTIR). Pyrolysis in combination with gas chromatography and mass<br />
spectrometry (Py-GC/MS) adds to previous results information about molecular fragments,<br />
individual st<strong>ru</strong>ctures such as polysaccharides, lignin moieties, and fatty acids. This latter<br />
information can be used to reconst<strong>ru</strong>ct the origin (microbial, plant-derived, specific species),<br />
degradation mode, degradation state of the SOM and also their role in podzolization process<br />
[2, 3]. Although HAs constitute only part of the SOM in podzols, it is expected that<br />
conclusions based on this fraction can be extrapolated to the total SOM.<br />
2. Materials and Methods<br />
General comments on soils and previous analysis<br />
Three of the sandy spodosols of Cardoso Island (a Natural Park in the State of São Paulo,<br />
Southeast – Brazil) under Restinga forest, were selected for this study. Profile H13 is a Histic<br />
Alaquod, profile C14 is a Typic Alorthod, and profile H9 is an Arenic Alorthod [4]. The<br />
horizon sequences are given in Table 1. All profiles are hydromorphic and virtually iron<br />
depleted.<br />
<strong>Vol</strong>. 2 Page - 329 -
15th IHSS Meeting- <strong>Vol</strong>. 2<br />
Table 1: Particle size fractions and some chemical properties of the three profiles<br />
Soil/ Depth Sand Silt Clay pH C/Me 1 C N C/N<br />
Horizon cm -------------g kg -1 ---------- H 2 O ------g kg -1 ------<br />
Profile H13 - Histic Alaquod<br />
Ho 0–10 n. d. n. d. n. d. 3.8 14.9 319.0 15.3 20.9<br />
Hd 10–20 n. d. n. d. n. d. 4.0 40.5 241.0 5.4 44.6<br />
A1 20–30 n. d. n. d. n. d. 4.2 40.5 68.9 1.0 68.9<br />
E 30–38 970 0 30 4.3 0.0 4.7 0.5 9.4<br />
Bhs1 38–55 970 0 30 3.3 13.5 30.3 0.9 33.7<br />
Bhs2 55–75 960 0 40 3.2 11.1 15.5 0.4 38.8<br />
Bhs3 75–130 950 10 40 3.3 6.1 8.8 0.5 17.6<br />
Profile C14 - Typic Alorthod<br />
A 0–15 960 0 40 4.3 12.4 35.8 1.9 18.8<br />
AE 15–20 980 0 20 4.3 16.0 2.2 0.3 7.3<br />
E 20–50 980 10 10 5.0 0.0 0.3 0.3 1.0<br />
Bhs1 50–58 920 0 80 4.0 14.8 37.4 1.4 26.7<br />
Bhs2 58–75 900 0 100 4.0 10.4 64.2 1.9 33.8<br />
Bhs3 75–100 920 10 70 4.8 2.5 17.5 0.8 21.9<br />
Bs1 100–120 910 30 60 4.8 1.4 9.8 0.8 12.3<br />
Profile H9 - Arenic Alorthod<br />
A 0–20 970 0 30 4.7 28.8 16.4 1.0 16.4<br />
AE 20–28 980 0 20 4.6 75.0 2.9 0.7 4.1<br />
E1 28–41 980 0 20 4.8 80.0 0.8 0.2 4.0<br />
E2 41–95 980 0 20 5.0 80.0 0.3 0.2 1.5<br />
Bhs1 95–103 940 10 50 4.2 9.9 28.6 1.1 26.0<br />
Bhs2 103–130/140 950 10 40 3.4 9.1 17.1 0.8 21.4<br />
Bhs3 130/140–180+ 960 10 30 3.4 5.4 9.0 0.5 18.0<br />
1 C/Me = carbon/metal ratio; Me=Al P +Fe P<br />
Description of the area, morphology of profiles and chemical and mineralogical data are given<br />
by Gomes et al. [5]. Micromorphological characteristics, the procedure used for extraction<br />
and purification of humic acids, and the results of 13 C VACP/MAS NMR and FTIR<br />
spectroscopy are described in a previous paper [1].<br />
Pyrolysis- Gas Chromatography/mass-spectrometry (Py-GC/MS)<br />
Humic acids were pyrolyzed using a Horizon Inst<strong>ru</strong>ments Curie-Point pyrolyzer (Curie<br />
temperature of 600 °C) connected to a Carlo Erba gas chromatograph. The pyrolysis products<br />
were separated on a fused silica column (Chrompack 25 m, 0.25 mm i.d.) coated with CP-Sil<br />
51b (film thickness 0.40 μm). Helium was used as carrier gas. The initial oven temperature<br />
was 40 °C with a heating rate of 7 °C min -1 . The final temperature of 320 °C was maintained<br />
for 20 min. The GC column was connected to a Fisons MD800 mass spectrometer (mass<br />
<strong>Vol</strong>. 2 Page - 330 -
15th IHSS Meeting- <strong>Vol</strong>. 2<br />
range m/z 45-650, cycle time 1s). Products were identified using the internal NIST library and<br />
published sources [6, 7].<br />
Statistical analysis<br />
Factor analysis was carried out using Statistica Version 6 (StatSoft, Tulsa, UK). Factor<br />
analysis allows the recognition of correlations between variables and the detection of<br />
st<strong>ru</strong>ctures in the data set. It is a prime method to reduce the number of variables and to<br />
classify variables.<br />
3. Results and Discussion<br />
The 136 different pyrolysis products were identified in all samples and quantified using the<br />
two main fragment ions of each compound. Pyrolytic compounds were grouped according to<br />
probable origin and chemical similarity. The dominant groups in all horizons are aromatics,<br />
lignins and phenols, but there is significant variation within and between profiles. There do<br />
not appear to be consistent depth trends for any of the chemical groups.<br />
Factor analysis was carried out using all 136 quantified pyrolysis products for the 15 samples.<br />
Two factors explained 53.2% of all variation, while four factors explained 72.9%.<br />
Micromorphology indicates that horizons Bhs3 and Bs1 of profile C14 are fully dominated by<br />
monomorphic (DOC-derived) organic matter. The Bhs2 and Bhs3 horizons of profile 9 have a<br />
large amount of roots in various stages of decomposition. The other B-horizons have varying<br />
amounts of—largely decomposed—roots. These observations are in agreement with the plot<br />
of samples in the Factor score Diagram.<br />
The Py-GC/MS results corroborate those obtained by 13 C VACP/MAS NMR and FTIR<br />
[1].This is especially t<strong>ru</strong>e for the following features:<br />
• The highly aliphatic character in the topsoil of profile H13.<br />
• The high aromatic (lignin) content in the lower horizons of profile H9.<br />
• Similarities among chemical composition of B horizons of profiles H13 and C14 and<br />
their differences with profile H9.<br />
In addition, the pyrolysis data give reliable information concerning the relative amounts of<br />
DOC- and root-derived SOM. There appear to be degradation paths for alkanes and alkenes<br />
(shorter chain lengths), lignins (loss of methoxyls and OH-groups) and phenols (loss of OH<br />
groups). Aerobic decay in topsoils appears to lead to a relative accumulation of aliphatics.<br />
<strong>Vol</strong>. 2 Page - 331 -
15th IHSS Meeting- <strong>Vol</strong>. 2<br />
This is not clearly illustrated by the present samples because E-horizons and EB horizons<br />
have not been sampled. Anaerobic decay in subsoils, on the other hand, appears to lead to a<br />
relative accumulation of methylbenzenes and degraded polysaccharides at the expense of<br />
lignin and phenols.<br />
4. Conclusions<br />
Although morphological description of the three profiles did not indicate major differences,<br />
the chemical composition of the HAs obtained from pyrolysis data in the B horizons of<br />
profiles H13 and C14 of the three profiles was dominated by dissolved organic carbon, while<br />
the profile H9 was dominated by root-derived material. A dominance of DOC is witnessed<br />
especially by high abundances of phenol, methylphenols, and acetic acid. Some B horizons<br />
show a very strong degradation of the accumulated DOC. The cause of this degradation is still<br />
unclear. In hydromorphic podzols such as the ones studied here, both vertical and lateral DOC<br />
transport play a role in SOM accumulation in the B horizon. The morphology of profiles H13<br />
and C14 suggests a major influence of lateral transport. Except for the two deepest horizons<br />
of profile C14, all horizons show chemical (and micromorphological) evidence of rootderived<br />
OM. Therefore, also in these tropical and largely badly drained podzols, both SOM<br />
illuviation and decay of roots play a large role in the accumulation of B-horizon OM.<br />
Acknowledgements<br />
The study was financed by The State of São Paulo Research Foundation, FAPESP, Brazil,<br />
Grant # 06/52408-0 and project # 04/03477-3. We thank Mr. E.J. Velthorst, BSc of<br />
Wageningen University, for preparing the pyrograms.<br />
References<br />
1. González Pérez, M., Vidal-Torrado, P., Colnago, L.A., Martin-Neto, L., Otero, X.L.,<br />
Milori, D.M.B.P., Gomes, F.H. Geoderma, 146, 425-433, 2008.<br />
2. Buurman, P., Petersen, F., Almendros, G. Eur. J. Soil Sci., 58, 1330–1347, 2007.<br />
3. Schellekens, J., Buurman, P., Pontevedra-Pombal, X. Org. Geochem., 40, 678–691,<br />
2009.<br />
4. Soil Survey Staff. 1999. Soil Taxonomy: A Basic System of Soil Classification for<br />
Making and Interpreting Soil Surveys. USDA, Agricultural Handbook,<br />
N.436.Washington, DC (USA). 2 nd edition. 869p.<br />
5. Gomes, F.H., Vidal-Torrado, P., Macías, F., Gherardi, B., Otero, X. L. R. Bras. Ci. Solo,<br />
31(6), 1563-1580, 2007.<br />
6. Ralph, J., Hatfield, R.D. J. Agric. Food Chem., 39, 1426-1437, 1991.<br />
7. Nierop, K.G.J., van Lagen, B., Buurman, P. Geoderma, 100, 1–24, 2001.<br />
<strong>Vol</strong>. 2 Page - 332 -
15th IHSS Meeting- <strong>Vol</strong>. 2<br />
Dissolved Organic Carbon in Soil Solution<br />
on the Area of Agricultural Used Fen in North-East Poland<br />
Jacek Jaszczyński<br />
Institute of Technology and Life Sciences, Experimental Department in Biebrza, 19-200<br />
Grajewo, Poland<br />
E-mail: j.jaszczynski@op.pl<br />
1. Introduction<br />
The transformed peatlands have a big influence on largeness of organic mater load in water<br />
stores of individual habitats [1, 2, 3]. The loss of organic matter in mineralization process of<br />
peat soil is connected with releasing of humic substances dissolved in water. In a great part<br />
they are built from a carbon. Its high concentrations in the shape of dissolved organic carbon<br />
(DOC) are observed in ground and surface water on peatlands. DOC is very essential<br />
component of total carbon circulation and equilibrium in balance this compound in soil-water<br />
habitat [4]. The load of this kind of carbon releasing from soil undergoes dispersion behind<br />
mire objects together with moving water [5, 6, 7]. Temperature and soil moisture during the<br />
year, magnitude of precipitations and degree of soil draining can due to higher mineralization<br />
and higher releasing and displacing of DOC. An important factor is soil temperature that<br />
activities edaphon during the vegetation period. These processes have also higher intensity<br />
when oxygenation of moorsh layers and layers with transformed peat is favorable. In that time<br />
quantity of C compounds exposing to leaching from soil profile is greater [8, 9, 10].<br />
The main aim of this study was presenting of influence of soil temperature, soil moisture and<br />
redox potential conditions on dissolved organic carbon concentration (DOC) in soil solution<br />
from peat-moorsh soil.<br />
2. Material and Methods<br />
The investigations were carried out in 2001-2006 on Kuwasy Mire in the middle basin of<br />
Biebrza River, in north-east Poland. The research object borders on Biebrzański National<br />
Park. Described peatland was drained in 30’s and 50’s years of XX century and currently is<br />
agricultural used area. In the landscape predominant the grasslands it means cut meadows and<br />
pastures. They are situated on organic soils that have been forming from fen-peat (MtII-<br />
Polish soil classification). The bog depth amounted 110 -120 cm in this place and the main<br />
organic material consisted of forest-sedge peat. The moorshing process involves the layers of<br />
the soil to 25 cm of depth.<br />
<strong>Vol</strong>. 2 Page - 333 -
15th IHSS Meeting- <strong>Vol</strong>. 2<br />
On the describing above cut meadow an automatic field station was situated (N 53 o 39’’, E<br />
22 o 34’’). The ceramic suction cups to collect of soil solution samples were installed in three<br />
replications at 30 cm depth (aeration zone). The soil solution was continuously sampled by<br />
pomp of the automatic station. The successive samples comprised the solution collecting at<br />
the intervals of 21 days. On the same depth temperature and soil moisture were noted<br />
automatically as mean twenty-four hours data. Simultaneously, at the 20, 30 and 40 cm soil<br />
depths the measurements of redox potential were made. Every three days the ground water<br />
table was noted in the additional well which was situated on the field station area. This well<br />
involved organic layers to 110 cm depth. The DOC concentration in soil solution was<br />
determined by means of the flow colorimeter using the standard Skalar method [11].<br />
3. Results and Discussion<br />
Mean DOC concentration in soil solution was 66 mg C dm -3 within all research period. A<br />
significant positive correlation (r=0.55, n=87) between studied compound concentration and<br />
temperature of soil at 30 cm depth was observed (Fig. 1a). The highest DOC concentrations<br />
were observed during the season from July to October, when also a lower ground water level<br />
occurred (Fig. 1b). The DOC concentration in soil solution showed as well a significant<br />
correlation with the soil redox potential at 20 cm horizon (Table 1). On this depth of<br />
describing soil profile there is a frontier layer between moorshing layer and peat. This layer is<br />
the potentially most active in the respect to biochemical transformation. On the other hand it<br />
wasn’t possible to shown dependences on the DOC concentration from soil moisture. That<br />
probably results from a huge water-holding capacity of these types of peat soils, which are<br />
keeping a high moisture content even at a long time after decreasing of the groundwater table.<br />
100<br />
80<br />
60<br />
40<br />
20<br />
0<br />
mg C dm -3<br />
o C<br />
I II III IV V VI VII VIII IX X XI XII<br />
a) month<br />
DOC soil temperature<br />
20<br />
15<br />
10<br />
5<br />
0<br />
100<br />
80<br />
60<br />
40<br />
20<br />
0<br />
mg C dm -3<br />
cm<br />
I II III IV V VI VII VIII IX X XI XII<br />
b) month<br />
DOC<br />
ground water table<br />
70<br />
60<br />
50<br />
40<br />
30<br />
20<br />
10<br />
0<br />
Figure 1: Mean monthly DOC concentration in soil solution on the background of: a) soil<br />
temperature and b) ground water table<br />
<strong>Vol</strong>. 2 Page - 334 -
15th IHSS Meeting- <strong>Vol</strong>. 2<br />
Table 1: Redox potential (mV) in individual layer of soil and correlation coefficients with DOC<br />
concentration in soil water from 30 cm depth (number of samples – 87)<br />
Layer of soil<br />
profile<br />
Mean Max Min<br />
Correlation coefficient<br />
DOC-redox<br />
20 cm 234 405 35 0,50**<br />
30 cm 307 405 24 0,23*<br />
40 cm 171 361 -266 -0,12<br />
Explanation: **- significant at α
15th IHSS Meeting- <strong>Vol</strong>. 2<br />
References<br />
1. A. Górniak, 1996. Substancje humusowe i ich rola w funkcjonowaniu ekosystemów<br />
słodkowodnych. Warszawa: Wydaw. Dissertationes Universitatis Varsoviensis. ss. 151. (in Polish)<br />
2. A. Zsolnay, 1996. Dissolved humus in soil waters. In: Piccolo A. (Ed.), Humic Substances in<br />
Terrestrial Ecosystems. Elsevier, Amsterdam, pp. 171-223.<br />
3. E. Tipping, C. Woof, E. Rigg, A.F. Harrison, P. Inneson, K. Taylor, D. Benham, J. Poskitt, A.P.<br />
Rowland, R. Bol, D.D. Harkness, 1999. Climatic influences on the leaching of dissolved organic<br />
matter from upland UK moorland soils, investigated by a field manipulation experiment. Environ.<br />
Int. 25, 83-95.<br />
4. J.J.C. Dawson, M.F. Billett, C. Neal, S. Hill, 2002. A comparison of particulate dissolved and<br />
gaseous carbon in two contrasting upland streams in the UK. Journ. Hydrol. 257 pp. 226-246.<br />
5. D. Balla, O. Dietrich, J. Quasi, 2000. Solute retention in a groundwater table controlled fen area<br />
with respect to various land use scenarios. Int. Peat Journal 10, s. 33-47.<br />
6. H. Smal, S. Ligęza, M. Misztal, 2004. Quantity and quality of dissolved organic carbon in ground<br />
waters of agricultural catchment and in adjacent littoral waters of Piaseczno Lake. UMCS Sectio e<br />
Agricultura vol. LIX, nr 1, s. 423-430.<br />
7. P. A. Quinby, 2000. Lakes, wetlands and dissolved organic carbon in stream outlets of small<br />
northern temperate watersheds. Forest Landscape Baseline No. 21, 4 pp.<br />
8. H. Ok<strong>ru</strong>szko, A. Kozakiewicz, 1973. Humification and mineralization as mucking process<br />
elements in peat soils. Zesz. Prob.. Post. Nauk Rol. z. 146, s. 63-76.<br />
9. P. Nadany, A. Sapek, 2004. Variability of organic carbon concentrations in ground water of<br />
differently used peat soils. WŚOW t. 4, z. 2b(12), s. 281-289.<br />
10. J. Jaszczyński, A. Sapek, S. Chrzanowski, 2008. Dissolved organic carbon in water from post-bog<br />
habitats in comparison with soil temperature. Woda Środ. Obsz. Wiej. t. 8 z. 1(22) s. 117-126.<br />
11. Skalar Flow Access, 2002. User manual. Skalar Analytical BV.<br />
12. K. Kalbitz, H. Rupp, R. Meissner, 2002. N-, P and DOC-dynamics in soil and groundwater after<br />
restoration of intensively cultivated fens. Wetlands in Central Europe. Wydaw. Sprinter 2002 s.<br />
99-116.<br />
<strong>Vol</strong>. 2 Page - 336 -
15th IHSS Meeting- <strong>Vol</strong>. 2<br />
Humic Substances Preserved in Speleothems: Potential as a<br />
Palaeoenvironmental Proxy<br />
Alison J. Blyth a* , Craig Grove b<br />
a Department of Earth & Environmental Sciences, The Open University, Walton Hall, Milton<br />
Keynes, MK7 6AA, UK; b Department of Marine Geology, Royal Netherlands Institute for<br />
Sea Research (NIOZ), P.O. Box 59, NL-1790 AB Den Burg, Texel, the Netherlands.<br />
E-mail: a.blyth@open.ac.uk<br />
1. Introduction<br />
Speleothems are chemically precipitated calcite deposits that form where ground-waters enter<br />
a cave. Most commonly studied are stalagmites which grow upwards incrementally from the<br />
cave floor. These can be accurately and precisely dated using U-Th series analysis, and<br />
combined with their internal laminae, this gives a robust temporal framework against which<br />
palaeoenvironmental proxies can be set. The majority of speleothem records are derived from<br />
inorganic chemical proxies such as δ 18 O and δ 13 C of the calcite. However, more recently<br />
there has been growing interest in the organic matter preserved in speleothems, the majority<br />
of which has been transported from the overlying soil, and so has the potential to record<br />
periods of environmental change. Work to date has focused on non-invasive qualitative<br />
fluorescence of organic matter, and extractive analysis of lipid biomarkers (for a review see<br />
[1]), but detailed study of humic macromolecules preserved in speleothems has yet to be fully<br />
exploited. Here we report on two preliminary studies aimed at progressing the field: the<br />
extractive analysis of macromolecular material via thermochemolysis; and high-resolution<br />
spectral luminescence scanning which, via the production of spectral ratios, has the potential<br />
to provide a highly versatile approach to the quantification of humic and fulvic acid input.<br />
2. Materials and Methods<br />
Thermochemolysis of macromolecular organic matter: A range of modern stalagmite<br />
samples collected from beneath contrasting environmental regimes were digested in<br />
hydrochloric acid. Aliquots equivalent to 1 g of calcite were then loaded onto pre-conditioned<br />
C18 SPE cartridges and the organics eluted off with methanol. After drying and redissolution<br />
in 50 μL of methanol, 10 μL aliquots were subjected to online thermochemolysis at subpyrolysis<br />
temperatures in the presence of TMAH.<br />
Spectral Luminescence Scanning: Stalagmite samples were slabbed, and scanned on a<br />
<strong>Vol</strong>. 2 Page - 337 -
15th IHSS Meeting- <strong>Vol</strong>. 2<br />
customized Avaatech core-scanner using two UV-A tubes in the 350-450 nm range.<br />
Luminescence images were acquired by a Jai CV-L105 3 CCD RGB Line Scan Camera, with<br />
a linear resolution of 71.4 μm. Data for three wavelength bands, red, blue, and green are<br />
collected. Using Avaatech software, linear transects were manually drawn on the image,<br />
allowing luminescence data to be collected for multiple areas of interest within one scan.<br />
3. Results and Discussion<br />
Thermochemolysis: All samples contained a range of thermochemolysis products including<br />
compounds from the p-courmaryl (C), guaiacyl (G), and syringyl (S) groups indicative of<br />
lignin input. Due to complications from tannin input, it has been shown [2] that simple ratio<br />
plots of S/G vs C/G do not indicate the same vegetation parameters as can be obtained with<br />
lignin phenols recovered via cupric oxidation techniques. However, plots of the current<br />
results indicate that, driven by the relative abundances of S compounds, separation between<br />
samples from beneath peat, woodland, and grassland can be seen.<br />
Spectral Luminescence Scanning: Imaging of the samples produced intensity data for each<br />
band-width (red, blue and green), that showed clear variations with calcite colour. By<br />
creating ratios of each wavelength (G/B, B/R, G/R) it is possible to produce quantified<br />
measurements of wavelength shifts. Our results show that the shifts in wavelength are largely<br />
independent of luminescence intensity, indicating that they are measuring variations in the<br />
type of luminescent material present. In stalagmites, the chief sources of luminescence have<br />
been identified as soil derived humic and fulvic acids, with changes in wavelength relating to<br />
variations in the dominant molecule. With further calibration across a range of stalagmite<br />
samples, this technique therefore offers the potential for non-invasive quantitative<br />
measurements of the proportions of different humic materials present. In combination with<br />
extractive techniques, these can give comprehensive palaeoenvironmental records.<br />
Acknowledgements<br />
This work was supported by a Leverhulme Early Career Fellowship to AJB.<br />
References<br />
1. Blyth et al., Quat. Sci. Rev. 27 (2008), 905–921.<br />
2. Wysocki et al., Organ. Geochem. 39 (2008), 1454–1461<br />
<strong>Vol</strong>. 2 Page - 338 -
15th IHSS Meeting- <strong>Vol</strong>. 2<br />
Study of Chemical St<strong>ru</strong>cture of Humic and Fulvic Acids From Soils in Arid<br />
and Humid Climates<br />
Amir S. a , Winterton P. b , Hafidi M. c *<br />
a<br />
Team of Applied Chemistry and Sciences of the Environment,University Sultan Moulay<br />
Slimane, Beni Mellal, Morocco; b Université Paul Sabatier, Toulouse France<br />
c Laboratory of Ecology and Environment (Unit associated to CNRST), University<br />
Caddi Ayyad, BP 2390, Marrakech, Morocco.<br />
E-mail: hafidi@ucam.ac.ma<br />
1. Introduction<br />
The main factors to affect soil formation are climate and parent materials (Litter or rocks).<br />
<strong>Humus</strong> is known to be one of the soil components strongly influenced by climate and the type<br />
of pedogenesis (Abakumov et al. 2009). The aim of the current study was to compare the<br />
chemical st<strong>ru</strong>cture and composition of litter humic and fulvic acids of soils in a humid climate<br />
and others in an arid climate.<br />
2. Materials and Methods<br />
The litters and soils were obtained under holm oak (Quercus ilex) and rosemary (Rosmarinus<br />
officinalis) in a humid climate and the Argan tree (Argania spinosa) and tamarisk (Tamarix<br />
sp) in arid climates. Before analysis, litters were c<strong>ru</strong>shed and soils were sieved (2 mm). The<br />
humic substances were extracted with 0.1M NaOH from soil samples previously treated with<br />
0.1M HCl and H 2 O. The humic and fulvic acids were separated in 1.5M H 2 SO 4 , dialyzed<br />
(1000 and 100 Da) to eliminate excess salts and then freeze-dried before elemental (Carlo<br />
Erba EA 1112), FT-IR and 13 C-NMR analysis (Amir et al, 2009).<br />
3. Results and Discussion<br />
The variation in elemental composition of litter HAs and FAs showed similarity in the four soil<br />
types studied. All four litter HAs and FAs were rich in C (49.3 – 54.5 %) and H (6-7 %) and<br />
presented less O (37-43.4 %) and N (1-2 %) with a high C/N ratio (30-53) and low O/C (0.5-<br />
0.66) and C/H (0.64-0.69) ratios (Table 1). The HAs showed high N% (2.7- 4.8%), O% (38.2-<br />
42.3%), O/C (0.56-0.64) and C/H (0.69-0.84) (except those under tamarisk) and less C (49.1-<br />
51.2 %), H (4.94-6 %) and C/N (12.3-21.4) than their corresponding litters. Compared to the<br />
HAs, the FAs further presented lower amounts of C (42.7-45 %), H (4.5-5.5%) and N (2-3 %),<br />
but higher O% (48-49.6%), and O/C ratio (0.8-0.87). In fact, from the 13 C-NMR data, in the<br />
four soils, FAs were found to be more aromatic than HAs which had higher levels of alkyl O<br />
and N (Table 2).<br />
<strong>Vol</strong>. 2 Page - 339 -
15th IHSS Meeting- <strong>Vol</strong>. 2<br />
Table 1: Elemental composition of litter, humic and fulvic acids isolated from soils under four<br />
vegetation types in humid and arid climates<br />
Quercus ilex<br />
Rosmarinus<br />
officinalis<br />
C a N a O a H a C/N O/C C/H<br />
Litter 50.7 1.5 41.6 6.3 40.4 0.6 0.7<br />
HA 50.0 2.7 42.4 4.9 21.4 0.6 0.8<br />
FA 44.6 2.0 48.6 4.8 25.5 0.8 0.8<br />
Litter 54.4 1.3 37.2 7.0 47.3 0.5 0.6<br />
HA 51.2 3.3 39.5 5.9 18.0 0.6 0.7<br />
FA 42.7 2.2 49.6 5.5 22.8 0.9 0.6<br />
Litter 52.0 2.0 39.7 6.3 29.7 0.6 0.7<br />
Argania spinosa HA 49.4 3.8 41.4 5.3 15.1 0.6 0.8<br />
FA 45.1 2.3 48.0 4.5 22.9 0.8 0.8<br />
Litter 49.3 1.1 43.4 6.2 53.3 0.7 0.7<br />
Tamarix sp HA 50.8 4.8 38.3 6.1 12.4 0.6 0.7<br />
FA 43.7 3.1 48.2 5.1 16.3 0.8 0.7<br />
a % Calculated per unit weight organic matter<br />
The 13 C-NMR data showed that the soil under holm oak and rosemary in a humid climate<br />
contains humic acids and fulvic acids characterized by a higher degree of aromaticity than<br />
those of soils under the Argan tree and tamarisk in arid climates which are mostly aliphatic,<br />
while the latter have FAs richer in carboxylic functions (Table 2).<br />
Table 2: Changes in 13 C-NMR distribution in humic and fulvic acids isolated from soils under four<br />
vegetation types in humid and arid climates<br />
C-aliphatic a N- O- alkyl a C-aromatic a C-carboxylic a<br />
Quercus ilex<br />
HA 20.7 34.4 25.5 19.3<br />
FA 8.9 11.5 42.8 36.8<br />
Rosmarinus officinalis<br />
HA 34.1 26.3 24.9 14.8<br />
FA 17.4 26.5 30.0 26.1<br />
Argania spinosa<br />
HA 30.2 33.7 18.6 17.5<br />
FA 5.0 3.6 25.2 66.1<br />
Tamarix sp<br />
HA 27.9 37.9 19.0 15.2<br />
FA 7.1 18.4 30.0 44.4<br />
a<br />
Values are expressed as percentages of the whole spect<strong>ru</strong>m area<br />
4. Conclusions<br />
The st<strong>ru</strong>ctural analysis shows that while the HAs from soils in a humid climate exhibited a<br />
higher degree of aromaticity than those in an arid climate, the FAs were mostly aromatic and<br />
richer in oxygen and carboxylic functions than HAs in the four soils. The HAs were richer in<br />
aliphatics and with a higher N content than FAs. We suggest that, under the two climate<br />
types, two distinct processes lead to the synthesis of HA and FA from litter. HA neo-synthesis<br />
occurs through a peptide pathway, while FA follows the oxidative pathways.<br />
References<br />
1. E. Abakumov, N. Fujitake, and T. Kosaki, Appl. Environ. Soil Sci., (2009).<br />
2. S. Amir, F. Benlboukht, N. Cancian, P. Winterton, M. Hafidi. 2009. J Hazard. Mater., 160 (2008),<br />
448.<br />
<strong>Vol</strong>. 2 Page - 340 -
15th IHSS Meeting- <strong>Vol</strong>. 2<br />
Effect of Clear-Cutting on Humic Substances in Podzol in the East Sudety<br />
Mountains<br />
E. Jamroz, J. Weber, J. Drozd, A. Kocowicz, M. Licznar, S. Licznar<br />
Institute of Soil Science and Environment Protection, Wroclaw University of Life and<br />
Environmental Sciences, G<strong>ru</strong>nwaldzka 53, 50-357 Wroclaw, Poland<br />
E-mail: elzbieta.jamroz@up.wroc.pl<br />
1. Introduction<br />
Clear-cutting is a serious disturbance in environment. Removal of stems affects wide<br />
biogeochemical process—starting from decrease of litter and carbon looses through reducing<br />
transpiration, changes of soil temperature and moisture. These processes influence the<br />
microbiological activity as well as rate of organic matter decomposition [2, 4].<br />
The effect of clear-cutting (stems only) on the humic substances of Podzols was studied in<br />
sp<strong>ru</strong>ce forest of the Snieznik Massive — East Sudety Mountains.<br />
2. Materials and Methods<br />
The objects of investigation were Podzols derived from gneiss at the same altitude level (900–<br />
1000 m a.s.l.). Samples from organic (Oa) soil horizons were collected from the area after<br />
clear-cutting (about 10 years earlier) — object A, and from forest sites, in different stage of<br />
degradation – sp<strong>ru</strong>ce forest site without degradation signs — object B and sp<strong>ru</strong>ce forest site<br />
with about 50% of dead needles — object C. The concentration of TOC and nitrogen were<br />
analyzed in soil horizons. Humic acids (HA) were extracted following the IHSS method.<br />
Elemental analysis was performed for C, H, N with a Perkin-Elmer 2000 inst<strong>ru</strong>ment. Fourier<br />
Transform Infrared (FTIR) spectra were recorded with a FTIR B<strong>ru</strong>ker 66/s spectrometer on<br />
KBr pellets of 1 mg sample in 400 mg KBr. Solid-state 13 C NMR spectra of HAs (CPMAS<br />
NMR) were obtained using a 300 MHz AMX B<strong>ru</strong>ker NMR spectrometer.<br />
3. Results and Discussion<br />
The concentration of total organic carbon was significantly lower after forest removal. The<br />
amount of total nitrogen was significantly lower in Podzols after clear-cutting as well, in<br />
comparison to the soil horizons under the fresh sp<strong>ru</strong>ce stands, what is connected with<br />
breaking inputs of fresh organic matter to the soil. Ishikawa et al. [1] also reported lowering<br />
of nitrogen after forest harvesting in the organic horizons.<br />
Humic acids from the soil in the region after clear-cutting were characterized by lower<br />
<strong>Vol</strong>. 2 Page - 341 -
15th IHSS Meeting- <strong>Vol</strong>. 2<br />
content of carbon and slightly higher content of nitrogen in comparison to the HAs from the<br />
coniferous stands without degradation signs (Tab. 1). Similar results were described by Ussiri<br />
and Johnson [4]. They found decreasing of carbon and nitrogen in Oa horizon in Podzol after<br />
clear-cutting. FTIR spectra of HAs from Podzol after clear-cutting are characterized by more<br />
intense bands in the range of 1200–1280 cm -1 , 1420–1460 cm -1 and 1500–1525 cm -1 , in<br />
comparison to the sp<strong>ru</strong>ce forest stands (Fig.1). Under the influence of environment<br />
disturbance, such as clear-cutting, in HAs an increase of carboxyl groups and highly<br />
condensed aromatic st<strong>ru</strong>ctures are observed.<br />
Table 1: Elemental composition, atomic ratios and degree of internal oxidation (ω) of humic acids in<br />
the region of Śnieżnik Massif<br />
Object<br />
Soil<br />
horizon<br />
Elemental composition of humic acids in<br />
atomic %<br />
C H N O*<br />
A Oa 32.2 41.3 2.3 24.2<br />
B Oa 34.8 41.7 2.0 21.5<br />
C Oa 34.6 36.2 1.7 27.6<br />
Atomic ratios and degree of internal oxidation<br />
H/C N/C O/C O/H ω<br />
A Oa 1.283 0.071 0.752 0.586 0.435<br />
B Oa 1.198 0.057 0.618 0.516 0.210<br />
C Oa 1.045 0.048 0.796 0.762 0.692<br />
*O% - was calculated by difference<br />
Transmitancja<br />
A<br />
C<br />
B<br />
4000<br />
3500<br />
3000<br />
2500<br />
2000<br />
1500<br />
1000<br />
500<br />
0<br />
cm -1<br />
Figure1: FTIR spectra of humic acids isolated from Oa horizons in Podzols from the clear-cutting –A, coniferous<br />
forest without degradation signs –B, and coniferous forest in degradation process –C<br />
<strong>Vol</strong>. 2 Page - 342 -
15th IHSS Meeting- <strong>Vol</strong>. 2<br />
35<br />
30<br />
25<br />
B<br />
C<br />
A<br />
% Corg.<br />
20<br />
15<br />
10<br />
5<br />
0<br />
C -COOH C-ar C-O-alkil C-alkil<br />
Figure 2: 13 C NMR spectra of humic acids<br />
from Oa horizons in Podzols from the clearcutting<br />
–A, coniferous forest without<br />
degradation signs –B, and coniferous forest<br />
in degradation process – C<br />
Figure 3: Distribution of carbon of some compounds<br />
in humic acids isolated from Oa horizons<br />
Spectra obtained by solid-state 13 C nuclear magnetic resonance (NMR) confirmed that forest<br />
harvesting affected changes of HA st<strong>ru</strong>ctures. Distribution of carbon of compounds in HAs<br />
(Fig.3) shows that content of function groups in HA from the soil after clear-cutting is more<br />
similar to the coniferous stands with degradations signs than to the fresh sp<strong>ru</strong>ce forest.<br />
Spectra of HAs after forest removal exhibited clear peaks in the range of 61–90 ppm, and<br />
slightly weaker intense covered aromatic carbon (especially between 110–140 ppm),<br />
corresponding to lignin compounds [3]. Character of humic substances response for the clearcutting<br />
confirmed their significant role as indicators of processes unfolding in the<br />
environment.<br />
References<br />
1. Ishikawa H., Osono T., Takeda H J. For. Res., 12 (2007) 247–254.<br />
2. Johnson, C.E., Driscoll, C.T., Fahey, T.J., Siccama, T.G., Hughes, J.W. Carbon Forms and<br />
Functions in Forest Soils 1995 Kelly, J.M., McFee, W.W. (Eds.),. SSSA, Madison, WI, 463–488.<br />
3. Kögel-Knabner I. Soil Biochemistry 1993 vol. 8 Eds: J.M. Bollag i E. Stozky, Marcel Dekker, 432<br />
4. Ussiri D.A.N., Johnson C.E. For. Ecol. Manag. 240 (2007), p.131-142.<br />
<strong>Vol</strong>. 2 Page - 343 -
15th IHSS Meeting- <strong>Vol</strong>. 2<br />
Transformations of Humic Substances by Micromycetes Revealed by<br />
Fluorescence Spectroscopy<br />
Vera Terekhova a* , Olga Yakimenko b , Elena Fedoseeva b , Daria Khundzhua c ,<br />
Daria Shubina c , Viktor Yuzhakov c , Svetlana Patsaeva c<br />
a Institute of Ecology and Evolution RAS, 33 Leninskij prosp., Moscow, 119071,<br />
Russia; b Soil Science Department, Moscow State University, Moscow 119991, Russia;<br />
c Department of Physics, Moscow State University, Moscow 119991, Russia<br />
E-mail: vterekhova@gmail.com<br />
1. Introduction<br />
Interaction of microorganisms with non-living organic matter of natural origin in aqueous and<br />
terrestrial biocenoses is one of the key problems which provoked a wide scientific discussion.<br />
Humic substances (HSs) and especially their water-soluble fraction play very important role<br />
in environmental biogeochemistry [1–2]. Fungi are the most significant group of<br />
microorganisms responsible for the synthesis of HSs in soil [3-8]. Supporters of melanin<br />
pathway of natural HSs formation are attaching particular importance to basidiomycetes<br />
known as «white-rot fungi» (such efficient ligninolytic species as Phanerochaete<br />
chrysosporium, Coriolus versicolor) [4-6]. Microscopic fungi from the Deuteromycetes<br />
(Imperfecti) group could also be involved in the process synthesize dark-colored melanins<br />
from the phenols metabolized by these fungi [7-9]. On the other hand it is debatable if the<br />
fungi use humic polymers as the source of nutrients [10-12]. The effective way to estimate<br />
effect of fungal metabolites (enzymes etc) on HS transformation is fluorescence spectroscopy.<br />
Fluorescence spectroscopy can be used for rapid characterization of organic substances, in<br />
particular dissolved organic matter in natural water [13–14]. UV excited fluorescence of<br />
natural HSs exhibits broadband emission, so called “humic-type fluorescence”, with emission<br />
maximum position (λ em ) around 420–460 nm depending on the sample type and excitation<br />
wavelength (λ ex ) [15–16]. Typically fluorescence of commercial humic acids is shifted to<br />
longer wavelength region (500–520 nm) [17–18] compared to natural HSs. The objective of<br />
this work was to study fluorescence spectra of the solutions of commercially produced HS<br />
before and after it was used as a growing medium for various cultures of soil micromycetes.<br />
2. Materials and Methods<br />
Six strains of fungi were used in this study: coloured fungi Alternaria alternata , Fusarium<br />
moniforme, Phoma glomerata, Cladosporium cladosporioides, Geomyces panno<strong>ru</strong>m, and<br />
Mycelia sterilia. The fungi strains were grown in Czapek liqiud medium (CzLM ) (pH 7.0 or<br />
<strong>Vol</strong>. 2 Page - 344 -
15th IHSS Meeting- <strong>Vol</strong>. 2<br />
7.2) with and without addition of potassium humate manufactured from leonardite (Le-Pow)<br />
in concentration 0.2 g/L. The fungi strains were incubated at 25°C in a dark with constant<br />
shaking for 14 d. Biomass (about 0.2–0.3 g per 100 mL) of micromycetes in mid-exponential<br />
growth phase was separated by filtration from liquid media. Tests were performed in<br />
triplicate. Filtered culture fluid (CF) was used for further spectral investigations.<br />
Fluorescence emission spectra were measured by luminescence spectrometer Solar CM 2203<br />
under excitation at 270, 310 and 355 nm for the LCM samples diluted in 10 times. Two<br />
fluorescence parameters (emission maximum λ em and fluorescence quantum yield QY) and<br />
their behaviour along with rising excitation wavelength from 270 to 355 nm were used to<br />
describe qualitatively changes in HS fluorescence due to growing of fungi cultures in its<br />
solution. Fluorescence QY was estimated using quinine sulphate dissolved in water as a<br />
reference.<br />
3. Results and Discussion<br />
Fluorescence spectra of HS solutions and filtered fungi culture fluid (FCF). Humic-type<br />
fluorescence spreading from 350 to 650 nm is shown in Fig.1 for humate solution and filtered<br />
fungi cultures. Aqueous solution of potassium humate demonstrates fluorescence maximum<br />
close to 500 nm. The UV emission between 300–350 nm is caused by emission of proteins,<br />
aromatic amino acids and simple phenols excreted by fungi cultures into liquid medium. The<br />
narrow peak at 290 nm is water Raman scattering signal.<br />
I nt ensity, r. u.<br />
8<br />
6<br />
4<br />
2<br />
Fl uorescence excit ed at 270 nm<br />
HS + C. cl ad.<br />
HS + M. st erili a<br />
HS sol uti on<br />
C. cl ad.<br />
M. st erili a<br />
0<br />
300 350 400 450 500 550 600 650<br />
Wavel engt h, nm<br />
Figure 1: Fluorescence spectra of HS solution and filtered LCM for fungi cultures grown with and<br />
without addition of HS<br />
<strong>Vol</strong>. 2 Page - 345 -
15th IHSS Meeting- <strong>Vol</strong>. 2<br />
Changes in fluorescence spectra due to micromycetes growth. Fluorescence properties of HS<br />
solution were essentially changed after growing of fungi culture in it (see Fig.1 and Table1).<br />
Fluorescence QY of HS modified by fungi increased, and emission maximum λ em was shifted<br />
towards shorter wavelengths compared to that for original humate solution. Moreover, the<br />
spectral behaviour of humic-type fluorescence along with rising excitation wavelength has<br />
been changed after growing of fungi cultures. For original HS solution fluorescence QY was<br />
slightly decreasing with λ ex rising, but after fungi growing culture medium with HS<br />
demonstrated QY increasing along with λ ex rising. λ em Emission maximum wavelength for<br />
HS solution was similar for λ ex =270, 310 or 355 nm, while after 14 days of cultures growing<br />
in it λ em became wavelength dependent. Similar trends in fluorescence parameters were<br />
observed for other micromycete cultures.<br />
Table 1: Fluorescence quantum yield (QY) and emission maximum wavelength (λ em ) for HS solution<br />
and fungi culture fluid (CF) with and without addition of HS<br />
QY and λ em<br />
(for given λ ex )<br />
HS<br />
solution<br />
C. cladosporium. CF M. sterilia CF A. alternata CF<br />
with HS without HS with HS without HS with HS without HS<br />
QY (λ ex =270 nm) 0.6% 3.3% UV* 1.4% UV 4.5% 3.0%<br />
QY (λ ex =310 nm) 0.5% 5.2% - ** 2.1% - 5.3% 3.4%<br />
QY (λ ex =355 nm) 0.4% 7.2% - 3.4% - 10.6% 11.7%<br />
λ em (λ ex =270 nm) 500 nm 420 nm UV 485 nm UV 440 nm 410 nm<br />
λ em (λ ex =310 nm) 505 nm 420 nm - 450 nm - 425 nm 410 nm<br />
λ em (λ ex =355 nm) 500 nm 450 nm - 475 nm 480 nm 420 nm 405 nm<br />
*UV fluorescence (emission of protein complexes) is prevailing in the spect<strong>ru</strong>m<br />
**Low fluorescence intensity<br />
These findings we explain by transformation of refractory HSs by fungi cultures during their<br />
growing. They utilize macromolecular compounds with longwave fluorescence emission and<br />
produce smaller ones with emission shifted towards shorter wavelengths. Dependence of QY<br />
and λ em on λ ex reflects heterogeneity of composition of humic-type substances in the culture<br />
medium.<br />
<strong>Vol</strong>. 2 Page - 346 -
15th IHSS Meeting- <strong>Vol</strong>. 2<br />
6. Conclusions<br />
After two weeks of fungi cultures growing in humate solution its fluorescence characteristics<br />
became more similar to that of natural HSs (dissolved organic matter in natural water or soil<br />
extractions). Wavelength of emission maximum and quantum yield of humic-type<br />
fluorescence band were found to be λ ex -dependent because of increased heterogeneity of Hs<br />
in culture medium compared to initial commercial humate solution.<br />
Acknowledgements<br />
This research was supported by Russian Foundation of Basic Research (grant # 07-04-01510)<br />
and by Presidium of Russian Academy of Science (grant of Biodiversity Program).<br />
References<br />
1. D.S. Orlov, Humic Substances of Soils and General Theory of Humification. Balkema, Brookfield,<br />
1995. 266 p.<br />
2. I.V. Perminova, N.Yu. Grechishcheva., V.S.Petrosyan, M.A Anisimova., N.A. Kulikova, G.F.<br />
Lebedeva, D.N. Matorin, P.S. Venediktov, In: Hayes M.H.B., Clapp C.E., Senesi N., P.R., Bloom<br />
P.M. Jardine (Eds.), Humic Substances and Chemical Contaminants. SSSA, Madison, WI.<br />
(2001).275–287.<br />
3. T.G. Mirchink, Soil Mycology, MSU:Moscow, (1989) 160.<br />
4. R.D. Sjoblad and J.-M. Bollag in E. Paul J .N. Ladd (Ed.), Soil Biochemistry, V.5. Marcel Dekker,<br />
New York. (1981) 113–125.<br />
5. V.J. Lopez, M.C. Vargas-Garcia, F. Suarez-Estrella, and J. Moreno, Int. Biodeter.Biodegrad., 57<br />
(2006), 24–30.<br />
6. J.P. Martin, K. Haider, Soil Sci, 111 (1971 ) 54–63.<br />
7. A.G. Zavarzina, A.A.Zavarzin, Microbiology, 75 (2006), 546–556.<br />
8. A.A. Bell, M.H. Wheeler, Annual Reviews in Phytopathology, 24 (1986) 41–451.<br />
9. M.J. Butler, A.W. Day, Canadian Journal of Microbiology 44 (1998) 1115–1136 .<br />
10. N.M. Zhdanova, A.I Vasylevskaya, T.I. Tugay, L.V. Artyshkova, L.T. Nakonechnaya, J. Dighton<br />
Abstr. XV Congress Europ. Mycologists. St. Petersburg, Russia, (2007) p.108.<br />
11. N.M. Zhdanova, V.O. Zakharchenko, A.I. Vasylevskaya, O.T. Shkol’nyi, L.T. Nakonechnaya,<br />
L..V Artyshkova, Ukrainian Botanical Zhurnal, 51 (1994) 134–143.<br />
12. N.A. Yurlova, L.V. Sindeeva In Papers of the 10th International Biodeterioration and<br />
Biodegradation Symposium, Hamburg, Dechema: (1996) 169–175.<br />
13. M.М.D. Sierra, O.F.X. Donard, M. Lamotte, С. Belin, М. Ewald, Marine Chem., 47 (1994) 127–<br />
144.<br />
14. P.G. Coble, Marine Chem., 51 (1996) 325–346.<br />
15. S.V. Patsaeva, EARSeL Advances in Remote Sensing, 3 (1995) 66–70.<br />
16. O.M. Gorshkova, A.S. Milyukov, S.V. Patsaeva, V.I. Yuzhakov. Proc. SPIE 6263 (2006) 248–<br />
255.<br />
17. Senesi, N., Miano, T.M., et al. Soil Sci. 152 (1991) 259–271<br />
18. A. Zsolnay, E. Baigar, M. Jimenez, B. Steinweg, F. Saccomandi Chemosphere, 38 (1999) 45–50.<br />
<strong>Vol</strong>. 2 Page - 347 -
15th IHSS Meeting- <strong>Vol</strong>. 2<br />
FTIR Characterization of Humic Substances Extracted from a Typic<br />
Albaquult Soil under Different Management Systems<br />
Marla de Oliveira Farias a , Estela M. Cunha Cardoso b , Jaqueline Nicolini b , Betânia Fraga<br />
Pereira c* , Antonio Salvio Mangrich b , Clenio Nailto Pillon d<br />
a<br />
Universidade Federal de Pelotas, Faculdade de Agronomia Eliseu Maciel, CP 354, 96010-<br />
900, Pelotas, RS, Brazil; b Universidade Federal do Paraná, Centro Politécnico, Jardim das<br />
Américas, CP 19081, 81531-990, Curitiba, PR, Brazil; c FAPEG/Embrapa Clima Temperado,<br />
BR 392, Km 78, 96001-970, Pelotas, RS, Brazil; d Embrapa Clima Temperado, BR 392, Km<br />
78, 96001-970, Pelotas, RS, Brasil<br />
E-mail: betaniapereira@yahoo.com.br<br />
1. Introduction<br />
Marked changes in the soil organic matter (SOM) are observed with the alteration of the soil<br />
management, quantitatively and qualitatively, especially regarding to the intensive farming<br />
systems, as conventional tillage, where the SOM is more exposed to the decomposition agents<br />
like oxygen, temperature, microorganisms among others. The humic substances (HS) are the<br />
main components of SOM and its knowledge may be c<strong>ru</strong>cial to understanding the processes<br />
that regulate or determine the properties of the soil [1]. The characterization of HS by<br />
spectroscopic techniques has led to important results in assessment of soil quality under<br />
different management systems in temperate and tropical conditions, although in low lands,<br />
these studies are still reduced.<br />
In the southern half of the Rio Grande do Sul State (RS), Brazil, the production in the flooded<br />
rice system, in an area of 950 hectares [2] is cultivated in soils with internal drainage<br />
difficulties, which provides in part of the year, anaerobic conditions, especially in areas of<br />
flatter relief. Looking for the minimization of these effects, the search for alternatives of soil<br />
cultivation, through farming systems including crop rotation of the flooded rice with other<br />
crops and/or integration of the flooded rice crop and livestock, with different tillage systems<br />
has been studied in long duration experiments. However, the effects of the different cropping<br />
systems adoption in the low lands SOM, where there is a differentiate dynamic of<br />
transformation [3], need to be further studied. Thus, in this study was evaluate the probably<br />
alteration in the SOM quality through the due to the use of different management systems in<br />
an Albaquult soil, through Fourier transform infrared spectroscopy (FTIR).<br />
2. Material and methods<br />
The experiment was conducted at the Lowlands Experimental Area of Embrapa Temperate<br />
Climate, Capão do Leão, RS, Brazil, in a Typic Albaquult [4]. At the beginning of the study,<br />
<strong>Vol</strong>. 2 Page - 348 -
15th IHSS Meeting- <strong>Vol</strong>. 2<br />
in 2003, flooded rice was grown under conventional tillage in all the experimental area,<br />
followed by winter fallow. The cultivation system consisting of ryegrass + trefoil, as cover<br />
crops during the winter, and rotation soy / corn / sorghum during the summer, with two<br />
treatments of soil management: LT = low tillage and CT = conventional tillage was evaluated<br />
in 2007. The experimental design was the randomized blocks with divide plots (three<br />
replicates). A sample collected in a native field (NF) area, adjacent to the experiment,<br />
representative of the original condition of the experimental area prior to the agricultural use<br />
was utilized as the reference. Samples of not preserved soil st<strong>ru</strong>cture were collected in the<br />
layer of 0.000 to 0.025 m, air dried for around 72 hours and sieved to 2.00 mm. After, they<br />
were grounded in a porcelain mortar for the chemical fractionation.<br />
The HS were chemically fractionated based on solubility in acid / alkaline medium, according<br />
to the method described by [5]. Samples of fulvic acid (FA), humic acid (HA) and humin<br />
(HU) were weighed and mixed with KBr, in a ratio of 1:100 (sample: KBr). The mixture was<br />
macerated in an agate mortar and transferred to hydraulic press, resulting in transparent<br />
pellets. These pads were analyzed by FTIR spectroscopy, wave number from 4000 to 400 cm -<br />
1 , resolution 4 cm -1 , 32 scans/min (BioRad FTS 3500 spectrometer GX EXCALIBUR model).<br />
From the FTIR data, the index of aromaticity I 1620 /I 2920 [5], by dividing the intensity of<br />
absorption in 1620 cm -1 for the intensity 2922 cm -1 was calculated.<br />
3. Results and discussion<br />
When the management systems were compared, the infrared spectra of HS showed the<br />
same pattern of absorption, but differences were observed among the fractions (FA, HA<br />
and HU) (Fig. 1). The absorption bands observed for the HS were in agreement with the<br />
data presented by other authors [3, 7, 8]. The major functional groups observed in the FA<br />
and HA samples (Fig. 1) and their respective regions of absorption were: (a) OH vibration<br />
of hydrogen bonding from water, probably due to the humidity of the samples or from<br />
hydroxyl linked to the aromatics that make up the organic matter and HSs in soil, and<br />
vibrational stretching of AlO-H groups from clay and oxyhydroxides (υ FeO-H and υ<br />
SiO-H from clay) (3385 cm -1 ) (b) asymmetric and symmetric stretching, respectively,<br />
from aliphatic CH (2930–2850 cm -1 ), (c) C=O vibration from COOH (2600 to 2500 cm -1 )<br />
(d) C=O stretching of carboxylic acids and, or, ketones (1715 cm -1 ); (e) C=C vibration of<br />
aromatic rings or asymmetric stretching from –COO - (1640 to 1630 cm -1 ), (f) N–H peptide<br />
bonds or aromatic C=C stretching (1538 cm -1 ), (g) deformation of CH from aliphatic<br />
groups (1457– 1383 cm -1 ), (h) –CO stretching and OH deformation of carboxylic acids<br />
<strong>Vol</strong>. 2 Page - 349 -
15th IHSS Meeting- <strong>Vol</strong>. 2<br />
(1234 cm -1 ), (i) aliphatic C–C, C-–O vibration of carbohydrates, alcohols and esters, Si–<br />
O–C from polymeric substances, Si-O (inorganic) (1125, 1081, 1035 cm -1 ).<br />
Figure 1: FTIR spectra of the HS extracted from an Albaquult soil under different management<br />
system. a) FA: fulvic acid; b) HA: humic acid; c) HU: humin. CT: conventional tillage; LT: low<br />
tillage; NF: native field<br />
The main differences between the FA and HA (Fig. 1) are present in the region from 2930 to<br />
2850 cm -1 , where the aliphatic CH bands in the HA were relatively more intense. In the region<br />
of 1081–1035 cm -1 the FA spectra showed more pronounced peaks of aliphatic C–C, C–O<br />
vibration of carbohydrates, alcohols and esters, Si–OC of polymeric substances, Si–O from<br />
inorganic st<strong>ru</strong>ctures. These bands presented lower intensity in the HA spectra. For the FTIR<br />
spectra of HU samples (Fig. 1), bands in the regions of 3385, 2930, 2850, 1640, 1538 and<br />
1081 cm -1 were also observed. And it were also observe CO vibration from carbohydrates in<br />
2000 cm -1 , band characteristic of quartz (Si–O) in 1870 cm -1 and polysaccharide vibration,<br />
probably residual cellulose or hemicellulose in 1198 cm -1 .<br />
The aromaticity index I 1620 /I 2920 [6] provide the degree of unsaturation/saturation<br />
(vibrations intensity of the groups C=O and C=C in relation to the intensity of the CH<br />
groups) of the analyzed fraction. For the FA, HA and HU fraction, values between 0.90<br />
and 0.98, 0.96 and 1.04, and 0.75 and 0.90, were observed, respectively (Table 1). The<br />
lower values for the I 1620 /I 2920 were observed in the CT, corroborating the data of [9].<br />
When compared to the CT, the ratio values for LT and NF indicated lower proportion of<br />
aliphatic groups (Table 1), which may indicate a greater degree of HS humification in<br />
conservationist systems. The relative increase of aliphatic groups is attributed to the<br />
preferential consumption of O-alkyl st<strong>ru</strong>ctures [10] that would be favored in the CT, due<br />
to the soil disturbance.<br />
<strong>Vol</strong>. 2 Page - 350 -
15th IHSS Meeting- <strong>Vol</strong>. 2<br />
Table 1: Aromaticity index for fulvic acid (FA), humic acid (HA) and humin (HU) extracted from an<br />
Albaquult soil under different management systems<br />
Management system FA HA HU<br />
NF 0.98 1.04 0.90<br />
CT 0.90 0.96 0.75<br />
LT 0.90 0.98 0.78<br />
NF = native field; CT = conventional tillage; LT = low tillage.<br />
4. Conclusions<br />
Although small changes in the chemical nature of HS under different management systems<br />
have been observed, the HA fraction showed more pronounced bands related to the aliphatic<br />
CH and there was a tendency of the aromaticity index I 1620 /I 2920 for the CT system to be<br />
characterized by HS more aliphatic when compared to the LT and NF systems.<br />
Acknowledgment<br />
Universidade Federal de Pelotas, RS; Universidade Federal do Paraná, PR; FAPEG/Embrapa<br />
Clima Temperado, RS; and Embrapa Clima Temperado, RS, Brazil.<br />
References.<br />
1. L.P.Canellas; J.A. Espindola; C.E. Rezende; P.B. Camargo; J.A.A. Zandonadi; V.M. Rumjanek;<br />
J.G.M. Guerra; M.G. Teixeira; R. Brazfilho. Scientia Agrícola, 61 (2004)53- 61.<br />
2. CONAB–Companhia Nacional de Abastecimento. Disponível em . Acesso em: 26 jun. 2009.<br />
3. K.H. Tan. Humic Matter in Soil and the Environment . Madison Avenue, New York, 2003, p. 385.<br />
4. H.G. Santos; P.K.T. Jacomine.; L.H.C. Anjos.; V.A. Oliveira.; J.B. Oliveira.; M.R. Coelho.; J.F.<br />
Lumbreras.; T.J.F. cunha. (eds). Sistema Brasileiro de Classificação de Solos. Rio de Janeiro:<br />
Embrapa Solos, 2006, p. 306.<br />
5. D.P. Dick; J. Gomes; P.B. Rosinha. Revista Brasileira de Ciência do Solo, 22 (1998) 603–611.<br />
6. B. Chefetz; P. Hatcher; Y. Hadar; Y. Chen. Journal Environmental Quality, 25 (1996) 776–785.<br />
7. L.B. Silva; D.P. Dick; A.V. Inda Júnor. Ciência Rural, 38 (2008) 1167–1171.<br />
8. P.S. Nayak; K. Singh. Bull Mater Science, 30 (2007) 235–238.<br />
9. C.M. ROSA; R.M.V.Castilhos; D.P. Dick; E.A. Pauletto; A.S. Gomes. Ciência Rural, 38 (2008)<br />
1589–1595.<br />
10. D.P. Dick; C.N. Gonçalves; R.S.D. Dalmolin; H. Knicker; E. Klamt; I. Kögel-Knabner; M.L.<br />
Simoes; L. Martin-Neto. Geoderma, 124 (2005) 319–333.<br />
<strong>Vol</strong>. 2 Page - 351 -
15th IHSS Meeting- <strong>Vol</strong>. 2<br />
Characterization of Peatland Soils from the High Andes by 13 C NMR<br />
Spectroscopy<br />
Aline Segnini a,b* , André A. Souza c , Etelvino H. Novotny d , Tito J. Bonagamba c , Adolfo<br />
Posadas a,b , Roberto Quiroz a , Débora M.B.P. Milori b , Ladislau Martin Neto b,e<br />
a International Potato Center, Av. La Molina, 1898, P.O. Box 1558, Lima 12, Pe<strong>ru</strong>; b Brazilian<br />
Corporation for Agricultural Research (Embrapa) - Agricultural Inst<strong>ru</strong>mentation Center, R.<br />
XV de Novembro, 1452, P.O. Box. 741, 13560-970, São Carlos-SP, Brazil; c University of São<br />
Paulo – Institute of Physics of São Carlos, Av. Trabalhador São Carlense, 400, P.O. Box 369,<br />
13560-970, São Carlos -SP, Brazil; d Brazilian Corporation for Agricultural Research<br />
(Embrapa) – Soils Center, R. Jardim Botânico, 1024, 22460-000, Rio de Janeiro-RJ, Brazil;<br />
e Embrapa Labex- USA. USDA-ARS/OIRP. 5601 Sunnyside Avenue, Bldg. 4-1193.<br />
Beltsville, MD 20705-5141, USA<br />
E-mail: aline@cnpdia.embrapa.br<br />
1. Introduction<br />
Wetlands constitute around 1 % of the global landmass and their soils are home to many<br />
specialized organisms that are found nowhere else. Soils formed from waterlogged organic<br />
matter are known as peats, and contain a high percentage of organic matter. Peatlands are<br />
estimated to currently store 224 to 455 Pg of carbon, equal to 12-30% of the global soil<br />
carbon pool. In the high Andean mountains these ecosystems are valued for their role as<br />
regulator of the hydrological cycle, habitat for plant and animal species, carbon sink, good<br />
quality grassland, and their scenic value. These tropical and sub-tropical peatlands from the<br />
Andean highlands or cushion peat bogs are also known by local farmers as bofedales, which<br />
areas can sensitive to environmental conditions and climate change that might have direct and<br />
indirect effects on the sustainability of the agroecosystem [1].<br />
The objectives of this study were: 1) to study whole soils samples from Andean peat lands<br />
using Solid-State 13 C Nuclear Magnetic Resonance (NMR); 2) to make a qualitative<br />
characterization of predominant chemical st<strong>ru</strong>ctures of these kind of soils; and, 3) to evaluate<br />
the usefulness of principal component analysis of 13 C NMR spectra to hypothesize<br />
distributional patterns of these soils and to characterize the changes throughout the soil<br />
profile.<br />
2. Materials and Methods<br />
Permanent waterlogged and wet grassland (seasonal) bofedales from Huayllapata, Pe<strong>ru</strong> at an<br />
average altitude of 3,881 m asl, were selected as representative wetlands of the Central Andes.<br />
Seasonal bofedales presented scarcely vegetal coverage, since this grassland type is heavily<br />
<strong>Vol</strong>. 2 Page - 352 -
15th IHSS Meeting- <strong>Vol</strong>. 2<br />
grazed by sheep, bovines and cameloids during the rainy season that in this study ended right<br />
before the sampling. The permanent waterlogged bofedales sampled had a more dense<br />
vegetation and much higher pasture availability. Soil samples were collected in April 2008 at<br />
different depths: 0-2.5 (1), 2.5-5 (2), 5-10 (3), 10-20 (4) and 20-30 (5) cm in seasonally<br />
flooded (A) and permanently flooded bofedales (B). Dry soil samples were ground and sieved<br />
to pass 0.25 mm particle size, in order to reduce the heterogeneity of the samples. The total<br />
organic carbon concentration of the evaluated wetland soils varied from 121.7 to 215.6 g C<br />
kg -1 , in the top 30 cm. Variable-amplitude cross-polarization (VACP) NMR experiments were<br />
performed using a VARIAN INOVA spectrometer at 13 C and 1 H frequencies of 100.5 and<br />
400.0 MHz, respectively, and a Jackobsen 5-mm MAS double-resonance probe head. Magicangle<br />
spinning (MAS) at 5 kHz, with total suppression of spinning sidebands (TOSS), was<br />
employed to suppress spinning sidebands. The TOSS sequence was implemented with<br />
composite π pulses, to achieve a better inversion of the magnetization [2]. Two-Pulse Phase-<br />
Modulation (TPPM) proton-decoupling technique with field strength of 60 kHz, crosspolarization<br />
contact time of 1ms, and recycle delay time of 500 ms were used. Principal<br />
component analysis (PCA) was carried out using the spectra, obtained after area<br />
normalization and mean-centering of the data.<br />
3. Results and Discussion<br />
The 13 C NMR spectra (Fig. 1) presented typical features of soil organic matter, dominated by<br />
fresh plant debris such as cellulose and alkyl C groups, probably of plant origin, such as cutin,<br />
suberin and wax. As expected, the lignin signals were imperceptible due to the major<br />
contribution of cellulose in fresh material. However, there seems to be an ongoing oxidation<br />
(humification), since the carboxyl signal is prominent, indicating a partial oxidation of this<br />
vegetable material, probably cellulose to glucuronic acids. The contribution of fatty acids<br />
(cutin, suberin and wax) to this signal is also expected [3]. The samples from the upper layers<br />
(A1 and B1) are very similar, but this similarity decreases with depth. Additional carboxylic<br />
signal at 169 ppm can be observed in the deeper layers of both soils, but more evident in the<br />
samples from soil A. This signal can be attributed to carboxyl groups attached to aromatic<br />
rings.<br />
<strong>Vol</strong>. 2 Page - 353 -
15th IHSS Meeting- <strong>Vol</strong>. 2<br />
Figure 1: Spectra of peatland soils obtained by VACP/MAS 13 C NMR.<br />
In general, 13 C NMR results can be properly summarized by the PCA analysis (Fig. 2). The<br />
first principal component (PC1), which accounted for 78% of the total variance, is<br />
characterized by positive loadings at 130 and 169 ppm, typical of aromatic st<strong>ru</strong>ctures with<br />
carboxylic moieties, and negative loadings for fresher material such as cellulose (104 and 73<br />
ppm), methoxyl from lignin, or more probably N-alkyl from proteinaceous material (56 ppm)<br />
and fatty acids (21, 33 and 172 ppm). This last signal can also be related to oxidised cellulose.<br />
The scores of this PC showed a clear gradient along the sampling depth, in the soil A. In the<br />
soil B, this component is present in lower concentration, or even absent. This means that in<br />
soil A, samples from the bottom of the layer presented a higher concentration of carboxylated<br />
aromatic st<strong>ru</strong>ctures and lower concentration of fresh material. Soil B, in turn, was better<br />
characterized by the PC2, which explained 8 % of the total variance. The gradient shown by<br />
samples from this soil also increased with depth. This component is characterised by positive<br />
loadings for crystalline polymethylene (33 ppm) and some polyalcohol (77 ppm), probably<br />
the C-4 of the cellulose or aliphatic portion of lignin st<strong>ru</strong>cture (unsaturated alcohol) and a<br />
sharp aryl signal (131 ppm). The negative loadings (i.e., compounds more abundant in the<br />
surface samples) can be attributed to partially oxidised cellulose to glucuronic acids (172, 103<br />
and 72 ppm), guaiacyl and/or syringyl from lignin (56 and 152 ppm) and terminal methyl<br />
groups (16 ppm).<br />
<strong>Vol</strong>. 2 Page - 354 -
15th IHSS Meeting- <strong>Vol</strong>. 2<br />
4. Conclusions<br />
(a)<br />
Figure 2: PCA results from 13C NMR spectra: (a) loadings and (b) scores<br />
These results indicated that the humification process occurs at the bottom of the top layer and<br />
onwards, where a larger proportion of humified materials are found. This was expected due to<br />
the constant input of fresh material in the surface. Notwithstanding this process is different in<br />
each soil. In soil A, the accumulated recalcitrant material is mainly composed of carboxylated<br />
aromatic moieties; whereas in soil B, the accumulated material is mainly crystalline<br />
polymethylene. This difference could be due to the specific edaphic conditions in each soil<br />
and/or differences in the vegetation. On the other hand, the degradable (labile) material is<br />
similar in both soils (i.e., mainly cellulose and partially oxidised cellulose. The difference in<br />
the lignin composition in the permanent bofedales soil can indicate a change in the vegetation.<br />
In the past (deeper samples) the area would have a predominance of C-4 herbaceous<br />
vegetation whose lignin has more coumaryl alcohol at the expense of guaiacyl and syringyl<br />
units, and more recently a predominance of C-3 herbaceous vegetation.<br />
Acknowledgements<br />
International Potato Center (CIP), through its CIDA-funded project ALTAGRO.<br />
References<br />
1. Earle, L.R., B.G. Warner and R. Aravena, Quaternary Res., 59 (2003) 2.<br />
2. E.H. Novotny, M.H.B. Hayes, E.R. deAzevedo and T.J. Bonagamba, Naturwissenschaften, 93<br />
(2006) 447.<br />
3. Quiroz, R. 1986. Forage Lignins: isolation, characterization and degradation in the gastrointestinal<br />
tract of <strong>ru</strong>minants. North Carolina State University. Raleigh N.C. USA. 141 pp.<br />
(b)<br />
<strong>Vol</strong>. 2 Page - 355 -
15th IHSS Meeting- <strong>Vol</strong>. 2<br />
St<strong>ru</strong>ctural Changes of Sieniawa Brown Coal Humic Acids<br />
Upon Air Oxidation at 150 °C<br />
Franciszek Czechowski<br />
Faculty of Earth Science and Environmental Management, University of Wroclaw,<br />
32 Cybulskiego Str., 50-204 Wroclaw, Poland<br />
E-mail: franciszek.czechowski@ing.uni.wroc.pl<br />
1. Introduction<br />
In aerated natural environment humic substances undergo extensive bacterial and/or oxidative<br />
alterations leading to formation of highly aromatic refractory material [1]. To study their<br />
st<strong>ru</strong>cture most authors used almost exclusively conventional analytical pyrolysis or pyrolysismethylation.<br />
In this investigation, the effect of prolonged laboratory air oxidation at<br />
temperature of 150 °C on st<strong>ru</strong>ctural changes of Sieniawa brown coal humic acids (HAs) was<br />
evaluated by multiple methods. The study concerns the changes in the st<strong>ru</strong>ctural<br />
characteristics of HAs as a function of oxidation time.<br />
2. Materials and Methods<br />
HAs were isolated from low maturity Sieniawa brown coal (north-western Poland) by 0.1 M<br />
NaOH extraction at temperature of 70 °C and further precipitation by 1M HCl solution.<br />
Resultant HAs suspension was filtered off on filter paper in Büchner funnel and washed with<br />
distilled water until negative reaction on Cl - ions presence in the filtrate. The obtained HAs<br />
paste was preliminarily air dried, and after final drying under P 2 O 5 HAs were analysed for<br />
elemental composition (C daf = 53.8%, H daf = 5.0% and N daf = 0.9%, S d = 1.0%). Prior to HAs<br />
oxidation they were exhaustively Soxhlet extracted with dichloromethane-methanol (93:7,<br />
v/v). Air oxidation at temperature of 150 °C was performed in ventilated oven on the preextracted<br />
powdered (grain size < 0.2 mm) HAs, placed on plate surface in 0.5 mm layer<br />
thickness. Oxidation was lasting for the period until self ignition at this temperature occurred<br />
(1400 hours). On the collected periodically oxidised HAs samples the following<br />
determinations were performed: ultimate analysis, content of reactive functional groups<br />
(direct acid titration method), FT-IR spactra, binding capacity of selected metal cations as<br />
well as semi-quantitative molecular constitution of the thermally released pyrolysis and<br />
pyrolysis-methylation (in presence of the tetramethylammonium hydroxide – TMAH)<br />
products analysed by gas chromatography/mass spectrometry (GC/MS).<br />
<strong>Vol</strong>. 2 Page - 356 -
15th IHSS Meeting- <strong>Vol</strong>. 2<br />
3. Results and Discussion<br />
Air oxidation of HAs at 150 °C causes very rapid mass loss during the first 50 hours (Fig. 1),<br />
and it is gradually slowing down attaining nearly a steady rate of 0.01% mass loss per hour<br />
after 100 hours of oxidation. Under the experimental oxidation conditions the HAs ignited at<br />
the 1400 hour of oxidation. Elemental analysis of the HAs prolonged oxidation products<br />
revealed increasing content of oxygen on expense of hydrogen, leading to decrease of atomic<br />
H/C ratio and increase of atomic O/C ratio in the course of oxidation. In spite of increase in<br />
oxygen content, concentration of carboxylic groups drastically diminished, particularly over<br />
250 hours of oxidation, while fall in phenolic groups concentration was far less pronounced.<br />
However, molar ratio of –COOH/–OH phen groups decrease with duration of HAs oxidation.<br />
These trends were confirmed by Fourier transform infrared (FT-IR) spectroscopy. Presented<br />
in Fig. 2 FT-IR spectra show: (1) gradual decrease of –CH 2 and =CH 3 groups valence<br />
vibrations (2850–2920 cm -1 ), (2) shift of carbonyl group absorption bands from 1710 cm -1<br />
into higher wavenumber of 1717 cm -1 and increase in its intensity, (3) fall of carboxylic acids,<br />
and phenolics –OH absorption band (3420 cm -1 ), particularly over 250 hours of oxidation, (4)<br />
intensive aromatic –C=C– absorption band (1620 cm -1 ) irrespective on oxidation stage.<br />
20<br />
230<br />
ignition<br />
1100 h<br />
15<br />
Mass loss [% d ]<br />
10<br />
Transmittance [%]<br />
268 h<br />
0 h<br />
1718<br />
1717<br />
5<br />
536<br />
470<br />
0<br />
0 500 1000 1500<br />
Oxidation time [hour]<br />
Figure 1: HAs mass loss with duration of air<br />
oxidation at temperature of 150 °C<br />
0<br />
4000<br />
3600<br />
3420<br />
3200<br />
2920<br />
2800<br />
2850<br />
2400<br />
2000<br />
1711<br />
1620<br />
1456<br />
1384<br />
1263<br />
1101<br />
1600<br />
Wavenumbers [cm -1 ]<br />
1200<br />
1032<br />
800<br />
400<br />
Figure 2: FT-IR spectra of the raw HAs (bottom<br />
spect<strong>ru</strong>m), air oxidized for 268 hours (middle<br />
spect<strong>ru</strong>m) and for 1100 hours (upper spect<strong>ru</strong>m)<br />
<strong>Vol</strong>. 2 Page - 357 -
15th IHSS Meeting- <strong>Vol</strong>. 2<br />
Changes of the above discussed data in the course of HAs oxidation can be attributed to the<br />
selective removal of hydrogen-rich aliphatic constituents from the HAs polymeric matrix<br />
(particularly these bearing carboxylic functional groups), as well as aromatic character<br />
increase and carbonyl groups content of the oxidized products. It is supported by EPR spectral<br />
analyses, which confirmed the high oxygen contents (constant g value, 2.0036) and increasing<br />
condensation of the HAs st<strong>ru</strong>ctural network as seen by linewidth narrowing [2]. Binding<br />
capacity of metal ions fall with oxidation extend, which is due to loss of acidic functional<br />
groups, mainly carboxylic groups.<br />
0 h<br />
13<br />
15<br />
17<br />
19 21<br />
23<br />
1<br />
25<br />
27 29<br />
31<br />
phenanthrene<br />
0 h<br />
C2-phenanthrenes + anthracenes)<br />
1*<br />
2*<br />
anthracene<br />
C1-(phenanthrenes + anthracene)<br />
11<br />
33<br />
10.0 30.0 50.0 70.0<br />
32.0 34.0 36.0 38.0 40.0 42.0<br />
25<br />
27<br />
phenanthrene<br />
364 h<br />
19 21<br />
23<br />
1<br />
29<br />
364 h<br />
17<br />
31<br />
anthracene<br />
C1-(phenanthrenes + anthracene)<br />
15<br />
1*<br />
2*<br />
33<br />
C2-phenanthrenes + anthracenes)<br />
10.0 30.0 50.0 70.0<br />
Retention time [min]<br />
Figure 3: Illustration of selective removal of prist-1-<br />
ene (1*) and prist-2-ene (2*) upon air oxidation at<br />
temperature of 150 °C – Py products (numbers indicate<br />
hydrocarbon chain length)<br />
32.0 34.0 36.0 38.0 40.0 42.0<br />
Retention time [min]<br />
Figure 4: Illustration of selective removal of dimethylland<br />
methyl derivatives of phenanthrene and anthracene<br />
upon air oxidation at temperature of 150 °C – Py<br />
products<br />
Effect of air oxidation at temperature 150 °C on HAs st<strong>ru</strong>ctural network degradation was<br />
assessed by changes in amount and molecular composition of the thermally (Py/Py-Me)<br />
released products from oxidised HAs: n-alk-1-enes, n-alkanes, n-alkylbenzenes, n-<br />
alkylmethylketones, n-alkanoic acids or their methyl esters, naphthalene, phenanthrene,<br />
benzo- and dibenzofurans and their methyl- and dimethyl derivatives as well as various<br />
phenolics and phenolic methylation derivatives. Amounts of these compounds fall in the<br />
course of oxidation, broadly resembling route of HAs mass loss. Pyrolytic products obtained<br />
from the HAs oxidised longer than 400 hours were dominated by low molecular weight<br />
phenolic compounds, which were less degraded upon oxidation. Besides general affinity to<br />
degradation of chained st<strong>ru</strong>ctural units, also was revealed selectivity difference in removal of<br />
<strong>Vol</strong>. 2 Page - 358 -
15th IHSS Meeting- <strong>Vol</strong>. 2<br />
some compounds. Preferential, faster oxidative degradation of st<strong>ru</strong>ctural units bearing<br />
isoprenoidal substituent is shown for Py products in Fig. 3. Susceptibility to oxidative<br />
degradation of polymethyl substituted aromatic compounds is exemplified on phenathrene<br />
and anthracene as well as their methyl and dimethyl derivatives. It proceeds in order: dimethyl<br />
derivatives > methyl derivatives > phenanthrene and anthracene – see Fig. 4. This general<br />
trend is observed in Py and Py-Me products. Besides the differences in oxidative degradation<br />
selectivity, this process also leads to formation of compounds not observed fot the raw HAs.<br />
Fig. 5 illustrates appearance of α,ω-dicarboxylic n-alkanoic acids (analysed as dimethyl<br />
esters) after 804 hours of oxidation – m/z 74 chromatographic series observed in Py-Me<br />
products marked with asterisks on trace (B) mass chromatogram. Formation of benzoic acid<br />
derivatives during oxidation was also observed. Differences in molecular constitution in<br />
products released by Py and Py-Me are evidenced. The later gives more realistic molecular<br />
signature of the HAs st<strong>ru</strong>ctural units.<br />
26<br />
6<br />
(A)<br />
0 h<br />
28<br />
8<br />
(B)<br />
804 h<br />
6<br />
8<br />
10<br />
12 14<br />
16<br />
18 20<br />
10.0 30.0 50.0 70.0 90.0<br />
22<br />
24<br />
Retention time [min]<br />
30<br />
32<br />
10<br />
*<br />
* * 12<br />
*<br />
26<br />
*<br />
14 16<br />
24 28<br />
*<br />
*<br />
18 20 22<br />
30<br />
6<br />
* * * * * * *<br />
32<br />
* * * * *<br />
10.0 30.0 50.0 70.0 90.0<br />
Retention time [min]<br />
Figure 5: Comparison of fatty acids methyl esters homological composition released by Py-Me from raw HAs<br />
(trace A) and their oxidation product after 804 hours of air oxidation at temperature of 150 °C (trace B)<br />
4. Conclusions<br />
The data on st<strong>ru</strong>ctural characteristic changes of the Sieniawa HAs macromolecular network<br />
upon air oxidation at temperature 150 °C show: (i) the gradual oxidative degradation of highly<br />
aliphatic st<strong>ru</strong>ctural units, mainly bearing carboxylic groups, (ii) preferential dealkylation of<br />
alkyl substituted aromatics, (iii) additional formation of carbonyl groups in the more<br />
condensed remaining st<strong>ru</strong>ctural system.<br />
Acknowledgements<br />
Financial support from University of Wroclaw (project 1017/S/ING/10-XI) is acknowledged.<br />
References<br />
1. G. Almendros, A.T. Martínez, A.E. González, F.J. González-Vila, R. Früind, H.D. Lüdemann. J.<br />
Agr. Food Chem. 40 (1992) 1297.<br />
2. A. Jezierski, F. Czechowski, M. Jerzykiewicz and J. Drozd, Appl. Magn. Reson. 18 (2000) 127.<br />
<strong>Vol</strong>. 2 Page - 359 -
15th IHSS Meeting- <strong>Vol</strong>. 2<br />
Carbon Distribution in Different Soil Fractions Affected by Cover Crops<br />
and Soybean Rotations under No-Tillage System in Tropical Areas<br />
Sandro Roberto Brancalião a* , Ladislau Martin Neto b , Isabella Clerici De Maria a , Heitor<br />
Cantarella a , Débora Marcondes Bastos Pereira Milori b , Marcelo Luíz Simões b , Wilson Tadeu<br />
Lopes da Silva b<br />
a Agronomic Institute (IAC), Avenida Barão de Itapura, 1481,CEP: 13012970, Brazil;<br />
b EMBRAPA-CNPDIA, Rua XV de Novembro, 1485, São Carlos, Brazil<br />
E-mail: brancaliao@iac.sp.gov.br<br />
1. Introduction<br />
Carbon (C) is the main component of soil organic matter (SOM), responsible for changes in<br />
physical, chemical, and biological properties. As a whole, SOM determines fertility level or<br />
the soil's ability to provide necessary conditions for proper growth of crops. In tropical and<br />
subtropical soils highly weathered, organic matter is very important in providing nutrients to<br />
crops, the stability of the st<strong>ru</strong>cture, infiltration and water retention, aeration, thus, a key<br />
component of its productive capacity [9].<br />
In some situations no-tillage (NT) can lead to surface compaction [8] through of the years,<br />
which results in increased density and reduced total soil porosity, and lower relationship<br />
between macro and micropores. The C storage in soil organic matter (SOM) is an important<br />
strategy to mitigate carbon dioxide emission to atmosphere. The preferential C storage in the<br />
labile SOM fraction is an environmental benefit, which is expected to occur only under<br />
continuous NT and crop residues addition [2].<br />
The objective of this study was to evaluate the effect of the cover crops in the distribution of<br />
organic matter inside different soil fractions, with different chemical stability, in areas under<br />
cover crops-soybean rotation in two localizations of São Paulo State under NT system.<br />
2. Materials and Methods<br />
The experimental sites are located at experimental stations located in Campinas where the<br />
geographic coordinates of reference are 22 o 53’ South Latitude e 47 o 04’ West Longitude and<br />
in Colina 20º 42' South Latitude and 48º32' West Longitude, both in São Paulo State. The first<br />
experiment was started in 2005 conducted using a randomized complete blocks design with<br />
four replications for each treatment and the Colina site is deployment since 2007. The<br />
Treatments were five crop systems under no-till, with soybean cropping in summer and the<br />
following crops in during autumn/winter/spring season: T1: a graminea without side dressed<br />
nitrogen (N) applied; T2: a graminea with side dressed 30 kg ha -1 of N; T3: a graminea with<br />
<strong>Vol</strong>. 2 Page - 360 -
15th IHSS Meeting- <strong>Vol</strong>. 2<br />
side dressed 60 kg ha -1 of N; T4: a leguminous; T5: fallow (with spontaneous<br />
vegetation/weeds). Campinas site is a clayey soil (60%), with the same treatments,<br />
deployment at Colina site, however with different amount of clay (25%).<br />
Overview of Activities: Soil samplings were in October and December respectively to<br />
Campinas (SP) and Colina SP, both localized in São Paulo State. The composite samples were<br />
collected of the surface layer stratified depths 0-0.025, 0.025-0.05, 0.05-0.10 and 0.10-0.20 m,<br />
six subsamples to form a composite sample. This technique of mini-trench allowed the<br />
stratification well depths sampled. After collecting the samples are air dried and sieved<br />
through sieve of 2 mm mesh to obtain the fraction of dried soil air (TFSA). The method used<br />
for organic matter fractionation was the physical fractionation of organic matter by particle<br />
size [4]. The humification index used was HFil, calculated with organic matter spect<strong>ru</strong>m and<br />
carbon normalized in each soil sample [6].<br />
The study variables consisted of analysis of variance of data and application of the Student t<br />
test to observe the difference in all treatments with each other, both 5% probability [5].<br />
3. Results and Discussion<br />
It is generally accepted that physical protection of SOM within aggregates is an important<br />
factor controlling dynamics and decomposition of organic C in cultivated and no-till soils, and<br />
the dis<strong>ru</strong>ption of aggregates is one of the mechanisms proposed for lower SOC in tilled than<br />
in no-till systems [7]. The results of this work, when we observe the organic matter<br />
fractionation corroborated those obtained by Bayer et at., (2004), working with different crop<br />
rotations, where there was greater lability with the addition of waste. However when we look<br />
at the organic matter mineral-associated (Figure 1) for the soil conditions of Campinas<br />
behavior was different from the study by the author since the age of six tillage did not affect<br />
this fraction in agreement with the results of Hill, even with lower clay content. The results of<br />
this author showed that a fraction displays the same levels of functionality different according<br />
to soil characteristics. For this paper this major division has been carried out fractionation<br />
determines biggest difference in the fraction 20-53, demonstrating that the fallow is<br />
significantly less when compared to grass at all doses and legume winter. In Campinas, the<br />
HFIL index in the outermost layer, which of 0-2.5 cm (Table 1) showed that significantly all<br />
treatments were higher than the fallow, which shows the importance of using cover crops and<br />
maintain covered soil. In the rehabilitation of these areas, they need to be adopted<br />
management systems that focus on a higher amount of carbon to the soil in order to increase<br />
the bioavailability of organic matter, soil quality and mitigating CO2 emissions [1].<br />
<strong>Vol</strong>. 2 Page - 361 -
15th IHSS Meeting- <strong>Vol</strong>. 2<br />
T5<br />
a<br />
A<br />
T5<br />
a<br />
B<br />
T reatments<br />
T4<br />
T3<br />
T2<br />
b<br />
b<br />
b<br />
< 2 micras<br />
2‐20 micras<br />
20‐53 micras<br />
> 53 (labile frac tion)<br />
Treatments<br />
T4<br />
T3<br />
T2<br />
b<br />
a<br />
a<br />
T1<br />
a<br />
T1<br />
a<br />
0,00 0,50 1,00 1,50 2,00<br />
Carbon, g g ‐1<br />
0,00 1,00 2,00 3,00 4,00<br />
Carbon, g g ‐1<br />
Figure1: Carbon distribution in different soil fractions in 0-2.5 cm for five crop rotation treatments<br />
(T1: a graminea without side dressed nitrogen (N) applied; T2: a graminea with side dressed 30 kg ha -1<br />
of N; T3: a graminea with side dressed 60 kg ha -1 of N; T4: a legume; T5: fallow (with spontaneous<br />
vegetation/weeds); at experimental sites in Campinas (A) and Colina (B)<br />
Table 1: Results for humification (Hfil) in four layers in a Clayer Oxisol 2 at Campinas and a Silt Loam<br />
Oxisol 3 at Colina, SP, Brazil<br />
HFil 1 2 T1 T2 T3 T4 T5<br />
3 T1 T2 T3 T4 T5<br />
0-2.5 2042Ab 1980Ab 2023Ab 2010Ac 1768Bb 1447Bc 1558Bc 1625Bc 1500Ab 1400Bb<br />
2.5-5.0 5536Aa 5538Aa 5534Aa 5471Ab 5670Aa 3680Ab 3724Ab 3700Ab 3500Ab 3700Ab<br />
5.0-10.0<br />
5800Aa 5334Ba 5833Aa 5680Ab 5898Aa<br />
3050Bb 3052Bb 3052Bb 3605Ab 3100Bb<br />
10.020.0<br />
6101Aa 5550Ba 5900Aa 6277Aa 6063Aa<br />
4600Aa 4650Aa 4703Aa 4500Aa 4700a<br />
CV (%) 4 14 16<br />
1 HFil: Humification Index o f the SOM. 2 Treatments in the Campinas site. 3 Treatments in Colina site.<br />
4 Coefficient of Variation. Same lowercase in columns (depth) do not differ statically (p< 5%), same letters lines<br />
do not differ statistically (p
15th IHSS Meeting- <strong>Vol</strong>. 2<br />
In the physical fractionation was evident that the cover crops provided greater lability in the<br />
depth of 0-2.5 cm, in particular T4 (leguminous in winter) while the fallow at both sites<br />
showed a higher amount of carbon associated with minerals. The larger amount of the labile<br />
fraction was found in Colina soil, thus the mineralogy of this soil.<br />
Acknowledgements.<br />
Thanks to FAPESP for financial support to project (2008/06226-2), and to CNPq for Pos-doc<br />
grant to SRB.<br />
References<br />
1. Bayer, C.; Mielniczuk, J.; Amado, T. J. C.; Martin-Neto, L.; Fernandes, S. V. Organic matter<br />
storage in a sandy clay loam acrisol affected by tillage and cropping systems in southern Brazil.<br />
Soil and Tillage Research, v. 54, p. 101-109, 2000.<br />
2. Bayer, C., Martin Neto, L., Mielniczuk, J., Pavinato, A. Armazenamento de carbono em frações<br />
lábeis da matéria orgânica de um Latossolo Vermelho sob plantio direto. Pesquisa Agropecuária<br />
Brasileira, v.39, n.7, p.677-683, 2004.<br />
3. Beber, F. C. Stocks and lability of organic matter and acidification on a sandy under No-Till<br />
systems affected by nitrogen fertilization and culture. Doctoral Thesis. UFRGS, Porto Alegre,<br />
139p.<br />
4. Cambardella, C.A.; Elliot, E.T. Particulate soil organic-matter changes across a grassland<br />
cultivation sequence. Soil Sci Soc American Journal, v.56, p.777-783, 1992.<br />
5. Gomes, F.P. Curso de Estatística Experimental. 10 a ed. São Paulo: Nobel, 1982. 430 p.<br />
6. Milori, D. M. B. P.; Galeti, H. V. A.; Martin-Neto, L.; Diekow, J.; González-Pérez, M.; Bayer, C.;<br />
Salton, J. Organic matter study of whole soil sample using laser-induced fluorescence<br />
spectroscopy. Soil Science Society American Journal, v. 70, p. 57-63, 2006.<br />
7. Six, J., E.T. Elliot, K. Paustian. 2000. Soil macroaggregate turnover and microaggregate<br />
formation: A mechanism for C sequestration under notillage agriculture. Soil Biol. Biochem.<br />
32:2099–2103.<br />
8. Siqueira, G. M.; Vieira, S. R., Dechen, S. C. F. Variabilidade espacial da densidade e da<br />
porosidade de um Latossolo Vermelho Eutroférrico sob semeadura direta por vinte anos.<br />
Bragantia . 2009, vol.68, n.3, pp. 751-759. ISSN 0006-8705.<br />
9. Stevenson, F. J. <strong>Humus</strong> Chemistry: genesis, composition, reactions. 2. ed. New York: John Wiley,<br />
1994. 496 p.<br />
<strong>Vol</strong>. 2 Page - 363 -
15th IHSS Meeting- <strong>Vol</strong>. 2<br />
Does the Thermo-Oxidative Stability of Soil Organic Matter Resemble its<br />
Microbiological Behaviour?<br />
Jiří Kislinger a *, Christian Siewert b , Jiří Kučerík a<br />
a Institute of Physical and Applied Chemistry, Brno University of Technology, Purkyňova 118,<br />
612 00 Brno, Czech Republic; b Institute of Landscape Architecture at Research Center for<br />
Horticulture, Center of Life and Food Sciences, Weihenstephaner Berg 17, 853 50 Freising,<br />
Germany<br />
E-mail: xckislinger@fch.vutbr.cz<br />
1. Introduction<br />
Soil organic carbon content and quality are c<strong>ru</strong>cial factors in global carbon cycling and land<br />
use development under changing climatic conditions. However, the biological processes in<br />
soils are still not fully understood. The availability of relevant data is hampered by costs and<br />
time-consuming methods determining dependencies of biological processes on different<br />
environmental factors, organism societies, pedogenesis and others. Basically, such data are<br />
necessary for modeling the carbon cycle and to understand to the long term changes in<br />
biosphere [1, 2]. Thermoanalytical techniques represent useful tools for investigation of<br />
organism activities, physical properties, soil components and related aspects. Literature<br />
reviews show promising connections to different needs in soil analyses and environmental<br />
sciences [3, 4]. Some recent results indicate the possibility to determine basic soil properties<br />
(such as C, N, clay and carbonates content) employing only one record obtained by<br />
thermogravimetric analysis (TGA) [5]. Besides, such time and money saving approach may<br />
imply other correlations, which could be used for possible prediction of soil microbial activity<br />
[6]. Incubation (also called respiration) experiments represent a common tool to evaluate<br />
biological processes in soils. The measured CO 2 evolution, O 2 consumption, enzyme activity<br />
or other parameters are closely linked with activity of microorganisms, nutrient availability<br />
and chemical and physical state of soils. In combination with other methods, such<br />
experiments are very helpful to discover the mechanisms of soil regulation and stabilization<br />
processes [7]. On the contrary, incubation methods are usually time consuming, expensive,<br />
and sometimes very sensitive to the experimental conditions and the origin of samples.<br />
Generally, popular methods for determination of biological activities are usually oriented only<br />
on monitoring of few aforementioned parameters. These approaches do not shed light on the<br />
complex network of dependencies between metabolic processes of soil organisms and<br />
environmental conditions. This makes these methods less attractive for serial analyses and<br />
hampers the comparison of results obtained from measurements of soils collected in different<br />
<strong>Vol</strong>. 2 Page - 364 -
15th IHSS Meeting- <strong>Vol</strong>. 2<br />
regions and climatic conditions. In this study the interrelation between thermal and biological<br />
stability of soils is exploited as a possible background for simple and rapid determination of<br />
biological processes in soils. For this purpose, different TGA profiles of air dried soil samples<br />
were compared with the dynamics of CO 2 evolution associated with microbiological decay of<br />
soil organic matter in incubation experiments. The aim of such approach was to reveal if there<br />
exists a relationship between the results of expensive and demanding incubation experiments<br />
and simple, cheap and fast TGA technique.<br />
2. Materials and Methods<br />
The sample set used in experiments consisted of 33 soils collected from five German national<br />
parks in order to have virgin soils with intrinsic properties, not affected by human activity by<br />
any means. After their collection from top horizons (down to 30 cm), soil samples were airdried<br />
and sieved to
15th IHSS Meeting- <strong>Vol</strong>. 2<br />
Figure 1: Correlation of amount of evolved CO 2 after 7 days with thermal induced mass loss in the<br />
temperature interval 110–550 °C<br />
Figure 2: Matrices of correlation coefficients for CO 2 evolution from rewetted soils in incubation<br />
experiments and thermally induced mass losses of air dried soils. The level of correlation is<br />
represented by different shades of grey. (a) Cumulative respiration, (b) rate of respiration<br />
<strong>Vol</strong>. 2 Page - 366 -
15th IHSS Meeting- <strong>Vol</strong>. 2<br />
This plot demonstrates a significant but weak dependence between these two parameters;<br />
however, not useful for practical applications. Similar results were obtained when using data<br />
from other incubation time intervals. On the other hand, more detailed information can be<br />
obtained if one calculates coefficients of determination from specific temperature intervals<br />
and incubation periods (microbiological CO 2 evolution). Such a net of mutual interrelations<br />
can be illustrated in 3D charts. Figure 2 depicts an example of such graphic expression.<br />
In this case, the grey scale has a meaning of the third dimension (z-axis) representing the<br />
respective correlation coefficients. In both graphs in the Figure 2 the darker areas represent<br />
the closer correlation. Figure 2a reports the correlation between thermally induced mass losses<br />
and cumulative CO 2 evolution. The maximum correlation (R 2 = 0.83) was determined for<br />
mass losses at the temperature 30 °C and incubation after almost 80 days. However, the area<br />
of significant correlation begins at 4 days of respiration and the temperature 100 °C. Second<br />
area with significant correlation is located around 260 °C. High temperature regions showed<br />
some weak correlations around 480 °C and 530 °C. Figure 2b demonstrates similar data but<br />
using the rate of CO 2 evolution. With such approach, the highest correlation coefficient (R 2 =<br />
0.85) was determined for mass losses in the temperature interval 60–110 °C and incubation<br />
period of 1 day. Similar values of correlation can be found with increasing incubation time.<br />
Analogously to Fig. 2a, second area with significant correlation can be found between 260 °C<br />
and 320 °C. Some other correlations were found also for shorter incubation time at<br />
temperatures between 400 °C and 500 °C and around 530 °C. In order to understand the<br />
obtained results it is necessary to describe the main processes occurring during soil heating<br />
and induced mass losses. The low temperature area is mainly connected with free and bound<br />
water evaporation. In soils, this mass loss sometimes correlates with the clay content [7].<br />
However, only few publications discuss the hygroscopicity of fresh plant material; more of<br />
them deal with humic substances and other components of soils as a source of water in air<br />
dried soils, which were determined by thermal analyses [9]. Mass losses at higher<br />
temperatures are usually attributed to the degradation of soil organic matter components of<br />
different thermal stability [10]. It is quite surprising to find the closest correlations of<br />
incubation data with TGA mass losses occurring in the area of water evaporation in air dried<br />
soils. These correlations steeply increase immediately after the beginning of incubation. The<br />
influence of water in air dried soils on biological process could be associated with many<br />
factors; one of them is for example the kinetics of wetting and hydration of soil organic and<br />
inorganic matter. It has been already demonstrated that the time necessary for complete<br />
<strong>Vol</strong>. 2 Page - 367 -
15th IHSS Meeting- <strong>Vol</strong>. 2<br />
hydration of soil organic matter can be as high as three weeks [11]. By this way the<br />
interaction of water with SOM can be one of the regulation factors of biological processes in<br />
soils. In that case swelling, solvation, dissociation, diffusion and other processes, probably all<br />
together, should be considered as c<strong>ru</strong>cial factors. As it could be expected, after few hours of<br />
incubation mass losses above 230 °C significantly correlate with biological activity. Later, the<br />
correlation decreases and appears again at higher temperature areas at the end of incubation<br />
experiments. Apparently, the quality of soil organic matter is changing during incubation and<br />
can be simply detected by means of TGA experiments.<br />
4. Conclusions<br />
The results reported confirmed the existence of interrelationship between biological processes<br />
measured by CO 2 evolution and thermal stability detected by mass losses using TGA. The<br />
level of correlation is higher than expected, however, not high enough for direct practical use.<br />
Nevertheless, the combination of methods can open the way to the development of methods<br />
describing biological behavior of soils by simpler, cheaper and faster way. This confirms the<br />
attractiveness of TGA for further investigations. Some unexpected results hint on the<br />
importance of water retention in soils to be the key factor for transformation processes in<br />
carbon cycle. Therefore, water-binding of air dried samples has to be taken into account<br />
during sampling and sample preparation to get comparable results about intrinsic properties of<br />
soils as a product of interrelated biological and non-biological processes.<br />
Acknowledgements<br />
Financial support of Ministry of Education, Youth and Sports of the Czech Republic, project<br />
No. 0021630501, is greatly acknowledged.<br />
References<br />
3. B. Minasny, A.B. McBratney, and S. Salvador-Blanes, Geoderma, 144 (2008) 140.<br />
4. F. Bastida, A. Zsolnay, T. Hernández, and C. García, Geoderma, 147 (2008) 159.<br />
5. A.F. Plante, J.M. Fernández, and J. Leifeld, Geoderma, 153 (2009) 1.<br />
6. N. Barros, J. Salgado and S. Feijóo, Thermochim. Acta, 458 (2007) 11.<br />
7. C. Siewert, Soil Sci. Soc. Am. J., 68 (2004) 1656.<br />
8. C. Siewert, Investigation of the Thermal and Biological Stability of Soil Organic Matter, Shaker-<br />
Verlag, Aachen, 2001.<br />
9. D. Šmejkalová, A. Piccolo and M. Spiteller, Environ. Sci. Technol., 40 (2006) 6955.<br />
10. G.P. Petrosyan, M.P. Aranbaev and F. A. Grigoryan, in Proceedings of the Fourth International<br />
Conference on Thermal Analysis, I. Buzás (Ed.), <strong>Vol</strong>. 2, Budapest 1974, p. 745.<br />
11. M. Borisover and E.R. Graber, Environ. Sci. Technol., 37 (2003) 5657.<br />
12. J. Kučerík, J. Kovář and M. Pekař, J. Therm. Anal. Calorim., 76 (2004) 55.<br />
13. J. Hurrass and G.E. Schaumann, Soil Sci. Soc. Am. J., 71 (2007) 280.<br />
<strong>Vol</strong>. 2 Page - 368 -
15th IHSS Meeting- <strong>Vol</strong>. 2<br />
Change of Soil Carbon Stocks on Croplands in Russia<br />
Estimated by Balance Model<br />
Romanovskaya Anna*, Karaban’ Rodion<br />
Institute of Global Climate and Ecology, Glebovskaya str., 20B, 107258 Moscow, Russia<br />
E-mail: Aromanovskaya@comail.<strong>ru</strong><br />
1. Introduction<br />
Management of croplands can decrease or increase carbon (C) stocks in soils depending on<br />
type of crop, amount of crop residues, type of tillage, fertilizers applied and other<br />
management activities, as well as physical and chemical properties of soils. Another<br />
important factor is the duration of agricultural usage of soils. As a result agrarian soils could<br />
be a source or sink for carbon dioxide (CO 2 ) from atmosphere. Assessment of annual change<br />
in organic C stocks in soils of croplands is one of the key elements in the investigation of<br />
carbon cycle in biosphere as whole and global climate change.<br />
At the moment there are very few data about C stock changes in agricultural soils in Russia.<br />
In accordance to official data humus content decreased by 0.4–0.6% in average for the period<br />
from 1970 to 1993 and by another 0.3% during 1991–1999 [1]. However there is a lack of<br />
robust annual soil C stock change data in Russia while it is a requirement for national<br />
reporting under UN Climate Change Convention and Kyoto Protocol.<br />
2. Materials and Methods<br />
Annual C stock changes in soils under croplands in Russia estimated by balance model<br />
developed in our earlier research [2]. In accordance to our model, annual change estimated as<br />
a difference between the input of C compounds into soils (with fertilizers, liming and crop<br />
residues) and its output (erosion and deflation of soils and soil respiration). Under fertilizers<br />
we considered the amount of C applied to soils with pure manure of livestock and poultry and<br />
its manure with beddings, both after the storage. Besides, as an input to soils the C from<br />
mineral fertilizers and lime materials was estimated. The improvement of previous version of<br />
the model is that now the amount of crop residues calculated basing on data on annual<br />
productivity and area for every type of crop in the country [3, 4], instead of chlorophyll index.<br />
Pathways for C output from agrarian soils include loses from surface (erosion and deflation)<br />
and soil respiration. In accordance to literature data about 25 kg C/ha per year is removing<br />
from ecosystem in Russia to ground and surface water courses [5, 6]. This value was verified<br />
with statistical data on quality of surface water in Russian Federation [7] and used to estimate<br />
<strong>Vol</strong>. 2 Page - 369 -
15th IHSS Meeting- <strong>Vol</strong>. 2<br />
average total erosion losses of C from croplands. We collected the database on estimations of<br />
soil respiration from various agrarian soils in the country and obtained average CO 2 rates for<br />
main soil types: chernozems (402 mg/m 2 /hour), soddy-podzolic (340 mg/m 2 /hour) and grey<br />
forest, chestnut and other soils (256 mg/m 2 /hour). Improvement from previous version of our<br />
model includes adjustment of obtained average CO 2 rates to significant decline in the input of<br />
organic fertilizers into soils of cropland in Russia happened last 15–20 years. As a result of<br />
lower organic application the amount and biodiversity of soil microflora reduced, and soil<br />
respiration decreased by 1.8 times as an average [8]. Therefore we reduced CO 2 rates obtained<br />
from database to 223 mg/m 2 /hour for chernozem, 189 for soddy-podzolic and 142<br />
mg/m 2 /hour for other soil types tesred. It is estimated that respiration of crop roots excluded<br />
(assumed 40%), while respiration during cold season added (30% from round-year emission).<br />
3. Results and Discussion<br />
The obtained results show that during the period 1990–2007 the total annual balance of soil C<br />
on territory of croplands in Russia was negative (CO 2 emission to the atmosphere) and<br />
averaged around 41.8 x 10 6 tones C per year. That corresponds to annual loss of soil C as high<br />
as 0.37 tones per ha or 1.2 tones CO 2 emissions per ha per year. During the last years (since<br />
1998) the tendency in decline of net annual loses of soil carbon is observed (from 0.5 in 1990<br />
to 0.3 tones C/ha/yr in 2007). That explained by the strong drop in the input of organic<br />
fertilizers in the country (by 88% since 1990) and corresponding reduction of soil respiration.<br />
Another reason is the growth of the average cereal productivity in Russia during last years<br />
that could lead to the increase of the amount of crop residues left on fields.<br />
Acknowledgements<br />
The work supported by Russian Foundation for Basic Research, project #09-05-13506.<br />
References<br />
1. Results of Agrochemical Monitoring. Agroconsult, Moscow, 2001, 80 p.<br />
2. A.A. Romanovskaya and R.T. Karaban, Izvestiya RAN, Ser. Geograph. 4 (2008) 96.<br />
3. F.I. Levin, Agrochimiya (Agrochemistry) 8 (1977) 36.<br />
4. A.A. Romanovskaya, M.L. Gytarsky, R.T. Karaban and I.M. Nazarov, in Problems of Ecological<br />
Monitoring and Ecosystem Modelling 18 (2002) p. 276.<br />
5. A.A. Titlyanova, G.I. Bulavko, S.Ya. Kudryasheva, A.V. Naumov, V.V. Smirnov and A.A.<br />
Tanasienko, Pochvovedenie (Soil Science) 1 (1998) 51.<br />
6. Z.V. Pazukevich and M.E. Kozlovskaya, in Erosion of Soils and River Bed Evolution, Moscow<br />
State University, Moscow, 12, 2000, p. 297.<br />
7. Yearbook on Quality of Surface Water in Russian Fed., Roshydromet, Obninsk, 1996, p.662.<br />
8. I.N. Kurganova, V.O. Lopes de Gerenu, T.N. Myakshina, D.V. Sapronov and V.N. Kudeyarov, in<br />
Materials of IV All-Russian Scientific Conference “Humic Substances in Biosphere” St.<br />
Petersburg, 2007, p. 54.<br />
<strong>Vol</strong>. 2 Page - 370 -
15th IHSS Meeting- <strong>Vol</strong>. 2<br />
TER49 (322) Molecular features of organic matter in Canarian Andosols as seen by<br />
solid state 13 C NMR. J.A. González-Pérez, C.D. Arbelo, F.J. González-Vila, A. Rodríguez-<br />
Rodríguez, C.M. Armas, H. Knicker<br />
<strong>Vol</strong>. 2 Page - 371 -
15th IHSS Meeting- <strong>Vol</strong>. 2<br />
Carbon Sequestration in an Acrisol under No-Tillage and Organic Farming<br />
Systems in Northeastern Brazil<br />
Luiz Fernando Carvalho Leite a* , Janyelle de Oliveira Lemos a , Francisco das Chagas Oliveira a<br />
Ademir Sérgio Ferreira de Araújo b<br />
1. Introduction<br />
a Embrapa Mid-North, Av. Duque de Caxias 5650, Teresina-PI, Brazil;<br />
b Universtiy of Piaui, Campus da Socopo, Teresina-PI, Brazil.<br />
E-mail: luizf@cpamn.embrapa.br<br />
Farming methods that use mechanical tillage and excessive use of synthetic fertilizer can<br />
promote soil degradation. Therefore, soil management regimes based on conservation tillage<br />
(no-tillage or reduced tillage) or organic farming is essential to sustainable land use [1]. In no<br />
tillage system, the dead biomass formed by the crop residues accumulated on the topsoil can<br />
help reduce erosion, temperature and moisture fluctuation at the surface and the crops<br />
exposure to drought. Organic practices avoid applications of synthetic fertilizers and<br />
pesticides, rely on organic inputs and recycling for nutrient supply, and emphasize cropping<br />
system design and biological processes for pest management [2]. These systems may thus<br />
reduce some negative effects attributed to conventional farming and have potential benefits on<br />
soil organic carbon (SOM) stocks and soil quality. Several studies establish that SOM is an<br />
essential soil quality indicator especially by its effects on soil st<strong>ru</strong>cture, water retention,<br />
nutrient availability and soil microorganisms [3]. More recently, SOM has attracted great<br />
interest because of the phenomenon of global warming and the prospect of using soil as a<br />
reservoir of carbon released to the atmosphere (CO 2 ) by activity human. Therefore, our study<br />
aimed to quantify the effects of the tillage systems and organic farming on carbon<br />
sequestration rate in an Acrisol cultivated with watermelon in Northeastern Brazil.<br />
2. Materials and Methods<br />
The field study was carried out in Jatobá, Piaui state, Northeastern Brazil (04º 46’ 16” S, 41°<br />
49’ 04” W; 240 m). The mean annual air temperature and average rainfall are 30 o C and 1.000<br />
mm yr -1 respectively. The soil (700 g kg -1 of clay content) is a Typic Hapludults (Argissolo<br />
Vermelho-Amarelo, Brazilian Soil Classification). The area has been cultivated for 12 years,<br />
with watermelon and maize-bean intercrop, under conventional and organic farming system.<br />
Five land use systems were selected: NV: native vegetation; NT/ORG: no tillage plus organic<br />
fertilizer (compost); NT/CHE: no-tillage plus chemical fertilizer (120, 120, and 100 kg/ha N-<br />
P 2 O 5 -K 2 O, respectively); NT/ORG/CHE: no-tillage plus organic fertilizer and chemical<br />
<strong>Vol</strong>. 2 Page - 372 -
15th IHSS Meeting- <strong>Vol</strong>. 2<br />
fertilizer; and CT/CHE: conventional tillage plus chemical fertilizer. The compost (C:N = 7)<br />
was yearly applied at 40 m 3 /ha shortly before sowing time and it was partially air-dried to<br />
enable manual application. Annually, 2 Mg/ha of carnauba (Copernicea cerifera (Copernícea<br />
cerífera Mart.) straw (lignin (% dry matter) = 18.1) were applied in the NT/ORG and<br />
NT/ORG/CHE systems. Total organic carbon (TOC) was quantified by wet combustion using<br />
a mixture of potassium dichromate and sulfuric acid under heating (Yeomans and Bremner<br />
1988). Total nitrogen (TN) was measured in the soil samples by the Kjeldhal method<br />
(Bremner 1996). C-CO 2 emission or sequester rate was estimated using native vegetation was<br />
as a reference (TOC stocks NV - TOC stocks management systems/12 years). A conversion<br />
factor of C to CO2 of 3.67 (molar mass of CO2/molar mass of C) was used. The free light<br />
fraction (FLF) was separated from the soil by flotation in NaI solution (SG=1.8±0.01) as<br />
proposed by Freixo et al. (2002). The siphoned FLF was dried at 80 ºC for 72 h and the<br />
carbon of the FLF was determined by wet combustion using a mixture of potassium<br />
dichromate and sulfuric acid under heating (Yeomans and Bremner 1988). Carbon of the FLF<br />
was considered labile C (CL) as proposed by Vieira et al. (2007). The non-labile carbon<br />
(CNL) was calculated by difference (CNL =TOC−CL). Based on the difference between the<br />
TOC of native vegetation and the TOC of the cultivated systems, a carbon pool index (CPI)<br />
was calculated as CPI = TOC in treatment/TOC in reference. According to changes in the<br />
proportion of CL (i.e. L=CL/CNL) in the soil, a lability index (LI) was calculated as LI=L in<br />
treatment/L in reference. These indices were used to calculate the carbon management index<br />
(CMI) by the following formula: CMI=CPI×LI×100 (Blair et al. 1995). The study was carried<br />
out in a completely randomized design with four replicates and the data were analyzed<br />
statistically. Analyses of variance (ANOVA) and a t-test to detect significant differences<br />
between the areas studied. When a significant F value was detected, the means were<br />
compared by the Tukey test (P < 0.05).<br />
3. Results and Discussion<br />
In the 0–10 and 10–20 cm depths, TOC stocks were higher (P
15th IHSS Meeting- <strong>Vol</strong>. 2<br />
TOC stock (Mg/ha)<br />
16<br />
14<br />
12<br />
10<br />
8<br />
6<br />
a<br />
0.0 - 0.1 m 0.1 - 0.2 m<br />
a<br />
a<br />
b<br />
b<br />
b<br />
b b<br />
a<br />
b<br />
TN stock (Mg/ha)<br />
1,2<br />
1,0<br />
0,8<br />
0,6<br />
0,4<br />
a<br />
b<br />
0.0 - 0.1 m 0.1 - 0.2 m<br />
a<br />
a<br />
a<br />
b<br />
ab<br />
b<br />
b<br />
b<br />
4<br />
2<br />
0,2<br />
0<br />
a) b)<br />
NT/ORG<br />
NT/CHE<br />
CT/CHE<br />
NT/CHE/ORG<br />
NV<br />
NT/ORG<br />
NT/CHE<br />
CT/CHE<br />
NT/CHE/ORG<br />
NV<br />
0,0<br />
NT/ORG<br />
NT/CHE<br />
CT/CHE<br />
NT/CHE/ORG<br />
NV<br />
NT/ORG<br />
NT/CHE<br />
CT/CHE<br />
NT/CHE/ORG<br />
NV<br />
Figure 1: Soil management systems and its effects on total organic carbon (TOC) (a) and total nitrogen<br />
(TN) (b) stocks at 0–0.10 and 0.10–0.20 m soil depths. NT/ORG: no-tillage plus organic fertilizer;<br />
NT/CHE: no-tillage plus chemical fertilizer; CT/CHE: conventional tillage plus chemical fertilizer;<br />
NT/CHE/ORG: no-tillage plus chemical and organic fertilizers and; NV: native vegetation.<br />
Higher potential for C sequestration was observed in the NT/CHE/ORG (1.63 Mg/ha/year and<br />
1.75 Mg/ha/year) and NT/ORG (1.22 Mg/ha/year and 1.30 Mg/ha/year) systems in the 0–10<br />
cm and 10–20 cm, respectively (Table 1). These results can be explained because we had<br />
included, besides no-tillage, organic compost which increases TOC stocks in the soil as<br />
established by several authors (Leite et al., 2007; Triberti et al., 2008).<br />
In 0–10 cm depth, CL stocks were higher (P
15th IHSS Meeting- <strong>Vol</strong>. 2<br />
Table 1: C-CO 2 Emission (-) or sequester (+) rate, labile carbon (CL) stocks and carbon management index<br />
(CMI) for soil management systems<br />
Carbon pool Lability Lability<br />
Soil<br />
C-CO 2<br />
C<br />
Management Rate<br />
L C NL C L /TOC index of C index CMI<br />
(CPI) (L) (LI)<br />
Mg/ha.<br />
year<br />
Mg/ha %<br />
0 – 0.10 m<br />
NV — 0.62 c 8.05 b 7.23 c — 0.08 — —<br />
NT/ORG +1.22 3.61 a 9.04 b 28.5 a 1.46 0.43 5.49 801 a<br />
NT/CHE -0.04 2.42 b 6.12 c 28.3 a 0.98 0.43 5.56 544 b<br />
NT/CHE/ORG +1.63 2.38 b 11.6 a 17.0 b 1.61 0.20 2.63 424 b<br />
CT/CHE +0.29 0.64 c 9.00 b 6.61 c 1.11 0.08 0.90 100 c<br />
0.10 — 0.20 m<br />
NV 0.49 b 6.86 c 6.63 b — 0.07 — —<br />
NT/ORG +1.30 2.22 a 9.39 b 19.1 a 1.58 0.24 3.33 526 a<br />
NT/CHE +0.46 1.55 a 7.29 bc 17.5 a 1.20 0.22 3.08 370 b<br />
NT/CHE/ORG +1.75 1.69 a 11.4 a 12.9 a 1.78 0.16 2.21 354 b<br />
CT/CHE +0.53 0.64 b 8.46 b 7.00 b 1.24 0.07 1.04 129 c<br />
Means within columns followed by the same letters are not different by Tukey-test at P=0.05.<br />
NT/ORG: no-tillage plus organic fertilizer; NT/CHE: no-tillage plus chemical fertilizer; CT/CHE: conventional<br />
tillage plus chemical fertilizer; NT/CHE/ORG: no-tillage plus chemical and organic fertilizers and; NV: native<br />
vegetation.<br />
4. Conclusions.<br />
Higher total organic carbon, labile C and carbon sequestration rate were observed in the notillage<br />
and organic management which can be considered a sustainable alternative to<br />
watermelon production system in Northeastern Brazil.<br />
References<br />
1. M. Tejada, MT. Hernandez, C. Garcia. J. Environ. Qual. 35 (2006) 1010–1017.<br />
2. ASF. Araújo, VB. Santos, RTR. Monteiro. Eur. J. Soil Biol. 44 (2008) 225–230.<br />
3. LFC. Leite, ES. Mendonça, PLOA. Machado. Aust. J. Soil Res. 45 (2007) 25–32.<br />
4. JC. Yeomans, JM. Bremmer. Commun. Soil Sci. Plant Anal. 19 (1988) 1467–1476.<br />
5. JM. Bremner (Eds DL Sparks) (1996) pp. 1085–1121. (SSA Book Series: Madison).<br />
6. AA. Freixo, PLOA. Machado de, HP. Santos de, CA. Silva , FS. Fadigas de. Soil Tillage Res 64<br />
(2002) 221–230.<br />
7. FCB. Vieira, C. Bayer, JA. Zanatta , J. Dieckow, J. Mielniczuk, ZL. He. Soil Tillage Res. 96<br />
(2007) 195–204.<br />
8. GJ. Blair, RDB. Lefroy , L. Lisle. Aust. J. Agric. Res. 46 (1995) 1459–1466.<br />
9. L. Triberti, A. Nastri, G. Giordani, F. Comellini, G. Baldoni, G. Toderi. Eur. J. Agron. 29 (2008)<br />
13–20.<br />
<strong>Vol</strong>. 2 Page - 375 -
15th IHSS Meeting- <strong>Vol</strong>. 2<br />
Mechanisms of Iron Reduction and Phospho<strong>ru</strong>s Solubilization in an<br />
Intermittently Wet Pasture Soil<br />
Jared L. Wilmoth, Louis M. McDonald * , Alan J. Sextone<br />
West Virginia University, Division of Plant and Soil Sciences, P.O. Box 6018, Morgantown,<br />
WV, USA<br />
E-mail: LMMcDonald@mail.wvu.edu<br />
1. Introduction<br />
Appalachian pasture soils are generally acidic and lack adequate concentrations of native<br />
phospho<strong>ru</strong>s (P) to sustain forage production and grazing livestock. An understanding of P-<br />
cycling in these soils is needed to maintain the economic viability of these farming systems<br />
and to protect environmental quality. Iron minerals largely control the soil solution P<br />
composition in neutral to acidic soils. Reductive dissolution of Fe(III) oxyhydroxides has<br />
been shown to release adsorbed P in wetlands, lake sediments, and flooded agricultural lands.<br />
However, results from these reducing environments cannot be extrapolated to other<br />
landscapes of agronomic importance.<br />
Iron reduction and P desorption has been demonstrated in a humid tropical forest<br />
toposequence [1] as has the effect of pulsed additions of labile C [2]. Topographically<br />
variability in Appalachian grassland soils creates areas of seasonally localized wetness. Our<br />
hypothesis was that humic acids would promote iron reduction and P solubilization in these<br />
areas.<br />
2. Materials and Methods<br />
Soil samples were collected from a slightly concave position from a NW-facing sideslope<br />
near Morgantown, WV, USA. Native humic acid (HA) extracted from the sampling location<br />
[3] at 2.0 , 4.0, and 8.0 g L -1 and anthraquinone-2,6-disulfonic acid (AQDS) at 200 µM with<br />
30 g soil were used to determine their electron-mediating effects on Fe (III) reduction and P<br />
solubilization over time [1,2,3].<br />
Controls were ultrapure water, and a biological sterilization with sodium azide. Extracted HA<br />
and the International Humic Substance Society (IHSS) Elliot Soil HA standard were<br />
compared using 13 C-NMR, FT-IR, and CHNS analysis.<br />
<strong>Vol</strong>. 2 Page - 376 -
15th IHSS Meeting- <strong>Vol</strong>. 2<br />
3. Results and Discussion<br />
Extracted HA and the IHSS HA had very similar spectra and properties. There was a strong<br />
relationship between Eh, Fe(II), µM solubilized P, and CO 2 evolution was found for all<br />
treatments. Soil treated with 2.0 g L -1 HA and 200 µM AQDS kg -1 dry soil had the highest,<br />
most similar, solubilized P rates. However, the soil alone, without an added electron mediator,<br />
was able to release biologically significant concentrations of P (up to 0.027 mg L -1 ) to<br />
solution at Eh values between 0 and -200 mV. Total soluble P increases were strongly related<br />
to soluble Fe(II) increases over time.<br />
4. Conclusions<br />
The observed relationship between Eh, Fe(II) and solubilized P during the incubation,<br />
suggests that P solubilization from microbial reduction of Fe(III) oxyhydroxides, catalyzed by<br />
native HA, can occur in intermittently wet pasture soils. These processes would exist even if<br />
the natural system was dominated by oxidizing conditions, so long as seasonal Eh values<br />
fluctuate near -200 mV for a sufficient duration. The soils used in this experiment were not<br />
collected from the lowest point on the landscape, which further suggests that this is an<br />
important P cycling process in grassland soils.<br />
Acknowledgements<br />
Dr. Nov<strong>ru</strong>z Akhmedov of the West Virginia University (WVU) NMR Facility helped to<br />
acquire and interpret the NMR spectra; Liviu Magean of the WVU Chemical Engineering<br />
department helped acquire FT-IR spectra. This research was funded by the USDA-ARS and<br />
funds appropriated under the Hatch Act.<br />
References<br />
1. T. Peretyazhko and G. Sposito, 2005, Geochim.Cosmochim. Acta, 69, pp. 3643–3652.<br />
2. N. Chacon, W.L. Silver, E.A. Dubinsky, and D.F. Cusack, 2006, Biogeochemistry, 78, pp 67–84.<br />
3. R.S. Swift, 1996, Methods of Soil Analysis Part 3, D.L. Sparks, Soil Science Society of America,<br />
Madison, WI pp. 1011–1069.<br />
4. D.R. Lovely and E.J.P. Phillips, 1987, Appl.Environ. Microbiol., 53, pp. 1536–1540.<br />
<strong>Vol</strong>. 2 Page - 377 -
15th IHSS Meeting- <strong>Vol</strong>. 2<br />
<strong>Humus</strong> System of Alluvial Soils in Different Land-Use Systems<br />
Toma Shishkov, Ekaterina Filcheva<br />
Department of Genesis, Geography and Classification of Soils; Institute of Soil Science<br />
Nikola Poushkarov, 7 Shosse Bankya Str., 1369, 1080 Sofia, Bulgaria<br />
E-mail: toma_shishkov@yahoo.com; filcheva@itp.bg<br />
1. Introduction<br />
Soil organic carbon content was determined by modified Turin’s method (Kononova, 1966;<br />
Filcheva & Tsadilas, 2002) (dichromate digestion at 125 o C, 45 min, in presence of Ag 2 SO 4<br />
and (NH 4 ) 2 SO 4 · FeSO 4 6H 2 O titration, phenylanthranilic acid as indicator). Soil organic<br />
matter composition was determined by the method of Kononova-Belchikova (Kononova,<br />
1966; Filcheva & Tsadilas, 2002).<br />
2. Results and Discussion<br />
The Eutric Fluvisol (FAO Legend); Typic Xerofluvent (Soil Taxonomy), is situated in Thrace<br />
plain, Plovdiv district, village Tsalapitsa (with location N 42 o 10.794’ and E 24 o 32.452’).<br />
Alluvial soils are with homogeneous distribution of carbon up to 160 cm depth, analysis data<br />
are shown in Table 1. Soils are characterized with non-differentiated profile. According to the<br />
texture data soils are loamy sand.<br />
It is seen that the surface horizons can be determined as with very low (0.6%, Profile 1, 2) to<br />
low (1.2%, Profile 4), and medium (2.45%, Profile 5) amount of carbon, and the subsurface<br />
horizons is of very low 0.37–0.6% to low 1.6% (Profile 5) amount of carbon. In the soil under<br />
acacia grove the amount is very high 11.27% at the horizon 0–2 cm below loose leaves and<br />
debris. In all soils amount of carbon decreases is gradual down the profiles, but it is about one<br />
and a half times less as compared to that in the surface horizons.<br />
The amount of extractable organic carbon (extracted with 0.1M Na 4 P 2 O 7 +0.1M NaOH) in the<br />
surface horizons of the virgin soils varies between 25% (Profile 5) and 49% (Profile 4) from<br />
the total organic carbon, while in the subsurface horizons that amount is respectively 16% and<br />
84%. This difference shows that the organic matter in Profile 5 is much stronger bounded due<br />
to the carbonates. Humic acids in Profile 4 are young (E 4 /E 6 >3.4), the degree of humification<br />
is low to very high 24–43 %, which varies within the stratification of layers. In Profile 3 the<br />
amount of extractable carbon is 28–31% at the surface and 48-58% deeper; in Profile 2 the<br />
amount is 43% at the surface and 49% deeper; and in Profile 1 the amount is 35% at the<br />
surface and over 30% deeper. The degree of humification is low to medium. This fact can be<br />
<strong>Vol</strong>. 2 Page - 378 -
15th IHSS Meeting- <strong>Vol</strong>. 2<br />
explained with the different values of the derived amount of humic acids of dry soil matter,<br />
which is: 0.07–0.17% (Profile1), being insignificant compared to the others.<br />
Despite the different land-use system (arable, bare land or acacia grove) the humic acids are<br />
relatively young, low condenzed (E 4 /E 6 > 3.4).<br />
Ratio C ha /C fa varies from 3, which determine humus to be of humic type (Profile 1, 2),<br />
according to the classification of Orlov and Grishina (Orlov, 1985). And it is fulvic-humic<br />
type (1.0-1.8) in Profiles 3, 4, 5. There is sharp change of the ratio C ha /C fa (from 3 to 1.4) at<br />
the depth of 24 cm in the Profile 1, 2. Such sharp change of humus type at the depth (change<br />
from humic to fulvic-humic type) is evidence of historical change of pedoformation (Petrova,<br />
1994). In Profile 4 humus type is stable through the profile, which is evidence of relatively<br />
stable ambient environment during the soil formation. In Profile 3 (AC 1 horizon and A) the<br />
ratio of 0.5 determines humus to be of fulvic type. Ratio C ha /C fa in Profile 5, changes from<br />
fulvic-humic to humic below 16 cm depth due to the carbonates.<br />
Profile 1 performs 100% “free” or R 2 O 3 complexed humic acids in the surface horizon and<br />
100% of humic acids Ca-complexed deeper. In Profile 2 humic acids are 100% bound with<br />
calcium, forming insoluble microst<strong>ru</strong>cture fragments. In Profile 3, 61% of humic acids in the<br />
layer below loose leaves and debris (0-2 cm) are “free” or R 2 O 3 complexed, deeper are 100%<br />
Ca-complexed. In Profile 4 and 5 at the sod (0-6 cm) 40% of humic acids are “free” or R 2 O 3<br />
complexed, deeper are 100% Ca-complexed.<br />
The unexrtactable organic carbon of 70% and more (Profile 5) is bound strongly not only as<br />
organic-clay compounds in soils after Kononova, 1966, but as well as CaCO 3 humate mixed<br />
sediments (Shishkov & Petrova, 2001).<br />
3. Conclusion<br />
Type of humus Types in soils under the different land-use system is different: humic in arable<br />
soils, and fulvic-humic in virgin soils and under the acacia grove. The degree of humification<br />
is low and medium in the old virgin alluvial soil. Humic acids in the upper horizons are<br />
bounded with Ca in arable soils; and with Fe and Al oxides in the other soils. Organic carbon<br />
in soils with alluvial properties is more mobile and easy extractable; humic acids are<br />
relatively young, low condensed (E 4 /E 6 > 3.4). Change of humus type is the evidence of<br />
historical change of pedoformation.<br />
<strong>Vol</strong>. 2 Page - 379 -
15th IHSS Meeting- <strong>Vol</strong>. 2<br />
Table 1: Organic matter content and composition of soils with different land-use system, from the<br />
alluvial Maritsa river terraces, Southern Bulgaria<br />
Horizon<br />
and<br />
depth in<br />
сm C,<br />
% C ext<br />
Organic carbon, (%) Organic carbon, %<br />
Extracted with 0.1M<br />
Na 4 P 2 O 7 +0.1M NaOH<br />
Humic acids<br />
fractions<br />
Hu- Fulvic<br />
C h /C f<br />
Ca<br />
mic<br />
comp-<br />
acids acids<br />
Lexed<br />
“free”<br />
and<br />
R 2 O 3<br />
compl.<br />
Unextr<br />
acted<br />
organic<br />
C,<br />
(%)<br />
Extracted<br />
with<br />
0.1N<br />
H 2 SO 4,<br />
(%)<br />
Optic<br />
charact.<br />
(E 4 /E 6 )<br />
0.15<br />
0.20<br />
1.94<br />
Profile 1, Maritsa river old alluvial terrace, bare land, Eutric Fluvisol (FAO Legend);<br />
Typic Xerofluvent (Soil Taxonomy)<br />
Аp 1 0.57 0.20 а<br />
0.05 3.0 100.00 c 0.00 0.37 0.02 - -<br />
0–12<br />
35.09 б 26.32 8.77<br />
64.91 3.50<br />
Аp 2 0.38 0.17 0.17 0.00 - 0.00 100 0.21 0.03 - -<br />
12–17<br />
44.74 44.74<br />
55.26 7.89<br />
А 0.40 0.17 0.13 0.04 3.25 0.00 100 0.23 0.03 - -<br />
17–24<br />
42.50 32.50 10.00<br />
57.50 7.50<br />
AC 1 0.37 0.15 0.09 0.06 1.50 0.00 100 0.22 0.02 - -<br />
24–40<br />
40.54 24.32 16.22<br />
59.46 5.41<br />
AC 2 0.30 0.11 0.07 0.04 1.75 - - 0.19 0.04 - -<br />
40–58<br />
36.67 23.33 13.33<br />
63.33 13.33<br />
AC 3 0.28 0.10 0.10 0.00 - 0.00 100 0.18 0.02 - -<br />
58–77<br />
35.71 35.71<br />
64.29 7.14<br />
C 1 0.16 0.06 - 0.06 - 0.00 100 0.10 0.05 - -<br />
77–102<br />
37.50<br />
37.50<br />
62.50 31.25<br />
C 2 0.13 0.04 - 0.04 - 0.00 100 0.09 0.01 - -<br />
102–140<br />
30.77<br />
30.77<br />
69.23 7.69<br />
Profile 2, Maritsa river alluvial plain, arable land, Eutric Fluvisol (FAO Legend); Typic Xerofluvent (Soil Taxonomy)<br />
Аp 0.60 0.26 а<br />
0.06 3.33 0.00 100 0.34 0.02 4.36 -<br />
0–30<br />
43.33 б 33.33 10.00<br />
56.67 3.33<br />
А 1 0.63 0.31 0.18 0.13 1.38 0.00 100 0.32 0.04 3.57 -<br />
30–35<br />
49.21 28.57 20.63<br />
50.79 6.35<br />
AC 1 0.56 0.19 0.16 0.03 5.33 0.00 100 0.37 0.04 3.45 -<br />
35–52<br />
33.93 28.57 5.36<br />
66.07 7.41<br />
AC 2 52– 0.50 - - - - - - - - - -<br />
72<br />
C 1 72–90 0.36 - - - - - - - - - -<br />
C 2 90– 0.31 - - - - - - - - - -<br />
120<br />
Profile 3, Maritsa river alluvial plain, acacia grove, Eutric Fluvisol (FAO Legend); Typic Xerofluvent (Soil Taxonomy)<br />
Аh 1 11.27 3.20 а<br />
1.26 1.54 1.19 0.75 8.07 0.12 6.65 6.6<br />
0–2<br />
28.39 б 17.21 11.80<br />
61.34 38.66 56.67 1.06<br />
Аh 2 1.50 0.47 0.24 0.23 1.04 0.00 100 1.03 0.05 3.99 2.4<br />
2–8<br />
31.33 16.00 15.33<br />
68.67 3.33<br />
А 0.64 0.31 0.11 0.20 0.55 0.00 100 0.33 0.04 3.38 -<br />
8–17<br />
48.44 17.19 31.25<br />
51.56 6.25<br />
AC 1 0.51 0.30 0.10 0.20 0.50 0.00 100 0.21 0.04 3.44 -<br />
17–30<br />
58.82 19.61 39.22<br />
71.18 7.84<br />
AC 2 30– 0.40 - - - - - - - - - -<br />
56<br />
AC 3 56– 0.32 - - - - - - - - - -<br />
82<br />
C 1 82–<br />
108<br />
0.30 - - - - - - - - - -<br />
Total<br />
C h<br />
Fre<br />
e<br />
C h<br />
<strong>Vol</strong>. 2 Page - 380 -
15th IHSS Meeting- <strong>Vol</strong>. 2<br />
0.29<br />
0.40<br />
Profile 4 , Maritsa river alluvial plain, old alluvial terrace, virgin land, Eutric Fluvisol (FAO Legend);<br />
Typic Xerofluvent (Soil Taxonomy)<br />
Аh 1.20 0.59 а<br />
0.30 0.97 0.12 0.17 0.61 0.06 5.13 8.5<br />
0–5<br />
49.17 б 24.17 25.00<br />
42.38 58.62 50.83 5.00<br />
А 1 0.51 0.43 0.22 0.21 1.05 0.00 100 0.08 0.04 4.92 -<br />
5–17<br />
84.31 43.14 41.18<br />
15.69 7.84<br />
А 2 0.96 0.25 0.11 0.14 0.79 0.00 100 0.35 0.03 4.81 -<br />
17–30<br />
41.67 18.33 23.33<br />
58.33 5.00<br />
AC 1 0.55 0.22 0.13 0.09 1.44 0.00 100 0.33 0.02 4.47 -<br />
30–45<br />
40.00 23.64 16.36<br />
60.00 3.64<br />
AC 2 0.51 0.18 0.11 0.07 1.57 0.00 - 0.33 0.02 5.00 -<br />
45–56<br />
35.29 21.57 13.73<br />
64.71 3.92<br />
AC 3 0.36 0.11 0.09 0.02 4.5 0.00 100 0.25 0.02 5.85 -<br />
56–73<br />
30.56 25.00 5.56<br />
69.44 5.56<br />
C 1 0.33 0.14 - 0.14 - 0.00 0.00 0.19 0.02 - -<br />
73–90<br />
42.42<br />
42.42<br />
57.58 6.06<br />
C 2 0.26 0.10 - 0.10 - 0.00 0.00 0.16 0.02 - -<br />
90–120<br />
38.46<br />
38.46<br />
61.54 7.69<br />
Profile 5, Maritsa river contemporary alluvial terrace, 60cm ground water level , virgin land,<br />
Calcaric Fluvisol (FAO Legend); Aquic Calcixerept (Soil Taxonomy)<br />
Аh 1 2.45 0.62 а<br />
0.22 1.82 1.16 0.24 1.83 0.08 4.07 2.6<br />
0–6<br />
25.31 б 16.33 8.58<br />
40.00 60.00 74.69 3.27<br />
Аh 2 1.61 0.27 0.17 0.10 1.70 0.00 100 1.34 0.06 3.98 2.4<br />
6–16<br />
16.67 10.56 6.21<br />
83.23 3.73<br />
AC 0.88 0.25 0.22 0.03 7.33 0.00 100 0.63 0.04 3.41 -<br />
16–23<br />
28.41 25.00 3.41<br />
71.59 4.55<br />
C 1 23–32 0.20 - - - - - - - - - -<br />
C 2 32–48 0.18 - - - - - - - - - -<br />
C 3 48–57 0.06 - - - - - - - - - -<br />
C 4 57–74 0.09 - - - - - - - - - -<br />
a – % of dry matter; b - % of total carbon; c – of total humic acids; C h – humic acids; C f – fulvic acids; optic<br />
characteristic (E 4 /E 6 ).<br />
Horizon<br />
Organic carbon, (%) Organic carbon, %<br />
and<br />
Extracted with 0.1M<br />
Humic acids<br />
depth in<br />
Na 4 P 2 O 7 +0.1M NaOH<br />
fractions<br />
сm C,<br />
Hu- Fulvic<br />
and comp-<br />
C h /C f “free” Ca<br />
% C ext mic<br />
acids acids<br />
R 2 O 3 Lexed<br />
compl.<br />
Аp 1<br />
0–12<br />
Аp 2<br />
12–17<br />
А<br />
17–24<br />
AC 1<br />
24–40<br />
AC 2<br />
40–58<br />
AC 3<br />
58–77<br />
C 1<br />
77–102<br />
C 2<br />
102–140<br />
Unextr<br />
acted<br />
organic<br />
C,<br />
(%)<br />
Extracted<br />
with<br />
0.1N<br />
H 2 SO 4,<br />
(%)<br />
0.15<br />
Profile 1, Maritsa river old alluvial terrace, bare land, Eutric Fluvisol (FAO Legend);<br />
Typic Xerofluvent (Soil Taxonomy)<br />
0.57 0.20 а<br />
0.05 3.0 100.00 c 0.00 0.37 0.02<br />
35.09 б 26.32 8.77<br />
64.91 3.50<br />
0.38 0.17 0.17 0.00 - 0.00 100 0.21 0.03<br />
44.74 44.74<br />
55.26 7.89<br />
0.40 0.17 0.13 0.04 3.25 0.00 100 0.23 0.03<br />
42.50 32.50 10.00<br />
57.50 7.50<br />
0.37 0.15 0.09 0.06 1.50 0.00 100 0.22 0.02<br />
40.54 24.32 16.22<br />
59.46 5.41<br />
0.30 0.11 0.07 0.04 1.75 - - 0.19 0.04<br />
36.67 23.33 13.33<br />
63.33 13.33<br />
0.28 0.10 0.10 0.00 - 0.00 100 0.18 0.02<br />
35.71 35.71<br />
64.29 7.14<br />
0.16 0.06 - 0.06 - 0.00 100 0.10 0.05<br />
37.50<br />
37.50<br />
62.50 31.25<br />
0.13 0.04 - 0.04 - 0.00 100 0.09 0.01<br />
30.77<br />
30.77<br />
69.23 7.69<br />
Optic<br />
charact.<br />
(E 4 /E 6 )<br />
Total<br />
C h<br />
Free<br />
C h<br />
- -<br />
- -<br />
- -<br />
- -<br />
- -<br />
- -<br />
- -<br />
- -<br />
<strong>Vol</strong>. 2 Page - 381 -
15th IHSS Meeting- <strong>Vol</strong>. 2<br />
0.20<br />
1.94<br />
0.29<br />
0.40<br />
Profile 2, Maritsa river alluvial plain, arable land, Eutric Fluvisol (FAO Legend); Typic Xerofluvent (Soil Taxonomy)<br />
Аp 0.60 0.26 а<br />
0.06 3.33 0.00 100 0.34 0.02 4.36 -<br />
0–30<br />
43.33 б 33.33 10.00<br />
56.67 3.33<br />
А 1 0.63 0.31 0.18 0.13 1.38 0.00 100 0.32 0.04 3.57 -<br />
30–35<br />
49.21 28.57 20.63<br />
50.79 6.35<br />
AC 1 0.56 0.19 0.16 0.03 5.33 0.00 100 0.37 0.04 3.45 -<br />
35–52<br />
33.93 28.57 5.36<br />
66.07 7.41<br />
AC 2 52–72 0.50 - - - - - - - - - -<br />
C 1 72–90 0.36 - - - - - - - - - -<br />
C 2 90– 0.31 - - - - - - - - - -<br />
120<br />
Profile 3, Maritsa river alluvial plain, acacia grove, Eutric Fluvisol (FAO Legend); Typic Xerofluvent (Soil Taxonomy)<br />
Аh 1 11.27 3.20 а<br />
1.26 1.54 1.19 0.75 8.07 0.12 6.65 6.6<br />
0–2<br />
28.39 б 17.21 11.80<br />
61.34 38.66 56.67 1.06<br />
Аh 2 1.50 0.47 0.24 0.23 1.04 0.00 100 1.03 0.05 3.99 2.4<br />
2–8<br />
31.33 16.00 15.33<br />
68.67 3.33<br />
А 0.64 0.31 0.11 0.20 0.55 0.00 100 0.33 0.04 3.38 -<br />
8–17<br />
48.44 17.19 31.25<br />
51.56 6.25<br />
AC 1 0.51 0.30 0.10 0.20 0.50 0.00 100 0.21 0.04 3.44 -<br />
17–30<br />
58.82 19.61 39.22<br />
71.18 7.84<br />
AC 2 30–56 0.40 - - - - - - - - - -<br />
AC 3 56–82 0.32 - - - - - - - - - -<br />
C 1 82–108 0.30 - - - - - - - - - -<br />
Profile 4 , Maritsa river alluvial plain, old alluvial terrace, virgin land, Eutric Fluvisol (FAO Legend);<br />
Typic Xerofluvent (Soil Taxonomy)<br />
Аh 1.20 0.59 а<br />
0.30 0.97 0.12 0.17 0.61 0.06 5.13 8.5<br />
0–5<br />
49.17 б 24.17 25.00<br />
42.38 58.62 50.83 5.00<br />
А 1 0.51 0.43 0.22 0.21 1.05 0.00 100 0.08 0.04 4.92 -<br />
5–17<br />
84.31 43.14 41.18<br />
15.69 7.84<br />
А 2 0.96 0.25 0.11 0.14 0.79 0.00 100 0.35 0.03 4.81 -<br />
17–30<br />
41.67 18.33 23.33<br />
58.33 5.00<br />
AC 1 0.55 0.22 0.13 0.09 1.44 0.00 100 0.33 0.02 4.47 -<br />
30–45<br />
40.00 23.64 16.36<br />
60.00 3.64<br />
AC 2 0.51 0.18 0.11 0.07 1.57 0.00 - 0.33 0.02 5.00 -<br />
45–56<br />
35.29 21.57 13.73<br />
64.71 3.92<br />
AC 3 0.36 0.11 0.09 0.02 4.5 0.00 100 0.25 0.02 5.85 -<br />
56–73<br />
30.56 25.00 5.56<br />
69.44 5.56<br />
C 1 0.33 0.14 - 0.14 - 0.00 0.00 0.19 0.02 - -<br />
73–90<br />
42.42<br />
42.42<br />
57.58 6.06<br />
C 2 0.26 0.10 - 0.10 - 0.00 0.00 0.16 0.02 - -<br />
90–120<br />
38.46<br />
38.46<br />
61.54 7.69<br />
Profile 5, Maritsa river contemporary alluvial terrace, 60cm ground water level , virgin land,<br />
Calcaric Fluvisol (FAO Legend); Aquic Calcixerept (Soil Taxonomy)<br />
Аh 1 2.45 0.62 а<br />
0.22 1.82 1.16 0.24 1.83 0.08 4.07 2.6<br />
0–6<br />
25.31 б 16.33 8.58<br />
40.00 60.00 74.69 3.27<br />
Аh 2 1.61 0.27 0.17 0.10 1.70 0.00 100 1.34 0.06 3.98 2.4<br />
6–16<br />
16.67 10.56 6.21<br />
83.23 3.73<br />
AC 0.88 0.25 0.22 0.03 7.33 0.00 100 0.63 0.04 3.41 -<br />
16–23<br />
28.41 25.00 3.41<br />
71.59 4.55<br />
C 1 23–32 0.20 - - - - - - - - - -<br />
C 2 32–48 0.18 - - - - - - - - - -<br />
C 3 48–57 0.06 - - - - - - - - - -<br />
C 4 57–74 0.09 - - - - - - - - - -<br />
<strong>Vol</strong>. 2 Page - 382 -
15th IHSS Meeting- <strong>Vol</strong>. 2<br />
References<br />
1. Petrova L., 1994. Content and distribution of humus acids as a diagnostic characteristic of soil.<br />
Soil Science, Agrochemistry and Ecology, No. 4–6, Sofia, p. 98–100.<br />
2. Shishkov T., L.Petrova, 2001. Characteristic of humus systems of soils from the biosphere reserve<br />
Srebarna. Soil Sci, Agrochemistry and Ecology, 36 No. 4–6, Sofia, p. 53-55.<br />
3. Filcheva E, C. Tsadilas, 2002. Influence of Cliniptilolite and Compost on Soil Properties.<br />
Commun. Soil Sci. Plant Anal., 33, 3–4, 595-607.<br />
4. Kononova M., 1966. Soil Organic matter. 2nd ed. Pergamon press, Inc., M. V., 544 p.<br />
5. Orlov S., 1985. Soil Chemistry. MU, Moscow, 376 p. (Ru)<br />
<strong>Vol</strong>. 2 Page - 383 -
15th IHSS Meeting- <strong>Vol</strong>. 2<br />
Organic Matter Fractions in Semiarid Biological Soil C<strong>ru</strong>sts – Organo-<br />
Mineral Interactions Patterns as Indicators of the Progressive<br />
Humification Stages<br />
Miralles, I. a *, Ortega, R. a , Chamizo, S. b , Cantón, Y. c , van Wesemael, B. a ,<br />
Domingo, F. b , Almendros G. d<br />
a Université Catholique de Louvain, Place Pasteur, 3, 1348, Louvain-La-Neuve, Belgium;<br />
b Estación Experimental de Zonas Áridas (CSIC) General Segura, 1, 04001 Almería, Spain;<br />
c Universidad de Almería, Ctra. Sacramento s/n, 04120, La Cañada de San Urbano, Almería,<br />
Spain; d Centro de Ciencias Medioambientales (CSIC), Serrano 115 B, 28006 Madrid, Spain.<br />
E-mail: isa@eeza.csic.es<br />
1. Introduction<br />
Biological soil c<strong>ru</strong>sts (BSCs) are associations of soil particles with communities of algae,<br />
microfungi, cyanobacteria, liverworts, bryophytes and lichens. C<strong>ru</strong>sts occupy a wide<br />
extension of arid and semiarid ecosystems, and often represent the only significant carbon<br />
sink in such environments [1, 2]. However, despite the outstanding role of BSCs in carbon<br />
sequestration, little is known about their humification processes. The BSCs are associations<br />
derived from specific biomacromolecules produced by lignin-lacking organisms such as<br />
lichens, mosses or cyanobacteria, which in most of the species are only described in the<br />
scientific literature in very general terms. Several authors [3–6] have shown that the role of<br />
BSCs in C sequestration may be affected by natural disturbances as global warming and<br />
erosion processes increasing the loss of C due to microbiotic soil respiration and <strong>ru</strong>noff.<br />
Assuming the above considerations, the aim of this study will be analyzing the factors<br />
affecting the accumulation patterns of humic substances in different types of calcimorphic<br />
BSCs and underlying soils in two semiarid ecosystems to obtain preliminary information<br />
about quality indicators of the humic matter.<br />
2. Materials and Methods<br />
Two semiarid ecosystems with well-represented BSCs were selected: “El Cautivo” (CAU)<br />
and “Balsa Blanca” (BB), in Almería (SE Spain). El Cautivo (Tabernas) is a badlands area<br />
with very incipient soils. Geological materials are calcic-gypsiferous mudstone and marls, and<br />
the climate is semiarid Thermo-Mediterranean. Balsa Blanca (Cabo de Gata Natural Park,<br />
Almería) is a representative coastal-steppe ecosystem. Slope degree was measured with a<br />
clinometer. Runoff samples were collected on the different BSCs regularly during rainfall<br />
simulations, and sediments in <strong>ru</strong>noff were measured later in laboratory.<br />
<strong>Vol</strong>. 2 Page - 384 -
15th IHSS Meeting- <strong>Vol</strong>. 2<br />
Standard methods [7, 8] were used for extraction and quantification of the different humus<br />
fractions: free organic matter (FOM), H 3 PO 4 -extractable fulvic fraction, fulvic acid (FA),<br />
humic acid (HA) and humin (HUM). Humic acid was isolated precipitating the total humic<br />
extract, then purified by high-speed centrifugation at 43500 g. Derivative and/or resolutionenhanced<br />
visible spectra were obtained [9].<br />
3. Results and Discussion<br />
Topographical, lithological and climatic characteristics play an outstanding role in the<br />
accumulation patterns of the humus fractions in CAU and BB. In CAU, the steep slopes and<br />
the significant erosion processes (Table 1) limit the development of the soil. The intense solar<br />
irradiation and high carbonate content in CAU (Table 1) might be playing a controlling role in<br />
organic matter biodegradation [9]. In contrast, in BB site the soil development could be<br />
favored by the comparatively flat slopes (Table 1), the more developed vegetation and the<br />
higher moisture (marine influence, dew and fogs). In consequence, the organic matter in CAU<br />
c<strong>ru</strong>sts clearly differs from BB (Fig. 1), with lower total organic C content, consisting mainly<br />
of the least recalcitrant fractions (H 3 PO 4 -FA + FA). This suggests physical retention of<br />
particulate fractions in calcium saturated medium and insolubilization of low molecular<br />
weight precursors of FAs and HAs otherwise subjected to biodegradation and/or leaching<br />
[8,9]. The low inputs of organic matter from the very sparse adjacent vegetation, the weak<br />
st<strong>ru</strong>cture typical of these soils and the intense desiccation due to very high temperatures and<br />
low humidity characteristic in this ecosystem [10] could contribute to a rapid biogeochemical<br />
cycle (very low FOM content, Fig. 1) which would transform plant residues in soil. Moreover,<br />
the exportation of organic components is exacerbated by the steep topography and high <strong>ru</strong>noff<br />
and erosion rates in this ecosystem.<br />
This scenario contrasts with those at BB, with greater FOM content (Fig. 1). In these<br />
ecosystems the C accumulation patterns could be carried out through the retention of humic<br />
substances of high molecular weight. Increased accumulation of HA and the HA/FA ratio<br />
(Fig. 1) indicated high maturity in the soil under BSCs, where the comparatively high soil<br />
moisture of this ecosystem could contribute to the preservation of plant biomacromolecules<br />
throughout the year [11]. The spectroscopic data in the visible range (not shown) also indicate<br />
complex humification mechanisms leading to higher HA maturation in BB (higher E 4 ,<br />
perylenequinone bands, lower E 4 /E 6 ratio).<br />
On the other hand, Fig. 1 shows differences in the quantitative distribution of the total soil C<br />
into the different organic matter fractions when comparing BSCs and underlying soil in BB,<br />
<strong>Vol</strong>. 2 Page - 385 -
15th IHSS Meeting- <strong>Vol</strong>. 2<br />
where HA increased in amount, and FA and humin decreased from the BSC to the underlying<br />
soil. In contrast, in CAU little differences were observed between concentrations of the humus<br />
fractions when comparing BSCs and underlying soil. This agrees with the idea of more<br />
evolved soils in BB, where different soil horizons can be observed. In contrast, in CAU no<br />
vertical differentiation in soil properties has been yet achieved, as it would correspond to a<br />
much less developed soil.<br />
Table 1: Topographical and physico-chemical characteristics of c<strong>ru</strong>sts and soils in Balsa Blanca (BB)<br />
and El Cautivo (CAU)<br />
Slope TOC1 TOC2 Sand Silt Clay<br />
2-<br />
CO 3 pH Erosion rate<br />
Cyanob. BB 8.0 21.2 17.6 583 304 112 126 8.0 3.0<br />
Lichen BB 9.0 35.1 13.6 594 328 78 116 8.0 0.4<br />
Moss BB 9.0 38.9 18.2 579 319 102 138 8.1 0.8<br />
Incipient CAU 17.0 14.3 9.6 342 526 131 247 8.0 170.6<br />
Cyanob. CAU 12.0 15.2 11.9 199 615 186 294 7.6 18.7<br />
Lichen CAU 25.0 33.1 7.4 232 609 158 295 7.3 13.8<br />
Cyanob.: Cyanobacteria; TOC1: Total organic C in BSCs (g kg -1 ); TOC2: Total organic C in soil under BSCs (g<br />
kg -1 ); Sand; Silt; Clay (g kg -1 ); CO 2- 3 (g kg -1 ); Erosion rate (g m -2 )<br />
a)<br />
100%<br />
BALSA BLANCA<br />
EL CAUTIVO<br />
75%<br />
50%<br />
25%<br />
0%<br />
M<br />
L C<br />
C IC L<br />
E4 1.8 1.4 1.2<br />
1.3 0.9 0.5<br />
NON-EXTRACTABLE<br />
HUMIN<br />
HUMIC ACID<br />
FULVIC ACID<br />
H3PO4-FULVIC ACID<br />
FREE ORGANIC MATTER<br />
b)<br />
100%<br />
75%<br />
50%<br />
BALSA BLANCA<br />
EL CAUTIVO<br />
NON-EXTRACTABLE<br />
HUMIN<br />
HUMIC ACID<br />
25%<br />
FULVIC ACID<br />
0%<br />
L<br />
C M<br />
C L IC<br />
E4 2.1 1.6 1.3<br />
1.5 1.0 0.9<br />
H3PO4-FULVIC ACID<br />
Figure 1: Quantitative distribution of the total soil C into different organic matter fractions: a) BSCs;<br />
b) soil under BSCs; M: moss; L: lichen, C: cyanobacteria; IC: incipient cyanobacteria, E 4 : optical<br />
density of the humic acid fraction<br />
<strong>Vol</strong>. 2 Page - 386 -
15th IHSS Meeting- <strong>Vol</strong>. 2<br />
4. Conclusions<br />
Soil organic matter quality in the studied ecosystems could be defined in terms of increased<br />
organo-mineral interactions, with patterns associated to the E 4 values of the HAs. However,<br />
such quality depended on the BSC type: whereas in poorly developed BSCs the progressive<br />
humification is accompanied by increased complexity of the organic colloidal fractions (i.e.,<br />
the original BSC ‘humin’ still consisting of particulate necromass), in the comparatively more<br />
transformed BSCs the incipient clay humus-complex is suggested by the higher HA/FA ratio<br />
but mainly by the substantial differences between the distribution of the organic C in the<br />
BSCs as regards that in the underlying soils.<br />
Acknowledgements<br />
The authors wish to acknowledge to projects COSTRAS (Ref. RNM-3614), GEOCARBO<br />
(Ref. RNM-3721) and CGL2008-04296 for financial support.<br />
References<br />
1. E. Zaady, U. Kuhn, B. Wilske, L. Sandoval-Soto, and J. Kesselmeier, Soil Biol. Biochem. 32<br />
(2000), 959–966.<br />
2. J. Belnap, B. Büdel, and O.L. Lange, in J. Belnap, and O.L. Lange (eds.), Biological Soil C<strong>ru</strong>sts:<br />
St<strong>ru</strong>cture, Function and Management. Springer, Berlin, 2003, pp. 3–30.<br />
3. P.M. Cox, R.A. Betts, C.D. Jones, S.A. Spall I.J., and I.J. Toterdell, Nature. 408 (2000), 184–187.<br />
4. J.T. Houghton, Y. Ding, D.J. Griggs, M. Noguer, P.J. van der Linden, and D. Xiaosu, Climate<br />
Change 2001: The Scientific Basis. Cambridge University Press, Cambridge, 2001.<br />
5. O.L. Lange, and T.G.A. Green Oecologia 142 (2005), 11–19.<br />
6. N.G. Fierer, and E.J. Gabet, J. Environ. Qual. 31 (2002), 1207–1213.<br />
7. B. Dabin, Science du Sol, 2 (1979), 15–24.<br />
8. P. Duchaufour, and F. Jacquin, Bull. AFES, 1 (1975), 29–36.<br />
9. I. Miralles, R. Ortega, M. Sánchez-Marañón, M. Soriano, and G. Almendros, Soil Biol. Biochem. 39<br />
(2007), 2459–2470.<br />
10. Y. Cantón, A. Solé-Benet, and R. Lázaro, Geoderma. 115 (2003), 193–222.<br />
11. G. Almendros, M.C. Zancada, and M.T. Pardo, Biol Fertil. Soils. 41 (2005), 173–181.<br />
<strong>Vol</strong>. 2 Page - 387 -
15th IHSS Meeting- <strong>Vol</strong>. 2<br />
Organic Matter in Calcimorphic Biological Soil C<strong>ru</strong>sts in Semiarid<br />
Ecosystems: When Humic-Type Substances are Formed From Lignin-<br />
Lacking Terrestrial Biomass<br />
Miralles, I. a *, Ortega, R. a , Chamizo, S. b , Cantón, Y. c , van Wesemael, B. a ,<br />
Domingo, F. b , Almendros G. d<br />
a Université Catholique de Louvain, Place Pasteur, 3, 1348, Louvain-La-Neuve, Belgium;<br />
b Estación Experimental de Zonas Áridas (CSIC) General Segura, 1, 04001 Almería, Spain;<br />
c Universidad de Almería, Ctra. Sacramento s/n, 04120, La Cañada de San Urbano, Almería,<br />
Spain; d Centro de Ciencias Medioambientales (CSIC), Serrano 115 B, 28006 Madrid, Spain.<br />
E-mail: isa@eeza.csic.es<br />
1. Introduction<br />
Biological Soil C<strong>ru</strong>sts (BSCs) are formed from close association between soil particles and<br />
cyanobacteria, algae, lichens, bryophytes and microfungi, and are the dominant cover in<br />
Mediterranean arid and semiarid zones (up to 70% of its surface). In general BSCs are<br />
beneficial for ecosystems [1] as regards improving resistance to erosion, moisture retention<br />
[2–4] and availability of nutrients [5, 6]. In fact, BSCs produce polysaccharides contributing<br />
to soil aggregation [7]. Despite BSCs improve quality and resilience of soils, they are<br />
especially fragile against anthropogenic disturbances [8] (i.e., land use change) [9–13] the<br />
extent of which could be studied from biogeochemical proxies, such as the composition of the<br />
humic acids (HAs). However, humification in most semiarid BSCs have some characteristics<br />
in common with the formation of aquatic humic matter, where autochthonous biomass lacks<br />
lignin, and biodegradation-resistant humic-type substances could be formed from abiotic<br />
condensations of lipid and diagenetic alterations of carbohydrate and protein [14, 15].<br />
Consequently, and based on spectroscopic indices showing the extent to which the HA-like<br />
fractions in BSCs are similar to ‘matured’ HAs in mineral soils, this study aims to evaluate<br />
possible changes in humus quality in two BSCs subjected to different anthropogenic<br />
pressures.<br />
2. Materials and Methods<br />
Balsa Blanca (BB) and Amoladeras (AMO) are representative coastal-steppe ecosystems in<br />
Cabo de Gata Natural Park (Almería, SE Spain), lying in a flat area with similar calcimorphic<br />
substrate and climatic characteristics [16]. Landscape of BB is formed by alluvial fans<br />
deposited upon limestone bedrock with a vegetation cover more dense than in AMO and<br />
dominated by Stipa tenaccisima combined with bare soil and BSCs. This ecosystem is more<br />
<strong>Vol</strong>. 2 Page - 388 -
15th IHSS Meeting- <strong>Vol</strong>. 2<br />
degraded than BB since it has been used for farming activities including intensive grazing.<br />
Different humus fractions i.e., fulvic acid (FA), HA and humin were isolated and quantified<br />
using standard procedures [17, 18]. The isolated HA were studied by derivative and<br />
resolution-enhanced visible and infrared spectroscopies, the latter obtained by subtracting the<br />
spect<strong>ru</strong>m from a multiple of its second derivative [19].<br />
3. Results and Discussion<br />
Compared to AMO, the samples from BB showed high HA concentration and E 4 optical<br />
density (Table 1) and low E 4 /E 6 ratio [20], suggesting comparatively advanced humification<br />
stages [21, 22]. The visible spectra showed a typical pattern (peaks at 465, 570 and 620 nm)<br />
reported in fungal melanins with perylenequinone-type pigments [23], indicating fungal<br />
activity contributing to the accumulation of stable C forms in soils [24–25]. In contrast,<br />
although AMO also showed these significant melanin peaks (Table 1), differed from BB by<br />
its slightly lower content of organic matter (Table 1), possibly due to severe anthropogenic<br />
impact associated to livestock activity. The E 4 values and HA/FA ratio were lower and the<br />
E 4 /E 6 ratio higher than in BB, suggesting lower degree of humification and stability of<br />
organic matter (Table 1).<br />
Table 1: Organic carbon fractions and spectroscopic data of HAs from different BSCs types and<br />
underlying soil<br />
Peak intensity<br />
Organic matter<br />
Visible<br />
(nm) in the 2 nd<br />
BSC / soil sample TOC fractions<br />
spectroscopy<br />
deriv. spectra<br />
Biological c<strong>ru</strong>st,<br />
Balsa Blanca<br />
Soil under<br />
biological c<strong>ru</strong>st,<br />
HA FA HUM E 4 E 4 /E 6 620 570<br />
Cyanob. 21.2 0.44 1.18 1.36 1.21 3.87 0.45 0.63<br />
Lichen 35.1 0.46 0.87 1.54 1.35 3.78 0.51 0.70<br />
Moss 38.9 0.55 0.35 2.63 1.75 3.91 0.64 0.88<br />
Cyanob. 17.6 0.52 0.17 0.84 1.57 4.13 0.56 0.79<br />
Lichen 13.6 0.49 0.08 0.24 2.13 3.75 0.81 1.12<br />
Balsa Blanca Moss 18.2 0.50 0.11 0.81 1.30 4.13 0.47 0.66<br />
Cyanob. 26.9 0.23 0.31 1.58 0.81 4.48 0.25 0.37<br />
Biological c<strong>ru</strong>st,<br />
Lichen 46.8 0.53 1.08 2.72 0.81 4.36 0.26 0.37<br />
Amoladeras<br />
Soil under<br />
biological c<strong>ru</strong>st,<br />
Moss 43.0 0.31 0.28 2.69 0.92 4.48 0.29 0.93<br />
Cyanob. 9.7 0.19 0.07 0.60 1.33 4.17 0.48 0.67<br />
Lichen 13.6 0.18 0.63 0.64 1.27 4.42 0.43 0.61<br />
Amoladeras Moss 16.3 0.23 0.11 0.70 1.36 4.10 0.49 0.70<br />
TOC: Total organic C (g kg -1 ); HA: humic acid (C g 100 g soil -1 ); FA: fulvic acid (C g 100 g soil -1 ); HUM:<br />
humin (C g 100 g soil -1 ); E 4 (Optical density at 465 nm, absorption units)<br />
The resolution-enhanced IR spectra also reflected significant differences regarding maturity<br />
and quality of HAs (Fig. 1) not evident in the raw spectra. In the BB site, both the BSCs and<br />
the underlying soils presented HA with clear bands for amides (1660 and 1550 cm -1 ) and<br />
<strong>Vol</strong>. 2 Page - 389 -
15th IHSS Meeting- <strong>Vol</strong>. 2<br />
carbohydrates (bands at 1080 and 1030 cm -1 ). Nevertheless, in the BSCs, the IR of the HAlike<br />
fraction was dominated by amide, carbohydrate and alkyl constituents (2920 and 1460<br />
cm -1 ) and even in some cases the carboxyl (1720 cm -1 ) peak was extremely weak. It is clear<br />
that such patterns are different to that of soil HAs and indicates aliphatic organic matter<br />
derived from non-vascular plants and microbial metabolites. On the other side, the resolutionenhanced<br />
IR spectra (mainly in the case of HAs from soils under the BSCs) showed a typical<br />
lignin pattern consisting of bands centred mainly at 1510, 1460, 1420, 1270, 1230 and 1130<br />
cm -1 which is progressively smoothed with the progressive maturity of the HAs [26]. Also in<br />
the case of soils under the BSCs, the HAs formed in AMO are clearly less evolved than those<br />
in AMO (Fig. 1) as suggested by the lower E4 values. In fact, E4 tends to increase with<br />
progressive humification [22], and in the samples studied their values tended to be lower in<br />
the BSCs as regards the corresponding underlying soils.<br />
Figure 1: Resolution-enhanced infrared spectra of HAs (2000–700 cm -1 region) of different BSCs<br />
types and soil underlying in Balsa Blanca and Amoladeras sites, and their optical density values (E 4 )<br />
4. Conclusions<br />
The results indicate the possibility of identifying more or less advanced transformation stages<br />
of BSCs in terms of simple HA spectroscopic proxies in the visible and infrared ranges. This<br />
can be used to monitor the stability and quality of the organic matter and suggest that,<br />
compared to AMO, BSCs from BB showed high potential to maintain their properties against<br />
changes in external perturbations and natural biogeochemical activity.<br />
<strong>Vol</strong>. 2 Page - 390 -
15th IHSS Meeting- <strong>Vol</strong>. 2<br />
Acknowledgements<br />
The authors wish to acknowledge to projects COSTRAS (Ref.: RNM-3614), GEOCARBO<br />
(Ref: RNM-3721) and CGL2008-04296 for financial support.<br />
References<br />
1. J. Belnap, B. Büdel, and O.L. Lange, in J. Belnap and O.L. Lange (eds.), Biological Soil C<strong>ru</strong>sts:<br />
St<strong>ru</strong>cture, Function and Management. Springer, Berlin, 2003, pp. 3–30.<br />
2. R.W. Alexander, and A. Calvo-Cases, In: J.B. Thornes, (Ed.), Vegetation and Erosion. Wiley,<br />
Chichester, 1990, pp. 385–398.<br />
3. O. Malam Issa, J. Trichet, C. Defarge, A. Coute, and C. Valentin, Catena. 37 (1999), 175–196.<br />
4. Y. Cantón, G. Del Barrio, A. Solé-Benet, and R. Lázaro, Catena. 55 (2004), 341–365.<br />
5. K.T. Harper, and J. Belnap, J Arid Environ. 47 (2001), 347–357.<br />
6. L.L. St Clair, and J.R. Johansen, Great Basin Naturalist. 53 (1993), 1–4.<br />
7. Y. Cantón, A. Solé-Benet, and R. Lázaro, Geoderma. 115 (2003), 193–222.<br />
8. R. Lázaro, Y. Cantón, A. Solé-Benet, J. Bevan, R. Alexander, L.G. Sancho, and J. Puigdefábregas,<br />
Geomorphology. 102 (2008), 252–266.<br />
9. A. Golchin, P. Clarke, J.M. Oades, and J.O. Skjemstad, Aust J Soil Res. 33 (1995), 975–993.<br />
10. D. Solomon, J. Lehmann, and W. Zech, Agric. Ecosys Environ. 78 (2000), 203–213<br />
11. D.S. Mendhama, N.J. Mathersb, A.M. O’Connella, T.S. Grovea, and P.G. Saffigna, Soil Biol<br />
Biochem. 34 (2002), 1669–1673<br />
12. I. Miralles, R. Ortega, M. Sánchez-Marañón, M. Soriano, and G. Almendros, Soil Biol Biochem.<br />
39 (2007), 2459–2470.<br />
13. I. Miralles, R. Ortega, G. Almendros, M. Sánchez-Marañón, and M. Soriano, Geoderma. 150<br />
(2009), 120–128.<br />
14. C. Huc, B. Durand, and F. Jacquin, Bull. E.N.S.A.I.A (16), 1/2 (1974), 59–75.<br />
15. G.R. Harvey and D.A. Boran, In R.G. Aiken, D.M. Mcknight, R.L. Wershaw, P. MacCarthy<br />
(eds.), Humic Substances in Soil; Sediment and Water. 1985, pp. 233–247.<br />
16. V. Aranda, and_C. Oyonarte, J Arid Environ. 62 (2005), 631–647.<br />
17. B. Dabin, Science Sol. 2 (1971), 15–24.<br />
18. P. Duchaufour, and F. Jacquin, Bulletin AFES 1 (1975), 29–36.<br />
19. G. Almendros, and J. Sanz, Geoderma. 53 (1992), 79–95.<br />
20. Y. Chen, N. Senesi and M. Schnitzer, Soil Sci Soc Am J. 41 (1977), 325–358.<br />
21. S. Bravard, and D. Righi, Geoderma. 48 (1991), 151–162.<br />
22. F. J. Stevenson, <strong>Humus</strong> Chemistry: Genesis, Composition, Reactions. Wiley, New York, 1994, pp.<br />
496.<br />
23. K. Kumada, and H.M. Hurst, Nature. 214 (1967), 631–633.<br />
24. K. Kumada, and O. Sato, Soil Sci. Plant Nutr. 26 (1980), 309–316.<br />
25. G. Almendros, A. Pólo, and E. Dorado, Agrochimica. 26 (1982), 519–529.<br />
26. G. Almendros, M.C. Zancada, and M.T. Pardo, Biol Fertil Soils. 41 (2005), 173–181.<br />
<strong>Vol</strong>. 2 Page - 391 -
15th IHSS Meeting- <strong>Vol</strong>. 2<br />
Effect of Soil Type and Management on Soil Organic Matter in Olive Grove<br />
Cultivation (Organic Vs. Conventional) in a Mediterranean Semi-Arid<br />
Environment<br />
F.J. González-Vila a , V. Aranda b* , T. Verdejo a , M.J. Ayora c , A. Domínguez c , J.M. Martín-<br />
García d , J. Calero b , R. Delgado d<br />
a Instituto de Recursos Naturales y Agrobiología, CSIC, Sevilla, Spain; b Departamento de<br />
Geología, Universidad de Jaén, Spain; c Departamento de Química Física y Analítica,<br />
Universidad de Jaén, Spain; d Departamento de Edafología y Química Agrícola, Universidad<br />
de Granada, Spain<br />
E-mail: varanda@ujaen.es<br />
1. Introduction<br />
The soils of the Mediterranean region are extremely vulnerable, especially those that have<br />
been deforested or cultivated long time ago. This is especially important because one of the<br />
main environmental problems in this region is its increasing desertification. In the province of<br />
Jaén (South Spain) there is a wide deployment of conventional management in olive grove<br />
soils which has led to a widespread decline in the quality of these soils, promoting soil<br />
erosion and a rapid depletion of soil organic matter (SOM). The both economic and<br />
environmental impacts have been very important and widely recognized [1]. An alternative of<br />
special interest, to this important agroedaphic and environmental issue, is the use of<br />
environmentally sustainable agriculture practices. The characterization of SOM, especially the<br />
humic fractions, is of great interest for the impact on them has many anthropogenic factors,<br />
including conventional agriculture. This study aims to characterize, functional and<br />
compositionally, the humic acids (HA) extracted from soils varying in management<br />
(conventional, organic or undisturbed) and soil type. Necessary contribution aims to increase<br />
knowledge about the influence of organic farming in improving soil quality.<br />
2. Materials and Methods<br />
Four cultivated soils from Sª Mágina N.P. (Jaén Province) were selected: two soils with 16<br />
years of organic olive grove cultivation (colluvial limestones -H1- and marls -H5-), two soils<br />
with conventional olive grove cultivation (colluvial limestones -H7- and marls -H11-), and<br />
one soil with natural vegetation of Quercus sp. (colluvial limestones and marls mixed -SM-).<br />
The samples of HA analyzed come from the A horizons of the soils selected. One mg of the<br />
homogenized milled soil HA was mixed thoroughly with 100 mg of KBr. FTIR spectra were<br />
recorded using a Perkin-Elmer 2000 FTIR spectrometer. The resolution was set to 4 cm -1 and<br />
<strong>Vol</strong>. 2 Page - 392 -
15th IHSS Meeting- <strong>Vol</strong>. 2<br />
the operating range was 400 to 4000 cm -1 . In order to quantify the relative changes in the<br />
FTIR spectra and for spectra comparison, relative absorbances were calculated. Pyrolysis was<br />
performed using a double-shot pyrolyzer (Frontier Laboratories, model 2020) attached to a<br />
GC/MS system Agilent 6890. The sample was heated at pyrolysis temperature, 500 ºC for 1<br />
min. The identification of individual compounds was carried out by comparison with<br />
published and stored data (NIST and Wiley libraries).<br />
3. Results and Discussion<br />
The fractionation of the SOM shows a HA/FA ratio (humic acids/fulvic acids), indicative of<br />
the humification degree since it is related to the aromaticity and carbon content of the HA,<br />
that varied greatly between the samples (data not shown), although the values for samples H5<br />
and H11 are clearly lower (0.6 and 0.3, respectively), implying lower humification. The low<br />
HA/FA ratios found (mean value of 0.9) suggest that humification processes favor the<br />
insolubilization of humic precursors of low molecular weight by the presence of a media<br />
saturated in calcium [2], characteristic of a calcic substrate (common in the study area), under<br />
a environment with significant climatic limitations.<br />
Figure 1 shows the FT-IR spectra of HA samples, appreciate that samples H1 and H7 have a<br />
featureless infrared spectra, H5 and H11 with a visibly more pronounced profile, while SM<br />
would present a profile intermediate to both.<br />
Figure 1: Infrared spectra of humic acids from A horizons of the soils studied<br />
All FT-IR spectra were similar in their basic peak assignments and pattern. However, soil<br />
type and management affect to soil organic composition, and therefore, are induced changes<br />
on spectral composition of HA. In a general way, conventional management (with enhanced<br />
SOM decomposition and less plant inputs) is characterized by a higher aromaticity of HA. On<br />
<strong>Vol</strong>. 2 Page - 393 -
15th IHSS Meeting- <strong>Vol</strong>. 2<br />
the other hand, organic management and undisturbed soil (with enhanced SOM accumulation)<br />
have a higher proportion of lignin content in their HA, mainly in H1 and H5. Although the<br />
major changes, related to functional groups, are establish between colluvial limestones and<br />
marls. Accordingly, with a clear influence of soil type. This way, H1 and H7 increase their<br />
aromaticity (band at 3050 cm -1 ) and oxidized groups (carbonyl vibrations at 1720 cm -1 ); H5<br />
and H11 increase their content in amide groups (1650 cm -1 , related to amide I, and 1550 cm -1 ,<br />
assigned to amide II vibrations), and carbohydrate-like substances (c.a. 1100 cm -1 and 1030<br />
cm -1 ).<br />
Figure 2 shows the Curie-point pyrograms at 500 ºC of the HA samples, and Table 1 the main<br />
groups of pyrolysis compounds found and some ratios of interest [3, 4].<br />
Table 1: Relative abundance of the main groups of pyrolysis products<br />
Group (%) H1 H5 H7 H11 SM<br />
Polysaccharides 5.1 8.0 4.9 8.2 8.9<br />
N-bearing compounds 14.2 13.1 20.9 18.1 14.2<br />
Lignins 28.2 24.1 8.7 19.2 25.4<br />
Lipids 1.9 2.6 0.3 0.9 0.3<br />
Multi-origin aromatics 31.8 30.4 40.3 51.3 35.8<br />
Multi-origin aliphatics 1.8 10.5 0.7 2.3 0.4<br />
Terpenes 1.4 3.0 - - 0.7<br />
Syringyl/Guaiacyl (S/G) ratio 0.22 0.34 0.26 0.12 0.16<br />
Polyphenol/Lignin ratio 1.2 1.4 4.6 2.7 1.4<br />
Aromatic-C/Aliphatic-C ratio 8.9 3.1 8.7 6.7 6.7<br />
Benzene/Toluene ratio 0.3 0.3 0.3 0.2 0.3<br />
Pyrrole/Phenol ratio 0.8 0.6 0.2 0.3 0.7<br />
The Py-GC/MS pattern is more complex in the organic management (H1 and H5) and the<br />
undisturbed soil (SM) than in the conventional management (H7 and H11), also appreciate a<br />
greater richness in lignins, lipids and terpenes, and a significantly lower content in multiorigin<br />
aromatics. In samples from colluvial limestones (H1 and H7), the Aromatic-<br />
C/Aliphatic-C ratio increased (higher aromaticity), besides a higher oxidation degree, and a<br />
decrease in aliphatic-C content by degradation. Hence, these samples appear to be more<br />
transformed by the microbial activity than the samples from marls. Its composition is also<br />
characterized by a lower diversity of molecules detected by Py-GC/MS, loss of decomposable<br />
compounds of high molecular weight, and a clear reduction in polysaccharides.<br />
Samples from conventional management have higher Polyphenol/Lignin ratio (recalcitrance<br />
degree). The S/G ratio is lower (lignin more altered) and lower Benzene/Toluene ratio<br />
<strong>Vol</strong>. 2 Page - 394 -
15th IHSS Meeting- <strong>Vol</strong>. 2<br />
(humification degree) in the sample H11. Samples from organic management and undisturbed<br />
soil showed higher Pyrrole/Phenol ratio (higher extent of mineralization) as a consequence of<br />
constant fresh organic matter incorporation and stimulation of soil microbial communities.<br />
This increased mineralization results in the improvement of soil fertility.<br />
Figure 2: Py-GC/MS chromatograms of selected humic acids<br />
4. Conclusions<br />
The results of this study suggest that regardless of the amount of plant residues added to soil,<br />
the quality of organic matter analyzed is strongly influenced by soil type. In this sense, soil<br />
matrix plays a decisive role on humification processes.<br />
The organic management seems to reproduce conditions similar to the naturals, although the<br />
lack of noteworthy features of higher quality in the undisturbed soil sampled, leads us to<br />
believe in the impossibility of finding a natural soil (as a reference) that is well conserved in<br />
the agricultural area studied. It should be noted the high potential of organic management in<br />
improving the quality of these agricultural soils, despite the limited time of implantation in<br />
the soils studied. This should help define strategies for soil conservation in the long term,<br />
previously established, the influence of soil type and geological parent material in each area.<br />
References<br />
1. B. Moreno, S. García, R. Cañizares, J. Castro and E. Benítez, Agric. Ecosys. & Environ., 131<br />
(2009) 333.<br />
2. P. Duchaufour, Pédogenèse et Classification, Pédologie 1, Masson, Paris, 1977.<br />
3. B. Ceccanti, J.M. Alcañiz, M. Gispert and M. Gassiot, Soil Sci., 150 (1986) 763.<br />
4. J. Dieckow, J. Mielniczuk, F.J. González-Vila, H. Knicker and C. Bayer, Geoderma 135 (2006)<br />
260.<br />
<strong>Vol</strong>. 2 Page - 395 -
15th IHSS Meeting- <strong>Vol</strong>. 2<br />
Multianalytical Approach to Minerals Characterization Associated to Coals<br />
by Combined Inst<strong>ru</strong>mental Microspectroscopic Techniques<br />
Luis F.O. Silva a,b *, Marcos L. S. Oliveira a , Felipe Macias b<br />
a Catarinense Institute of Environmental Research and Human Development – IPADHC,<br />
Capivari de Baixo, Santa Catarina, Brazil; b Second Affiliation, Address, Country<br />
E-mail: luisfelipe.silva@usc.es; felipeqma@yahoo.com.br<br />
1. Introduction<br />
Coal has contributed enormously to the advance of civilization by providing a worldwide<br />
abundant, inexpensive, and convenient source of energy [1]. However, with the increasing use<br />
of coal there is growing concern over the impacts on the environment and human health from<br />
potentially hazardous trace elements related to coal inorganic matter that are released in the<br />
course of coal mining, cleaning, transportation and combustion operations [2–3].<br />
The main objective of the present study was to check the usefulness of such approach in<br />
obtaining the required information to provide a more comprehensive mineralogical database<br />
for coals and associated strata in the coalfields, both to improve the understanding of coal<br />
characterisation and to relate the mineralogy of the different materials.<br />
2. Materials and Methods<br />
Twenty eight coal samples were collected, from selected locations of different continents<br />
(Australia, Brazil, Chine, Spain), to perform the present study. Three different samples from<br />
coals were used in this work: (i) <strong>ru</strong>n of mine (ROM samples, 1 from Australia, 7 from Brazil,<br />
1 from Chine, 5 from Spain), (ii) beneficiated coal (BC samples, 7 from Brazil, 1 from<br />
Chine), (iii) and coal cleaning residues (CCR samples, 6 from Brazil). These, Brazilian<br />
samples (ROM-BC-CCR) were obtained from different mines in relative close proximity at<br />
various times during 2006 and 2008. Three Certified Reference Materials (SARMs 18, 19 and<br />
20 from South Africa) were used as controls for each investigation, and all samples were<br />
analyzed at our laboratory. A splitter was used to obtain a representative sample.<br />
The minerals regions of interest were scanned for minimal bleaching with the Spectral<br />
Confocal and Multiphoton Microscope Leica Model TCS SP2 and optical microscopy.<br />
Analysis by SEM Model LEO-435VP fitted with an Oxford EDX resolution > 133 eV; it has<br />
a turbo pumped chamber, a motorized stage and a four-quadrant back-scatter detector were<br />
performed to identify the minerals present (observation on whole coal natural and/or polished<br />
surfaces). The acceleratting voltage was 20 kV and the beam current was 10 -10 A. The<br />
<strong>Vol</strong>. 2 Page - 396 -
15th IHSS Meeting- <strong>Vol</strong>. 2<br />
occurrence of mineral species was also investigated by means of an environmental SEM and<br />
TEM (JEOL JEM-2010 FEG) equipped with energy-dispersive X-ray spectrometer (EDS) for<br />
chemical analyses of individual particles. In addition, specific areas (10–500 nm diameter) of<br />
individual particles were chemically analyzed using an EDS ultrathin-window detector [4].<br />
Raman measurements were carried out using a LabRAM Microscope XploRATM from<br />
Horiba Jobin Yvon equipped with a 532 nm laser as the excitation source. With this<br />
configuration, the spacial resolution was Fe and Fe>Cr were also found in the jarosite aggregates from coal cleaning<br />
residues. Jarosite can assume a cubic morphology (Fig. 3B), which suggests it forms<br />
pseudomorphically after pyrite.<br />
<strong>Vol</strong>. 2 Page - 397 -
15th IHSS Meeting- <strong>Vol</strong>. 2<br />
Figure 1: Ilustration of several minerals identified. (A) SEM image of pyrite formed during organic<br />
accumulation; (B) SEM image of kaolinite; (C) HR-TEM image of jarosite and alteration of jarosite to<br />
hematite (Cu grids); (D) SEM Image of calcite identified in a Brazilian CCR sample; (E) illite; (F)<br />
Monazite image and EDS<br />
<strong>Vol</strong>. 2 Page - 398 -
15th IHSS Meeting- <strong>Vol</strong>. 2<br />
4. Conclusions<br />
The advanced microscopy techniques revealed phases with diverse composition and st<strong>ru</strong>cture.<br />
The Spectral Confocal and Multiphoton Microscope and analyses of the images in 3D,<br />
showed the characteristic of several minerals grains (e. g. hematite). The HR-TEM/EDS and<br />
SEM/EDS results were in agreement with the information obtained by Raman spectroscopy,<br />
being a powerful technique to perform.<br />
The high number of mineral phases in the coal cleaning residues suggests that some of them,<br />
sulphate and ferrite minerals mainly, could be generated in-situ through weatheringdissolution<br />
of the original compounds in the coals and subsequent precipitation of new<br />
thermodynamic stable solid phases from dissolved cations and anions. This assumption is<br />
supported by the theoretical simulation presented in this work. When those new mineral<br />
phases are formed, some highly toxic metals can be released as free cationic species, or as<br />
complexes like, i.e. highly risky bioavailable metal species are transported outside the coal<br />
mining facilities.<br />
Acknowledgements<br />
The authors express their gratitude to the heartfelt help of FEHIDRO, Environmental<br />
Foundation of Santa Catarina State – FATMA and Ferrovia Teresa Cristina.<br />
References<br />
1. R. B. Finkelman, Ambio. (2007), 36, 103-106.<br />
2. L.F.O.Silva, M.L.S. Oliveira, K.M da Boit, R.B. Finkelman, Environ. Geochem. Health. (2009),<br />
31, 475–485.<br />
3. L.F.O. Silva, R.B. Finkelman, M.L.S. Oliveira, K.M. da Boit, Environ. Geochem. Health., in<br />
press.<br />
<strong>Vol</strong>. 2 Page - 399 -
15th IHSS Meeting- <strong>Vol</strong>. 2<br />
Humic Acids Properties of the Wroclaw Chernosems and Phaeozems<br />
Beata Łabaz<br />
Institute of Soil Science and Environment Protection, Wroclaw University of Life and<br />
Environmental Sciences, G<strong>ru</strong>nwaldzka 53, 50-357 Wroclaw, Poland<br />
E-mail: beata.labaz@up.wroc.pl<br />
1. Abstract<br />
This work describes the physical-chemical and chemical properties, fractional composition of<br />
humus acid and chemical and physicochemical properties of the humic acids formed in<br />
different humidity conditions of the Wroclaw black earths. The emphasis was put on the<br />
chemical properties of the humic acids from the Ap horizon. Samples from 8 profiles of the<br />
arable soils of different subtypes (proper, browned, eluviated and degraded) were analyzed.<br />
From the Ap horizon in the neighborhood of the profiles located, 5 additional samples were<br />
taken to the statistical verification of the results. The investigated profiles was include in<br />
Chernosems and Phaeozems soils groups according FAO-WRB 2006 reference. In collected<br />
soils samples following analyzes were performed: soil texture, pH in 1mol KCl . dm -3 ,<br />
hydrolytic acidity (Hh), C total, N total, CaCO 3 , S total, the contents of exchangeable cations<br />
in alkaline character (Ca +2 , Mg +2 , K + , Na + ) and fractional composition of humus compounds<br />
with the Tiurin method. Humic acids extracted according to generally accepted IHSS method<br />
(Dziadowiec and Gonet) and were analyzed: elemental composition with the CHNS EA 1110<br />
Analyser by CE Inst<strong>ru</strong>ments. The values of the atomic rations H:C, N:C, O:C, as well as the<br />
internal oxidation degree according to the equation: ω=(2O+3N-H)/C, were calculated on the<br />
basis of the elemental composition expressed in atomic percentage points, IR spectra with the<br />
FTIR Spect<strong>ru</strong>m BX spectrometer by Perkin-Elmer. IR spectra of humic acids were produced<br />
in the range 400-4000cm -1 , for tablets of 3mg HA w 800mg KBr, spectrometric properties in<br />
the UV-VIS. On the basis of absorbance values, determinate at the wavelengths 465nm (A 465 )<br />
and 665mn (A 665 ) were calculated the values A 4/6 .<br />
In soil texture dominate clay and loamy clay in the proper and browned subtypes, the loam in<br />
eluviated and loamy sand in degraded subtypes. Reactions in KCl of the researched soils were<br />
in the humic A horizon range from acid to alkaline (pH 4,27-7,39), in turn in mineral horizon<br />
were strong alkaline. The alkaline reaction in some profiles had result from presence CaCO 3 .<br />
Content of the CaCO 3 was very different. In proper and browned subtypes were higher than<br />
in eluviated and degraded subtypes. Content of the C total was also different. Humic A<br />
horizon were rich in C total (8.1-23.7g·kg -1 ) which ware decrease in deep horizons. The less<br />
<strong>Vol</strong>. 2 Page - 400 -
15th IHSS Meeting- <strong>Vol</strong>. 2<br />
poverty in C total were the degraded subtypes. N total share in humic A horizon were placed<br />
in range 0.60-2.50g . kg -1 , in turn of the relation C/N ranged from 9.2-14.2. The contends of C<br />
total were correlate with S total which was range from 0.50-1.20g·kg -1 . Hydrolytic acidity<br />
were place in range 0.1-4.8cmol(+) . kg -1 . The sum of alkali exchange cations (S) were range<br />
3.4-40.4cmol(+) . kg -1 , the total sorption capacity (CEC) were range from 4.3 to 40.8<br />
cmol(+) . kg -1 and the saturation degree of the sorption complex (BS) were in range from 41.3<br />
up to 99.7%.<br />
In content of the fractional composition of the researched soils inconsiderable part<br />
represented fraction Ia (fulvic fraction) which in Humic A horizon was in range 2.4-4.0% C<br />
total. Within humus matter dominates fraction I (humic compounds bound with calcium and<br />
mobile forms of R 2 O 3 ), which in Humic A horizon was place in wide range 42.0-69.9 % C<br />
total. In fraction I dominated humic acid, especially in proper, browned and eluviaded<br />
subtypes and relation C HA /C FA value was in range 1.3-2.5. C HA -Ca (humic acids bounded with<br />
Ca) part in Humic A horizon proper subtypes were strongly higher and were place in range<br />
30.2-40.4 % C total. In the rest subtypes, especially degraded part of this fraction was lower.<br />
Fraction II (humic compounds bound with the stable silicate forms of R 2 O 3 ) in proper,<br />
browned and eluviated subtypes was comparable part, was placed in range 2.0-9.7% C total<br />
and relation C HA /C FA value was above 1, however part of this fraction in degraded subtypes<br />
was strongly higher (14.8-18.2% C total) and relation C HA /C FA value was below 1. The part of<br />
non extracted C total in Humic A horizon was in range 20.9-45.8% C total.<br />
On the base of the results, significant correlation between soil properties and fractional<br />
composition of humus were found. Analyzes of the fractional composition of humus can be<br />
criterion during describing subtypes of the black earths.<br />
The research of the physicochemical properties of the humic acids formed showed the lower<br />
oxidation degree of the humic acids, separated from proper and browned black earths in<br />
compare to rest investigated black earths subtypes. The infrared spect<strong>ru</strong>m proves the<br />
st<strong>ru</strong>ctural differences of the humic acids in various subtypes of black earths. The features of<br />
humic acids may be used as a one of the criteria for determination of the black earths<br />
subtypes.<br />
<strong>Vol</strong>. 2 Page - 401 -
15th IHSS Meeting- <strong>Vol</strong>. 2<br />
Evaluation of the Effect of Wildfires on Microbial Communities from<br />
Canary Island Forest Soils<br />
J. Rodríguez a* , A. Turmero a , A. Blanquéz a , J.A. González-Pérez b , F.J. González-Vila b ,<br />
C.D. Arbelo c , A. Rodríguez-Rodríguez c , M.I. Pérez-Leblic a , M.E. Arias a<br />
a Dept. Microbiología y Parasitología. Univ. de Alcalá. 28871. Alcalá de Henares, Madrid,<br />
Spain; b IRNAS-CSIC. Avda. Reina Mercedes, 10, 41012 Sevilla, Spain; c Dept. de Edafología<br />
y Geología. Univ de la Laguna. 38204 La Laguna, Tenerife, Spain<br />
E-mail: juana.rodriguez@uah.es<br />
1. Introduction<br />
Wildfires, a frequent and recurrent phenomenon in Spain, have received a great deal of<br />
attention due to its important role in forest ecosystems. Wildfires destroy vegetation cover and<br />
reduce soil fertility, favouring the occurrence of erosive processes and the loose of soil<br />
nutrients [1]. Soil degradation caused by wildfires produces important changes in physical,<br />
chemical and biological properties of soil [2, 3]. Fire affects carbon cycling in forests directly<br />
by oxidizing many of the available compounds and indirectly by changing environmental<br />
constraints on microbial activity [4]. Microorganisms are responsible for the decomposition<br />
and mineralization of plant and animal residues in the soil, being considered as indicator of<br />
ecosystem function and sustainability [5, 6]. Thus, the knowledge of the consequences of the<br />
wildfires on microbial communities is vital to understand the role of fire in ecosystem<br />
functioning.<br />
Microbial diversity of soils can be studied using classical and molecular approaches, which<br />
through the use of DNA-based techniques allow establishing differences within complex<br />
microbial communities. The main aim of this work was to study the effect of wildfires on<br />
microbial populations of different soils in order to get information about the functionality and<br />
recovery of such soils.<br />
2. Material and Methods<br />
Four scenarios from the Canary Island of Tenerife (C<strong>ru</strong>z del Cura, Los Castillos, Los<br />
Areneros and La Guancha) affected by a fire (August of 2007) have been studied, as well as<br />
control soils from near by areas under the same physiographical characteristics not affected by<br />
the fire. Two sampling were done, first after the wildfire and the second after the first rain.<br />
Soil microbiota has been estimated by viable count technique. The physiological profiles of<br />
soil microorganisms have been characterized by measuring the following enzymatic activities:<br />
<strong>Vol</strong>. 2 Page - 402 -
15th IHSS Meeting- <strong>Vol</strong>. 2<br />
alkaline- and acid phosphatases, β-glucosidase, invertase, cellulase, β-Nacetylglucosaminidase<br />
and urease. DGGE (denaturing gradient gel electrophoresis) from<br />
Bacteria and Archaea domains have been carried out for analysing the microbial biodiversity<br />
in the selected soils.<br />
3. Results and Conclusions<br />
From this work the following conclusions could be obtained: 1) A positive correlation<br />
between the soil carbon and nitrogen concentration and the induced respiratory activity (SIR)<br />
has been observed in all the analyzed zones; 2) A characteristic enzymatic pattern for<br />
different zones could not be established; thus, depending on the enzyme, the activity values<br />
were higher in control soils or in burned soils; 3) From DGGE analysis, different pattern of<br />
bands were detected among the different soil zones and also between the control and burned<br />
soils. In the first sampling just after the fire, Shannon index (diversity index) was higher in<br />
burned soils than in control soils corresponding to the areas Los Areneros and La Guancha,<br />
but the contrary was observed in the soils from C<strong>ru</strong>z del Cura and Los Castillos areas. In the<br />
second sampling, the Shannon index was higher in burned soils than in control soils in all the<br />
areas.<br />
Acknowledgement<br />
This work has been supported by CICYT project CGL 2006-12730<br />
References<br />
1. Fernández, C., Vega, J.A., Fonturbel, T., Pérez, P.G., Jiménez, E., Madrigal, J. 2007. Effects of<br />
wildfire, salvage logging and slash treatments on soil degradation. Land Degrad. Dev. 18: 591-<br />
607.<br />
2. Acea, M.J., and Carballas, T., 1996. Changes in physiological groups of micro-organisms in soil<br />
following wildfire. FEMS Microbiol. Ecol. 20: 33-39.<br />
3. González-Pérez J.A, González-Vila F.J., Almendros G., Knicker H., 2004. The effect of fire on<br />
soil organic matter – a review. Environ. Int. 30: 855– 870.<br />
4. Hamman, S.T., Burke, I.C. and Stromberger, M.E. 2007. Relationships between microbial<br />
community st<strong>ru</strong>cture and soil environmental conditions in a recently burned system. Soil Biol. &<br />
Biochem. 39: 1703-1711.<br />
5. Arias, M.E, González-Pérez, J.A, González-Vila, F.J. Ball, A., 2005. Soil Health-a new challenge<br />
for microbiologists and chemists. Int. Microbiol. 8: 13-21.<br />
6. Kara, O and Bolat, I. 2009. Short-term effects of wildfire in microbial biomass and abundance in<br />
black pine plantation soils in Turkey. Ecologial Indicators. 9: 1151-1155.<br />
<strong>Vol</strong>. 2 Page - 403 -
15th IHSS Meeting- <strong>Vol</strong>. 2<br />
Molecular Proxies for Soil Carbon Storage Patterns in Humic and Fulvic Acids from<br />
Oxisols in Minas Gerais State (Brazil)<br />
J.A. González-Pérez a , C.P. de Assis b* ; F.J. González-Vila a ; J.M. de la Rosa a,e , C. Marfil a , I.<br />
Jucksch c ; J.C. Lima Neves c ; J.L. Lani c ; E. de Sá Mendonça c,d , G. Almendros f<br />
a IRNAS-CSIC, PO Box 1052, 41012 – Sevilla, Spain; b DCS/UFC – Dept. de Ciências do<br />
Solo, C.P. 12168 – 60021-970 – Fortaleza, CE – Brasil; c DPS/UFV – Dept. de Ciência do<br />
Solo, av. P.H. Rolfs s/n, 36570-000 Viçosa – MG, Brasil; d DPV/UFES – Dept. de Produção<br />
Vegetal, 29500-000 Alegre, ES, Brasil; e Instituto Tecnológico e Nuclear, Estrada Nacional<br />
10, 2686-953, Sacavém, Portugal; f CCMA-CSIC, Serrano 115B, 28006 – -Madrid, Spain<br />
E-mail: cpdeassis@yahoo.com.br<br />
1. Introduction<br />
In tropical soils, there is the need for basic research on the st<strong>ru</strong>ctural features of the soil<br />
organic matter (MOS) in particular on the complementary pathways conforming the<br />
humification processes, which represent a keystone mainly in the terrestrial C cycle. Humic<br />
Oxisols are highly weathered soils, found mainly in the Southeast and South regions of Brazil,<br />
which present a thick A horizon (up to 200 cm), rich in organic matter. The occurrence of<br />
these soils is often related to dystrophic environments with undulated slopes and high<br />
altitudes.<br />
Humic acids (HA) and fulvic acids (FA) from six humic Oxisols from Minas Gerais under<br />
different vegetation were isolated to describe st<strong>ru</strong>ctural features informing on the carbon<br />
sequestration performance in Oxisols showing well-developed A humic horizon.<br />
2. Materials and Methods<br />
Superficial (0–10 cm) and sub-superficial (60–100 cm) samples were collected in the A humic<br />
horizon. The HA and FAs were extracted with alkaline reagents and purified before its<br />
characterization.<br />
To separate the HA and FA, the whole supernatant solution was acidified at pH 1–1.5 with 12<br />
mol L -1 HCl. The obtained FAs after centrifugation and filtering were saved for further<br />
purification. The precipitated HA were redissolved adding 0.1 mol L -1 KOH under N 2 and,<br />
adding solid KCl until the concentration of 0.3 mol L -1 followed by centrifugation for 20 min<br />
at 25.000 g. The process was repeated three times. The precipitated HA was re-suspended in<br />
0.1 mol L -1 HCl : HF (1:1) mixture and shaken during 2 h at 25 ºC and centrifuged. The HA<br />
was recovered and transferred to dialysis tubes D-0405 (Sigma-Aldrich) and dialyzed against<br />
distilled water, until negative AgNO 3 chloride test. The samples were frozen and freeze-dried.<br />
<strong>Vol</strong>. 2 Page - 404 -
15th IHSS Meeting- <strong>Vol</strong>. 2<br />
For purification of the FA fraction a glass column (30 mm i.d., 300 mm height) filled with<br />
Amberlite ® XAD-8 (Rohm & Hass, Co) resin was used. The resin was previously washed<br />
with methanol, 0.1 mol L -1 NaOH, 0.1 mol L -1 HCl and distilled water, respectively. The FAs<br />
(100 mL) were applied in the top of the column. The non adsorbed fraction (FA-1) was<br />
recovered. Then, the column was eluted sequentially with 100 mL of 0.1 mol L -1 HCl and 100<br />
mL of distilled water. Finally, the adsorbed FAs (FA-2) were eluted with 100 mL of 0.1 mol<br />
L -1 NaOH and the eluate was immediately collected in a beaker containing a cationic<br />
exchange resin, Dowex ® -50 (Dow Chemical Co.) in enough quantity to keep the pH balanced<br />
between 1 and 2. The fraction of FA-1 was distilled in cellophane bags against distilled water<br />
until negative AgNO 3 test. The of FA-1 and FA-2 fractions were concentrated in a rotary<br />
evaporator, frozen and freeze-dried.<br />
The HAs and FAs were characterized by elementary analysis, visible spectrometry, Fourier<br />
Transform Infrared Spectroscopy (FTIR) and cross-polarization (CP) magic angle spinning<br />
(MAS) 13 C-NMR.<br />
3. Results and Discussion<br />
The Van Krevelen diagram obtained from the H/C and O/C atomic ratios showed<br />
differentiation between the fractions according to their degree of carboxylation and alkylation<br />
(Figure 1).<br />
Figure 1: van Krevelen diagram obtained from the elementary composition of the humic acids (HA),<br />
FA-1 (FA fraction not adsorbed in XAD-8 resin) and FA-2 (adsorbed FAs)<br />
<strong>Vol</strong>. 2 Page - 405 -
15th IHSS Meeting- <strong>Vol</strong>. 2<br />
458<br />
572<br />
622<br />
OX1<br />
OX2<br />
OX3<br />
OX4<br />
0-10 cm<br />
OX5<br />
OX6<br />
OX1<br />
OX2<br />
OX3<br />
OX4<br />
60-100 cm<br />
OX5<br />
-2,E-04<br />
OX6<br />
-3,E-04<br />
400 450 500 550 600 650 700 750<br />
Wavelength (nm)<br />
Figure 2: Second derivative of the visible spectra of humic acids extracted from different depths of<br />
Humic Oxisols (concentration 0.2 mg C mL -1 ). OX1= soil under coffee; OX2= soil under pasture;<br />
OX3= soil under forest in Sericita-MG; OX4= soil under fern vegetations; OX5= soil under forest in<br />
Mutum-MG; OX6= soil from Cerrado ecosystem<br />
The FA fraction not adsorbed in XAD-8 resin (FA-1) comparatively presented higher levels<br />
of H and O and, greater E 4 /E 6 ratio than the FA fraction retained in this resin (FA-2).<br />
In general the visible spectra of humic substances are monotonous. In order to detect any<br />
discrete humic fraction with repeating units, the second derivative spect<strong>ru</strong>m was obtained,<br />
showing well defined valleys at circa 458, 570 and 620 nm. In particular, the HAs presented<br />
different concentration of polycyclic chromophors of fungal origin mainly in the 60–100 cm<br />
horizon (Figure 2).<br />
Concerning E 4 , the lower absorption intensity in the HAs, extracted from soils at the region of<br />
Mutum and Araçuaí, indicated significant differences as regards to samples from the region of<br />
Sericita.<br />
The samples of HA showed E 4 /E 6 ratios (data not shown) inside the interval of 3.6–5.2<br />
showing some tendency to increase with depth of the soil profile, which could be interpreted<br />
as the selective leaching of HAs of comparatively lower molecular size (e.g., FA-type)<br />
Average values of 17.6 and 9.9 were found for FA-1 and FA-2, respectively.<br />
The FTIR spectra (Figure 3) reveal that FA-1 is composed mainly of carbohydrates but<br />
includes a component of lignin.<br />
<strong>Vol</strong>. 2 Page - 406 -
15th IHSS Meeting- <strong>Vol</strong>. 2<br />
1720<br />
I<br />
1620<br />
I<br />
-1650<br />
0-10 cm<br />
1510<br />
1220<br />
I 1460<br />
l<br />
I<br />
1330<br />
I<br />
1030<br />
I<br />
1720<br />
I<br />
1620<br />
I<br />
1650<br />
l<br />
60-100 cm<br />
1220<br />
I<br />
1030<br />
I<br />
HA<br />
1720<br />
I<br />
1620<br />
I<br />
1460<br />
1330<br />
I<br />
1080<br />
1030<br />
I<br />
I<br />
1180<br />
I<br />
970<br />
I<br />
1620<br />
I<br />
1720<br />
I<br />
1460<br />
1380<br />
I<br />
1030<br />
1080<br />
I<br />
I<br />
1180<br />
970<br />
I<br />
I<br />
FA-1<br />
1620<br />
I<br />
1510<br />
I<br />
1330<br />
I<br />
1220<br />
I<br />
1030<br />
1100<br />
I<br />
I<br />
1620<br />
I<br />
1510<br />
I<br />
1220<br />
I<br />
1030<br />
I<br />
FA-2<br />
2000 1800<br />
1600<br />
1400<br />
1200<br />
1000<br />
800<br />
2000<br />
1800<br />
1600<br />
1400<br />
1200<br />
1000<br />
800<br />
cm -1<br />
Figure 3: Resolution-enhanced infrared spectra of humic acids (HA), fulvic fraction not adsorbed in<br />
XAD-8 (FA-1) and fulvic acids (FA-2) of humic Oxisols under forest vegetation (OX3) extracted in<br />
the depths of 0–10 and 60–100 cm, in Sericita-MG<br />
Conclusions<br />
The results suggest the possibility to classify the performance for C sequestration of different<br />
Oxisols in terms of surrogate indicators consisting of molecular features of humic substances.<br />
In particular the extent of the carbohydrate domain in FAs could inform on the extent to<br />
which this soil fraction would consist of recent microbial metabolites or to secondary<br />
products from biodegradation of higher molecular weight organic matter forms in soils where<br />
tropicality is leading to increased levels of organic matter mineralization. This information is<br />
complemented with that from the HAs fractions, showing variable concentration of fungal<br />
biomarkers, indicative of moderate biological activity where positive balance for<br />
accumulation is in part due to o newly-formed humic matter which contrasted with Oxisols<br />
where a more marked lignin signature betrayed by the FTIR spectra indicates preservation of<br />
comparatively raw organic matter forms in ecosystems where long-term retention of C would<br />
depend more in variable climatic constraints than on the intrinsic resilience of the humic<br />
substances.<br />
<strong>Vol</strong>. 2 Page - 407 -
15th IHSS Meeting- <strong>Vol</strong>. 2<br />
<strong>Vol</strong>. 2 Page - 408 -
15th IHSS Meeting- <strong>Vol</strong>. 2<br />
Natural Organic Matter and Humic Substances in the Agriculture<br />
and the Environment<br />
<strong>Vol</strong>. 2 Page - 409 -
15th IHSS Meeting- <strong>Vol</strong>. 2<br />
Long-Term Influence of Compost Amendment on Soil Humic Acids<br />
Chemical and Optical Properties<br />
Lubica Pospíšilová a* , Veronika Petrášová a , Tibor Liptaj b<br />
a<br />
Mendel University of Agriculture and Forestry in Brno, Department of Agrochemistry , Soil<br />
Science, Microbiology, and Plant Nutrition, Zemědělská 1, 613 00 Brno, Czech Republic;<br />
b Slovak University of Technology, Faculty of Chemical and Food Technology, Department of<br />
NMR Spectroscopy and Mass Spectroscopy, Radlinského 9, 812 37 Bratislava, Slovak<br />
Republic<br />
E-mail: lposp@mendelu.cz<br />
1. Introduction<br />
Humic acids represent very important part of soil organic matter. Their chemical properties<br />
and st<strong>ru</strong>cture is not only important for soil fertility but also affect their environmental<br />
functions. Higher humified HA with high aromaticity degree are accepted to participate in<br />
binding organic and inorganic pollutants [1]. Association between humic acids heavy metals<br />
and other hydrophobic pollutants have important consequences with regard to their transport<br />
and retention. 13 C NMR spectroscopy is useful tool for the elucidation st<strong>ru</strong>cture of organic<br />
compounds and mixture. The humic acids carbon skeleton is observed and functional groups<br />
are detected [2].<br />
The aim of our work was to discuss the effect of compost amendment on to humic acids<br />
st<strong>ru</strong>cture, functional groups content and elemental composition.<br />
2. Materials and Methods<br />
Basic soils and compost characteristic were determined by commonly used method and are<br />
listed in. Table1. fractionation of humic substances was made by short fractionation method<br />
according to Kononova–Bělčikova method [3]. Soil humic acids were isolated before compost<br />
amendment and one year after compost amendment into the soils. We followed three different<br />
soil types: Leptic Cambisol (locality Ocmanice), Haplic Cambisol (locality Náměšť) and<br />
Luvi-haplic Chernozem (locality Praha). Standard IHSS extraction method for humic acids<br />
isolation was applied. Humic acids were purified, dialysed and lyophilised at -50°C. Humic<br />
acids elemental analysis was determined by CHN analyzer using standard method. 13 C<br />
Nuclear Magnetic Resonance (NMR) was carried out on spectrometer Varian INOVA 600<br />
(frequency 150,830 MHz).<br />
<strong>Vol</strong>. 2 Page - 410 -
15th IHSS Meeting- <strong>Vol</strong>. 2<br />
3. Results and Discussion<br />
Results showed that aromatic carbon content was decreasing in order: Luvi-haplic Chernozem<br />
> Haplic Cambisol > Leptic Cambisol (Tab. 2). The chemical shift is expressed as parts per<br />
million (ppm). The intensity of the signal detected and the spectral quality of that signal<br />
(signal: noise ratio) are dependent upon the amount of 13 C present in the sample and the<br />
concentrations. Calculated aromaticity degree (=α) higher in Luvi-haplic Chernozem HA and<br />
lower in Leptic Cambisol HA. Opposite situation was determined for aliphatic moieties.<br />
Higher differences in concentration of sp 3 C among HA samples were detected in Luvi-haplic<br />
Chernozem HA. 13 C NMR findings were in agreement with elemental composition, fractional<br />
composition results and literature data (Malcolm, 1990, Simpson, 2001). <strong>Humus</strong> fractionation<br />
showed higher amount of HA in Luvi-haplic Chernozem to compare with other samples. No<br />
statistically significant differences in elemental composition after one year experiments were<br />
found (Table 3). Cambisols samples one year after compost amendment contained more<br />
aliphatic and less aromatic compounds to compare with HA isolated from Luvi-haplic<br />
Chernozem.<br />
Table 1: Basic compost and soils characteristics<br />
Sample pH/H 2 O pH/KCl<br />
CEC<br />
mmoleq/100g<br />
TOC<br />
[%]<br />
HA<br />
[mg/kg]<br />
FA<br />
[mg/kg]<br />
HA/FA<br />
Luvi-haplic Chernozem (Praha) 7.45 6.5 21 1.8 4.6 1 4.6<br />
Leptic Cambisol (Ocmanice) 5.0 4.1 18 1.6 1.44 2.7 0.54<br />
Haplic Cambisol (Náměšť) 5.1 4 16 1.3 1.6 3 0.54<br />
Compost (Praha) 8.4 7.5 - 10.3 15 12 1.25<br />
Table 2: Relative integral intensity of 13 C NMR spectra of HA (spinning site peaks)<br />
Samples / area 1 2 3 4 5 6 7<br />
HA – Luvi-haplic Chernozem 4.45 11.71 6.90 31.74 10.77 21.28 13.20<br />
HA – Leptic Cambisol 0.51 25.27 2.0 14.09 6.93 21.52 29.68<br />
HA – Haplic Cambisol 0.12 22.43 2.35 16.71 2.65 27.96 27.78<br />
HA – Compost 0.42 25.54 3.29 31.16 6.05 11.24 22.3<br />
Table 3: Elemental composition of isolated HA preparations (at. %)<br />
Sample %C %H %N %O<br />
HA – Luvi-haplic Chernozem 37.9 39 2.9 20.2<br />
HA – Leptic Cambisol 33.45 47.44 3.07 16.05<br />
HA – Haplic Cambisol 34.2 46.16 3.05 16.59<br />
HA – Compost 35.35 40.44 2.45 21.76<br />
<strong>Vol</strong>. 2 Page - 411 -
15th IHSS Meeting- <strong>Vol</strong>. 2<br />
4. Conclusions<br />
Long–term field experiments help us to study changes in humic acids chemical properties and<br />
st<strong>ru</strong>cture. One year after compost application results were not statistically significant but our<br />
experiments will continue for five years and we hope to get interesting data about influence of<br />
compost amendment on to HA elemental composition and st<strong>ru</strong>cture.<br />
Acknowledgements<br />
This work was supported by two NAZVA projects QH 81200 and QH 72039.<br />
References<br />
1. M.L. Malcolm, Anal. Chim. Acta 232 (1990) 19–30.<br />
2. A. Simpson, Soil Sci. 11, vol. 166 (2001) 795-808.<br />
3. D.S. Orlov, Chimija počv. [Soil Chemistry], MGU, Moscow, 1985, p. 376.<br />
<strong>Vol</strong>. 2 Page - 412 -
15th IHSS Meeting- <strong>Vol</strong>. 2<br />
Chromium (VI) Bioreduction and Chromium (III)-Binding to Agricultural<br />
Waste<br />
Luis Federico Sala * , Patricia Blanes, Florencia Mangiameli, Silvia García, Juan Carlos<br />
González, María Inés Frascaroli, Sebastián Bellú.<br />
Instituto de Química Rosario (IQUIR), CONICET-Universidad Nacional de Rosario,<br />
Suipacha 531, S2002LRK, Rosario, Argentina.<br />
E-mail: sala@iquir-conicet.gov.ar<br />
1. Introduction<br />
Cr VI has been found to be a cancer-causing agent [1]. Cr III is more stable, less toxic, and listed<br />
as an essential element (in trace concentrations) to provide good health [2]. When Cr III is<br />
present in excess, can produce a very dangerous pollution due to the possibility of producing<br />
high stable complexes with organic ligands present in water and later, in contact with<br />
manganese oxide present in soils might be oxidized to Cr VI [3]. Reduction of Cr concentration<br />
from effluents to a permissible limit before discharging them into streams and rivers is<br />
important for human health and the environment. Agricultural and biomaterials wastes studied<br />
for the adsorption efficiency include Rice Husk (RH), Soya Husk (SH), Orange (OP),<br />
Grapef<strong>ru</strong>it (GP) and Lemon Peel (LP). The objective of this work was removing Cr from<br />
industrial effluents and optimizing the capacity of biomaterials to adsorb Cr. Adsorption is an<br />
effective method for removing Cr, solving the sludge disposal problem. Such process is<br />
economically viable, especially if low-cost adsorbents are used. Previous studies have shown<br />
that agricultural waste biomass reduce Cr VI and binds Cr III by way of carboxyl ligands,<br />
especially if pectin biopolymer is present [4, 5]. With this in mind, agricultural waste may<br />
have the ability of uptake both form of chromium. The study has been extended to,<br />
Polysiphonia nigrescens (PN), a red algae. In this work X-ray Absorption Spectroscopy<br />
(XAS), Infrarred Spectroscopy (IR), Resonance Paramagnetic Electron spectroscopy (RPE)<br />
were used to ascertain the ability of the agricultural waste biomass to coordinate Cr VI and<br />
reduced it to Cr III , as well its capacity to retain the last one.<br />
2. Materials and Methods<br />
Agricultural Waste Collection. The GC and SH were collected from fields studies conducted<br />
at Alvear Agricultural Zone, Santa Fe Province. The OP, LP and GP were collected from the<br />
Citric Industries around Rosario City. The PN was collected from Mar del Plata, Buenos<br />
Aires. The samples were oven dried at 40 ºC for 12 h, powdered and sieved to retain the<br />
fraction of particles in the required range.<br />
<strong>Vol</strong>. 2 Page - 413 -
15th IHSS Meeting- <strong>Vol</strong>. 2<br />
Chromium Analysis. Cr III was determined at 540 nm by oxidizing to Cr VI using saturated<br />
solution K 2 S 2 O 8 and AgNO 3 as catalyst, prior to the 1,5-diphenylcarbazide reaction. The<br />
amount of Cr adsorbed by biomaterials treated with Cr III was calculated from the difference<br />
between the initial chromium concentration of the control solutions and the final total Cr<br />
concentration in the respective supernatant solutions. The amount of Cr in the solid phase was<br />
verified on samples calcined at 900 ºC and then treated with Na 2 CO 3 /K 2 CO 3 (1:1) mixtures at<br />
800ºC. The solid obtained was dissolved with sulphuric acid, prior to the reaction with 1,5-<br />
diphenylcarbazide.<br />
Experimental Design. Full factorial design with pseudo-central point: optimization of<br />
experimental adsorption procedures constitutes an important area in chemometrics. One of the<br />
simplest types of factorial designs used in experimental work is one having two levels (2k).<br />
The design determines which factors have important effects on the response as well as how<br />
the effect of one factor varies with the level of the other factors (interactions of factors). For<br />
treatment of data, the Design Expert Software release 6.0.10 was employed throughout in<br />
order to obtain the effects, coefficients, standard error of coefficients, and other statistical<br />
parameters of the fitted models.<br />
Spectroscopic Methods. Electron paramagnetic resonance, EPR, is a physical method for<br />
observing resonance absorption of microwave power by unpaired electron spins states in a<br />
magnetic field. Cr III (d 3 ) and Cr V (d 1 ) contain unpaired electrons; therefore, they have intense<br />
EPR signals at room temperature. On the other hand, Cr VI (d 0 ) with no unpaired electron is<br />
EPR silent. To verify the oxidation state of the chromium bound to the biomaterials studied<br />
X-ray photoelectron spectroscopy, XPS, was employed in this study.<br />
3. Results and Discussion<br />
The amounts of adsorbed Cr III ion (q) could depend on the mass of the adsorbent, acidity of<br />
the medium (pH), and the contact time between the adsorbate and adsorbent. Adsorption of<br />
Cr III species increases with increasing pH because the adsorption process is dominated by<br />
electrostatic interactions among the ionized acid sites on the material surface and the Cr III<br />
cations. Experiments beyond pH 5.0 were not performed due the precipitation of Cr(OH) 3 .<br />
The pH of the solution modifies the behavior of the material surface and, in consequence,<br />
modifies its adsorption capacity for Cr III . Increasing adsorbent mass (m) provide more metal<br />
binding sites. These facts explain why pH and m are significant factors. Time contact (t), in<br />
comparison with pH and m, is not significant because the adsorption process is fast.<br />
Determination of interactions of factors can be important for successful system optimization.<br />
<strong>Vol</strong>. 2 Page - 414 -
15th IHSS Meeting- <strong>Vol</strong>. 2<br />
Response surface analysis statistical procedure was employed to achieve the highest amount<br />
of the Cr III ions adsorbed. In order to continue the batch adsorption optimization, a central<br />
composite surface analysis design with two factors (m, pH) was carried out (see Fig. 1 and<br />
Table 1)<br />
Figure 1<br />
Table 1<br />
Optimum Optimum<br />
Mass pH<br />
Lemon peel 2.34 4.50<br />
Orange peel 1.45 4.4<br />
Grape f<strong>ru</strong>it 3.5 4.5<br />
Soya husk 5.1 4.5<br />
Rice husk 5.65 3.3<br />
Adsorption studies. Adsorption isotherms of Cr III onto biomaterials were obtained at optimal<br />
condition. As it can be observed in Fig. 2, the isotherms exhibit asymptotic behavior.<br />
Isotherms data were fitted to Langmuir adsorption models, given by Eq. 1 were C e and q e are<br />
the equilibrium adsorbate concentration in aqueous (mg/L) and solid phase (mg/g),<br />
respectively. The Langmuir adsorption constants evaluated from the isotherms with the<br />
correlation coefficients are presented in Table 2.<br />
q e = Q 0 b C e / (1+ b C e ) (Eq.1)<br />
Table 2 Q 0 (mg/g) b (L/mg)x 10 2 r 2<br />
Lemon Peel 21.2 ± 0.9 0.20 ± 0.02 0.9928<br />
Orange Peel 39.2 ± 0.7 13 ± 1.0 0.9901<br />
Grape F<strong>ru</strong>it 20.0 ± 0.2 0.30 ± 0.03 0.9905<br />
Soya Husk 13.5 ± 0.2 1.0 ± 0.10 0.9950<br />
Rice Husk 3.2 ± 0.1 3.0 ± 0.30 0.9852<br />
18<br />
Fig. 2<br />
16<br />
Lemon Peel<br />
14<br />
12<br />
Soya Husk<br />
10<br />
8<br />
6<br />
4<br />
2<br />
0<br />
0 300 600 900 1200 1500 1800<br />
Spectroscopic Studies. To characterize the mechanism of Cr VI removal, it is very important to<br />
verify the oxidation state of the Cr bound to the biomaterial. The EPR spectra of LP at various<br />
contact time with Cr VI are shown in Fig. 3. Spectra exhibit a sharp signal at g iso = 1.9785,<br />
characteristic of Cr V , superimposed to a broad signal at g iso ∼ 2.00, typical of Cr III . The<br />
intensity of this broad signal increased with longer contact times while the sharp Cr V signal<br />
diminished and finally disappeared, thus indicating that Cr V was further reduced to Cr III on the<br />
biomaterial surface. The g value of the Cr V EPR signal provide useful information on the<br />
nature and number of donor groups bound to Cr V [6, 7]. The g-value corresponds to oxo-Cr V<br />
bound to carboxylate and alcohol groups. Very similar spectra pattern was observed for RH,<br />
q e<br />
(mg/g)<br />
[Cr III ] e<br />
(mg/L)<br />
Figure 2<br />
<strong>Vol</strong>. 2 Page - 415 -
15th IHSS Meeting- <strong>Vol</strong>. 2<br />
SH, GP and OP. The fact that we observed Cr V bound to the surface of all biomaterial treated with<br />
Cr VI indicates an adsorption/reduction model for the removal of Cr VI by these adsorbents. The<br />
final Cr specie was Cr III as can be seen in the EPR spectra. After treatment with Cr III XPS spectra<br />
indicated that there were significant contributions of the Cr bound to the biomaterials, Fig. 4. All<br />
samples present two bands with binding energies of 576.8 and 586.7 eV, coincident with the<br />
binding energies of the Cr 2 O 3 used as standard.<br />
Lemon Peel without treatment<br />
Fig. 3<br />
Cr III<br />
Cr III<br />
dpph<br />
dpph<br />
dpph<br />
Cr V<br />
Lemon Peel treated with Cr VI (1 hour)<br />
Cr V<br />
Lemon Peel treated with Cr VI (1 hour)<br />
Lemon Peel treated with Cr VI (4 hour)<br />
Lemon Peel treated with Cr III (1 hour)<br />
Counts<br />
6000<br />
4000<br />
2000<br />
0<br />
Fig. 4<br />
Orange Peel<br />
Rice Husk<br />
Lemon Peel<br />
Cr 2<br />
O 3<br />
2500 3000 3500 4000 4500 5000 5500<br />
4. Conclusions<br />
575 580 585 590<br />
Binding energy (eV)<br />
Field (G)<br />
Figure 3 Figure 4<br />
OP, GP, LP, RH and SH were tested as low-cost adsorbents for Cr III removal from aqueous<br />
solutions. In order to achieve the best conditions of the batch adsorption procedure statistical<br />
designs of experiments were carried out for each adsorbent. The adsorption capacity for Cr III<br />
using those biomaterial was greater than other agricultural-based biosorbents. Abiotic Cr VI<br />
reduction by the biomass was performed with various contact times, and surface characteristics of<br />
the Cr-biomass were then investigated using EPR and XPS. EPR spectra indicated that the Cr VI<br />
bound to the biomass was reduced to Cr V and Cr III at different experimental conditions. XPS<br />
spectra were in agreement with EPR, confirming the presence of Cr III binding to the surface of the<br />
adsorbent.<br />
Acknowledgments: Universidad Nacional de Rosario (UNR) – CONICET PIP 112-200801-<br />
00075.<br />
References<br />
1. R. Codd, C. T. Dillon, A. Levina and P. A. Lay, Coord. Chem. Rev., 2001, 216–217, 537–577;<br />
2. J. B. Vicent, Polyhedron, 2001, 20, 1-–6;<br />
3. A. D. Apte, V. Tare, P. Bose, 2006, J. Haz. Mat., B128, 164-174;<br />
4. S, E. Bellú, J. C. González, S. I. García, S. R. Signorella, L. F. Sala, J. Phys. Org. Chem.,2008,21, 1059 –<br />
1067;<br />
5. S. Bellú, S. I. García, J. C. González, A. M. Atria, L. F. Sala, S. Signorella, Sep. Sci. Technol., 2008, 43,<br />
3200 – 3220;<br />
6. Barr-David, G. Charara, M. Codd, R. Farrell, R.P. Irwin, J.A. Lay, P.A. Bramley, P. B<strong>ru</strong>mby, S. Ji, J.Y.<br />
Hanson, G.R. J. Chem. Soc., Faraday Trans. 1995, 91, 1207–1215;<br />
7. J.C. González, S. García, S. Bellú, J. M. Salas Peregrín, A. M. Atria, L. Federico Sala S. Signorella, Dalton<br />
Trans., accepted 17th November 2009, DOI:10.1039/b915652f<br />
<strong>Vol</strong>. 2 Page - 416 -
15th IHSS Meeting- <strong>Vol</strong>. 2<br />
Co-composting of Animal Grease Wastes and Lignocellulosic as an<br />
Approach for Bioprocessing of Wastes Prohibited for Landfilling<br />
Oskars Bikovens a* , Dzidra Zarina b , Galina Telysheva a<br />
a<br />
Latvian State Institute of Wood Chemistry, 27 Dzerbenes Str., Riga, Latvia; b University of<br />
Latvia, Institute of Microbiology and Biotechnology, Riga, Latvia<br />
E-mail: ligno@edi.lv<br />
1. Introduction<br />
The wastewaters of the meat processing industry contain a rather high quantity of melted<br />
grease. According to the national legislation, the concentrated grease cannot be transported to<br />
the dump, because its biological degradation in natural climatic conditions proceeds slowly,<br />
and possibility of different infections is rather high. To avoid the contamination of the<br />
environment and simultaneously to transform these wastes into environmentally friendly<br />
products, their composting with lignocellulosic materials in the presence of a specially<br />
designed inoculum [1] containing Trichoderma spp, was undertaken. Trichoderma spp were<br />
introduced into the inoculum to promote the lignocellulose degradation and the inhibition of<br />
pathogenic microorganisms. The data about the fast conversion of grass lignin during<br />
composting with the formation of a significant amount of humic substances [2], capable of<br />
contributing to the composting process, have been used to formulate a compost composition<br />
intended for degradation of meat processing grease wastes. The aim of the presents work was<br />
co-composting of meat processing grease wastes together with lignocellulosic wastes, such as<br />
sawdust and grass, and evaluate grease effect on compost humic acids formation.<br />
2. Materials and Methods<br />
Wastewater of slaughterhouse “Lankalni” (Sk<strong>ru</strong>nda, Latvia), containing the cattle fatty tissue<br />
with an admixture of blood, was taken for bioprocessing. Compost was prepared at the SME<br />
“Zeltabele” (Saldus) on the basis of composition developed by the authors: deciduous tree<br />
sawdust, fresh reaped grass (Graminaceae), inoculum and wastewater of the slaughterhouse.<br />
Compost samples were freeze-dried and grounded using a Wiley mill. The grounded samples<br />
were extracted with hexane for removal of residual fats. Humic acids were extracted by<br />
method recommended by IHSS. Analytical pyrolysis (Py-GC/MS) was carried out using<br />
Shimadzu GC/MS-QP 2010. FTIR spectra were recorded in KBr pellets. Humification index<br />
was determined by described method [3]. The ISO 11269-1 root elongation test was used for<br />
assessing the compost quality. “RhizoScan” software was used for morphological analysis.<br />
<strong>Vol</strong>. 2 Page - 417 -
15th IHSS Meeting- <strong>Vol</strong>. 2<br />
3. Results and Discussion<br />
The dry matter content of the wastewater of the slaughterhouse was 15.6%, and it contained<br />
grease (mainly, triglicerides of palmitic and oleic acids) and proteins (N content 4.5%).<br />
Freshly prepared compost contained around 7% of melted grease (recalculated on dry matter).<br />
Amount of hexane extractives rapidly decreased during composting to 0.5-0.7% after the first<br />
two weeks. Py-GC/MS and FTIR spectra showed that hexane extractives contain mostly plant<br />
originated compounds, and extract-free residue contained also insignificant amount of fat acid<br />
residue. These results showed that melted grease can be effectively degraded by composting.<br />
Decreasing of C/N ratio from 35 to 20 proceeded during 190 days of composting. Content of<br />
inorganic increased from 10 to 30%. Humification index of alkaline extract increased up to<br />
3.2. Root elongation test showed that final compost positively influence on corn root system<br />
(main, total root long, root diameter and weight) and can be used as organic soil amendment.<br />
Many authors [4, 5] assume that the chemical st<strong>ru</strong>cture of humic substances depends mainly<br />
on properties of fresh material, composting conditions and time of composting. Py-GC/MS<br />
and FTIR spectra of compost humic acid (HA) showed that modified lignin and protein made<br />
a significant part of compost HA. An elevated residue of fat acid was not observed in HA,<br />
although fresh material contained around 7% grease. These results suggested that grease was<br />
decomposed at the early stage of composting and didn’t affect significantly the HA formation.<br />
4. Conclusions<br />
Wastewater of a slaughterhouse could be used in a composition of compost together with<br />
lignocellulose wastes (sawdust and grass). The investigated quantity of melted grease in the<br />
compost composition had no significant effect on the HA chemical st<strong>ru</strong>cture because of the<br />
rapid decomposition of fat at the early stage of composting.<br />
Acknowledgements<br />
Financially supported from EUREKA project E!3726 – Euroenviron Degreas „Optimized<br />
complex technology for grease wastes utilization” and the FP7 project “WOOD-NET”.<br />
References<br />
1. D. Zarina and F. Utinans, (2003). Latvian Patent No. 13022 , 20.09.2003.<br />
2. O. Bikovens, G. Telysheva and K. Iiyama, Chem. Ecol. Submitted in 2009.<br />
3. M. Fukushima et al., Biores. Technol., 100 (2009) 791.<br />
4. P. Castaldi, G. Alberti, R. Merella, P.Melis, Waste Management, 25 (2005) 209.<br />
5. J.I. Chang, J.J. Tsai, K.H. Wu, Biores. Technol., 97 (2006) 116.<br />
<strong>Vol</strong>. 2 Page - 418 -
15th IHSS Meeting- <strong>Vol</strong>. 2<br />
Long-term Mineral Fertilization and its Effect on Humic Condition of the<br />
Haplic Chernozems in Dobroudja<br />
Margarita Nankova<br />
Dobroudja Agriculture Institute General Toshevo 9520, Bulgaria<br />
E-mail: nankova_margo@abv.bg<br />
1. Introduction<br />
From the beginning of the 80s, studies are being carried out at the trial fields of the Dobroudja<br />
Agriculture Institute to determine the effect of systematic mineral fertilization at various types<br />
of crop rotation, and the effect of different tillage systems on the changes of humus content,<br />
humus reserves along the profile depth and the changes of its group and fraction composition<br />
[3, 4, 6].<br />
The aim of this study was to characterize the changes in the humus content and reserves in<br />
soil, as well as the changes in its qualitative composition resulting from 30 year annual<br />
dressing with nitrogen, phospho<strong>ru</strong>s and potassium in various norms and rates.<br />
2. Material and Methods<br />
In a stationary field experiment with two field crop rotation (wheat-maize) initiated in 1967,<br />
the effect of systematic mineral fertilization on soil fertility, and especially on its humus<br />
content, were studied. Four nitrogen and phospho<strong>ru</strong>s and three potassium norms were tested -<br />
0, 60, 120; 180; 0, 60 and 120 kg/ha, respectively. The experiment was designed according to<br />
the method of the “net square”, applying the full version of the design in four replications.<br />
The changes in total nitrogen and humus content, and the changes in their group and fraction<br />
composition were determined in selected variants of the trial. Soil samples were taken at the<br />
30 th year of the trial from the 0–20, 20–40 and 40–60 cm layers. The humus content was<br />
evaluated using the Tyurin method [2], the group and fraction composition by the Kononova-<br />
Belchikova method [1].<br />
Data was processed with the help of the statistical analysis software Biostat [8].<br />
3. Results and Discussion.<br />
The annual mineral fertilization with the studied norms and rates for a period of 30 years lead<br />
to a considerable differentiation in the humus content depending both on the fertilization norm<br />
and the profile depth. The variation in the humus —from 2.39 to 3.57 % in the 0–60 cm layer<br />
(Table 1). The established nitrogen content differences in the 0–20 and 20–40 cm layer were<br />
<strong>Vol</strong>. 2 Page - 419 -
15th IHSS Meeting- <strong>Vol</strong>. 2<br />
significantly smaller in comparison to that in the 40–60 cm layer. In the variants dressed with<br />
moderate and optimal nitrogen norms in combination with phospho<strong>ru</strong>s, as well as in<br />
independent nitrogen fertilization with increasing norms, the total nitrogen content in the 20–<br />
40 cm layer was even higher than that in the surface layer. Most probably very good<br />
conditions for microbiological activity had been created in these variants, i.e. neutral soil<br />
reaction, better soil st<strong>ru</strong>cture ensuring more efficient airing and water supply than in the<br />
surface layer.<br />
Table 1: <strong>Humus</strong> content along the profile according to fertilization norms (kg/ha) and soil depth (cm)<br />
Variants of <strong>Humus</strong> - % <strong>Humus</strong><br />
fertilization 0–20 20–40 40–60 0–20 20–40 40–60 Total<br />
1. N 0 P 0 K 0 2.92 2.90 2.58 67.74 73.66 69.66 211.06<br />
2. N 60 P 0 K 0 3.33 2.90 2.91 77.26 73.66 78.57 229.49<br />
3. N 120 P 0 K 0 3.15 2.99 2.55 73.08 75.95 68.72 217.75<br />
4. N 180 P 0 K 0 3.13 3.05 2.39 72.62 77.34 64.40 214.36<br />
6. N 0 P 120 K 0 3.36 2.94 2.48 77.95 74.55 66.83 219.33<br />
9. N 0 P 0 K 120 3.08 3.01 2.58 71.34 76.45 69.66 217.45<br />
10. N 60 P 60 K 0 3.15 3.01 2.55 73.08 76.45 68.72 218.25<br />
15. N 120 P 60 K 0 3.21 3.06 2.58 74.36 77.72 69.66 221.74<br />
16. N 120 P 120 K 0 3.15 3.03 2.56 73.08 76.84 69.12 219.04<br />
17. N 120 P 180 K 0 3.28 3.06 2.56 75.98 77.72 69.12 222.82<br />
19. N 120 P 0 K 120 3.17 3.13 2.84 73.54 79.50 76.68 229.72<br />
20. N 180 P 60 K 0 3.28 2.99 2.73 75.98 75.95 73.71 225.64<br />
21. N 180 P 120 K 0 3.17 3.19 2.90 73.54 80.90 78.17 232.61<br />
22. N 180 P 180 K 0 3.11 3.08 2.53 72.15 78.11 68.31 218.57<br />
28. N 0 P 120 K 120 3.17 3.17 2.98 73.54 80.52 80.46 234.52<br />
31. N 60 P 60 K 0 3.30 3.19 2.76 76.44 80.90 74.39 231.73<br />
40. N 120 P 120 K 120 3.31 3.14 2.65 76.79 79.63 71.55 227.97<br />
46. N 180 P 120 K 120 3.31 3.06 2.53 76.79 77.72 68.31 222.82<br />
48. N 180 P 180 K 120 3.57 3.19 2.88 82.82 80.90 77.76 241.48<br />
49. N 180 P 180 K 180 3.51 3.35 2.74 81.43 84.96 73.98 240.37<br />
Factor А GD 5 % 5.448 1.429<br />
1% 7.246 1.900<br />
0.1 % 9.425 2.472<br />
Factor В GD 5 % 2.110 0.553<br />
1% 2.806 0.736<br />
0.1 % 3.650 0.957<br />
The differences in the humus content along the soil profile as a result from the long-term<br />
annual mineral fertilization lead to formation of different reserves. The values obtained for the<br />
accumulated reserves reveal a rather interesting tendency. These reserves are a good basis for<br />
the establishment of a fertilization system in the region with Haplic Chernozems which would<br />
guarantee not only the preservation of soil fertility, but also its enrichment at an ecologically<br />
friendly level with a maximal economic profit. The results from the control variant give a<br />
clear idea for the advantages of Haplic Chernozems characterising them as soils of high<br />
natural fertility which are suitable for cultivation of all field crops grown in our country.<br />
<strong>Humus</strong> reserves gradually decrease down the studied profile. They were highest in the 0–20<br />
<strong>Vol</strong>. 2 Page - 420 -
15th IHSS Meeting- <strong>Vol</strong>. 2<br />
cm layer. The maximum increase according to the control was established in the variants with<br />
intensive fertilization norms, i.e. variants 48 and 49 (122.26 and 120.21 %, respectively) both<br />
in the root-deep layer and in the whole 0–60 cm layer. The latter, however, was with low<br />
nitrogen content and higher mobility, as shown below. The most suitable among the tested<br />
norms of independent nitrogen dressing was 60 kg/ha. The independent phospho<strong>ru</strong>s and<br />
potassium dressing, as well as their combination, also affected positively the humus reserves<br />
in soil.<br />
The dispersion analysis of the obtained results (Table 2) proved in most cases their statistical<br />
significance regarding both the fertilization norms (Factor A), and the depth the studied<br />
profile (Factor B). The differences in the content of total nitrogen and humus, as well as the<br />
humus reserves in soil in the independent activity of the two factors and in their combined<br />
interaction were proved to a maximal degree of significance.<br />
Table 2: Dispersion analysis<br />
Indices MS A MS B MS A x B Error<br />
1. Total C - % 0.01 с 0.08 с 0.07 с 0.0<br />
2. <strong>Humus</strong> - % 0.03 с 0.23 с 0.21 с 0.0<br />
3. <strong>Humus</strong> reserves - t/ha 20.57 с 189.87 с 39.25 с 1.53<br />
4. C/N ratio 0.8 с 6.41 с 0.78 в 0.15<br />
df 19 2 38 59<br />
The combined activity of the three macroelements in the fertilization norm at rate 1:1:0.7<br />
(norms 180:180:120 kg/ha) and rate 1:1:1 (norms 60, 120 and especially 180 kg/ha) lead to a<br />
considerable increase of humus reserves in the 20–40 and 40–60 cm layers.<br />
The degree of humus enrichment with nitrogen (C/N) is an important index which gives an<br />
idea about the level of humification of the organic matter in soil and allows to make<br />
comparative analyses to determine the direction of the humification process. The results we<br />
obtained show that in most variants and depths the organic matter of the Haplic Chernozems<br />
is characterized by a medium degree of humification (8–11).<br />
Mineral fertilization for a period of 30 years lead to a considerable increase in the humic acid<br />
fractions fixed with iron oxides and alumina in soil along the studied profile, as compared to<br />
the control without fertilization (Table 3). This increase is much better expressed in the 0–20<br />
cm layer. This fraction is the main form of mobile humus and its increase is an indication of<br />
humus mobility increase. The fraction of humic acids linked with Ca is of special interest.<br />
This is the fraction of brown humic acids which dominate in the upper profile layers of the<br />
Haplic Chernozems in Bulgaria. It was established that both their total amount and their share<br />
<strong>Vol</strong>. 2 Page - 421 -
15th IHSS Meeting- <strong>Vol</strong>. 2<br />
decreased according to total C in soil with the increase mainly of the nitrogen norm in the 0–<br />
20 cm layer. In the 20–40 cm layer the amount of C of this fraction slightly increased and the<br />
share of total C in soil also increased in comparison to the control without fertilization.<br />
The long-term application of high nitrogen norms lead to an increase in the humus mobility. It<br />
was also established that fertilization with moderate and high nitrogen norms increased the<br />
C ha : C pa ratio, as well as the humic acid content linked with Ca, especially in the 0–20 cm<br />
layer. The amount of non-hydrolysable residue (humin) also increased with the increase<br />
mainly of the nitrogen fertilization norm. In the variants dressed with moderate and high<br />
nitrogen norms the humus type was markedly humatic.<br />
Table 3: Group and fraction composition of humus - % C in sample<br />
Variants of<br />
fertilization<br />
Soil<br />
depth cm<br />
1 N 0 P 0 K 0 0 – 20<br />
20–40<br />
3 N 120 P 0 K 0 0 – 20<br />
20–40<br />
15 N 120 P 60 K 0 0 – 20<br />
20–40<br />
28 N 0 P 120 K 120 0 – 20<br />
20–40<br />
40 N 120 P 120 K 120 0 – 20<br />
20–40<br />
48 N 180 P 180 K 120 0–20<br />
20–40<br />
A 5%<br />
1%<br />
0.1%<br />
B 5%<br />
1%<br />
0.1%<br />
Total C<br />
% in soil C% in solution of Na 4 P 2 O 7 +<br />
NaOH<br />
1.70<br />
1.65<br />
1.82<br />
1.81<br />
1.85<br />
1.78<br />
1.80<br />
1.81<br />
1.83<br />
1.71<br />
2.07<br />
1.75<br />
0.0401<br />
0.0603<br />
0.0810<br />
0.0232<br />
0.0327<br />
0.0467<br />
С ha :С fa<br />
C of HA in % to the<br />
total C of HA<br />
connected with<br />
Total HA FA R 2 O 3 Ca<br />
0.90<br />
0.84<br />
0.91<br />
0.95<br />
0.95<br />
0.90<br />
0.95<br />
0.94<br />
0.99<br />
0.94<br />
1.06<br />
0.94<br />
0.0513<br />
0.0726<br />
0.1036<br />
0.0296<br />
0.0419<br />
0.0598<br />
0.6515<br />
0.5701<br />
0.6244<br />
0.7330<br />
0.6244<br />
0.6515<br />
0.6515<br />
0.6787<br />
0.6515<br />
0.7330<br />
0.7058<br />
0.6787<br />
0.0441<br />
0.0623<br />
0.0890<br />
0.0255<br />
0.0360<br />
0.0513<br />
0.2441<br />
0.2712<br />
0.2848<br />
0.2169<br />
0.3255<br />
0.2441<br />
0.2984<br />
0.2576<br />
0.3391<br />
0.2034<br />
0.3527<br />
0.2577<br />
0.0800<br />
0.1004<br />
0.1433<br />
0.0410<br />
0.0580<br />
0.0827<br />
2.67<br />
2.10<br />
2.19<br />
3.38<br />
1.92<br />
2.67<br />
2.18<br />
2.64<br />
1.92<br />
3.60<br />
2.00<br />
2.63<br />
0.66<br />
0.93<br />
1.33<br />
0.38<br />
0.54<br />
0.77<br />
0.1954<br />
0.1439<br />
0.2308<br />
0.2063<br />
0.2307<br />
0.1873<br />
0.2389<br />
0.2009<br />
0.2308<br />
0.1737<br />
0.3393<br />
0.1819<br />
0.0270<br />
0.0381<br />
0.0550<br />
0.0156<br />
0.0220<br />
0.0314<br />
0.4561<br />
0.4262<br />
0.3936<br />
0.5267<br />
0.3937<br />
0.4642<br />
0.4126<br />
0.4778<br />
0.4207<br />
0.5593<br />
0.3665<br />
0.4968<br />
0.05792<br />
0.08187<br />
0.01169<br />
0.0334<br />
0.0473<br />
0.0675<br />
C % in<br />
humin<br />
0.8009<br />
0.8100<br />
0.9117<br />
0.8597<br />
0.9049<br />
0.8801<br />
0.8484<br />
0.8733<br />
0.8416<br />
0.7715<br />
1.0112<br />
0.8167<br />
0.06464<br />
0.09138<br />
0.13047<br />
0.0373<br />
0.0528<br />
0.0753<br />
The long-term mineral fertilization increased C values of the non-hydrolysable residue which<br />
is the humus component most strongly linked with soil minerals. This increase concerns<br />
mainly the 0-20 cm layer in fertilization with N 180 P 180 K 120 , while the changes in the 20-40 cm<br />
layer are insignificant.<br />
The obtained results determine the degree of humification of organic matter as high and very<br />
high. The content of “free” humic acids is determined as medium, and the content of humic<br />
acids linked with Ca is also medium in fertilization with high norms in the 0-20 cm layer,<br />
regardless of the norms of mineral dressing. The ratio C hc :C fa determines the humatic type of<br />
<strong>Vol</strong>. 2 Page - 422 -
15th IHSS Meeting- <strong>Vol</strong>. 2<br />
humus in the control without fertilization, and in all studied variants of fertilization. The<br />
humus in the 0-20 cm layer is of fulvic-humatic type in variants 15 and 40.<br />
4. Conclusions<br />
As a result from a 30 year dressing with mineral fertilizers, a considerable differentiation was<br />
established in the soil nitrogen and humic content both along the soil profile and according to<br />
the combination of applied nutrition elements. The fertilization variant N 180 P 180 K 180 had the<br />
highest humic content - 3.51 % in the 0-20 cm layer, and 3.35 % in the 20-40 cm layer. This<br />
consecutively lead to accumulation of highest humus reserves in Haplic chernozems.<br />
Total nitrogen content in soil varied from 0.184 to 0.220 % according to the fertilization<br />
norms and the profile depth. Highest reserves of total nitrogen were formed in the variants<br />
with N 60 P 0 K 0 , N 60 P 60 K 0 and N 120 P 60 K 0 . The degree of nitrogen concentration in humus within<br />
the limits of the trial was determined as moderate for the whole root-deep layer. In the 20-40<br />
cm layer, however, it tended to be high in the variants with independent nitrogen fertilization,<br />
regardless of the fertilization norm. The long-term application of high nitrogen norms lead to<br />
an increase in the humus mobility. It was also established that fertilization with moderate and<br />
high nitrogen norms increased the C ha : C pa ratio, as well as the humic acid content linked<br />
with Ca, especially in the 0-20 cm layer. The amount of non-hydrolysable residue (humine)<br />
also increased with the increase mainly of the nitrogen fertilization norm. In the variants<br />
dressed with moderate and high nitrogen norms the humus type was markedly humatic.<br />
References<br />
1. Belchikova N.P., 1975. Determining Soil <strong>Humus</strong> by Method of I.V.Tyurin, Agrochemical Methods for Soil<br />
Study, Moskva, Nauka, 52-62<br />
2. Kononova M.M., N.P. Belchikova, 1961. Rapid methods of determining the humus composition of mineral<br />
soil. Sov. Soil.Sei. 10,75-87<br />
3. Nankova M., I. Kalinov, 1992 - Effect of Soil Tillage Systems on the <strong>Humus</strong> Condition of the Black Earth<br />
Under Low Irrigation in Dobroudja, , Soil Science, Agrochemistry and Ecology, v. XXVII, No 2, 40 - 43<br />
4. Nankova M., 1994 - <strong>Humus</strong> Fraction Composition of the Slightly Leached Chernozem Depending on<br />
Duration of Fertilization and Rotation Type, I. Influence of the Mineral Fertilization, Soil Science and<br />
Strategy for Sustainable Agriculture, Proceeding of the Fifth National Conference with International<br />
Participation, 10-13 May, Sofia, BULGARIA)<br />
5. Nankova M., T. Tonev, L. Stereva, 1994 - <strong>Humus</strong> Fraction Composition of the Slightly Leached Chernozem<br />
Depending on Duration of Fertilization and Rotation Type, II. Influence of the Rotation Type, Soil Science<br />
and Strategy for Sustainable Agriculture, Proceeding of the Fifth National Conference with International<br />
Participation, 10-13 May, Sofia, BULGARIA<br />
6. Nankova M., P.Yankov, 1997. Effect of Chiselling in Crop rotation on the Humic Condition of Slightly<br />
Leached Chernozem. XXVII ESNA Annual Meeting, Gent, 29 August - 2 September, Gent, Belgium.<br />
7. Orlov D.S., L.A.Grishina, 1981. Practices in <strong>Humus</strong> Chemistry, Moskva<br />
8. Penchev, E., 1998. Estimation of the productivity and wheat qwality indeces by mathematical models.<br />
Doctoral thesis.<br />
9. Ponomareva V.V., T.A., Plotnikova 1975. Methods for determining humus content and composition in soil,<br />
L<br />
<strong>Vol</strong>. 2 Page - 423 -
15th IHSS Meeting- <strong>Vol</strong>. 2<br />
Factors Affecting the Soil Organic Matter Restoration by Amendment<br />
Application in Arid Zones of Argentina<br />
Abril A. * , Noe L.<br />
Microbiología Agrícola, Facultad de Ciencias Agropecuarias, Universidad Nacional de<br />
Córdoba. cc 509. 5000. Córdoba, Argentina.<br />
E-mail: aabril@agro.unc.edu.ar<br />
1. Introduction<br />
The irrigated agriculture in drylands promotes soil organic matter (SOM) losses. Therefore,<br />
soils are usually treated with organic amendments (compost, vermicompost and manure) with<br />
the aim of restoring SOM content, enhancing the humification processes. However, the<br />
success of this practice is not widely conclusive. We conducted a comparative analysis among<br />
four assays stablished in the irrigation areas of Mendoza (Argentina), in order to determine<br />
the most adequate application technique to restore the soil C fractions in arid regions.<br />
2. Materials and Methods<br />
We processed data (n = 92) of four experiments with different organic amendment application<br />
systems (amendment type, mixture with chemical fertilizers, frecuency and doses of<br />
application, and application technique) (Table 1). The experiments were conducted in<br />
agricultural farms in the most important irrigated area (350,000 ha) in Argentina located in the<br />
central-western region in the Mendoza province. This area is characterized by arid conditions,<br />
with an annual precipitation of 250 mm, a mean temperature in summer of 25ºC and a mean<br />
temperature in winter of 10ºC. The soil is typic Torrifluvent, sandy-loam, with low SOM<br />
content [1].<br />
Soil sampling design was similar for all the experiments: a) soil samples composites (5<br />
subsamples), 0-20 cm depth; b) four replications for each treatment; and c) control soils<br />
(without amendments).<br />
In soil samples, the SOM, by the wet-digestion method of Walkley-Black [2], and the humic<br />
(HA) and fulvic acids (FA) according Jouraiphy et al. [3] were evaluated, and non humified<br />
SOM was considered as bioavailable organic matter (BOM) [4]. To compare the effect of the<br />
treatments evaluated, percentage of data variation refered to control soils was statistically<br />
analyzed with ANOVA, by applying the function y^<br />
= arcsin y.<br />
<strong>Vol</strong>. 2 Page - 424 -
15th IHSS Meeting- <strong>Vol</strong>. 2<br />
Table 1: Organic matter restoration assays in irrigation areas of Mendoza, Argentina<br />
Experiment<br />
Cases<br />
(n)<br />
Experimental sites<br />
1 18 Fray Luis Beltrán<br />
33° 01’ 02” S<br />
68° 38’ 58” W<br />
2 14 Fray Luis Beltrán<br />
33° 01’ 02” S<br />
68° 38’ 58” W<br />
3 48 Lujan de Cuyo I<br />
32º 58’ 48’’ S<br />
68º 50’ 23’’ W<br />
4 12 Lujan de Cuyo II<br />
32º 59’ 05’’ S<br />
68º 51’ 06’’ W<br />
Date<br />
(year)<br />
Crop<br />
2005 garlic<br />
Amendment treatments<br />
manure – vermicompost withwithout<br />
fertilizers one-two<br />
applications 4 – 8 - 14 - 24 Mg<br />
ha -1 incorporated – watering<br />
2006 garlic manure – vermicompost with -<br />
without fertilizers one-two<br />
applications 4 – 8 - 14 - 24 Mg<br />
ha -1 incorporated – watering<br />
2005-2006 grape compost – vermicompost onetwo<br />
applications 4 - 8 Mg ha -1<br />
surface – covering<br />
2005-2006 grape compost – vermicompost onetwo<br />
applications 8 Mg ha -1<br />
surface – covering<br />
3. Results and Discussion.<br />
The SOM content increased in 40% of the total analyzed situations and no variations were<br />
observed in the rest of situations, whereas the FA and BOM contents also increased in aprox.<br />
40% of the cases but decreased in the 30% of the total cases. Contrarily, the HA content<br />
showed a greater percentage of cases with losses than with increases (39% vs. 26% of the<br />
total cases).<br />
These results indicate that soil labile C fractions are responsible for the increases in SOM<br />
content, and agrees with Lejon et al. [5], who stated that increases in soil FA after amendment<br />
applications are greater than increases in soil HA, except when composted materials have<br />
high lignin content.<br />
The differences between crops detected in SOM (Figure 1) can be explained by agricultural<br />
practice and amendment application techniques. In this sense, grape is a perennial crop<br />
cultivated for 200 years in this area (Luján de Cuyo), and it is irrigated by Mendoza river<br />
water. Contrarily, garlic is an annual crop planted in new agricultural lands (Luis Beltrán),<br />
irrigated by municipal wastewater. Accordingly, garlic soils receive labile C fractions through<br />
irrigation and undergo a greater tillage than grape soils, which leads to higher C losses [6].<br />
<strong>Vol</strong>. 2 Page - 425 -
15th IHSS Meeting- <strong>Vol</strong>. 2<br />
incorporated<br />
garlic<br />
surface<br />
watering<br />
covering<br />
grape<br />
-20 0 20 40 60<br />
variation (%)<br />
-20 0 20 40 60<br />
variation (%)<br />
Figure 1: SOM variation (%) between amended and control soils, according to application techniques<br />
and crops<br />
Moreover, the significant increases in SOM and BOM in covering application (Figures 1 and<br />
2) are related to the absence of tillage, which reduces C mineralization [5]. Nevertheless, the<br />
same effect was not detected in HA, which increased in surface applications (Figure 3),<br />
probably related to the lack of contact between amendment-soil microorganisms, that leads to<br />
lower degradation rates of the amendment . In this sense, it is widely accepted that low<br />
degradation rates favour the humification process [4].<br />
incorporated<br />
surface<br />
garlic<br />
watering<br />
covering<br />
-20 0 20 40 60<br />
variation (%)<br />
grape<br />
-20 0 20 40 60<br />
variation (%)<br />
Figure 2: BOM variation (%) between amended and control soils, according to application techniques<br />
and crops<br />
incorpora ted<br />
surfac e<br />
garlic<br />
watering<br />
covering<br />
grape<br />
-30 0 30 60 90<br />
variation (%)<br />
-20 0 20 40 60<br />
variation (%)<br />
Figure 3: HA variation (%) between amended and control soils, according to application techniques<br />
and crops<br />
<strong>Vol</strong>. 2 Page - 426 -
15th IHSS Meeting- <strong>Vol</strong>. 2<br />
4. Conclusions.<br />
We concluded that: a) the amendments increase SOM contents, except in strongly tillaged<br />
soils; and b) the surface amendment application is the most effective practice in order to<br />
increase the humified fractions in soil, but its effect is short-lasting. Accordingly, for a better<br />
recovery of soil C levels we recommend a greater number of applications and higher doses<br />
than those evaluated in these assays.<br />
Acknowledgements.<br />
We grateful to INTA Mendoza (PVN04) and Universidad Nacional de Cuyo (658/05-R) for<br />
financial support.<br />
References.<br />
1. R.R. Hudson, A. Alaska, H.T. Masotta and A. Muro, in Atlas de Suelos de la República Argentina.<br />
INTA-CIRN/PNUD, Buenos Aires, 1990, p. 71.<br />
2. D.W. Nelson and L.E. Sommers, in A.L.Page, R. Miller and D. Keeney (Eds.), Methods of Soil<br />
Analysis. Chemical and Microbiological Properties, ASASS, Madison, 1982, p. 539.<br />
3. A. Jouraiphy, S. Amir, M. El Gharous, J.C. Revel and M. Hafidi, Int. Biodeterior. Biodegrad., 56<br />
(2005) 101.<br />
4. A. Abril, P. Villagra and L. Noe, J. Arid Environ., 73 (2009) 901.<br />
5. D.P.H Lejon, J. Sebastia, I. Lamy, R. Chaussod and L. Ranjard, Microb. Ecol., 53 (2007) 650.<br />
6. M. Tejada and J.L. González, Soil Till. Res., 91 (2006) 186.<br />
<strong>Vol</strong>. 2 Page - 427 -
15th IHSS Meeting- <strong>Vol</strong>. 2<br />
Anaerobic Degradation of Aromatic Compounds in Humification<br />
Kari Hänninen<br />
University of Jyväskylä, Department of Biological and Environmental Sciences, P.O Box 35,<br />
40014 University of Jyväskylä, Finland<br />
E-mail: kari.i.hanninen@jyu.fi<br />
1. Introduction<br />
Until recently it has been thought that aromatic st<strong>ru</strong>ctures were not degradable without oxygen, so<br />
aromatic compounds are thought to be persistent in humification as well. It is very well known<br />
that carbohydrate compounds are disappearing rather rapidly when they are put in a bag into soil.<br />
On the basis of these indirect results it has been concluded that 1) lignin would be more persistent<br />
than carbohydrates, and 2) in anaerobic conditions aromatic compounds would not degrade in<br />
humification. As a corollary of 1) and 2) would follow that aromatic compounds would be more<br />
important as source material for humic substances than carbohydrates and 4) humus polymers<br />
must have an aromatic core st<strong>ru</strong>cture.<br />
These statements were deduced already during the 1920´s. Since then they have remained the<br />
corner stones of the humus chemistry. However, by direct chemical degradation and by analysing<br />
studies of the degradation products, the aromatic character cannot be confounded. Yields of<br />
aromatic degradation products have in all studies remained at a rather low level of 2–5 % from the<br />
total amount of the starting material.<br />
In environmental technology anaerobic degradation of all kinds of pollutants, including aromatic<br />
compounds, is considered an important topic. Now there are plenty of experimental data which<br />
shows that aromatic compounds are degrading in anaerobic conditions by microbes. An<br />
evolutionary view of studying the issue is helpful as well. It widens the scope and helps to put<br />
pieces together in right time order.<br />
2. Materials and methods<br />
Biodegradation of aromatic compounds in humification, the recalcitrance of lignin and that of<br />
carbohydrates was studied by analysing evolutionary aspects, scientific literature and common<br />
sense. On the basis of the results, it is reasoned the importance of aliphaticity/aromaticity<br />
contribution to humic substances.<br />
3. Results and discussion<br />
Methods of aerobic degradation of aromatic compounds in the biosphere are well understood.<br />
However, it has been relatively recently shown how some bacteria can also degrade these<br />
<strong>Vol</strong>. 2 Page - 428 -
15th IHSS Meeting- <strong>Vol</strong>. 2<br />
substrates in the absence of molecular oxygen.<br />
Microbial metabolism in the absence of oxygen is dominated by the nature of the available<br />
electron acceptor or hydrogen sink. Nitrate, ferric ion, sulphate, and carbon dioxide serve as the<br />
preferred electron acceptor for the denitrifying, iron reducing, sulphate reducing, and<br />
methanogenic bacteria respectively. In the reactions benzene nucleus is first reduced and then<br />
cleaved by hydrolysis to yield aliphatic acids for cell growth. Some microorganisms found in soils<br />
and sediments are able to use humic substances as an electron acceptor for the anaerobic oxidation<br />
of organic compounds and hydrogen. This electron transport yields energy to support growth [1].<br />
Anaerobic degradation of benzoic acid [2] proceeds by two pathways: 1) via pimelic acid, and 2)<br />
via adipic acid. Both involve reduction (saturation) of the aromatic ring and incorporation of<br />
oxygen from water leading to an enol prior to ring cleavage. By reduction of the aromatic ring the<br />
resonant electron distribution is destabilized. The phototrophic nonsulfur bacterium<br />
Rhodopseudomonas attacks benzoic acid by the pimelic pathway, using coenzyme A as a<br />
cofactor. The pathway resembles the β-oxidation of fatty acids. Oxygen inhibits this degradation<br />
as it does other ring cleavage pathways as well.<br />
Anaerobic degradation of naphtol, naphthalene, and acenaphtalene under denitrification<br />
conditions but not sulphate-reducing conditions has been observed in freshwater-soil slurries<br />
using radiolabeled PAHs and recovery of 14 CO 2 [3]. Naphtalene, phenanthrene, and biphenyl were<br />
degraded under nitrate- and sulphate-reducing conditions in enrichments from marine sediments<br />
[4, 5]. Numerous other experimental studies with ring-labeled radioactive carbon show equally the<br />
cleavage of aromatic ring in anaerobic conditions.<br />
Cleavage of aromatic ring takes place even in plants. Mithaisvili et al. [6] applied aromatic<br />
pollutants [1-6- 14 C]-aniline, [1- 14 C]- and [7- 14 C] –benzoic acids to maize (Zea mays L.), kidney<br />
bean (Phaseous vulgaris L., pea (Pisum sativum L.) and pumpkin (Cucurbita pepo L.). In the<br />
plants the xenobiotics were transformed by oxidative or reductive reactions, conjugation with cell<br />
endogenous compounds and binding to biopolymers. Ring cleavage was proved by the evolution<br />
of 14 CO 2 .<br />
Evolutionary considerations. In the evolution of life anaerobic microbes (archaebacteria) were the<br />
first important group of organisms to reshape the primitive world. During those days sources of<br />
available carbon may have been scarce. However, the anaerobic microbes were powerful enough<br />
to utilize carbon dioxide as their sole carbon source, if hydrogen was present, in the following<br />
way [7]:<br />
CO 2 + 4H 2 CH 4 + 2H 2 O<br />
<strong>Vol</strong>. 2 Page - 429 -
15th IHSS Meeting- <strong>Vol</strong>. 2<br />
The bond energy of carbon dioxide is 187 kcal/mole, so microbes need hydrogen in excess to be<br />
able to carry out the reaction.<br />
During the evolution carbohydrates were formed first. Then plant life was based on the<br />
carbohydrate st<strong>ru</strong>ctures. Lignin was formed later on after carbohydrates. Lignin was of<br />
revolutionary importance to the plants. It allowed trees to grow higher and conquer the terrestrial<br />
environment even in cold climatic zones. While it intensified plant life, animal life was intensified<br />
as well.<br />
We may presume that humification has been working since the very beginning of the life.<br />
Paleopedological evidences reflect that humification formed humus and soil from lignin free<br />
plants [8].<br />
The bond energy of C=C is 116 kcal/mole, much weaker than that of carbon dioxide which<br />
microbes were utilizing eons before lignin appearance. So it is relevant to presume that anaerobic<br />
microbes started to consume aromatic st<strong>ru</strong>ctures of lignin once they were available. From<br />
microbial point of view lignin was just one additional source of rather easy energy, because they<br />
did not need any outside energy source while utilizing aromatic compounds as their carbon<br />
source. So for humification process lignin did not pose any challenge to “modernize” its<br />
functions.<br />
By the laws of chemistry those carbohydrate compounds in the bag put into soil are not vanishing<br />
in the thin air. They are partly transferred to bacterial biomass as carbohydrates, partly remained<br />
in soil, and partly mineralized. Transformation brings carbohydrates a kind of functional<br />
recalcitrance, they are recycling in humification. Lignin, on the contrary is a disposable item in<br />
humification, once it has entered to the process, it is not forming again. So we may reason that<br />
carbohydrates are more recalcitrant in humification than lignin, and so more important as their<br />
st<strong>ru</strong>ctural components. It strongly suggests an aliphatic basic st<strong>ru</strong>cture for humic substances.<br />
Humification can be regarded as an abiotic and biotically induced mineralization reaction of dead<br />
organic matter in various aquatic and terrestrial environments. Biotic factors, especially<br />
microbiological degradation can be regarded as a <strong>ru</strong>ling factor, especially for fresh organic matter.<br />
The more humification proceeds and humus particles mix with various soil/sediment constituents,<br />
the more abiotic factors, like catalytic reactions take a role in humification. It seems that humus<br />
colloids are “eating” mineral matter. In alkali extraction of humus substances, one may observe<br />
that during a certain stage of extraction mineral matter appears on the bottom of the bottles. It<br />
precipitates from humus into its own fraction. So, the contact of humus and mineral matter is very<br />
close and long lasting. There certainly is time for catalytic reaction to take place. The reciprocal<br />
action of abiotic and biotic humification may be important, so that during/after catalytic<br />
<strong>Vol</strong>. 2 Page - 430 -
15th IHSS Meeting- <strong>Vol</strong>. 2<br />
degradation of humus and of those particles remained in soil after first microbilal attacks may be<br />
degraded further as result of biotic reactions.<br />
The finding of Evans et al. that microorganisms can donate electrons to humic acids has important<br />
implications for the mechanisms by which microorganisms oxidize both natural compounds and<br />
xenobiotic pollutants in anaerobic soils and sediments. Microbial humic reduction also enhances<br />
the capacity for microorganisms to reduce other, less accessible electron acceptors, such as<br />
insoluble Fe(III) oxides, because humic substances can shuttle electrons between the humicreducing<br />
microorganisms and the Fe(III) oxide [1].<br />
In terms of growth effects aromatic compounds are regarded rather toxic than helpful to the<br />
plants. A black coal heap in a power plant, for example, is not sustaining the growth of plants. We<br />
know that humus is very important to the growth of plants. There is no explanation why<br />
aromaticity in humus would behave differently than usually in this respect? It seems more logical<br />
to suppose that evolution has generated highly aliphatic humus in order to ensure the best possible<br />
growth effect to the plants.<br />
4. Conclusions<br />
By evolutionary studies, literature survey and by sound reasoning it can be stated beyond doubt<br />
that aromatic compounds are degrading microbiologically in anaerobic conditions. The catalytic<br />
abiotic reaction may also degrade aromatic st<strong>ru</strong>ctures. One may state that ring cleavages are quite<br />
natural phenomena in nature. Humic substances are dynamically involved in microbial<br />
metabolism, especially in anoxic habitats. Precursors of humic substances are so accumulating as<br />
aliphatic compounds. It implies that their basic chemical characteristic would be aliphatic by<br />
nature.<br />
There is in humus chemistry an urgent need to understand this fact. The theories need to reshape<br />
accordingly. Now there is an imminent danger that the search of aromatic core units of humus is<br />
not leading to any const<strong>ru</strong>ctive solution. One cannot find something that does not exist.<br />
References<br />
1. D. R. Lovley, J. D. Coates, E. L. Blunt-Harris, E. J. P. Phillips and J. C. Woodward., Nature, 382 (1996),<br />
445-448.<br />
2. W. C. Evans, Nature, 270 (1977), 17-22.<br />
3. J. R. Mihelcic and R. G. Luthy, Appl. Environ. Microbiolol. 54 (1988), 1182-1187<br />
4. K. J. Rokne and S. E. Strand, Environ. Sci. Technol., 62 (1998), 3962-3967.<br />
5. J. D.Coates, R. T. Anderson and D. R. Lovely, Appl. Environ. Microbiol., 62 (1996), 1099-1101.<br />
6. T. Mithaisvili, R. Scalla, D. Ugrekhelizde. B. Tsereteli, T. Sadunisvili and G. Kvesitadze, Zeitschrift für<br />
Naturforschung, 60 (2005) 97-102.<br />
7. M. Stephenson and L. H. Stickland, Biochem J., 27 (1933), 1517-1528.<br />
8. G. J. Retallack, Soils of the Past. An introduction to paleobiology, Unwin Hyman, London, 1990, 293.<br />
<strong>Vol</strong>. 2 Page - 431 -
15th IHSS Meeting- <strong>Vol</strong>. 2<br />
Assessment of <strong>Humus</strong> Substances from Selected Sources and Organic<br />
Wastes Prospects for Utilizing in Fertilization<br />
Marta Huculak-Mączka * , Krystyna Hoffmann, Józef Hoffmann<br />
Institute of Inorganic Technology and Mineral Fertilizers, Wrocław University of<br />
Technology, ul. Smoluchowskiego 25, 50-372 Wrocław, Poland<br />
E-mail: marta.huculak@pwr.wroc.pl<br />
1. Introduction<br />
The content of organic substance in soils is different depending on its kind. In every type of<br />
the soil it is undergoing constant bio-transformations or more or less intense degradation. The<br />
process of the mineralization of organic substance causes its decay, and in consequence<br />
deteriorates conditions of plants growth and development. Low contents of the organic<br />
substance contained in the soil influences unfavourably its st<strong>ru</strong>cture, sorption and buffer<br />
properties, aqueous-air and biological conditions. Moreover insufficient level of organic<br />
substance and applying extensive mineral fertilizing simultaneously induces fertilizer<br />
compounds leaching. This phenomenon can in consequence contribute to degradation of the<br />
natural environment, disturbance of the ion equilibrium in the soil, the water eutrophication<br />
and contamination of the agricultural production [1, 3, 6].<br />
Applying organic matter in the form of fertilizers, particularly humus preparations, is essential<br />
for maintaining the content of organic matter on the proper level. The life cycle of organic<br />
substance in the soil, derived from natural and organic fertilizers and plants is insignificant.<br />
Due to increasing requirements of the environmental protection, connected with principles of<br />
sustainable development, as well as from economical accounts the appropriate source of<br />
humus substance, permanently improving the quality of soils is now being investigated. The<br />
agricultural and industrial wastes can be included to unconventional sources of humus<br />
compounds and nutrients. Using them as components in the production of mineral-organic<br />
preparations is a rational way of these wastes management [6].<br />
2. Materials and Methods<br />
Present agriculture similarly to different economic branches, has an immense influence on the<br />
condition of the natural environment. In accordance with the statement mentioned above, the<br />
idea of the fertilizing process should concentrate on increasing the productivity of the<br />
agricultural production with the synchronized with waste management originating from<br />
<strong>Vol</strong>. 2 Page - 432 -
15th IHSS Meeting- <strong>Vol</strong>. 2<br />
different branches of industry. Thus processing wastes into high performance mineral-organic<br />
fertilizers is necessary.<br />
The following samples, among alternative sources of humus substances, were investigated:<br />
poultry droppings, starch factory sludge, hop wastes, two kinds of the lignite coal and<br />
activated sludge. The assessment of the possibility of using these substances and organic<br />
wastes in the agriculture were evaluated by analyzing the contents of organic carbon as well<br />
as humic acid (HA) and fulvic acid (FA). Methods used for this purpose are standard<br />
analytical techniques applied in soil science [2, 4–6].<br />
Determination of organic carbon content (C). The content of organic carbon was determined<br />
using Tiurin method. It consists in oxidizing the organic carbon contained in examined<br />
samples by solution of potassium dichromate, in the presence of the sulphuric acid as catalyst.<br />
The excess of potassium dichromate is subsequently titrated using solution of hydrated<br />
ammonium iron(II) sulphate in the presence of ferroine as the indicator [5].<br />
Determination of HA and FA contents. In order to fractionation of humus substances the<br />
method of M. Kononowa and N. Bielczikowa were applied. It consists in the extraction of<br />
humus substances contained in investigated material with mixture of sodium pyrophosphate<br />
and the sodium hydroxide. This method is included to indirect methods on account of the fact<br />
that determining the quantitative ratio of individual fractions undergoes by determining on of<br />
its components, in this case of organic carbon in individual fractions [2].<br />
Additional test were carried out in order to closer examination of particularly interesting and<br />
prospective research materials. As part of examinations total and free contents of HAs of two<br />
kinds of the lignite coal were analyzed.<br />
Determination of total and free HAs contents (Total and free HA). Contents of HAs contained<br />
in the lignite coal were evaluated according to the Polish Standard PN-89/G-97051/16. Total<br />
HAs are a sum of both free HAs and bound in the form of salt of calcium, magnesium, iron<br />
and other metals (humates). The method is based on the single or double alkaline extraction of<br />
the lignite coal and precipitating HAs from combined extracts using mineral acids, separating<br />
deposit, drying off and weighing [4].<br />
3. Results and Discussion<br />
Results of the content of HAs and FAs as well as organic carbon in investigated materials are<br />
printed in Table 1.<br />
<strong>Vol</strong>. 2 Page - 433 -
15th IHSS Meeting- <strong>Vol</strong>. 2<br />
Table 1: HAs and FAs as well as organic carbon in investigated materials<br />
Sample<br />
Organic carbon<br />
content<br />
[wt. %]<br />
C org content in<br />
HA fraction<br />
[%]<br />
Humic acids<br />
content [%]<br />
C org content in<br />
FA fraction<br />
[%]<br />
Fulvic acids<br />
Content<br />
[%]<br />
Poultry droppings 58.16 8.53 14.67 0.48 0.83<br />
Starch factory<br />
sludge<br />
5.21 1.04 19.96 0.22 4.22<br />
Hop wastes 60.80 15.14 24.90 1.01 1.66<br />
Lignite coal–<br />
Turów<br />
Lignite coal–<br />
Bełchatów<br />
68.20 21.36 31.32 2.03 2.98<br />
77.40 28.16 36.38 2.87 3.71<br />
Activated sludge 39.85 3.12 7.83 0.29 0.73<br />
The composition of unconventional raw materials and organic wastes is highly diversified and<br />
depends on their origin. The content of organic carbon in raw, unprocessed samples is much<br />
higher than the one determined in every extracted fraction of humus substances. Differences<br />
in contents of organic carbon in individual analytes can suggest that investigated materials<br />
contain apart from humus compounds also different sources of organic carbon.<br />
Lignite coal particularly its earthy form originating from the Bełchatów coalfield are<br />
characterized by essential contents of organic carbon and humus compounds. Considerable<br />
contents of humus substances in tested material indicate that using it as the alternative<br />
fertilizer component is reasonable. Possibility of using the lignite coal in fertilizing also<br />
results from its peculiar physical and chemical properties and from big prospectivity of<br />
applying it. Results obtained from analysis of the lignite coal seem to be reliable and similar<br />
to data found in related literature. However information about the content of HAs and FAs in<br />
remaining, examined materials aren't confirmed in comparison with related literature and it is<br />
possible to speculate, that obtained results of the content of organic carbon in every extracted<br />
fraction of humus substances originate from different, humus-less organic substances. The<br />
values of gained results can be influenced by a analytical techniques applied for particular<br />
method of examination. Using strong extractant which is NaOH for determination of humus<br />
acids constitutes a fundamental reservation for this method. This procedure can cause increase<br />
in organic carbon real contents contained in fractions by the unnatural way, and in<br />
consequence falsify the final result of the contents of humus substances.<br />
Authenticity of contents of humus substances in the lignite coal was confirmed during<br />
analysis of determining free and total Has according to Polish Standard PN-89/G-97051/16.<br />
<strong>Vol</strong>. 2 Page - 434 -
15th IHSS Meeting- <strong>Vol</strong>. 2<br />
These examinations allowed extracting from the lignite coal of free HAs in the amount of the<br />
14.57% for the lignite coal originating from Turów and 18.15 % for the lignite coal from<br />
Bełchatów. A content of total HAs reached 29.22 % and 37.23 % respectively what lets state<br />
that studied materials constitute the good source of humus substances for agricultural<br />
applications.<br />
4. Conclusions.<br />
The diversity of directions and the scale of alterations in the natural environment, resulting<br />
from modern, chemical methods for increasing the agricultural output as well as tightening<br />
environmental requirements, induce the search for natural sources and ecological methods for<br />
fertilizer manufacturing. Alternative fertilizer components should contain especially<br />
significant amount of organic substances, particularly of humus-type, as well as macro and<br />
micronutrients. Their presence improves both balance of organic matter and the properties of<br />
soils.<br />
Results of the content of organic carbon in suggested sources and organic wastes allow the<br />
conclusion that these components applied in mineral-organic preparations are able to induce<br />
beneficial changes in ground characteristics. The most promising component of humus<br />
preparations, on account of large contents of HAs and prospectivity for intensifying its<br />
desirable properties, is a lignite coal.<br />
References<br />
1. E. A. Ghabbour and G. Davies, Humic Substances: Molecular Details and Applications in Land<br />
and Water Conservation, Taylor & Francis, Inc., New York, 2005, 243–256.<br />
2. E. Myślińska, Laboratoryjne badanie g<strong>ru</strong>ntów, Wydawnictwo Naukowe PWN, Warszawa, 3 rd ed.,<br />
2001, 187–203.<br />
3. F. J. Stevenson, <strong>Humus</strong> Chemistry: Genesis, Composition, Reactions, 2nd Ed. Wiley, New York,<br />
1994 1–57.<br />
4. Polska Norma PN-89/G – 97051/16 Oznaczanie zawartości kwasów huminowych w węglu<br />
b<strong>ru</strong>natnym.<br />
5. Polska Norma PN-Z-15011-3:2001, Oznaczanie zawartości węgla organicznego.<br />
6. R. Bednarek and H. Dziadowiec and U. Pokojska and Z. P<strong>ru</strong>siewicz, Badania ekologicznogleboznawcze,<br />
PWN, Warszawa, 1 st ed., 2004, 132–173.<br />
<strong>Vol</strong>. 2 Page - 435 -
15th IHSS Meeting- <strong>Vol</strong>. 2<br />
Hot-Water Carbon–Extracted with Hot Water Percolation (HWP) – the<br />
Indicator of Compost Maturity Stages<br />
György Füleky<br />
Szent István University, Institute of Environmental Sciences, Department of Soil Science and<br />
Agricultural Chemistry. Gödöllő, Páter K. u. 1. H-2103 Hungary<br />
E-mail: fuleky.gyorgy@mkk.szie.hu<br />
1. Introduction<br />
The water soluble carbon has been proposed by several researchers as a parameter to evaluate<br />
compost evolution because its concentration rapidly decreased with the process. The authors<br />
established the 0.5 % value as a maximum content of water soluble carbon above which a<br />
compost could be considered mature [1].<br />
Observations were made on changes in chemical characteristics of water-extractable organic<br />
matter during composting. UV absorption at 254 nm of bull water extractable organic matter<br />
samples was measured. The measured absorbance was normalized to the concentration of<br />
dissolved organic C giving the specific UV absorption (SUVA 254 ), which serves as an<br />
indicator of the aromatic character of organic matter. During the 250 day composting period<br />
the organic C content of water extractable organic matter decreased significantly from 6.0<br />
mgL -1 for the initial material to 1.5 mgL -1 towards the end of the process. The SUVA 254<br />
values obtained for bulk water extractable organic matter were constant during the first 28d of<br />
composting with an average value of 0.97 Lmg -1 m -1 but subsequently increased steadily to<br />
1.77 and 3.02 Lmg -1 m -1 by day 90 and 250, respectively. Since the UV absorption of organic<br />
solutes is directly proportional to their content of aromatic compounds, these results clearly<br />
show a relative increase in the content of aromatic moieties with composting time [5].<br />
The composition of cold and hot water-extractable organic matter was investigated. The C<br />
concentrations were always lower in the cold (2.69 to 3.95 gkg -1 ), than in the hot-water<br />
extracts (13.77 to 15.51 gkg -1 ) [4].<br />
The concentration of water extractable carbon which included a high proportion of easily biodegradable<br />
organic compounds such as sugars, amino-acids and peptides, decreased during<br />
the composting process to reach values ranging from 0.73. Water extractable carbon exhibited<br />
a slight increase during thermophylic phase, related to bio-oxidation occurring at relatively<br />
high temperature and solubilizing the released carbon; it then reached 0.88. Nevertheless the<br />
previous water extractable carbon values below 1.7 % suggest a high degree of humification<br />
in the composted materials [6].<br />
<strong>Vol</strong>. 2 Page - 436 -
15th IHSS Meeting- <strong>Vol</strong>. 2<br />
The UV absorption of the humic substances was used to evaluate the condensation degree of<br />
the humic aromatic nuclei, indicating its maturity. The absorbance at 280 nm corresponds to<br />
lignin and aliphatic st<strong>ru</strong>cture in humic substances at the beginning of the process. The<br />
absorbance at 472 nm is the result of the organic macromolecules depolymerisation through<br />
microbial decomposition at the humification beginning. The absorbance at 664 nm is<br />
characteristic of high oxygen content and aromatic compounds produced in the stabilization<br />
phase. The progress of the three ratios (E 2 /E 4 , E 2 /E 6 and E 4 /E 6 ) characterizing the degree of<br />
OM maturity.<br />
The absorbance ratio E 4 /E 6 of the humic substances is a traditional parameter to estimate the<br />
degree of humification and/or the molecular size. At the initial stage of composting, large<br />
values of E 4 /E 6 ratio have been associated with the presence of smaller size organic molecules<br />
or more aliphatic st<strong>ru</strong>ctures and usually with a higher content of functional groups. With an<br />
increase in the composting time, the E 4 /E 6 ratio decreased significantly, suggested that the<br />
carbohydrates and the quinones were oxidized and bound to methoxyl groups and/or<br />
alliphantic side chains in humic substances. At the end of composting, an adequate degree of<br />
maturity and stability was achieved by a lower E 4 /E 6 ratio [6].<br />
The aim of this work was evaluate the hot water soluble carbon extracted with Hot Water<br />
Percolation (HWP) as an indicator of compost maturity stages.<br />
2. Materials and Methods<br />
Composting was made on the composting site in Ökörtelek-völgy with the GORE TM COVER<br />
technology. It is a closed system with forced aeration. The cover is a semipermeable membran<br />
which helps to ensure diffusion of gases but retains the heat and water vapor. By the helps of<br />
this technology the process is 4 weeks.<br />
The composting windrow was built from green wastes on 10 October and destroyed on 21<br />
November. The outside temperature was above 10 o C, and from 15 November about 5 o C.<br />
The sampling times were 0, 2. 8, 16, 21, 30, 37 and 42 days after establishing the compost<br />
windrow. The depth of sampling was 40 cm.<br />
Dry matter content, ignition loss (organic-C) and carbon content and spectral properties of<br />
HWP extracts were determined. The hot water percolation (HWP) is a new easily applicable<br />
soil extraction method [2] which was adapted to compost analysis [3]. During hot water<br />
percolation the desorbable, hydrolizable and easily soluble elements and compounds are<br />
extracted by hot water (102-105 o C) at 120-150 KPa [7]. 5 times 100 cm 3 extracts were<br />
<strong>Vol</strong>. 2 Page - 437 -
15th IHSS Meeting- <strong>Vol</strong>. 2<br />
collected and TOC was determined in the solution. The optical density of these solutions were<br />
measured at 254, 465 and 665 nm.<br />
3. Result and Discussion<br />
Table 1: Hot water extracted (HWP)-C and spectral properties of compost materials<br />
Days Org.-C HWP-C Σ HWP-C 254 nm 465 nm 665 nm SUVA E4/E6<br />
% mg L -1 mg L -1 cm -1 cm -1 cm -1 L mg -1 m -1<br />
0 45,4 605,0 1910 6,71 0,310 0,062 1,11 5,11<br />
2 41,02 289,0 807 3,05 0,210 0,056 1,06 3,79<br />
8 20,89 97,6 240 1,52 0,096 0,026 1,56 3,62<br />
16 21,51 133,0 285 1,43 0,144 0,035 1,34 3,21<br />
21 18,78 108,0 233 1,39 0,120 0,044 1,28 2,70<br />
30 20,47 75,7 145 1,15 0,083 0,030 1,53 2,73<br />
37 11,26 49,3 121 1,59 0,075 0,026 3,24 2,80<br />
42 11,83 27,9 86 0,92 0,044 0,025 3,46 1,74<br />
During composting process the amount of total organic carbon significantly decreased (Table<br />
1). At the same time the hot water soluble HWP-C content decreased from 605 mgL -1<br />
measured on the 0 day of composting to 27.9 mgL -1 on the 42. day. It is a strong positive<br />
correlation between the HWP-C content of the first 100 cm 3 fraction and the sum of 5<br />
times/100 cm 3 fractions (R 2 =0,9830). Consequently enough to measure the carbon content<br />
and spectral properties of the first HWP fraction. The measured HWP-C content naturally less<br />
than the measured value at other authors (0.5-1.7 %) [1,6], because the hot water percolation<br />
(HWP) is a fast, one-two minutes long process. Table 1 contains the measured optical density<br />
of HWP extracts at 254, 465 and 665 nm. The changes of HWP-C content during the<br />
maturation process can be seen on Figure 1. and the measured absorbance at 254 nm of these<br />
extracts on Figure 2. It is a very strong linear correlation between the absorbance at 254 nm<br />
and the HWP-C content of extracts (R 2 =0,9545).<br />
The specific UV absorbance of HWP extracts at different maturity stages can be seen on<br />
Figure 3. The tendency of SUVA values is very similar as the results of Said Pollicino et al.,<br />
2007. Their results show a sudden increase of SUVA after the 28. day of composting which<br />
means the maturity of compost. The E4/E6 values on Figure 4 show the same tendency which<br />
was demonstrated by Sellami et al., 2008, when the E4/E6 significantly decreases at the<br />
maturity stage. Both the HWP-C content measured in 100 cm 3 and 5 times 100 cm 3 extracts at<br />
254 nm and also at 465 and 665 nm show a decreasing tendency during maturation process.<br />
<strong>Vol</strong>. 2 Page - 438 -
15th IHSS Meeting- <strong>Vol</strong>. 2<br />
HWP-C mg L -1<br />
700<br />
600<br />
500<br />
400<br />
300<br />
200<br />
100<br />
0<br />
0 5 10 15 20 25 30 35 40 45<br />
Absorbance, 254 nm cm -1<br />
8<br />
7<br />
6<br />
5<br />
4<br />
3<br />
2<br />
1<br />
0<br />
0 5 10 15 20 25 30 35 40 45<br />
Figure 1: Hot-water carbon (HWP-C)<br />
at different maturity stages<br />
Figure 2: Optical density (254 nm) of the<br />
HWP extracts at different maturity stages<br />
4,0<br />
SUVA<br />
6<br />
E4/E6<br />
Lmg -1 m -1 5<br />
3,5<br />
3,0<br />
2,5<br />
2,0<br />
1,5<br />
1,0<br />
0,5<br />
0,0<br />
0 5 10 15 20 25 30 35 40 4<br />
Figure 3: Specific UV absorption (SUVA 254 ) of<br />
the HWP extracts at different maturity stages<br />
5<br />
4<br />
3<br />
2<br />
1<br />
0<br />
0 5 10 15 20 25 30 35 40 45<br />
Figure 4: The E4/E6 values of HWP<br />
extracts at different maturity stages<br />
4. Conclusion<br />
As a conclusion the HWP-C content, the absorbance at 254 nm and the E4/E6 values of hot water<br />
percolation (HWP) extracts very well show and demonstrate the maturity stages of composting<br />
process, in spite of the fast extraction.<br />
References<br />
1. Benito M., Masaguer A., Moliner A., Hontoria C., Almorox J. (2009): Dynamics of puring waste and spent<br />
horse litter co-composting as determined by chemical parameters. Bioresource technology, 100 (1), 497-<br />
500 pp.<br />
2. Füleky Gy. - Czinkota I.: Hot Water Percolation (HWP): - A New Rapid Soil Extraction Method. Plant and<br />
Soil, 157, 131-135. (1993)<br />
3. Füleky Gy., Kovács D., Alexa L., Dér S. (2003): Use of the hot water percolation (HWP) method for<br />
compost analysis. Fourth International Conference of ORBIT. Part. 1 267-275.<br />
4. Landgraf D., Leinweber P., Makeschin F. (2006): Cold and hot water-extractable organic matter as<br />
indicators of litter decomposition in forest soils. Journal Plant Nutrition Soil Sci. 169. 76-82 pp.<br />
5. Said-Pollicino D., Kaiser K., Guggenberg G., Gigliotti G. (2007): Changes in the chemical composition of<br />
water-extractable organic matter during composting: Distribution between stable and labile organic matter<br />
pools. Chemosphere, <strong>Vol</strong>. 66. (11.) 2166-2176. pp.<br />
6. Sellami F., Hachicha S., Chtourou M., Medhioub K., Ammar E. (2008): Maturity assessment of composted<br />
olive mill wastes using UV spectra and humification parameters. Bioresource Technology, 99 (15) 6900-<br />
6907 pp.<br />
7. Takács M., Füleky Gy. (2003): Fluorescence behaviour of dissolved organic matter from soil hot water<br />
percolation (HWP) extracts. Bulletin of the Szent István University, Gödöllő, 63-71. pp.<br />
<strong>Vol</strong>. 2 Page - 439 -
15th IHSS Meeting- <strong>Vol</strong>. 2<br />
Chemical and Physical Soil Properties Under Permanent Grassland by<br />
Organic Manure Application<br />
Marie Svozilova a* , Hana Karabcova b<br />
a Research Institute for Cattle Breeding, Ltd., Rapotin, Vyzkumniku 267, 78813 Vikyrovice,<br />
Czech Republic; b Agroresearch Rapotin, Ltd., Vyzkumniku 267, 78813 Vikyrovice, Czech<br />
Republic<br />
E-mail: marie.svozilova@vuchs.cz<br />
1. Introduction<br />
The most of grassland is situated in less favourable areas (LFA) in the Czech Republic, where<br />
the grazing and cutting are important and traditional agricultural practise. The effect of animal<br />
fertilizers utilization on physical and chemical properties of grassland soil was observed in<br />
foothills of the H<strong>ru</strong>by Jeseniky Mountains. Organic manures serve several important<br />
functions which the inorganic fertilizers do not. Some of these functions are increasing<br />
organic content of the soil, improving physical st<strong>ru</strong>cture of the soil and increasing bacterial<br />
and fungal activity. There is no doubt that organic fertilizers help improve the health and<br />
long-term productivity of soil.<br />
2. Materials and Methods<br />
In 2005 a small plot trial on grassland with organic fertilization management was established<br />
at Research Institute Rapotin in the Czech Republic. The experimental plots are situated in<br />
390 m above sea level and each plot has 12.5 m 2 . The soil is sandy-loam and the type is<br />
Cambisol which is the most extended type in the Czech Republic. Semi natural permanent<br />
grassland is representative for this area. We have used two treatments of animal fertilization<br />
(cow dung + dung water, slurry) with three different pasture loads (0.9 LU·ha -1 , 1.4 LU·ha -1 ,<br />
2.0 LU·ha -1 – 1 load unit is 60 kg N·ha -1 ). The samples for chemical and physical parameters<br />
were taken from depth 0.02–0.15 m and 0.15–0.30 m. Physical properties such as soil bulk<br />
density (ρd, g·cm -3 ), total porosity (P, %), maximum capillary water capacity (Θ MCC , %) were<br />
determined and chemical properties such as soil cation exchange capacity (CEC, mmol c .kg -1 ),<br />
organic carbon content (SOC, mg·kg -1 ), labile carbon (Chws, mg·g -1 ) were observed. The<br />
obtained data were tested by Anova, Tukey and GLM tests.<br />
3. Results and Discussion<br />
The values of bulk density were changed by influence of organic fertilizer [1]. There were<br />
lower values of bulk density measured on plots with slurry. The highest values of bulk density<br />
<strong>Vol</strong>. 2 Page - 440 -
15th IHSS Meeting- <strong>Vol</strong>. 2<br />
were found out at 2.0 LU·ha -1 . The total porosity corresponded with bulk density values and<br />
porosity increased on plots with application of slurry. There were not found any statistically<br />
significant impact organic fertilization on maximum capillary water capacity in these<br />
conditions. The measured values of maximum capillary water capacity were low. The<br />
increase of cation exchange capacity was statistically significant during following years. The<br />
application of animal manure affected amount of soil organic carbon content [2]. We found<br />
statistically significant increase between first and last year of our experiment. The explanation<br />
is that there was very low amount of SOC before the experiment started. That is why it<br />
existed such a raising of the soil organic carbon content [3]. Experimental plots showed<br />
higher labile carbon content in last year in comparison with the beginning of the experiment.<br />
The highest content of labile carbon was measured by treatment with load 2.0 LU·ha -1 and by<br />
treatment with application of cow dung + dung water. The values of labile carbon content<br />
moved in range 0.48–0.95 mg·g -1 (in depth 0.02–0.15 m) and 0.26–0.67 mg·g -1 (in depth<br />
0.15–0.30 m).<br />
4. Conclusions<br />
The values of bulk density and porosity were affected by application of animal fertilization. In<br />
spite of short-term experiment we found statistically significant impact animal fertilization on<br />
content of soil organic carbon. The content of labile carbon increased moderately during<br />
monitoring period.<br />
Acknowledgements<br />
The paper was published thanks to grant INGO LA 327 and MSM 2678846201.<br />
References<br />
1. P. Schjønning et al., Physical and chemical properties of a sandy loam receiving animal manure,<br />
mineral fertilizer or no fertilizer for 90 years. In European Journal of Soil Science, <strong>Vol</strong> 45, Issue 3<br />
(1994) pp 257–268.<br />
2. H. Mut et al., Effect of manure application on yield and vegetation of secondary rangeland in<br />
Turkey. In: Cagaš, B. et al. (eds): Alternative Functions of Grassland – Book of Abstracts of the<br />
15 th European Grassland Federation Symposium, (7–9 September 2009, Brno), p. 32. ISBN 978-<br />
80-86908-16-8.<br />
3. K. Fiala et al., Evaluation of soil carbon and nitrogen content under permanent grassland on<br />
lysimeter site (In Czech), In Vyzkum v chovu skotu, <strong>Vol</strong> 180, Issue 4 (2007) pp 13–16.<br />
<strong>Vol</strong>. 2 Page - 441 -
15th IHSS Meeting- <strong>Vol</strong>. 2<br />
Influence of Humic Substances on Crop Production and Soil Quality<br />
1. Introduction<br />
Mir-Mohammad Seyedbagheri<br />
University of Idaho, 535 E. Jackson, Mountain Home, ID, USA<br />
E-mail: mirs@uidaho.edu<br />
Since 1900, soil organic matter in farmlands worldwide has declined drastically as a result of<br />
carbon turnover and cropping systems. Humic substances, major constituents of soil organic<br />
matter, have long been known to have important properties, including chelation,<br />
mineralization, buffer effect, clay mineral-organic interaction, and cation exchange. Since<br />
1990, we have evaluated commercial humic acid products derived from lignite and leonardite<br />
in different cropping systems.<br />
2. Materials and Methods<br />
Research trials were established from 1990 through 2007 to evaluate the efficacy of different<br />
humates products in potatoes, sugar beets and alfalfa in Western Idaho, USA. For each<br />
research trial, humic acid treatments were arranged in a randomized complete block design<br />
with four replications. The products were applied as a foliar, side-dressed or top-dressed. For<br />
the top-dressed, the hills were opened above the potato seeds prior to application of the<br />
products for pre-emergence treatments. Liquid humic products were applied with solo pack<br />
sprayers to the opened furrow. Furrows were closed immediately after application of different<br />
treatments. In different trials, granular humates were weighed (40.48 kg·ha -1 ) and spread as<br />
evenly as possible to treated rows, according to block design randomizations. Liquid humic<br />
products were applied according to manufacturers’ recommendations. At the end of crop<br />
season, potato, sugar beet and alfalfa plots were harvested, graded, weighed, and quality<br />
parameters were evaluated.<br />
3. Results and Discussion<br />
Data from humic acids trials showed that different cropping systems responded differently to<br />
different products in relation to yield and quality. Important qualifying factors included:<br />
source; concentration; processing; chelating or complexing capacity of the humic acid<br />
products; functional groups (Carboxyl -CO 2 H; Phenol -Ohp; Hydroxyl -Oha; Ketone –C=O;<br />
Ester O=C–O–R; Ether –C–O–C-; Amine –NH 2 , –NH, –N); rotation and soil quality factors;<br />
consistency of the product in enhancing yield and quality of crops; mineralization effect; and<br />
influence on fertilizer use efficiency. Humates increase phospho<strong>ru</strong>s availability by<br />
<strong>Vol</strong>. 2 Page - 442 -
15th IHSS Meeting- <strong>Vol</strong>. 2<br />
complexing ions into stable compounds, allowing the phospho<strong>ru</strong>s ion to remain exchangeable<br />
for plants’ uptake.<br />
4. Conclusions<br />
Collectively, the consistent use of good quality products in our replicated research plots in<br />
different years resulted in a yield increase from 11.4 percent to the maximum of 22.3 percent.<br />
Humic acid products enhanced nitrogen mineralization in early season by an average of 9.6<br />
percent. Alfalfa research plots had yield increases from a minimum of 8.2 percent to the<br />
maximum of 20.9 percent. Over the past decade, there has been a major increase in the quality<br />
of research and development of organic and humic acids by some well-established<br />
manufacturers. Our experimentations with these commercial products showed an increase in<br />
the yield and quality of crops.<br />
<strong>Vol</strong>. 2 Page - 443 -
15th IHSS Meeting- <strong>Vol</strong>. 2<br />
Application of PLFA and DGGE to Characterize Microbial Modifications<br />
Induced by Pesticides in Organic Substrates<br />
C. Vischetti a* , E. Monaci a , L. Coppola a , M. Marinozzi a , C. Casucci a , P. Pe<strong>ru</strong>cci a , F. Comitini b ;<br />
V. Milanovic b ; D.G. Karpouzas c ; U. Menkissglu-Spiroudi d ; M. Ciani b<br />
a Environmental Science and Crop Production, Polytechnic University of Marche, Ancona,<br />
Italy; b Food Science, Agro-engineering, Physics, Agricultural Economy and Territory,<br />
Polytechnic University of Marche, Ancona, Italy; c Department of Biochemistry and<br />
Biotechnology, University of Thessaly, Greece; d Laboratory of Pesticide Science, Aristotle<br />
University of Thessaloniki, Greece<br />
E-mail: c.vischetti@univpm.it<br />
1. Introduction<br />
Biobeds are biological systems to protect natural water bodies from pesticides point source<br />
contamination [1]. They rely on organic mixtures to adsorb and biodegrade pesticides.<br />
Vineyards and orchards are repeatedly treated with fungicides some of which are recalcitrant<br />
to degradation. With the aim to adapt biobed system to Italian agriculture is necessary to find<br />
an efficient biomixture [2] The critical point of the procedure is: are recalcitrant fungicides<br />
rapidly degraded and microbial modifications induced on the biomixture environmentally<br />
safe? In this regard, a biomixture of p<strong>ru</strong>ning residues was treated with penconazole and<br />
investigated, during 60 days of experimentation, for fungicide degradation and microbial<br />
modifications induced by combining results from PLFA’s (Phospholipid fatty acids) and<br />
DGGE (Denaturant gradient gel electrophoresis) analysis.<br />
2. Materials and Methods.<br />
A biomixture contained p<strong>ru</strong>ning residues (five years of decomposition in open field) and<br />
straw (60/40% v/v) (Table 1), brought to 60% of water holding capacity, stabilized for two<br />
days, was treated with 50 mg Kg -1 of penconazole (> 99% purity), thoroughly homogenised<br />
and incubated in the dark at 20°C, together with an untreated control.<br />
Table 1: Main chemical properties of organic residues<br />
pH % Corg % Ctot %Ntot C/N<br />
p<strong>ru</strong>ning residues 7.05 21.8 31.1 2.17 14.3<br />
straw 7.14 32.9 42.4 2.07 20.5<br />
biomixture 7.10 23 35 2.0 17.5<br />
Fungicide residues, phenotypic (PLFA’s) and genotypic (DGGE) profile of the microbial<br />
community of biomixture, were determined sampling at 7, 30 and 60 days after penconazole<br />
application.<br />
<strong>Vol</strong>. 2 Page - 444 -
15th IHSS Meeting- <strong>Vol</strong>. 2<br />
Fungicide was extracted in a methanol:water solution (80:20 v/v) and partitioned in<br />
chloroform and analyzed by HPLC with a retention time of 10 min.<br />
PLFA’s were determined following method of Spyrou et al., [3]. Briefly, 5-g samples were<br />
extracted with single-phase mixture of chloroform: methanol (1:2:0.8 v/v/v). After extraction,<br />
the lipids were separated into neutral, glyco and phospholipids on a silicic acid column.<br />
Phospholipids were methylated and resultant PL-FAME were quantified by GC. DGGE<br />
analysis was performed following Cocolin et al., [4]. Briefly, DNA was extracted directly<br />
from organic substrate using the FastDNA® Spin Kit for soil. DNA concentrations were<br />
determined using a NanoDrop®. DNA was amplified by PCR using the primer P1 and the<br />
reverse primer P2 for bacteria and NL1 and LS2 for fungi. Combination of these primers<br />
generates a PCR fragment of the 16S rDNA for bacteria and 26S rDNA for fungi. The PCR<br />
products obtained from the direct DNA extractions were analysed using a DGGE-1<br />
ELETTROFOR apparatus.<br />
Data were statistically treated with GenStat® 11th Edition software and principal component<br />
analysis (PCA) was performed to asses variability in microbial community st<strong>ru</strong>cture.<br />
3. Results and Discussion.<br />
Penconazole degraded slightly in the organic substrate, only 19% of the initial concentration<br />
applied degraded during 60 days of incubation, as a probable consequence of toxicity towards<br />
a great part of the microbial community.<br />
In presence of xenobiotics, micro-organisms can react by modifying PLFA’s cell<br />
composition and st<strong>ru</strong>cture. Phenotypic profile of some fungal and bacteria biomarkers and<br />
PCA analysis of PLFA’s results, in comparison with an untreated control, are reported in<br />
Figure 1. Modifications on gram positive (i17:0), gram negative (Cy17:0; Cy 19:0) and fungi<br />
(18:2ω6,9 cis; 18:3ω3) at 7, 30 and 60 days after penconazole application, were considered.<br />
Despite to the same percent amount of bacterial biomarkers, a marked depletion of fungi<br />
(18:2ω6,9 cis; 18:3ω3) was observed after 7 days from penconazole application (Figure 1a).<br />
The more evident modification on the PLFA’s st<strong>ru</strong>cture was observed at day 30 where both of<br />
the fungal biomarkers markedly increased as well as gram positive, indicating a possible<br />
selection of tolerant/degrading micro-organisms towards fungicide applied. At day 60, the<br />
phenotypic profile of PLFA’s was similar to that of the control, with only one of the fungal<br />
biomarker (18:2ω6,9 cis) significantly higher. Data found showed that most of the<br />
modifications on phenotypic profile of the microbial community, are induced during the first<br />
<strong>Vol</strong>. 2 Page - 445 -
15th IHSS Meeting- <strong>Vol</strong>. 2<br />
30 days of incubation (Figure 1b) and regard mostly fungi, even if a short-time increase of<br />
the gram positive bacteria was also observed.<br />
a)<br />
% of composition<br />
30<br />
25<br />
20<br />
15<br />
10<br />
5<br />
0<br />
PLFA's<br />
7 30 60 7 30 60<br />
control<br />
penconazole<br />
Cy 19<br />
Cy 17<br />
i17:0<br />
18:2ω6,9cis<br />
18:3ω3<br />
b)<br />
PC_30d<br />
4<br />
3<br />
2<br />
1<br />
0<br />
‐1<br />
CTR_7d<br />
‐2<br />
PC_7d<br />
‐3<br />
PC_60d<br />
CTR_30d<br />
CTR_60d<br />
‐5 ‐4 ‐3 ‐2 ‐1 0 1 2 3 4<br />
CTR_7d<br />
PC_7d<br />
CTR_30d<br />
PC_30d<br />
CTR_60d<br />
Figure 1: Phenotypic profile of some fungal and bacteria biomarkers (a) and PCA analysis of<br />
results (b)<br />
Denaturing gradient gel electrophoresis (DGGE) was used to observe differences in the<br />
microbial populations. PCA of DGGE banding of the 16S rRNA fragments were nearly<br />
similar between the control and the respective treated samples, leading to the hypothesis that<br />
penconazole had a little impact on the bacteria community (Figure 2a). On the contrary, the<br />
PCA of the molecular analysis of 26S rRNA, revealed changes in the composition of fungi<br />
population between the control and the treated samples (Figure 2b). These changes suggested<br />
that penconazole mainly affect the development dynamics of fungi. Moreover, the<br />
composition of fungi population in the treated samples seems to be nearly similar at 7, 30 and<br />
60 days, suggesting a slow selection of fungal strains towards to those able to degrade the<br />
fungicide.<br />
PC_60d<br />
a) b)<br />
Figure 2: PCA analysis of DGGE screening of bacteria (a) and fungi (b) of the microbial community<br />
<strong>Vol</strong>. 2 Page - 446 -
15th IHSS Meeting- <strong>Vol</strong>. 2<br />
In conclusion, results obtained by studying the phenotypic and genotypic profile of microbial<br />
community are in accordance with regards to impact of fungicide penconazole. Both of<br />
techniques evidenced modifications on microbial community composition mostly towards<br />
fungi. However, the negligible degradation of penconazole (about 19%) indicated that 60 days<br />
are too short time for the development of a robust microflora able to degrade this fungicide.<br />
As such, the experiment will be carried out for a longer period to asses the highest amount of<br />
penconazole degradable in the organic substrate and the main micro-organisms involved.<br />
References<br />
1. Castillo, M. d. P.; Torstensson, L.; Stenstrom, J. J. Agric. Food Chem. 56 (15) (2008) 6206-6219.<br />
2. Monaci E., Coppola L., Casucci C., Pe<strong>ru</strong>cci P., Vischetti C. J. Envir. Sci. Health B, <strong>Vol</strong>. B44, n. 7<br />
(2009) 724-729.<br />
3. Spyrou I., Karpouzas D.G., Menkissoglu-Spiroudi, U. Microbial Ecology, 58 (2009) 715-727.<br />
4. Cocolin L., Bisson L.F., Mill D.A FEMS Microbiol. Lett., 189 (2000) 81-87.<br />
<strong>Vol</strong>. 2 Page - 447 -
15th IHSS Meeting- <strong>Vol</strong>. 2<br />
Effect of the Application of Humic Substances on Grassland Production<br />
and Nutrient Uptake by Herbage<br />
G. Verlinden a* , T. Coussens a , A. De Vliegher b , G. Baert a and G. Haesaert a<br />
a University College Ghent – Ghent University, Faculty of Biosciences and Landscape<br />
Architecture, B-9000 Ghent, Belgium; b ILVO-Plant, B-9820 Merelbeke, Belgium<br />
E-mail: greet.verlinden@hogent.be<br />
1. Introduction<br />
Many European agricultural regions with high inputs of inorganic fertilizers or organic<br />
fertilizer as slurry are faced with decreasing organic matter (OM) content of their soils [9].<br />
Application of high quantities of organic materials can increase the OM content in the soil but<br />
they are usually rich in nitrogen (N) and phospho<strong>ru</strong>s (P) which is in conflict with legislation<br />
on nutrient inputs in many countries in north-west Europe. The use of concentrated products<br />
of humic substances (humic and fulvic acids) in agriculture may act as a solution as many of<br />
the beneficial characteristics of soil humus are associated with the presence of humic and<br />
fulvic acids. Numerous studies have shown that the addition of a specific amount of humic<br />
substances can enhance the growth of roots, shoots and leaves, and encourage nutrient<br />
absorption by plants (for instance, [5]). The effect of humic substances in grass pastures has<br />
rarely been reported [2]. The aim of our study was a simultaneous assessment of the effect of<br />
humic substances on nutrient uptake, herbage production and the nutritive value of the<br />
herbage. Field experiments were preferred to greenhouse experiments in order to interpret the<br />
effects of humic substances in the light of environmental conditions. General conclusions<br />
between the different experiments were obtained by applying the meta-analysis technique of<br />
[4] and [3]. This method allows the integration of results of independent field experiments.<br />
2. Materials and Methods<br />
A liquid mixture of humic and fulvic acids (HF liquid) was used as an organic amendment in<br />
combination with mineral fertilizer according to fertilizer recommendations. Besides the<br />
liquid form, a solid form was incorporated into mineral fertilizers at varying concentrations.<br />
Six field experiments with humic substances were carried out in 2006, 2007 and 2008 at four<br />
locations in Flanders, the northern part of Belgium. For all experiments, a randomized<br />
complete block design was used with four replicates. The number of grass cuts at each<br />
location depended on the weather and grass conditions on each field and varied between two<br />
and five cuts per growing season. At each cut fresh herbage mass, dry matter content, mineral<br />
<strong>Vol</strong>. 2 Page - 448 -
15th IHSS Meeting- <strong>Vol</strong>. 2<br />
composition and nutritive value was determined.<br />
In all data analyses, a distinction was made between the effects of HF liquid and HF<br />
incorporated. Analysis of variance was used to study the effect of treatment (HF application)<br />
on DM production, nutrient uptake and nutritive value for each individual experiment<br />
(Version 4.1, SAS package; SAS Institute Inc., Cary, NC, USA). A two-sample t-test was<br />
used to test if the average of the differences between the observations (with and without HF<br />
application) was significantly different. To compare the results between experiments, a metaanalysis<br />
was performed in accordance with [3, 4] using the log response ratio or the logarithm<br />
of the ratio of some measured quantity in an experimental and control group, as an index of<br />
effect.<br />
3. Results and Discussion<br />
Figure 1a and 1c show the meta-analysis of the data on the first cut i.e. a summary of the log<br />
response ratios calculated for the individual experiments and the mean log response ratio<br />
calculated across the experiments. Application of HF incorporated resulted in a mean log<br />
response ratio of 0.13 or an unlogged mean response ratio of 1.14 with the unlogged 95 %<br />
confidence interval of 1.02–1.27 for the first cut. In other words, the application of HF<br />
incorporated significantly (α = 0.05) increased grass production by 14 % at the first cut across<br />
the different field experiments. The application of HF liquid resulted in a mean log response<br />
ratio of 0.07 or an unlogged mean response ratio of 1.08. The increase in grass production of<br />
8 % compared to the control was not significant. The effect of humic substances in<br />
combination with mineral fertilizer on total herbage production of DM at the end of the<br />
growing season was variable. Mean total herbage production of DM on plots with humic<br />
substances and mineral fertilizer varied from -7 % to +10 % compared to the means on the<br />
control plots. In the meta-analysis the mean log response ratio across the experiments was<br />
estimated to be 0.03 for HF incorporated (Fig. 1b) and zero for HF liquid (Fig. 1d). This<br />
means that in general the application of humic substances had no effect on total herbage<br />
production of DM during the growing season.<br />
In general, the results in the field experiments showed that application of HF incorporated<br />
increased grass production at the first cut without affecting the nutritive value of the herbage<br />
although there was no effect on annual herbage production. The shift in total herbage<br />
production towards the first cut during the growing season after application of humic<br />
substances, especially HF incorporated, could be of significance for grassland management in<br />
north-west Europe since the first cut is important as a source of nutrients for the winter as<br />
<strong>Vol</strong>. 2 Page - 449 -
15th IHSS Meeting- <strong>Vol</strong>. 2<br />
silage. The higher grass production at the first cut was generally followed by lower production<br />
in the next cuts.<br />
0,6<br />
a)<br />
0,6<br />
b)<br />
0,4<br />
0,4<br />
Log response ratio<br />
0,2<br />
0,0<br />
Log response ratio<br />
0,2<br />
0,0<br />
-0,2<br />
-0,2<br />
-0,4<br />
HOO BOT1 BOT2 MER1 MER2 MOO Mean log<br />
response<br />
ratio<br />
-0,4<br />
HOO BOT1 BOT2 MER1 MER2 MOO Mean log<br />
response<br />
ratio<br />
0,6<br />
c)<br />
0,6<br />
d)<br />
0,4<br />
0,4<br />
Log response ratio<br />
0,2<br />
0,0<br />
Log response ratio<br />
0,2<br />
0,0<br />
-0,2<br />
-0,2<br />
-0,4<br />
BOT1 BOT2 MER2 MOO Mean log<br />
response ratio<br />
-0,4<br />
BOT 1 BOT 2 MER2 MOO Mean log<br />
response ratio<br />
Figure 1: Log response ratios of (a) HF incorporated and (c) HF liquid for the herbage mass of dry<br />
matter (DM) at the first cut and (b) HF incorporated and (d) HF liquid for the total herbage production<br />
of DM over the growing season as calculated in the meta-analysis. In each graph, log response ratios<br />
of the individual experiments are shown on the left side and the mean response ratio across the<br />
different experiments is shown on the right side. Error bars indicate 95% confidence intervals<br />
Significant increases in N uptake by herbage at the first cut associated with the addition of<br />
humic substances could only be demonstrated in one of the experiments for the HF<br />
incorporated treatment. [2, 7] found that the effect of humic substances increased if they were<br />
mixed into the nutrient solution. This supports the larger effect of HF incorporated compared<br />
to HF liquid in our study since nutrients and humic substances are in the same granule in the<br />
‘HF incorporated’ product. In studies with other crop species, an increase in N uptake may be<br />
explained by the role of humic substances in the modulation of nitrate uptake via an<br />
interaction with plasma membrane H + -ATPase [1, 6].<br />
<strong>Vol</strong>. 2 Page - 450 -
15th IHSS Meeting- <strong>Vol</strong>. 2<br />
Acknowledgements<br />
We would like to thank the Institute for the Promotion of Innovation by Science and<br />
Technology in Flanders (IWT) for their financial support and the Soil Service of Belgium.<br />
References<br />
1. Canellas L., Olivares F., Olofrokovha-Facanha A. and Facanha A. (2002) Humic acids<br />
isolated from earthworm compost enhance root elongation, lateral root emergence and plasma<br />
membrane H + ATPase activity in maize roots. Plant Physiol., 130, 1951–1957.<br />
2. Cooper R.J., Liu C. and Fisher D.S. (1998) Influence of humic substances on rooting and<br />
nutrient content of creeping bentgrass. Crop Sci., 38, 1639–1644.<br />
3. Gurevitch J. and Hedges L. (2001) Meta-analysis. Combining the results of independent<br />
experiments. In: Scheiner S. and Gurevitch J. (eds) Design and Analysis of Ecological<br />
Experiments, pp. 347–369. New York, USA: Oxford University Press, Inc.<br />
4. Hedges L., Gurevitch J. and Curtis P. (1999) The meta-analysis of response ratios in<br />
experimental ecology. Ecology, 80, 1150–1156.<br />
5. Nardi S., Pizzeghello D., Muscolo A. and Vianello A. (2002) Physiological effects of humic<br />
substances on higher plants. Soil Biol.Biochem., 34, 1527–1536.<br />
6. Quagiotti S., Ruperti B., Pizzeghello D., Francioso O., Tugnoli V. and Nardi S. (2004)<br />
Effect of low molecular size humic substances on nitrate uptake and expression of genes involved<br />
in nitrate transport in maize (Zea mays L.). J.Experiment. Bot., 55, 803-813.<br />
7. Sharif M., Khattak R. and Sarir M. (2002) Effect of different levels of lignitic coal derived<br />
humic acid on growth of maize plants. Commun Soil Sci Plant Anal., 33, 3567–3580.<br />
8. Verlinden G., Coussens T., De Vliegher A., Baert G. and Haesaert G. (2010) Effect of<br />
humic substances on nutrient uptake by herbage and on production and nutritive value of herbage<br />
from sown grass pastures. Grass Forage Sci. (in press).<br />
9. Vleeshouwers, L. and Verhagen A. (2002) Carbon emission and sequestration by agricultural<br />
use: a model study for Europe. Global Change Biol., 8, 519–530.<br />
<strong>Vol</strong>. 2 Page - 451 -
15th IHSS Meeting- <strong>Vol</strong>. 2<br />
Aerobic Solid-State Processes of Municipal Solid Waste Produce<br />
Recalcitrant Residue that Acts as C-Sink in the Landfill<br />
B. Scaglia a , S. Salati a , F. Tambone a , A. Digregorio b , A. Carrera b , F. Adani a*<br />
a G<strong>ru</strong>ppo RICICLA –DiProVe – Università degli Studi di Milano – Via Celoria 2, 20133<br />
Milano, Italy; b G<strong>ru</strong>ppo Sorain Cecchini, Via Pontina, 54500128 Roma – Italy<br />
E-mail: fabrizio.adani@unimi.it<br />
1. Introduction<br />
The landfill represents the most common way of municipal solid waste (MSW) disposal in the<br />
world. The biodegradation of the organic matter in landfill, is the major mechanism that<br />
governs biological pollution and, above all, the greenhouses gases (GHGs) production. The<br />
landfill gas is composed mainly of CH 4 and CO 2 [1] and the contribution of the landfilled<br />
MSW to GHGs it was reported to be of 13% of the methane from anthropogenic fonts [2, 3].<br />
Methane has an infrared activity 21 times that of CO 2 [4]. Because the production of CH 4 vs<br />
CO 2 during MSW degradation depends by aerobic vs anaerobic conditions, the possibility to<br />
manage MSW organic fraction by aerobic biological process, i.e. composting and mechanical<br />
biological treatment, avoiding methane production in landfill, reduce GHGs emission due to<br />
MSW management.<br />
The reduction of the content of the organic fraction of MSW (OFMSW) to be landfilled can<br />
be obtained by three different approaches: i) MSW incineration to produce energy; ii) source<br />
separated collection of OFMSW to produce compost or energy (anaerobic digestion process);<br />
iii) aerobic solid-state treatment (MBT) of MSW to produce a compost-like material to be<br />
landfilled. The MBT is a bio-oxidative process that determines the biodegradation of the<br />
labile organic fractions and the preservation/modification of the more recalcitrance molecules,<br />
giving a biologically stable product. As consequence of the effectiveness of the MBT, a<br />
reduction of negative effects of the disposal in landfill (above all the CH 4 emission) and the<br />
possibility to use biostabilized material as C-sink occurred. Therefore, the measure of the<br />
efficacy of the aerobic process consisted in a direct or indirect measurement of the degree of<br />
decomposition of the easily degradable OM (biodegradability degree) vs the presence of<br />
recalcitrant OM. Literature reported well known analytical methods able to characterize both<br />
biological stability/biodegradability (i.e respiration indexes, anaerobic biogas production -<br />
ABP and biomethane production-MBP) and recalcitrance (macromolecular composition,<br />
spectroscopic characterization). On the other hand, some more recent scientific aspects i.e.,<br />
physical recalcitrance needs to be adequately studied and measured. Physical recalcitrance<br />
refers to the physical properties of the OM (degree of polymerization and cross-link of the<br />
<strong>Vol</strong>. 2 Page - 452 -
15th IHSS Meeting- <strong>Vol</strong>. 2<br />
organic molecules) that affect the specific surface available for the accessibility of enzymes to<br />
OM substrate. The detection of nanoscale distribution of molecules in OM, and so its<br />
nanost<strong>ru</strong>cture, give experimental measures of physical recalcitrance. The aim of this work is<br />
to evaluate the effect of the biostabilization process on OFMSW treated in a MBT full scale<br />
plant situated in Rome.<br />
2. Materials and Methods<br />
Three different MSW have been sampled at different phases of the biostabilization process (at<br />
the start of the process – MSW i -, after the 28 days of active phase -MSW bio - and after the<br />
final refining phase - MSW bio+ref ) in the MBT full-scale plant of Rome. Biological (ABP test),<br />
chemical (macromolecular fractioning, C/L ratio determination, NMR analysis) and physical<br />
(microporosity) properties of the samples have been determined.<br />
3. Results and Discussion<br />
The biodegradability measure indicate a strong reduction of the biogas production by MSW<br />
confirming the reduction of biodegradability of OM (ABP MSWi = 220Nl kg -1 dm; ABP MSWbio =<br />
148Nl kg -1 dm; ABP MSWbio+ref = 88Nl kg -1 dm ).<br />
On the other hand, chemical analysis performed with 13 C CP-MAS NMR show that during the<br />
process there is an increase of the arilic and alkyl fractions at the expense of O-alkyl<br />
(polysaccharides: cellulose, hemicellulose). Indeed, comparing the different types of carbon<br />
obtained from the spectra at the beginning and end of treatment, the alkyl-C content increases<br />
slightly, from 14.38% to 14.84%. The aromatic-C increases (+10.92%), while the O-alkyl<br />
carbon tends to decrease in all the phases considered. Finally, the carbonyl-C undergoes an<br />
increase in all theses. This is the behavior expected during a process of biodegradation. The<br />
same trends are observed when qualitative approaches of the same spactra are occurred. The<br />
data suggest that aerobic solid-state processes of municipal solid waste produce recalcitrant<br />
residue. Recently the term ‘recalcitrance’ is introduced to describe the physical properties of<br />
the OM (degree of polymerization and cross-link of the organic molecules) that affect the<br />
specific surface available for the accessibility of enzymes to OM [5]. Moreover some studies<br />
suggest that this characteristic depends by the nanoscale distribution of molecules in OM i.e.<br />
microporosity and C/L ratio [6, 7].<br />
The tendency of landfill to act as C-sink or C-source depends by the rate of decomposition of<br />
MSW in landfill that depends by the biodegradability vs recalcitrance of organic matter (OM).<br />
Some authors consider the total amount of degradable organic matter content (degradable<br />
<strong>Vol</strong>. 2 Page - 453 -
15th IHSS Meeting- <strong>Vol</strong>. 2<br />
organic fraction) as source to produce methane [8]. Nevertheless, different OM fractions show<br />
different biodegradable rates under anaerobic conditions. In particular, the recalcitrance of<br />
lignocelluloses complex under anaerobic condition is know to be one of the most significant<br />
factors that causes the accumulations of carbon in the anoxic environmental compartments<br />
(sediment, peat, etc). It can be suggested that the cellulose/lignin ratio (C/L) is an efficacy<br />
indicators of the recalcitrance degree of OM in landfill [7]. The trend of C/L during the<br />
landfill life showed a progressive diminution reaching low values: an exponential model was<br />
set up (C/L=1.73*e -0.0682*year , R 2 =0.42, P
15th IHSS Meeting- <strong>Vol</strong>. 2<br />
4. Conclusions<br />
The organic fraction obtained after of the aerobic solid state-process has a high evolution<br />
degree that results in a greater recalcitrance of this fraction. In particular, the phase that<br />
mainly contributes to the quantitative and qualitative changes in organic matter is the<br />
biostabilization. MBT could establish a reserve of carbon in the landfill site. This result<br />
appears very interesting as a new approach in the detection of OM recalcitrance is proposed.<br />
Therefore, MBT process allows in short time, to degrade degradable OM preserving<br />
recalcitrant ones, i.e. the fraction characterized by low C/L ratio and high microporosity no<br />
accessible to the degrading enzymes.<br />
References<br />
1. B.Scaglia, F. Adani, in J.R. Lavelle (Ed.), Waste Management: Research, Development and<br />
Policy. NovaPublisher, New York, 2008, 2ndQuarter ISBN:978-1-60456-256-9.<br />
2. USEPA. United States Environmental Protection Agency. USEPA-600/9-81-0029. 2003.<br />
www.epa.gov/epaoswer/non-hw/muncpl/pubs/msw05rpt.pdf.<br />
3. IPCC. In Guidelines for National Greenhouse Gas Inventories: waste generation, composition and<br />
management data. (2006) www.ipccnggip.iges.or.jp/public/2006gl/pdf/Overview/V0_1_Overview.pdf.<br />
4. J. Lelieveld, P.J. C<strong>ru</strong>tzen, F.J. Dentener, Tellus B. 50, (1998), 128-150.<br />
5. E.M.Himmel, S. Ding, D.K. Johnson W.S. Adney, M.R. Nimlos, J.W. Brady, T.D. Foust, Science,<br />
315, (2007), 804–807.<br />
6. G. Papa, M. Spagnol, F. Tambone, R. Pilu, B. Scaglia, F. Adani, Chemosphere. (2009) in press.<br />
7. M.A.Barlaz, Waste Manage. 26, (2006), 321–333.<br />
8. J.Bogner, E.Metthews, Global Biogeochem Cycles, 17, (2003), 1065.<br />
9. R.J. Kelly, B.D. Shearer, J. Kim, C.D.Goldsmith, G.R. Hater, J.T. Novak, Waste Manage. 26,<br />
(2006),1349–1356.<br />
10. D.P. Komilis, R.K. Ham, Waste Manage. 23, (2003), 419–423.<br />
<strong>Vol</strong>. 2 Page - 455 -
15th IHSS Meeting- <strong>Vol</strong>. 2<br />
Dynamics of Soil Organic Carbon in Treated Wastewater Irrigated<br />
Agricultural Soils<br />
Elisabeth Jueschke a* , Bernd Marschner a , Yona Chen b , Jorge Tarchitzky b<br />
a Ruhr- University Bochum, Institute of Geography, Soil Science/Soil Ecology<br />
Universitaetsstrasse 150, 44780 Bochum, Germany; b Faculty of Agricultural, Food and<br />
Environmental Quality Sciences, POB 12, Rehovot, 76100, Israel<br />
E-mail: Elisabeth.Jueschke@<strong>ru</strong>b.de<br />
1. Introduction<br />
Treated wastewater (TWW) is an important source for irrigation water in arid and semiarid<br />
regions. Reclaimed water still contains organic matter and various compounds that may effect<br />
microbial activity and soil quality (Feigin et al. 1991). Natural soil organic carbon (SOC) may<br />
be altered by interactions between these compounds and the soil microorganisms. This study<br />
evaluates the effects of TWW irrigation on the quality, dynamics and microbial<br />
transformations of natural SOC. Priming effects (PE) and SOC mineralization were<br />
determined to estimate the influence of TWW irrigation on SOC along soil profiles of<br />
agricultural soils in Israel and the Westbank.<br />
2. Materials and Methods<br />
The used soil material derived from three different sampling sites allocated in Israel and<br />
The Palestinian Authority. Soil samples were taken from two sampling sites in Israel (Bazra<br />
and Akko) which are experimental fields with orchard crops <strong>ru</strong>nning already about 15 and 20<br />
years, respectively. Beside the treated wastewater irrigated site also a freshwater irrigated<br />
control field (FW) was conserved over the time. In the Westbank a sampling site close to<br />
Nablus was chosen (Wadi Faria) which was under raw wastewater irrigation for many years.<br />
A control site was taken from a nearby field without irrigation.<br />
Soil samples were taken always from TWW irrigated sites and control fields from 6 different<br />
depths (0–10, 10–20, 20–30, 30–50, 50–70, 70–100 cm).<br />
After sampling the soil were sieved (< 2 mm), air dried and sent to Germany. Previous to each<br />
experiment the samples were remoistened to 30% of their water holding capacity (WHC) and<br />
kept in the dark at 15 °C for 14 days to reestablish the microbial activity.<br />
Incubation experiments were performed in a Respicond apparatus (Nordgren Innovations,<br />
Bygdeå, Sweden) to determine the CO 2 release at 25 °C for 7 days in 3 replicates by WHC of<br />
60% in the dark. Radioactive 14 C-labeled alanine and f<strong>ru</strong>ctose were added to the soils as<br />
<strong>Vol</strong>. 2 Page - 456 -
15th IHSS Meeting- <strong>Vol</strong>. 2<br />
surrogates for easily degradable compounds present in effluent water. These substrates had<br />
induced priming effects in former experiments (Hamer and Marschner 2002, Hamer and<br />
Marschner 2005a, Hamer and Marschner 2005b, Jüschke 2009).<br />
3. Results and Discussion<br />
The SOC mineralization and the priming effect (PE) are demonstrated only for Akko soil as<br />
an example.<br />
Alanine. Only in the deeper soil profile significantly lower SOC mineralization could be<br />
detected for the TWW irrigated soil compared to the freshwater soil (30–50 and 70–100 cm)<br />
(Figure 1 a). In 20-30 cm a slightly higher mineralization was detected for TWW soil then for<br />
FW soil. By calculating the priming effect the samples from these soil depths showed a PE in<br />
the TWW soil whereas no PE occurred in the FW soil (Figure 1 b). Concluding from this<br />
more of the native SOC is reduced due to priming action in the soil, especially in the deeper<br />
soil layers as a result from the TWW influence.<br />
SOC mineralisation [%]<br />
0.0 0.5 1.0 1.5 2.0 2.5 3.0<br />
Priming Effect [%]<br />
-20 0 20 40 60 80 100 120 140<br />
0-10<br />
0-10<br />
Soil depth [cm]<br />
10-20<br />
20-30<br />
30-50<br />
50-70<br />
FW<br />
TWW<br />
Soil depth [cm]<br />
10-20<br />
20-30<br />
30-50<br />
50-70<br />
n.s.<br />
TWW<br />
FW<br />
70-100<br />
(a)<br />
70-100<br />
n.s.<br />
(b)<br />
Figure 1: SOC mineralization (a) and priming effects (b) of Akko soil along a deep profile<br />
supplemented with alanine (FW-freshwater irrigated soil; TWW-treated wastewater irrigated soil)<br />
F<strong>ru</strong>ctose. By amendment of the soil samples with f<strong>ru</strong>ctose again a significant decrease in<br />
SOC mineralization in TWW soil could be seen compared to FW soil. This was detected in<br />
the middle layers of the soil profile (10–20 and 30–50 cm) (Figure 2 a). For the PE<br />
significantly lower values could be calculated for TWW soils then for FW soils at each depth<br />
(except 50–70 cm) (Figure 2 b). This finding underlines the strong influence of TWW<br />
compounds on the SOC transformations due to its influence on the soil biology. Easily<br />
degradable organic carbon, which can serve as substrates for microorganisms, are still<br />
available in FW irrigated soils, whereas it was already degraded in TWW irrigated soils due<br />
to higher microbial activity.<br />
<strong>Vol</strong>. 2 Page - 457 -
15th IHSS Meeting- <strong>Vol</strong>. 2<br />
SOC mineralisation [%]<br />
0.0 0.5 1.0 1.5 2.0 2.5 3.0<br />
Priming Effect [%]<br />
0 20 40 60 80 100 120 140<br />
Soil depth [cm]<br />
0-10<br />
10-20<br />
20-30<br />
30-50<br />
FW<br />
TWW<br />
Soil depth [cm]<br />
0-10<br />
10-20<br />
20-30<br />
30-50<br />
n.s.<br />
FW<br />
TWW<br />
50-70<br />
50-70<br />
70-100<br />
(a)<br />
70-100<br />
(b)<br />
Figure 2: SOC mineralization (a) and priming effects (b) of Akko soil along a deep profile<br />
supplemented with f<strong>ru</strong>ctose (FW-freshwater irrigated soil; TWW-treated wastewater irrigated soil)<br />
By addition of alanine and f<strong>ru</strong>ctose different results could be achieved. This difference could<br />
be caused by the different chemical composition of the two additives. F<strong>ru</strong>ctose is a pure<br />
energy supplier for the microorganisms (Coody et al. 1986), whereas alanine additionally<br />
contains nitrogen and is able to promote microbial growing (Vinolas et al. 2001). With<br />
f<strong>ru</strong>ctose addition the SOC which is easily available can be degraded more rapidly as without<br />
due to the increased activity of the microorganisms. The alanine is a representative for amino<br />
acids and used as growing agent. Therefore the SOC degradation is less rapidly then with<br />
f<strong>ru</strong>ctose addition.<br />
Similar results could be stated for the other two sampling sites in Bazra and Wadi Faria.<br />
Furthermore results of several microbial parameters as microbial biomass and enzyme<br />
activities were determined and are discussed in the presentation.<br />
4. Conclusions.<br />
Treated wastewater used as alternative irrigation water source can have an impact on the soil<br />
chemical and biological properties. This study showed a clear effect related to the SOC<br />
mineralization of these soils and the changing in biological activity. Soil organic carbon<br />
mineralization after amendment of easily degradable substrates decreased slightly significant<br />
in some deeper soil layers of the TWW soil compared to the FW soil. Concerning the<br />
calculated PE differences between the two substrates were detected. F<strong>ru</strong>ctose serves as energy<br />
supplier and promotes higher microbial activity especially in FW irrigated soils. The lower PE<br />
in TWW soils can be a result from the continuously added organic material by the wastewater<br />
which enhanced the microbial activity of these soils already in the field. Therefore the native<br />
easily degradable organic matter from the soil is already mineralized and only small PE could<br />
be triggered in the lab. These effects could not be detected by using alanine to trigger PE. This<br />
<strong>Vol</strong>. 2 Page - 458 -
15th IHSS Meeting- <strong>Vol</strong>. 2<br />
might be caused by the compound chemistry. Alanine is preferably used for the growth of the<br />
microorganisms.<br />
The fact that PE are triggered continuously due to TWW irrigation may result in a decrease of<br />
SOC over long term irrigation. Already now this could be detected at some agricultural fields<br />
by SOC measurements (Jüschke 2009, Gloaguen et al. 2007). Therefore attention has to be<br />
drawn especially on the carbon content and quality of the used TWW for irrigation purposes.<br />
Acknowledgements.<br />
The authors gratefully acknowledge the DFG (Deutsche Forschungsgemeinschaft) for<br />
financial assistance in the frame of the Trilateral Program.<br />
References<br />
1. Coody, P. N., L. E. Sommers and D. W. Nelson (1986). Kinetics of glucose uptake by soil<br />
microorganisms. Soil Biology & Biochemistry 18 283–289.<br />
2. Feigin, A., I. Ravina and J. Shalhevet (1991). Irrigation with treated sewage effluent. Springer-<br />
Verlag, Berlin. p. 224.<br />
3. Gloaguen, T. V., M. C. Forti, Y. Lucas, C. R. Montes, R. A. B. Goncalves, U. Herpin and A. J.<br />
Melfi (2007). Soil solution chemistry of a Brazilian Oxisol irrigated with treated sewage effluent.<br />
Agricultural Water Management 88, 119–131.<br />
4. Hamer, U. and B. Marschner (2002). Priming effects of sugars, amino acids, organic acids and<br />
catechol on the mineralisation of lignin and peat. Journal of Plant Nutrion and Soil Science 165<br />
261–268.<br />
5. Hamer, U. and B. Marschner (2005a). Priming effects in soils after combined and repeated<br />
substrate additions. Geoderma 128 (1–2), 38–51.<br />
6. Hamer, U. and B. Marschner (2005b). Priming effects in different soil types after addition of<br />
f<strong>ru</strong>ctose, alanine, oxalic acid or catechol. Soil Biolology and Biochemistry 37, 445–454.<br />
7. Jüschke, E. (2009). Effluent Irrigation and Agricultural Soils: Effects on the Dynamics of Organic<br />
Carbon and Microbial Activity in Agricultural Soils in Israel Verlag Dr. Kovač, Hamburg. p. 336.<br />
8. Vinolas, L. C., V. R. Vallejo and D. L. Jones (2001). Control of amino acid mineralization and<br />
microbial metabolism by temperature. Soil Biology & Biochemistry 33, 1137–1140.<br />
<strong>Vol</strong>. 2 Page - 459 -
15th IHSS Meeting- <strong>Vol</strong>. 2<br />
The Content of Total Organic Carbon (TOC) and Water Extractable<br />
Organic Carbon (WEOC) in Reclaiming Overlayers Composed of Different<br />
Exogenic Organic Material and Power Plant Ash<br />
Eżbieta Giegużyńska a* , Justyna Chudecka b , Mariola Sienkiewicz a , Tomasz Tomaszewicz b<br />
a Department of Physics and Agrophysics, West Pomeranian University of Technology,<br />
Szczecin, Poland; b Department of Environmental Chemistry and Soil Reclamation, West<br />
Pomeranian University of Technology, Szczecin, Poland<br />
E-mail: Elzbieta.Gieguzynska@zut.edu.pl<br />
1. Introduction<br />
Many authors share an opinion that integrated use of organic and inorganic wastes is the<br />
beneficial way of fast improving organic carbon and mineral nutrients in soils [2, 5, 6, 8, 9].<br />
Moreover, it is expected that the mixture composed of several kinds of urban composts,<br />
sewage sludge and coal ashes could give the possibilities to produce a cheap artificial<br />
substitute of natural humus horizon. Applying this kind of substitute on reclaimed land could<br />
facilitate the developing of stable vegetation cover.<br />
Input of organic and inorganic wastes into soil can resulting in different undesirable<br />
environmental implications and for this reason reclaiming lands always demand detailed longterm<br />
monitoring [3]. Especial care should be taken in the use of sewage sludge for agricultural<br />
purposes [1, 10].<br />
Within our study we focused on the content of total organic carbon as well as the water<br />
extractable organic carbon in reclaiming overlayers applied on the plots of model field<br />
experiment of the burner wastes recultivation, established in 2003 in the area of “DOLNA<br />
ODRA” Power Plant, near Gryfino (Poland).<br />
2. Materials and Methods<br />
After placing the overlayers in 2003, each plot was divided into two parts: the first was put<br />
under grass and on the second part were planted different sh<strong>ru</strong>bs and tree seedlings. The<br />
samples (Table 1) were taken in autumn 2008, from “grass” and sh<strong>ru</strong>b”parts. The depth<br />
sampling was 0–30 cm. From each plot 20 subsamples were randomly collected, mixed for<br />
preparing a “mean” sample. “Mean” samples were in laboratory air dried and passed through<br />
1 mm sieve. Next, three replicates of water extracts were obtained from each sample<br />
according to Gonet and Dębska [4]. The total content of organic carbon (TOC) and water<br />
extractable organic carbon – (WEOC) we determined by dichromate oxidation using Orlov<br />
and Grindel method [7].<br />
<strong>Vol</strong>. 2 Page - 460 -
15th IHSS Meeting- <strong>Vol</strong>. 2<br />
Table 1: Composition of the investigated overlayers<br />
Overlayer<br />
Thickness<br />
Proportions of<br />
Overlayer compositon<br />
description<br />
(cm)<br />
components (v/v)<br />
Control Loose sand 40 sole<br />
I Low-moor peat + pit-coal ash 40 1 : 3<br />
II<br />
Coniferous bark + loose sand + compost<br />
produced with GWDA method + pit-coal ash<br />
40 1 : 1 : 2 : 4<br />
IV<br />
Loose sand + pit-coal ash + compost produced<br />
with GWDA method + compost from fermented<br />
municipal sewage sludge<br />
40 1 : 1 : 2 : 4<br />
3. Results and Discussion<br />
a) b)<br />
TOC content [gC kg -1 a. dry mass]<br />
40<br />
30<br />
20<br />
10<br />
0<br />
7,1<br />
29,7<br />
34,4<br />
31,1<br />
TOC content [gC kg -1 a.dry mass]<br />
40<br />
30<br />
20<br />
10<br />
0<br />
5,3<br />
37,6<br />
31,8<br />
33,8<br />
Control I II IV<br />
Control I II IV<br />
Figure 1: The mean content of TOC in the investigated overlayers - (a) plots under grass,<br />
(b) – plots under sh<strong>ru</strong>b vegetation<br />
A shown in Fig. 1, the TOC content ranged between 5.3–37.6 g C·kg -1 of air dry mass sample.<br />
The lowest amount of TOC contained samples derived from the control plots. The overlayers<br />
I, II and IV contained much more TOC than these from control plots, but differ each other<br />
inconsiderably (29.7–37.6 g C·kg -1 of a.d. m.). No significant effect of vegetative cover on<br />
TOC content was observed.<br />
a) b)<br />
WEOC content [gC kg -1 a.dry mass]<br />
1,0<br />
0,8<br />
0,5<br />
0,3<br />
0,0<br />
0,17<br />
0,13<br />
0,26<br />
0,53<br />
WEOC content [gC kg -1 a.dry mass]<br />
1,0<br />
0,8<br />
0,5<br />
0,3<br />
0,0<br />
0,18<br />
0,14<br />
0,19<br />
0,59<br />
Control I II IV<br />
Control I II IV<br />
Figure 2: The mean content of WEOC in the investigated overlayers - (a) plots under grass, (b) – plots<br />
under sh<strong>ru</strong>b vegetation<br />
<strong>Vol</strong>. 2 Page - 461 -
15th IHSS Meeting- <strong>Vol</strong>. 2<br />
Control plots and the overlayers I and II contained similar amounts of water extractable<br />
organic carbon (0.13–0.26 g C·kg -1 ). In the sample of overlayer II, which was taken from<br />
grass part of plot, more WEOC was determined than in this one derived from part under<br />
sh<strong>ru</strong>bs. In both samples of overlayer IV (with addition of sewage sludge compost) it was<br />
found about 2–3 times more water extractable organic carbon compared with the other ones<br />
[Fig. 2].<br />
a) b)<br />
4,0<br />
4,0<br />
3,38<br />
WEOC content [% of TOC]<br />
3,0<br />
2,0<br />
1,0<br />
2,39<br />
0,43<br />
0,77<br />
1,69<br />
WEOC content [% of TOC]<br />
3,0<br />
2,0<br />
1,0<br />
0,38<br />
0,59<br />
1,74<br />
0,0<br />
0,0<br />
Control I II IV<br />
Control I II IV<br />
Figure 3: The percentage share of WEOC in TOC - (a) plots under grass, (b) – plots under sh<strong>ru</strong>b<br />
vegetation<br />
As shown in Fig. 3, the percentage share of WEOC ranged between 0.4–3.4 % of TOC. The<br />
highest percentages of WEOC were stated in case of both control plots. The significant<br />
WEOC share was determined in overlayer IV containing sewage sludge. It was 2–3 times<br />
higher than in other covers, which were prepared without this component.<br />
4. Conclusions<br />
1. The artificial formed organic-mineral overlayers contain about 4–6 times more of TOC in<br />
comparison to control plots.<br />
2. In overlayers composed without addition of sewage sludge, amounts of WEOC are similar<br />
to the amounts found in control plots.<br />
3. Despite of passage of 5 years as the experiment began, the overlayers containing sewage<br />
sludge are still 2–3 times more rich in water extractable organic substances than the<br />
overlayers I and II.<br />
4. Our results confirm the necessity of WEOC monitoring if composted sewage sludge was<br />
used as the soil amedment.<br />
<strong>Vol</strong>. 2 Page - 462 -
15th IHSS Meeting- <strong>Vol</strong>. 2<br />
Acknowledgements<br />
This work was financed by Ministry of Science and Higher Education of Poland (research<br />
grant Nr 3623/B/P01/2007/33 for Elzbieta Gieguzynska).<br />
References<br />
1. F. Adani, F. Tambone, Chemosphere, 60 (2005), 1214.<br />
2. M. H. Chantigny, Geoderma, 113 (2003) 357.<br />
3. Z. Filip, W. Pecher, J. Berthelin, Environ. Pollut., 109 (2000), 83.<br />
4. S.S. Gonet, B. Dębska, J. Pakuła, Zawartość rozpuszczonego węgla organicznego w glebach i<br />
nawozach organicznych, Polskie Towarzystwo Substancji <strong>Humus</strong>owych, Wrocław, 2002, p.76.<br />
5. S. Jala, D. Goyal, Bioresour. Technol., 97 (2006) 1136.<br />
6. S. Mukhtar, A.L. Kenimer, S.S. Sadaka, J.G. Mathis, Bioresour. Technol, 89 (2003) 217.<br />
7. D.S. Orlov, L.A. Grishina, N.L. Jeroshiceva, Praktikum po biokhimii gumusa, Izd. Moskovskogo<br />
Universiteta, Moskva, 1969, p. 158.<br />
8. J.A. Pascual, C. García, T. Hernández, Bioresour. Technol, 68 (1999), 255.<br />
9. S.K. Rautaray, B.C. Ghosh, B.N. Mittra, Bioresour. Technol, 90 (2003), 275.<br />
10. J.W.C. Wong, D.C. Su, Bioresour. Technol, 59 (1997) 97.<br />
<strong>Vol</strong>. 2 Page - 463 -
15th IHSS Meeting- <strong>Vol</strong>. 2<br />
Study the Content of Humic Substances in Different Organic Matter<br />
Sources and the Effect of HA Derived from City Waste Compost on Some<br />
Soil Properties<br />
S. Samavat * , M.M. Tehrani<br />
Soil and Water Research Institute, Tehran, Iran<br />
E-mail: saeedsamavat@hotmail.com<br />
1. Introduction<br />
The poor organic matter content in agricultural lands is one of the main reasons for low soil<br />
productivity and low quality and quantity of agricultural producers. One of the main sources<br />
of organic matter is the city waste compost which can be treated and recycled to the soil.<br />
Humic acid (HA) is a fraction of humic substances which have great effects on the<br />
bioavailability of plant nutrients and soil physical, chemical and biological properties.<br />
2. Materials and Methods<br />
In this study the HA content of in wheat straw, poultry manure, city waste compost and<br />
manure vermicompost compared with each other and the effect of different rates and<br />
incubation times of HA incorporated in soil were determined. The HA rates were 0, 10, 20,<br />
30, 40 and 50 L/ha and the sampling times were 20, 40 and 60 days after incubation time. The<br />
Soil pH, electrical conductivity, plant available Fe, Zn, Cu, P, K and organic carbon were<br />
analysed in each sample. Soil aggregates stability was determined in samples taken 60 days<br />
after incubation with MWD method (Kemper, 1965).<br />
3. Results and discussions<br />
Humic acid had a decline effect on soil pH but increased the soil salinity and soil organic<br />
carbon. It also increased the available forms of Fe, Mn, K and P compared to control. An<br />
increase in bioavailability of these nutrients is reported in Fernandex, 1968 and for Fe in<br />
Barnard et al .1992 and Garcia et al; 1995. HA treatments had a significant effect on soil Zn<br />
and Cu.<br />
It is showed in other studies that soil incubation with HA increases the availability of plant<br />
nutrients in short time and then the effect would be less (Lee et al., 1976, Fernandex, 1968)<br />
which is in the same manner which showed in this study.<br />
<strong>Vol</strong>. 2 Page - 464 -
15th IHSS Meeting- <strong>Vol</strong>. 2<br />
Table 1: The effects of HA application rates on some soil chemical properties<br />
Treatments Fe Zn Cu Mn P K O.C<br />
L/ha mg/kg %<br />
C 0 3.80 2.63 3.43 11.29 11.16 203 0.68<br />
C 10 3.82 2.64 3.53 11.83 11.67 462 0.68<br />
C 20 3.80 2.74 3.73 13.93 12.58 474 0.68<br />
C 30 3.80 2.64 3.19 16.60 12.29 952 0.68<br />
C 40 4.02 2.83 3.37 18.04 12.56 1460 0.74<br />
C 50 3.94 2.90 3.61 20.33 13.98 1826 0.77<br />
Garcia et al., 1995 showed that the complexation of Fe with soil humic substances can<br />
maintain the required Fe for plants. In this study, the Mean Weight Diameter (MWD) of soil<br />
aggregates increased with the rates of HA significantly which this results also reported in<br />
Visser et al., 1988 and Shanmuganathan, 1983. They showed that HA in low concentration<br />
would cause the dispersion of soil aggregates but higher rates would flocculate the soil<br />
particles. In this study the MWD was low in 10 L/ha rate and increased significantly in higher<br />
rate of application.<br />
Table 2: The effects of incubation times on some soil chemical properties<br />
Treatments Fe Zn Cu Mn P K O.C<br />
(Days) mg/Ka %<br />
20 4.39 5.04 7.44 24.31 12.86 1487 0.77<br />
40 3.67 1.35 1.52 10.59 12.27 641 0.73<br />
60 3.54 1.82 1.48 11.11 11.99 696 0.63<br />
Table 3: The effects of Ha treatments on MWD<br />
Treatments MWD<br />
C 0 0.126<br />
C 10 0.115<br />
C 20 0.131<br />
C 30 0.213<br />
C 40 0.227<br />
C 50 0.167<br />
<strong>Vol</strong>. 2 Page - 465 -
15th IHSS Meeting- <strong>Vol</strong>. 2<br />
4. Conclusion<br />
Humic substances such as HA increase the availability of some plant nutrients especially in<br />
the early stages of incubation and also increases the aggregation of soil particles. In arid and<br />
semiarid regions such as climate condition in Iran with poor soil organic matter, humic<br />
substances have a major role in sustainable soil fertility and the city waste compost can have a<br />
great effect to increase the soil health.<br />
References<br />
1. R.O. Barnard,Van der Watt and H.H.Dekker (1992). Application of Fe and Zn to lime-rich soil in<br />
the form of formulated coal products. Sci. Total Environ., 117/118,569–574.<br />
2. V.H. Fernandex. (1968). The action of humic acids on different sources on the development of<br />
plants and their effect on increasing concentration of the nutrient solution. Pont. Acad. Sci. Scr.<br />
Varia 32:805–850.<br />
3. M.J.M. Garcia, D.M. Sanchez, J. Iniguez and J. Abadia (1995). The ability of several iron) II)-<br />
humic complexes to provide available iron to plants under adverse soil conditions. Iron Nutrition<br />
in soils and Plants. Proc. of the 7th Int. Sypm. on Iron Nutrition and Interactions in Plants,<br />
Zaragoza-Spain, 27 June–July, 1995, 235–239; Developments in Plant and Soil Sciences <strong>Vol</strong>. 59<br />
4. W.D. Kemper (1965). Aggregate stability. In: Methods of Soil Analysis, Part I. (Black C. A., ed.)<br />
Am. Soc. of Agr. Inc., Madison, Wisconsin, 511–519 .<br />
5. Y.S.Lee and R.J. Bartlett (1976). Stimulation of plant growth by humic substances. Soil Sci. Soc.<br />
Am. J., 40:876–879.<br />
6. R.T. Shanmuganathan and J.M. Oades (1983). Influence of anion on dispersion and physical<br />
proprties of the A horizon of a red-brown earth. Geoderma.29, 257–259.<br />
7. S.A. Visser and M. Caillier (1988). Observations on the dispersion and aggregation of clays by<br />
humic substances: I. Dispersive effects of humic acids. Geoderma. 42, 331–337.<br />
<strong>Vol</strong>. 2 Page - 466 -
15th IHSS Meeting- <strong>Vol</strong>. 2<br />
Biosolid Stabilization Degree Affects Soil Fulvic Acid Properties<br />
After Application in a Semiarid Agroecosystem<br />
Pedro Soler-Rovira a* , Juan Carlos García-Gil a , César Plaza a , Nicola Senesi b , Alfredo Polo a<br />
a Instituto de Ciencias Agrarias, Centro de Ciencias Medioambientales, CSIC,<br />
Serrano 115 dpdo., 28006 Madrid, Spain; b Dipartimento di Biologia e Chimica Agroforestale<br />
ed Ambientale, University of Bari, Via Amendola 165/A, 70126 Bari, Italy<br />
E-mail: pedro.soler@ccma.csic.es<br />
1. Introduction<br />
Soil organic matter (SOM) exerts an important role in several agronomic, environmental, and<br />
geochemical processes. Fulvic acid (FA) is an important fraction of humified SOM, with<br />
greater solubility and mobility than humic acids (HA), which implies that FAs have higher<br />
levels of chemical and physico-chemical activity in soil [1]. Recycling of organic wastes like<br />
biosolids in degraded agro-ecosystems can increase SOM content and contributes to solve<br />
environmental and economic problems related to the disposal of these materials. However, the<br />
addition of biosolid organic matter (BOM) may produce modification of the chemistry and<br />
functions of native SOM [2], especially of its most active fractions like FAs [3, 4].<br />
The objectives of this work were to: (a) determine and discuss comparatively the molecular<br />
and st<strong>ru</strong>ctural properties of the FA fraction of natural soil and of variously biosolid (BS)-<br />
amended soils; and (b) investigate the residual and cumulative effect of BS application on the<br />
chemical properties of soil FAs.<br />
2. Materials and Methods<br />
A field experiment was conducted over four years in the south-east area of Madrid province<br />
(Spain) with semiarid climate (400 mm average rainfall, 14.6 ºC mean temperature) on a soil<br />
classified as a Lithic Xerorthent (Soil Survey Staff) historically devoted to intensive cereal<br />
cropping under dry farming and without any application of organic amendments. A fresh BS<br />
sample was collected in a municipal sewage treatment plant equipped with a conventional<br />
biological treatment followed by aerobic stabilization and mechanical dehydration of the BS<br />
by a pressure filter system. The composted biosolid (CS) was obtained by composting BS and<br />
wood chips mixtures (2:1) by a conventional process until compost maturity. The main<br />
characteristics of the soil and the two biosolid samples used are shown in Table 1.<br />
<strong>Vol</strong>. 2 Page - 467 -
15th IHSS Meeting- <strong>Vol</strong>. 2<br />
The experimental design was randomly distributed in three blocks with plots (15 × 3 m 2 )<br />
cropped to barley where both biosolids were applied at 80 t ha -1 (dry matter basis) and a<br />
nonamended soil was the control (CONT). In the second year the plots were divided into two<br />
parts: in one half the same amount of biosolids was applied yearly for four years in order to<br />
study their cumulative effect (A), while in the other sub-plot no more biosolid application was<br />
made and the residual effect (R) of the biosolid application of the first year was evaluated.<br />
Table 1: Chemical composition and properties (1) (±SE) of the soil and biosolids examined<br />
Soil BS (2) CS (2)<br />
Dry matter (g kg -1 ) – 165 ± 21 703 ± 52<br />
pH (H 2 O) 8.1 ± 0.1 6.1 ± 0.2 7.1 ± 0.1<br />
pH (KCl) 7.8 ± 0.1 – –<br />
E.C. (dS m -1 ) 0.90 ± 0.01 7.00 ± 0.42 5.90 ± 0.28<br />
CaCO 3 (g kg -1 ) 570 ± 32 – –<br />
Organic Carbon (g kg -1 ) 10.5 ± 0.5 239 ± 19 164 ± 11<br />
Nitrogen (g kg -1 ) 1.10 ± 0.02 54 ± 5 14 ± 1<br />
C/N ratio 9.6 4.5 11.8<br />
(1) All data are expressed on a dry matter basis. (2) Average values of the biosolids applied each year<br />
After four years, at harvest time, samples were collected from the top 15 cm of soil, air-dried<br />
and sieved (2 mm). Before isolating the FA fraction the carbonates were removed with 2M<br />
H 3 PO 4 and then the samples were washed with distilled water until pH 7. Then three soil<br />
extractions (1:10) were carried out, the first two with 0.1M sodium pyrophosphate (pH 9.8)<br />
and the third with 0.1M NaOH. The combined extracts were acidified with HCl to pH 1 and<br />
left standing for 24 h in a refrigerator, then centrifuged at 15.000 g and, finally, the<br />
supernatant was filtered through a Whatman No. 31 filter paper. The acidic filtrate containing<br />
the dissolved FA fraction was passed through a column filled with XAD-8 resin. Adsorbed<br />
FA was then recovered by elution with 0.1M NaOH, desalted using an Amberlyst 15-cationexchange<br />
resin, and finally freeze-dried.<br />
The FAs samples were heated overnight (105 ºC) to determine the moisture content, and then<br />
at 550 ºC for 2 h to determine the ash content. The C, H, N, and S contents were measured<br />
using an elemental analyzer (Fisons Inst<strong>ru</strong>ments), and oxygen content calculated by<br />
difference: O% = 100 - (C+H+N+S)%. The E 4 /E 6 ratios were obtained from the absorbances<br />
measured at 465 and 665 nm on 3.0 mg of FA dissolved in 10 mL of 0.05M NaHCO 3 adjusted<br />
to pH 8.3 [5]. The Fourier transform infrared (FTIR) spectra were obtained in the range 4000–<br />
400 cm -1 (peak resolution of 2 cm -1 ) with a Nicolet 5PC FTIR spectrophotometer using<br />
pelleted samples (1 mg of FA and 400 mg of dried KBr spectrometry grade).<br />
<strong>Vol</strong>. 2 Page - 468 -
15th IHSS Meeting- <strong>Vol</strong>. 2<br />
3. Results and Discussion<br />
With respect to CONT-FA, the FAs from biosolid-amended soils show slightly larger C, N<br />
and S contents, similar H content and C/H and O/C ratios, and smaller O contents and C/N<br />
ratios (Table 2).<br />
Table 2: Elemental composition (±SE) and E 4 /E 6 ratios of fulvic acids isolated<br />
C H N S O C/N C/H O/C E 4 /E 6<br />
(g kg -1 ) (1) (atomic ratios) ratio<br />
CONT 487±4 54±1 37±0 5±0 418 15.5 0.7 0.6 11.6<br />
CS-R 488±2 54±2 43±2 9±0 406 13.1 0.7 0.6 14.0<br />
BS-R 526±8 57±0 44±0 7±0 366 14.0 0.7 0.5 14.6<br />
CS-A 493±6 58±1 55±1 16±1 379 10.5 0.7 0.6 14.3<br />
BS-A 501±5 56±0 45±0 10±2 388 12.9 0.7 0.6 17.5<br />
Soil (2) 457 54 21 19 448 25.4 0.7 0.7 9.6<br />
(1) Data expressed on moisture- and ash-free basis. (2) From Schnitzer [6]<br />
The E 4 /E 6 ratios of FAs isolated from biosolid-amended soils are higher than that of CONT-<br />
FA (Table 2). Further the E 4 /E 6 values of FAs from CS-R and CS-A are lower than those of<br />
FAs from BS-R and BS-A. This suggests a large molecular weight and size [5] in the FAs<br />
after CS applications, and reflects a higher degree of humification of the OM from the CS in<br />
comparison with BS.<br />
CONT<br />
CS-R<br />
BS-R<br />
3343 2937<br />
1400<br />
1085<br />
1212<br />
1729<br />
CS-A<br />
3342<br />
2938<br />
1400<br />
1079<br />
1207<br />
1717<br />
BS-A<br />
3341<br />
2936<br />
1399<br />
1076<br />
1043<br />
1215<br />
1717<br />
2937<br />
1076<br />
3346<br />
1399<br />
1039<br />
1221<br />
1073<br />
2936<br />
1717<br />
1042<br />
3340<br />
1397<br />
1222<br />
1717<br />
4000<br />
3500<br />
3000<br />
2500<br />
2000<br />
1500<br />
1000<br />
500<br />
Wavenumbers (cm -1 )<br />
Figure 1: FT IR spectra of FAs isolated from soil samples<br />
<strong>Vol</strong>. 2 Page - 469 -
15th IHSS Meeting- <strong>Vol</strong>. 2<br />
The main features of the FT IR spectra of FAs isolated from soils are similar to those reported<br />
in previous studies on FAs from soils amended with other organic wastes [3,4]. The FT IR<br />
spectra of FAs from CS-A and BS-A differ from those of FAs from BS-R and CS-R. In<br />
particular: (a) the bands at 2938–2936 cm -1 and at 1085–1039 cm -1 are less intense in CS-R<br />
and BS-R, which suggests less aliphatic character and polysaccharide content in FAs after<br />
four years of a single biosolid applications; (b) the intensity of absorptions of COOH groups<br />
(1729–1717 cm -1 ) and phenolic OH (at about 1400 cm -1 ) is greater for CS-A and BS-A, which<br />
suggests an increased acidic and phenolic character after four years of continuous application<br />
of biosolids.<br />
4. Conclusions<br />
The results from FT IR spectroscopy support and complement the elemental analysis data and<br />
E 4 /E 6 ratios values in confirming the lower aliphatic character and polysaccharide content and<br />
the larger presence of acidic and N-containing groups in biosolid-amended soils FA with<br />
respect to the unamended soil (CONT). The differences between FAs from amended soils and<br />
CONT-FA become more evident with increasing cumulative amount of biosolids applied over<br />
time.<br />
Acknowledgements<br />
The authors acknowledge the Canal de Isabel II (Madrid) for financial support. Pedro Soler-<br />
Rovira is a recipient of a JAE-Doc Contract from the CSIC.<br />
References<br />
1. F.J. Stevenson, <strong>Humus</strong> Chemistry: Genesis, Composition, Reactions, Wiley/Interscience, New<br />
York, 1994.<br />
2. N. Senesi, T.M. Miano, G. B<strong>ru</strong>netti, in A. Piccolo (Ed.), Humic Substances in Terrestrial<br />
Ecosystems, Elsevier, New York, 1996, p. 531.<br />
3. C. Plaza, N. Senesi, G. B<strong>ru</strong>netti, J. C. García-Gil, A. Polo, V. D'Orazio, Soil Tillage Res., 74<br />
(2003) 179.<br />
4. J.C. García-Gil, C. Plaza, N. Senesi, G. B<strong>ru</strong>netti, A. Polo, Clean, 35 (2007) 480.<br />
5. Y. Chen, N. Senesi, M. Schnitzer, Soil. Sci. Soc. Am. J., 41 (1977) 352.<br />
6. M. Schnitzer, in M. Schnitzer and S.U. Khan (Ed.), Soil Organic Matter, Elsevier, Amsterdam,<br />
1978, Humic Substances: Chemistry and Reactions, p. 1.<br />
<strong>Vol</strong>. 2 Page - 470 -
15th IHSS Meeting- <strong>Vol</strong>. 2<br />
Molecular Characterization of Humic Acids Extracted from Compost at<br />
Increasing Maturity Stages<br />
Spaccini Riccardo a, b* , Piccolo Alessandro a, b<br />
a DiSSPAPA, Università di Napoli Federico II, via Università 100, 80055 Portici, Italy;<br />
b CERMANU Università di Napoli Federico II, via Università 100, 80055 Portici, Italy<br />
E-mail: riccardo.spaccini@unina.it<br />
1. Introduction<br />
Organic biomasses recycled in compost are useful in improving both environmental quality and<br />
sustainable agriculture. A particular advantage of compost amendment to soil is the increase in<br />
colloidal humified organic matter that strongly affect the quality of endogenous humic substances<br />
and reduce the mineralization of biolabile compounds, thereby enhancing the role of soil organic<br />
matter (SOM) as a sink of organic carbon [1, 2]. A detailed molecular characterization of<br />
humified constituents formed during composting process appears, thus, as an essential<br />
requirement for evaluating the stability of organic material and understanding the role of compost<br />
in agricultural and environmental processes. Both 13 C Cross-Polarization Magic-Angle-Spinning<br />
Nuclear Magnetic Resonance ( 13 C-CPMAS-NMR) and off-line pyrolysis in the presence of<br />
tetramethylammonium hydroxide (TMAH) followed by gas chromatography-mass spectrometry<br />
(Pyr-TMAH-GC-MS), could provide a detailed molecular information in a wide range of solid<br />
organic matrices [3].<br />
The objective of this work was to apply a combination of 13 C-CPMAS NMR and pyrolysis (Pyr-<br />
TMAH-GC-MS) to evaluate the molecular changes occurring in humic acids extracted from<br />
compost at different degrees of biological maturity.<br />
2. Materials and Methods<br />
The biomass used in compost (GeSeNu Srl, Pe<strong>ru</strong>gia, Italy) was as follows: 50% domestic<br />
organic wastes, 30% refuse from plant trimming, 20% vegetal residues from tobacco. Compost<br />
products were obtained aerobically after 30 days of a common active phase, followed by three<br />
different curing phases of an additional 30, 60 or 120 days, that yielded compost samples of<br />
different maturities. The extractions were conducted in triplicate for each compost sample,<br />
obtaining the following humic matter: HA-60 HA-90; HA-150, (humic acid extracted,<br />
respectively, after 60, 90 and 150 days of the composting process).<br />
Solid-state 13 C NMR spectroscopy. Solid-state NMR spectroscopy ( 13 C-CPMAS-NMR) was<br />
conducted on a B<strong>ru</strong>ker AV-300, equipped with a 4-mm wide-bore MAS probe. NMR spectra<br />
<strong>Vol</strong>. 2 Page - 471 -
15th IHSS Meeting- <strong>Vol</strong>. 2<br />
were obtained by applying the following parameters: 13000 Hz of rotor spin rate; 1 s of recycle<br />
time; 1 ms of contact time; 20 ms of acquisition time; 4000 scans.<br />
Off-line pyrolysis TMAH-GC-MS. About 200 mg of HA were placed in a quartz boat and<br />
moistened with 1 mL of tetramethylammonium hydroxide (TMAH 25% in methanol) solution.<br />
After drying the mixture under a gentle stream of nitrogen, the quartz boat was introduced into a<br />
Pyrex tubular reactor (50 × 3.5 cm i.d.) and heated at 400 °C for 30 min (Barnstead Thermolyne<br />
21100 furnace).<br />
The GC-MS analyses were conducted with a Perkin Elmer Autosystem XL by using a RTX-<br />
5MS WCOT capillary column, Restek, 30 m × 0.25 mm; film thickness, 0.25 μm) that was<br />
coupled, through a heated transfer line (250 °C), to a PE Turbomass-Gold quad<strong>ru</strong>pole mass<br />
spectrometer. Mass spectra were obtained in EI mode (70 eV), scanning in the range 45–650<br />
m/z, with a cycle time of 1 s. For quantitative analysis, external calibration curves were built by<br />
mixing methyl-esters and/or methyl-ethers of the following standards: heptadecane, tridecanoic<br />
acid, cinnamic acid, octadecanol, 16-hydroxyhexadecanoic and docosanedioic acids, and β-<br />
sitosterol.<br />
3. Results and Discussion<br />
Solid-state 13 C NMR spectroscopy. The NMR spect<strong>ru</strong>m of HA extracted from less mature<br />
compost (HA-60), revealed an initial composition dominated by both alkyl and sugar components<br />
(Fig. 1). The broad peak centered around 30 ppm indicated a large content of methylenic chains or<br />
CH 2 groups, deriving from various lipid compounds, plant waxes and biopolyester, while the<br />
strong resonances in the O-alkyl-C region (60–110 ppm), are currently assigned to monomeric<br />
units, in oligo- and polysaccharidic chains of plant woody tissues. The signal around 56 ppm may<br />
be associated with either methoxy substituent on aromatic rings of guaiacyl and syringyl units of<br />
lignin st<strong>ru</strong>ctures, or C–N bonds in aminoacid moieties. A significant amount of condensed<br />
aromatic and olefinic carbons were revealed by the broad band around 130 ppm. Conversely, the<br />
small shoulder in the phenolic aromatic region (140–160 ppm) indicated a low content of O-<br />
substituted ring carbons, usually coupled to methoxy substituents in lignin components. The<br />
amount of methoxyl and phenolic groups in lignin moieties of HA extracts was evaluated by<br />
NMR dipolar dephasing (DD) experiments. The lower intensity found for both methoxyl and<br />
phenolic resonances, suggested the prevalent contribution of peptidic moieties to the peak<br />
centered at 56 ppm. Lower amounts of carbohydrates and polysaccharides were shown by the<br />
signals related to various pyranoside st<strong>ru</strong>ctures in NMR spectra of HA 90 and HA 150 isolated at<br />
<strong>Vol</strong>. 2 Page - 472 -
15th IHSS Meeting- <strong>Vol</strong>. 2<br />
increasing compost maturity (Fig. 1). Moreover, the uneven decrease found for the various<br />
carbons associated to pyranoside st<strong>ru</strong>ctures, with a relative increase of resonance around 62 ppm<br />
for HA-150, suggested the presence of resistant material of different origin, such as O–C groups<br />
in either methoxy or epoxy substituents in plant alkyl polyesters. In fact, in contrast to the<br />
decrease of polysaccharide signals, a relative larger content of aliphatic compounds was shown<br />
for HA 90 and HA 150 (Fig. 1) thereby confirming the incorporation of stable hydrophobic alkyl<br />
components lipid components in HA from more mature compost.<br />
176<br />
130<br />
73<br />
66-63<br />
89-84<br />
56<br />
30<br />
HA-60<br />
HA-90<br />
HA-150<br />
ppm<br />
200<br />
150<br />
100<br />
50<br />
0<br />
Figure 1: CP-MAS 13 C-NMR spectra of HA extracted from compost at increasing maturity stages<br />
Off-line Pyr-TMAH-GC-MS. As revealed by spectroscopic results, a small range of lignin<br />
compounds was found among thermochemolysis products of HA-60 from less mature compost.<br />
The most important lignin monomers were represented by the oxidized forms of para-, di- and<br />
trimethoxy phenylpropane molecules, thereby suggesting a limited decomposition of woody<br />
fragments in the bulk compost and an incorporation in HA of lignin products which reached<br />
extensive degradation. The large range of main aliphatic compounds found in HA-60 (Table 1),<br />
represented by fatty acids, alkanedioic acids, hydroxyacids and linear hydrocarbons, suggested a<br />
prevalent plant origin followed by microbial derivatives. Moreover a significant amount of plant<br />
tricyclic diterpenes, and tetra- and pentacyclic triterpenes were identified among<br />
thermochemolysis products. In HA-90 and HA-150, steady larger amounts were found for longchain<br />
alkyl dicarboxylic acids, ω-hydroxyacids and, to a lower extent, for mid-chain hydroxy<br />
acids. The persistence of these alkyl molecules in HA from mature compost is a current feature<br />
for naturally humified organic matter like humin and humic acids. Moreover, the selective<br />
incorporation and preservation of hydrophobic molecules in HA from mature compost samples,<br />
<strong>Vol</strong>. 2 Page - 473 -
15th IHSS Meeting- <strong>Vol</strong>. 2<br />
has previously been shown to lead to accumulation of recalcitrant organic compounds in both<br />
composting plant litter and in compost amended soils.<br />
Table 1: Composition a and yields (μg·g -1 CO) b of main thermochemolysis products released from<br />
humic acids extracted at different compost maturity<br />
Compounds HA-60 HA-90 HA-150<br />
Fatty acids 15750 C 12 ÷C 30 (C 18:1 ) 15100 C 12 ÷C 30 (C 18:1 ) 16250 C 12 ÷C 30 (C 18:1 )<br />
Alkanedioic acids 6150 C 16 ÷C 24 (C 18:1 ) 7300 C 16 ÷C 24 (C 18:1 ) 8100 C 16 ÷C 24 (C 20 )<br />
ω-Hydroxy acids 5850 C 14 ÷C 26 (C 18:1 ) 6750 C 14 ÷C 26 (C 18:1 ) 7400 C 14 ÷C 26 (C 18:1 )<br />
Mid-chain hydroxy acids 3350 (C 16, C 18 ) 3280 (C 16, C 18 ) 4240 (C 16, C 18 )<br />
n-alkanes 3140 C 25 ÷C 33 (C 29 ) 3390 C 25 ÷C 33 (C 29 ) 3400 C 25 ÷C 33 (C 29 )<br />
Short-chain alkanedioic 1250 (C 6 –C 11 ) 1190 (C 6 –C 11 ) 1370 (C 6 –C 11 )<br />
2-Hydroxy acids 850 (C 21 –C 26 ) 790 (C 21 –C 26 ) 820 (C 21 –C 26 )<br />
Diterpenoid 1150 1010 1240<br />
Triterpenoid 1230 1300 1480<br />
a. Total range varying from Ci to Cj; compounds in parentheses are the most dominant homologues; number<br />
after colon refer to double bond<br />
b. n = 3. Overall coefficient of variations lower than 10 %<br />
4. Conclusions<br />
A wide range of linear and cyclic lipid components of plant and microbial origin, plant<br />
polysaccharides and aromatic material were recognized as the main sources of the stable fraction<br />
of compost. The steady incorporation of organic material in HA at subsequent compost maturity<br />
stages was characterized by a slight decrease of O-alkyl compounds, and a selective preservation<br />
of recalcitrant hydrophobic molecules. The off-line Pyr-TMAH-GC-MS technique was confirmed<br />
to be an effective method to obtain direct qualitative and quantitative evaluation of organic<br />
components in HA. It allows the identification of various lipid compounds and typical plant<br />
biomarkers, whose evaluation represents a valuable tool to trace the origin of humified material<br />
and transformation of stable organic fractions in soil after compost applications.<br />
References<br />
1. A. Piccolo, R. Spaccini, R. Nieder and J. Richter Sequestration of a biologically labile organic<br />
carbon in soils by humified organic matter. Clim. Change 67 (2004) 329–343.<br />
2. R. Spaccini, A. Piccolo., P. Conte, G. Haberhauer, and M.H. Gerzabek. Increased soil organic<br />
carbon sequestration through hydrophobic protection by humic substances. Soil Biol. Biochem. 34<br />
(2002) 1839–185.<br />
3. R. Spaccini and A. Piccolo. Molecular characterisation of compost at increasing stages of<br />
maturity. II: Thermochemolysis-GC-MS and 13 C-CPMAS-NMR spectroscopy. J. Agric. Food<br />
Chem. 55 (2007) 2303–2311.<br />
<strong>Vol</strong>. 2 Page - 474 -
15th IHSS Meeting- <strong>Vol</strong>. 2<br />
Physical Properties of Urban Compost-Based Growing Media<br />
Rafael López a *, J. Carlos Ostos a , M.J. Díaz b<br />
a IRNAS-CSIC, PO Box 1052, 41080 Sevilla, Spain; b Departamento de Ingeniería Química,<br />
Universidad de Huelva, Ctra. Huelva-Palos de la Frontera s/n, 21819 La Rábida, Palos de la<br />
Frontera, Huelva, Spain<br />
E-mail: rlnunez@irnase.csic.es<br />
1. Introduction<br />
Most nurseries in the world have based their growing media on peat. However, peat is being<br />
rapidly depleted, and peat mining is a matter of environmental concern. Research on peat<br />
alternatives is of great interest but physical (and chemical) characterization of compost-based<br />
growing media is the first need for their proper use. Different authors [1] have suggested that<br />
some organic materials such as well-composted municipal solid waste and biosolids composts<br />
could be feasible materials for a partial peat substitution. The combination of peat and<br />
compost in growing media is synergistic; peat often enhances aeration and water retention and<br />
compost or other additives improves the fertilizing capacity of a substrate. In addition, organic<br />
by-products and composts tend to have porosity and aeration properties comparable to those<br />
of bark or peat and, as such are ideal substitutes in nursery growing media.<br />
The aim of this study was to evaluate the hydrophysical properties of growing media in which<br />
urban composts and bark were included.<br />
2. Materials and Methods<br />
Three composts, mixed with peat (C) and pine bark (B), were used as components of growing<br />
media. Compost S was produced by composting biosolids and p<strong>ru</strong>ning waste in a 1:3 ratio in<br />
volume. Compost M was produced from a mixture of unsorted municipal solid waste (particle<br />
size
15th IHSS Meeting- <strong>Vol</strong>. 2<br />
Analyses were carried out in triplicate. Dried samples were used for the determination of<br />
particle size distribution by a sieve shaker. Sieves of 25, 10, 4, 2, and 0.5 mm were used. Each<br />
particle size percentage was calculated by dividing the dry weight of the fraction size by the<br />
total dry weight sample. Particle classes >4 mm (25–10 mm and 10–4 mm) were grouped in a<br />
unique class.<br />
3. Results and Discussion<br />
The distribution of particle sizes of the growing media is given in Figure 1. In compost-based<br />
substrates percentage of coarser particles (10–4 mm and 4–2 mm) was greater than in control<br />
substrate C (commercial mixture of black and white peats, indicated as solid lines in the<br />
figure). Percentage of smallest particles (< 0.5 mm) was greater in compost M basedsubstrates,<br />
lower in compost S based-substrates and intermediate and similar to C in compost<br />
MS-based substrates. Percentages of the particle size class 2–0.5 mm were lower in compostbased<br />
substrates.<br />
Physical properties of growing media are shown in Table 1. Bulk densities and particle<br />
densities of compost media were greater than those of peat (C) substrate, but included in the<br />
optimun ranges [4]. Bulk density showed a close relationship with particle size percentages<br />
(MS-based substrates excluded) expressed by:<br />
BD = 2.525–0.032 [25-4 mm]–0.035 [2-0.5 mm]–0.013 [
15th IHSS Meeting- <strong>Vol</strong>. 2<br />
because small particles filled in the pores between the coarser ones. In a previous study [5]<br />
with similar composts, BD was also linearly and inversely related to coarser particles (10–4<br />
mm) percentage. The actual- versus calculated-BD were shown in figure 2.<br />
Total pore space (TP) in compost-based media fell down the optimum range [4] except for<br />
M20, MS20, S20, and S40B40 mixtures (Table 1). All compost-based media had lower TP<br />
than peat substrate, C. TP also was related to particle size by the expression (data for MS<br />
substrates excluded):<br />
TP = -2.751+1.308 [25–4 mm]+1.404 [2–0.5 mm]+0.514 [
15th IHSS Meeting- <strong>Vol</strong>. 2<br />
disadvantageous hydrophysical properties in relation to commercial peat substrate and<br />
recommended ranges.<br />
Bulk density and total pore space were related to particle size distribution which denotes that<br />
previous screening of compost or selection of specific size fractions could allow to obtain<br />
mixtures with correct physical properties. Air volume and water volume probably depended<br />
on the nature of the composts.<br />
Acknowledgements<br />
This study was funded by Spanish Ministry of Science and Innovation (Projects AGR-FOR<br />
2002-02633 and CTM 2007-62117).<br />
References<br />
1. M. Abad, P. Noguera, S. Burés. Bioresource Technology, 77 (2001) 197–200.<br />
2. J.C. Ostos, R. López-Garrido, J.M. Murillo, R. López, Bioresource Technolog., 99 (2008) 1793–<br />
1800.<br />
3. EN 13041, CEN, B<strong>ru</strong>xelles, 1999.<br />
4. E. Carmona, M. Abad, in J. Moreno Casco, R. Moral Herrero (Eds.), Compostaje, Mundi-Prensa,<br />
Madrid, 1st edn, 2007, Chapter 17, p. 397.<br />
5. R. López, F. Cabrera, E. Madejón, F. Sancho, J.M. Álvarez, in: X. Hao (Ed.), Dynamic Soil,<br />
Dynamic Plant 2, (Special Issue 1), Global Science Books, UK, 2008, pp. 60–66.<br />
<strong>Vol</strong>. 2 Page - 478 -
15th IHSS Meeting- <strong>Vol</strong>. 2<br />
Organic Matter Mineralization and Changes in Soil Biophysical<br />
Parameters Following Biochar Amendment<br />
Marco Contin a , Chiara Pituello a and Maria De Nobili a*<br />
a Department of Agricultural and Environmental Science, University of Udine, Udine, Italy<br />
E-mail: maria.denobili@uniud.it<br />
1. Introduction<br />
Biochar is a fine-grained, black and porous substance, similar in its appearance to charcoal,<br />
which is the charred by-product of biomass pyrolysis, the heating of plant-derived material in<br />
the absence of oxygen in order to capture combustible gas [1] to use as a substitute of fossil<br />
fuels. Charred plant materials may play an important role in carbon sequestration [2], hence, it<br />
has been proposed as a mean for C sequestration in soils. It is also claimed that its properties<br />
may also enhance fertility especially in poor and acid soils trough nutrient release [3] and<br />
increase in cation exchange capacity. However, biochar is not biologically inert and can have<br />
important effects on soil biological processes, especially on the decomposition of soil organic<br />
matter. Despite the increasing number of bibliographic references, its potential effect remains<br />
poorly understood and frequently contradictory results are reported [4,5,6]. Biochar<br />
application may have a profound impact on the colour of the soil, therefore affecting solar<br />
energy sorption and reflectance. Modification of the soil heat balance results in changes in<br />
soil temperatures and can potentially alter the decomposition rate of soil organic matter. The<br />
aim of this work was to assess the influence of biochar addition to the CO 2 emissions of a soil<br />
as related to its biomass content, enzymatic activities and on thermic and hydrological<br />
properties.<br />
2. Methods<br />
The soil used for both lab-scale and field-scale experiments is a fine loamy udifluvent, located<br />
in the flat area of Friuli Venezia Giulia in the north-eastern part of Italy. It has a pH of 7.5 and<br />
a cation exchange capacity of 15.7 cmol c kg -1 . Biochar used in the experiment was obtained<br />
by grinding and sieving (1 mm) a commercially available hardwood lump charcoal (elemental<br />
composition: C 80.5%, N 0.4%, H 2.3%, O 12.8%).<br />
The field experiment was conducted during the spring time from May to July 2009. Six 1 m 2<br />
plots were randomly distributed in an homogeneous field. On tree plots, soil was added with a<br />
quantity of biochar corresponding to 100 t/ha which was incorporated into the upper 5 cm of<br />
<strong>Vol</strong>. 2 Page - 479 -
15th IHSS Meeting- <strong>Vol</strong>. 2<br />
soil and moistened to prevent wind dispersion. Soil moisture was determined (105 °C for 24<br />
h) after each rain event. Soil temperature was measured at 6 cm below soil surface with an<br />
automatic device including probes (3 for each plot) buried in the soil and a data-logger to<br />
store hourly measurements (FT 800 System). Soil surface albedo, defined as the ratio between<br />
the reflected energy to the incoming radiation in the wavelength range between 0.4 and 3.0<br />
µm, was determined by two Eppley pyranometers. Measurements were performed during two<br />
cloudless days.<br />
In laboratory experiments, soil amended with biochar at the same rate as used in the field<br />
experiment and non amended soil controls were incubated at 40% of WHC at different<br />
temperatures (5, 15 and 25 °C) in thermostats. Carbon dioxide was trapped into 1 M NaOH<br />
and released CO 2 was determined by automatic titration with a Mettler 40 autoanalyzer. The<br />
incubation lasted 32 days, and at the end microbial biomass C was measured by fumigationextraction<br />
method [7]. Hydrolitic activity was assessed by the hydrolisis of fluoresceine.<br />
Phosphatases were measured at pH 6 and 11 [8].<br />
3. Results<br />
Throughout the experiment, soil moisture in the upper 0–5 cm was always larger in biochar<br />
amended plots with an average increase of 22.5% with respect to the soil in the control plots.<br />
These differences disappeared at lower depths (5–20 cm). Soil temperatures were on average<br />
0.89 °C higher in plots amended with biochar with respect to control plots during the two<br />
months of monitoring. The largest differences in temperatures were recorded during direct<br />
soil insolation and especially from 7 a.m. to 4 p.m. These results can be justified by the<br />
changes in colour of soil, as shown by the Munsell color value component that decreased<br />
from 4 to 3 after addition of biochar. Soil colour had been identified in many studies as a<br />
factor affecting the amount of energy reflected from soil surfaces [9]. Soil albedo changed<br />
accordingly from 0.162 (±0.012) to 0.138 (±0.013).<br />
Laboratory incubations showed that CO 2 evolution was strongly influenced by the addition of<br />
biochar and by the temperature of incubation. At all temperatures, biochar enhanced CO 2<br />
evolution significantly with respect to the controls (Fig. 1).<br />
<strong>Vol</strong>. 2 Page - 480 -
15th IHSS Meeting- <strong>Vol</strong>. 2<br />
CO2-C evolved ( μg g -1 h -1 )<br />
12<br />
10<br />
8<br />
6<br />
4<br />
2<br />
0<br />
Soil + Biochar<br />
Control Soil<br />
0 5 10 15 20 25<br />
30<br />
Temperature (°C)<br />
Figure 1: CO 2 evolution rate from control soil and soil + biochar incubated at 5, 15 and 25 °C<br />
The respiratory quotients (Q CO2 ), expressing the amount of CO 2 evolved per hour per unit<br />
weight of microbial biomass, showed a huge increase due to biochar addition at all three<br />
incubation temperatures (Table 1).<br />
Table 1: Respiratory quotients of microbial biomass in control soil and soil + biochar at different<br />
incubation temperatures<br />
Soil Soil+Biochar<br />
Incubation temp µg C-CO 2 h -1 µg -1 Bc<br />
5 °C 10·10 -4 80·10 -4<br />
15 °C 70·10 -4 190·10 -4<br />
25 °C 130·10 -4 290·10 -4<br />
Soil microbial biomass C, alkaline phosphatase and FDA hydrolyses did not change<br />
significantly during the laboratory incubations at different temperatures and following biochar<br />
addition. On the contrary acid phosphatase showed a marked decrease due to biochar addition<br />
(results not shown). The increasing Q CO2 of microbial biomass was therefore not accompanied<br />
by an enhanced biological activity, this increment is normally associated with the existence of<br />
a stress situation.<br />
The apparent mean residence times of biochar at different incubation temperatures calculated<br />
assuming that CO 2 evolution would maintain indefinitely the same rate as dutring the first 32<br />
days, which is undoubtedly a gross approximation, but a useful and simple way to quantify<br />
results, are very short, being 3.0, 2.3 and 1.3 years respectively at 5, 15 and 25 °C. The<br />
usefulness of biochar as a mean to permanently sequester C is therefore questionable and<br />
should be accurately tested. Several studies have pointed out already that black C is not as<br />
<strong>Vol</strong>. 2 Page - 481 -
15th IHSS Meeting- <strong>Vol</strong>. 2<br />
inert as normally considered [1,4], however the very short residence time, calculated from<br />
CO 2 evolution data, suggest the possible contribution of some type of priming effect.<br />
The extra CO 2 evolved from soil amended with biochar may have originated either from:<br />
biochar itself, native organic carbon or biomass C. The possibility that the extra-CO 2 derives<br />
from mineralization of soil organic matter cannot be discarded. If this would be t<strong>ru</strong>e, biochar<br />
addition could have on the long term, serious effects on soil quality.<br />
4. Conclusions<br />
In our short-term laboratory incubations, the addition of biochar to soil produced a dramatic<br />
increase in CO 2 evolution rates at all temperatures. Considering that biochar addition caused a<br />
visible darkening of soil colour, and increased soil moisture, factors that most determine soil<br />
albedo, hence heat balance, it is expected that the addition of biochar at high rates will result<br />
in an increase in CO 2 evolution. Although several papers have claimed the potential of<br />
biochar as a mean to achieve permanent C sequestration our results show that either this<br />
material is not as recalcitrant as expected or that gains these effects can be partially offset by<br />
its capacity to stimulate loss of native soil C. Therefore the effects of biochar amendment on<br />
the soil C pools need further carefully investigation and all aspects must be considered before<br />
biochar can become a safe way to immobilize C.<br />
References<br />
1. Sohi S, Lopez-Capel E, K<strong>ru</strong>ll E, Bol R (2009) CSIRO Land and Water Science Report 05/09,<br />
Feb<strong>ru</strong>ary, 2009 Australia.<br />
2. Knicker H (2009) In: Senesi, N., et al. (Eds.): Biophysico-chemical processes involving natural<br />
nonliving organic matter in environmental systems. Wiley-IUPAC series, pp.273–304.<br />
3. Kolb SE, Fermanich KJ, Dobush ME (2009) Soil Science Soc. Soc. Am. J. 73, 1173–1181<br />
4. Hammer U, Marschner B, Brodowski S, Amelung W (2004) Org. Geochem. 35, 823–830.<br />
5. Wardle DA, Nilsson MC, Zackrisson O (2008) Nature 320, 629.<br />
6. Steinbeiss S., Gleixner G, Antonietti M (2009) Soil Biol. Biochem.41, 1301–1310.<br />
7. Vance ED, Brookes PC, Jenkinson DS (1987) An extraction method for measuring soil microbial<br />
biomass C. Soil Biol. Biochem. 19, 703–707.<br />
8. Alef K, Nannipieri P, Trazar-Cepeda C (1995) Phosphatase activity. In Methods in applied soil<br />
microbiology and biochemistry’(Eds K Alef, P Nannipieri) pp. 335–344 (Academic Press).<br />
9. Post DF, Finbers A, Matthias AD, Sano EE, Accioly AK, Batchily AK, Ferreira LG (2000) Soil<br />
Science Soc. Soc. Am. J. 64, 1027–1034.<br />
10. Kolb SE, Fermanich KJ, Dobush ME (2009) Soil Sci. Soc. Soc. Am. J. 73, 1173–1181.<br />
<strong>Vol</strong>. 2 Page - 482 -
15th IHSS Meeting- <strong>Vol</strong>. 2<br />
Dissolved Organic Matter (DOM) Evolution During the Composting<br />
Process of Coffee By-Products<br />
Valeria D’Orazio * , Donato Mondelli, Nicola Senesi<br />
Univ. of Bari, Dip. Biol. Chim. Agrof. Amb., Via G. Amendola 165/A, 70126, Bari, Italy<br />
E-mail: dorazio@agr.uniba.it<br />
1. Introduction<br />
In the last years, coffee consumption enhanced markedly in Italy, with the production of large<br />
amounts of residues whose disposal is beginning to represent a serious problem. However,<br />
coffee processing byproducts show various recycling possibilities in agriculture and industry<br />
[1]. Recently, composting has gained increasing attention as a means of reducing the<br />
environmental impact and as a management alternative for the large amounts of wastes of<br />
different origin producted at large scale. The assessment of compost maturity and quality is<br />
generally based on chemical parameters, including the evaluation of humification indexes and<br />
spectroscopic parameters. The aim of the present study was to follow the variations occurring<br />
in dissolved organic matter (DOM) properties during the composting of coffee chaff, coffee<br />
grounds and p<strong>ru</strong>ning residues using UV-Vis and fluorescence spectroscopies.<br />
2. Materials and Methods<br />
Two piles were prepared at an initial C/N ratio= 28 using two different mixtures: pile A, a<br />
mixture of coffee chaff, coffee grounds and p<strong>ru</strong>ning residues (respectively, 280,100 and 600<br />
kg); and pile B, a mixture of coffee chaff and p<strong>ru</strong>ning residues (respectively, 305 and 600 kg).<br />
The composting process was performed for 120 days, by turning the piles daily, maintaining<br />
their humidity at around 65%, measuring the temperature and monitoring a set of chemical<br />
parameters. Samplings were made after 1 (A1 and B1), 16 (A2 and B2), 30 (A3 and B3), 63<br />
(A4 and B4), 91 (A5 and B5), and 120 days (A6 and B6). A suspension of 5 g of each sample<br />
in 100 ml of a 4mM CaCl 2 solution was mechanically shaken for 15 min, centrifuged and then<br />
filtered sequentially through filters of 11, 2.5, 1.2 and 0.45 μ. The DOM in each solution was<br />
analyzed for total organic carbon (TOC), molar absorptivity at 280 nm, E 4 /E 6 , E 2 /E 6 , E 2 /E 4<br />
ratios and fluorescence spectroscopy. Total organic carbon was determined by an<br />
autoanalyzer HiPer-TOC (Thermo Electron Corporation). Spectrophotometric analyses were<br />
conducted on a Perkin Elmer model Lambda 15 UV–vis spectrophotometer by recording<br />
<strong>Vol</strong>. 2 Page - 483 -
15th IHSS Meeting- <strong>Vol</strong>. 2<br />
absorbances at 280 (E 2 ), 465 nm (E 4 ) and 665 nm (E 6 ). Fluorescence single-scan spectra in<br />
the emission, excitation and synchronous-scan modes and total luminescence spectra as<br />
excitation-emission matrices (EEM) were obtained using a Perkin Elmer (Norwalk, CT) LS<br />
55 luminescence spectrophotometer and according to operational details described elsewhere<br />
[2]. Fluorescence intensity (FI) values (in arbitrary unit) were normalized to the TOC content,<br />
and the humification index (HIX) was calculated according to Ohno 2002 [3].<br />
3. Results and Discussion<br />
In both piles, the TOC content decreases in the first 60 days (data not shown), thus indicating<br />
an active mineralization phase. Figure 1 shows the E 4 /E 6 , E 2 /E 6 and E 2 /E 4 ratios of DOM<br />
samples from the two piles during the whole composting time. These ratios represent a useful<br />
tool to evaluate the molecular properties of DOM, since the absorbance at these wavelengths<br />
reflects the nature of the absorbing material. In particular, absorbances at 280, 465 and 665<br />
E 4 /E 6<br />
12.0<br />
15.0<br />
E 2 /E 6<br />
3.0<br />
E 2 /E 4<br />
8.0<br />
10.0<br />
2.0<br />
4.0<br />
5.0<br />
1.0<br />
0.0<br />
0 30 60 90 120<br />
0.0<br />
0 30 60 90 120<br />
0.0<br />
0 30 60 90 120<br />
Pile A Pile B<br />
Pile A Pile B<br />
Pile A Pile B<br />
Figure 1: E 4 /E 6 , E 2 /E 6 and E 2 /E 4 ratios of DOM samples from both piles during composting<br />
nm are mainly due, respectively, to: i) simple aromatic units, phenols, quinones, aniline<br />
derivatives, aromatic acids differently substituted; ii) organic compounds with intermediate<br />
st<strong>ru</strong>ctural complexity, such as carbohydrates, proteins and etc.; and iii) organic compounds<br />
with a high molecular complexity and a great extent of humification and polycondensation<br />
degree. As shown in Fig.1., E 4 /E 6 ratio values increase in the first 30 days of composting and<br />
then remain constant for DOM from pile A, whereas those of DOM from pile B continue to<br />
increase markedly until 90 days (mainly during the thermophilic phase), likely due to the<br />
large amount of polysaccharide-like compounds, and finally decrease to the end of the<br />
mesophilic phase, which suggests the occurring humification. No significative trend is shown<br />
by the E 2 /E 6 ratio of DOM from pile A, whereas the trend of DOM from pile B indicates the<br />
occurrence of a degradative phase until the 90 th day with a massive release of simple aromatic<br />
moieties, and a subsequent strong decrease reasonably due to a re-synthesis phase. The trend<br />
of E 2 /E 4 ratios is similar for the two DOM series. In all DOM samples the values of molar<br />
<strong>Vol</strong>. 2 Page - 484 -
15th IHSS Meeting- <strong>Vol</strong>. 2<br />
absorptivity (ε 280 ) (L x (mole of OC) -1 x cm -1 ) increase in the initial period of composting (30<br />
days) (Fig. 2 up), and are consistent with values reported in the literature for aquatic fulvic<br />
acids [4]. This parameter is helpful to evaluate the<br />
nature of humic materials because at this<br />
ε 280<br />
wavelength ππ* electron transitions occur for<br />
phenolic substances, aniline derivatives, benzoic<br />
acids, polyenes, and polycyclic aromatic<br />
hydrocarbons. The HIX values (Fig. 2 bottom), a<br />
fluorescence-derived parameter inversely<br />
correlated to the H/C ratio, follow a trend similar<br />
to that of ε 280 , which suggests the evolution of raw<br />
organic matter towards a more humified material.<br />
Single-scan fluorescence spectra (not shown)<br />
0.850<br />
0.800<br />
0.750<br />
show, with composting time, a red-shift of the<br />
0 30 60 90 120<br />
emission maxima and an inversion of the main<br />
Pile A Pile B<br />
excitation and synchronous peaks with secondary<br />
peaks. The FI values exhibit a gradual increase<br />
Figure 2: ε 280 and HIX values of<br />
DOM samples from both piles<br />
during composting<br />
until 60 days, due to the presence of simple<br />
st<strong>ru</strong>ctural components of small molecular size and bearing electron-donating substituents such<br />
as hydroxyl, methoxy, and amino groups, which are likely released in the mineralization<br />
phase. Subsequently, the FI values decrease, probably due to the oxidation and condensation<br />
of these groups, which suggests the progress of humification. Additional information was<br />
500<br />
400<br />
300<br />
200<br />
100<br />
0<br />
1.000<br />
0.950<br />
0.900<br />
0 30 60 90 120<br />
Pile A<br />
HIX<br />
Pile B<br />
Figure 3: Total luminescence spectra (Excitation Emission Matrices) of DOM samples from both piles<br />
during composting<br />
<strong>Vol</strong>. 2 Page - 485 -
15th IHSS Meeting- <strong>Vol</strong>. 2<br />
obtained by the Excitation/Emission Wavelenght Pairs (EEWPs) in the total luminescence<br />
(TL) spectra shown in Fig. 3 as excitation/emission matrices (EEM). The EEMs spect<strong>ru</strong>m of<br />
DOM from the initial substrate (C) shows two main fluorophores, α (EEWPs 275 ex /355 em )<br />
and β (EEWPs 325 ex /410 em ), which can be ascribed, respectively, to simple components of<br />
proteinaceous origin such as tryptophan and tyrosine, and aromatic units such as simple<br />
phenolic-like, hydroxy-substituted benzoic and cinnamic acid derivatives and/or coumarins,<br />
respectively [5]. With composting time, the peak<br />
α disappears and the EEWPs values of the peak β<br />
shift towards longer wavelenghts, thus suggesting<br />
an increasing st<strong>ru</strong>ctural complexity and<br />
polycondensation degree. According to<br />
classification of fluorophores population, the α<br />
and β peaks fit into fluorescence regions of typical<br />
soil DOM, fulvic- and humic-like molecules,<br />
respectively, as shown in Fig. 4.<br />
4. Conclusions.<br />
350<br />
340<br />
330<br />
320<br />
310<br />
300<br />
400 405 410 415 420 425 430 435 440 445 450<br />
15th day A 15th day B 60th day A 60th day B<br />
120th day A 120th day B C Soil DOM<br />
Humic‐like<br />
Fulvic‐like<br />
Figure 4: Location of EEWPs for α and β<br />
peaks, and some EEWPs reported in<br />
literature: x [2], + [6] and * [7]<br />
Fluorescence spectroscopy and other spectroscopic parameters utilized in this study are able<br />
to provide complementary and valuable information on the evolution of DOM during the<br />
composting process. After 120 days of composting the DOM from pile B shows<br />
characteristics similar to those of native soil DOM and humic-like fractions, whereas the<br />
stabilization of DOM from pile A seems to be slower, probably due to the presence of coffee<br />
grounds that delay the early mineralization processes.<br />
Acknowledgements<br />
The authors are grateful to Dr. F. Ceglie, Ist. Agr. Med. di Bari- CIHEAM, for supplying the<br />
compost samples used in this work.<br />
References<br />
1. A. Pandey, C. R. Soccol, P. Nigam, D. Brand, R. Mohan, S. Roussos, Biochem. Engin. J., 6 (2000)<br />
153.<br />
2. A. Traversa, V. D’Orazio, N. Senesi, Forest Ecol. Manag., 256 (2008) 2018.<br />
3. T. Ohno, Environ. Sci. Technol., 36 (2002) 742.<br />
4. Y.P. Chin, G. Alken, G., E. O’Loughlin, Environ. Sci. Technol., 28 (1994) 1853.<br />
5. O.S. Wolfbeis, in S.G. Schulman SG (Ed.), Molecular Luminescence Spectroscopy, Part I, Wiley,<br />
New York, 1985, p 167.<br />
6. P.A. Soler-Rovira, G. B<strong>ru</strong>netti, A. Polo, N. Senesi, Compost Sci. Util., 11 (2003) 176.<br />
7. J.J. Alberts, M. Takacs, Org. Geochem., 35 (2004) 243.<br />
<strong>Vol</strong>. 2 Page - 486 -
15th IHSS Meeting- <strong>Vol</strong>. 2<br />
Fluorescence Monitoring of Fulvic and Humic Acid Behavior in Wastewater<br />
Irrigation Experiments (Lins, Brazil)<br />
Mounier Stéphane a* , Noirtin Eric b , Zhao Huiyu a , Montes Célia b , Lucas Yves a<br />
a Université du Sud Toulon Var, Laboratoire PROTEE-CAPTE, BP 20132, 83957 La Garde<br />
Cedex, France; b CENA, NUPEGEL, Av. Pádua Dias, 11, CP 9, Piracicaba, SP, CEP<br />
13418-900, Brésil<br />
E-mail: mounier@univ-tln.fr<br />
1. Introduction<br />
The use of waste water treatment plant for agricultural irrigation is used particularly in<br />
country (Australia, USA, France, Germany, India, UK...) or region where water is a rare [1,2].<br />
This fertirrigation process is use after natural or plant treatment depending on the city size.<br />
The obtained effluents are rich in nutrient leading to good fertilization of soils, but also<br />
introduce organic matter that could modify quantitatively and qualitatively the carbon stock of<br />
soil [3]. The fertirrigation experiment of Lin (Brazil) is about many years of monitoring of<br />
nutrient, soil properties, trace metal and major elements diffusion, agricultural rendering and<br />
nutrient transfer to vegetation. This study focuses on the monitoring of the organic matter<br />
(humic substances) of soils by fluorescence spectroscopy after densimetric separation or on<br />
site extraction. This protocol permit to observed the organic matter aggregation and<br />
humification along the depth profile with and without fertirrigation treatment.<br />
2. Materials and methods<br />
Two set of soil samples were obtained from the site of Lins. One non irrigated soil named<br />
“SI” is the reference soil and one fertirrigated by a water modified with 66% in volume of<br />
waste water from Lins waste water treatment plant named “E66”. Several depth were<br />
collected (0–5, 5–10, 10–20, 20–40, 40–60, 60–80 cm). A densimetric separation is made<br />
with a geoliquid (sodium polytungstate) on dry sieved (2 mm) soil samples to obtain five<br />
densimetric classes of soil carbon :
15th IHSS Meeting- <strong>Vol</strong>. 2<br />
3. Results and Discussion<br />
Distribution of organic carbon between the densimetric fraction shows that the fertirrigated<br />
soil contains more low density moieties than the water irrigated one. The high density fraction<br />
represents less than 60% at the surface to 90–100% at depth 40–60 cm for the two type of<br />
soil. Except for the sample E66 (0–5 cm) and the SI (05–10 cm) the second most important<br />
fraction is the 1.6Liv fraction. For the E66 samples density 1.6–1.8 is present when it is<br />
absent for the SI soils.<br />
The fluorescence intensity of the HA and FA extracted fraction of the E66 soils shows that<br />
the most important fluorescence intensity is related to organic matter that come from the<br />
1.6Liv, 1.6Occ and 1.8–2.0 fractions. The less efficient fraction is represented by the 1.6–1.8<br />
particulate carbon. The most intensive fluorescence is observed from the HA extract, meaning<br />
that the fertirrigated soil becomes richer in HA component after fertirrigation. For the both<br />
soil, the fluorescence is decreasing for surface to depth, as observed for for the organic carbon<br />
content (0.95 to 0.3% w/w). It is observed that the HA from fraction 1.8–2.0 diminishes<br />
rapidly with depth. That could be explained if this fraction is more labile than the other one.<br />
PARAFAC treatment of 3D fluorescence shows two principal fluorescent components are<br />
present in soils (figure 1). The first component shows an emission around 430 nm with an<br />
excitation of about 250 nm corresponding to FA member [5]. The second one is representative<br />
of HA member with a red-shift of wavelength emission and a maximum fluorescence<br />
efficiency for an excitation around 350 nm. No significant protein like fluorescence was<br />
observed for soils water.<br />
Figure 1: Components of PARAFAC fluorescence decomposition from E66 and SI soil water<br />
<strong>Vol</strong>. 2 Page - 488 -
15th IHSS Meeting- <strong>Vol</strong>. 2<br />
Without irrigation (SI) soils show a ratio of FA under HA response respectively of about 2.61<br />
(s=1.54) and 0.96 (s=0.6). This means that fertirrigated soils contain significantly more HA<br />
fluorescent component compared. We expected a younger organic matter in fertirrigated soils<br />
than in reference soils. The humification<br />
Depth (cm)<br />
Fulvic/Humic ratio<br />
0<br />
10<br />
20<br />
30<br />
40<br />
E66<br />
50<br />
SI<br />
60<br />
70<br />
80<br />
90<br />
0 1 2 3 4 5 6<br />
If,fulvic / If,humic<br />
Figure 2: Profile of ratio AF/AH for SI and<br />
E66 soils<br />
process seems to be perturbed by the<br />
introduction of the organic matter originated<br />
from waste water.<br />
It is also observed that the total fluorescence is<br />
decreasing from bottom to depth, with a<br />
preferential degradation of the component 2,<br />
with related to acid humic substances. This<br />
diminishing of AH is also observed on<br />
reference soil (SI) more accurately. On<br />
fertirrigated soil (E66) the ratio is constant until<br />
60 cm (figure 2) as if the fresh organic matter<br />
input maintains the AF/AH ratio. It is clear by fluorescence measurement that fertirrigation is<br />
modifying the humification process.<br />
4. Conclusion<br />
Fertirrigation has an influence on depth profile of FA and HA quantity and quality.<br />
Densimetric separation give distribution showing a higher proportion of HA on soil surface,<br />
with a lower concentration for reference soil. Fluorescence give some information on<br />
transformation of the fresh organic matter introduced by these processes of waste water use.<br />
PARAFAC decomposition of total luminescence spectra confirms the important change in the<br />
organic carbon profile between reference soil and fertirrigated one. It was shown that<br />
humification process is highly perturbed by the introduction of the fresh organic matter.<br />
References<br />
1. H. Bouwer and E. Idelovitch, Journal of irrigation and drainage engineering, 113 (1987) 516<br />
2. M. B. Pescod, Irrigation and Drainage Paper (FAO), 47 (1992) 118.<br />
3. V. O. Snow, W. J. Bond, B. J. Myers, S. Theiveyanathan, C. J. Smith, R. G. Benyon, Agricultural<br />
Water Management, 39 (1999) 47.<br />
4. 4 X. Luciani, S. Mounier, R. Redon, A. Bois, Chem. and Int. Lab. Sys. 96 (2009) 227<br />
5. 5. G. Paula. Coble, Marine Chemistry, 51 (1996) 325.<br />
<strong>Vol</strong>. 2 Page - 489 -
15th IHSS Meeting- <strong>Vol</strong>. 2<br />
Evaluation of the Humification Degree of Humic Acids Extracted from Soil<br />
Under Application of Wastewater by Fluorescence Spectroscopy and Laser-<br />
Induced Fluorescence (LIF)<br />
Cleber Hilário dos Santos a,b* , Débora Marcondes Bastos Pereira Milori a , B<strong>ru</strong>no Henrique<br />
Martins a,b , Marcelo Camponez do Brasil Cardinali c , Ladislau Martin-Neto a , Célia Regina<br />
Montes d , Adolpho José Melfi e .<br />
a Embrapa Agricultural Inst<strong>ru</strong>mentation, P.O. Box. 741, 13560-970, São Carlos-SP, Brazil;<br />
b University of São Paulo – Chemistry Institute of São Carlos, P.O. Box. 369, 13.560-970, São<br />
Carlos-SP, Brazil; c University of São Paulo – Physics Institute of São Carlos, P.O. Box. 780,<br />
13.560-970, São Carlos-SP, Brazil; d CENA, NUPEGEL, P.O. Box. 09, 13418-900,<br />
Piracicaba-SP, Brazil; e USP-ESALQ, NUPEGEL, P.O. Box. 09, 13418-900, Piracicaba-SP,<br />
Brazil<br />
E-mail: cleber@cnpdia.embrapa.br<br />
1. Introduction<br />
Among activities developed by man, agriculture is undoubtedly one of the sectors that<br />
consume more water for irrigation. In Brazil, agriculture consumes about 61% of the total<br />
freshwater [1]. Different ways were tried by contemporary societies to solve or minimize the<br />
lack of this feature, however the use of wastewater from systems of sewage treatment by<br />
biological processes has been shown one of the most interesting solution. Another important<br />
point is that wastewater can be act as a soil conditioner providing nutrients in a sustainable<br />
way.<br />
Despite these advantages, application of wastewater in soil requires careful monitoring<br />
because of the possibility of soil contamination and changes in organic matter that could<br />
cause serious implications for the crop where it is applied.<br />
The UV-Visible fluorescence spectroscopy provides information about molecular st<strong>ru</strong>ctures,<br />
being sensitive to the presence of heavy metals and organic contaminants. For this reason, it<br />
can be an interesting tool to evaluate changes in soil organic matter (SOM) after long term<br />
application of wastewater.<br />
The Laser-Induced Fluorescence (LIF) applied to soils is a new methodology that has proven<br />
effective in the analysis of SOM, providing results without the chemical fractionating process,<br />
allowing analysis of SOM near natural conditions [2].<br />
The objective of this study was to evaluate changes in humification degree of organic matter<br />
(OM) in soils submitted to application of wastewater using fluorescence spectroscopy.<br />
<strong>Vol</strong>. 2 Page - 490 -
15th IHSS Meeting- <strong>Vol</strong>. 2<br />
2. Matherial and Methods<br />
Soil in this study is a Typic Hapludults, texture medium clay, cultivated with Tifton 85<br />
Bermudagrass. Wastewaters were collected from the municipality of Lins in the State of Sao<br />
Paulo.<br />
Effects of wastewater application were compared to reference treatments. The experiment was<br />
divided in six treatments: SI – without irrigation and without nitrogen as mineral fertilizer<br />
(NMF); E100 - irrigation with effluent and 100% (520 kg ha -1 year -1 ) of the recommended<br />
dose of NMF for the Bermudagrass Tifton – 85; E66 - irrigation with effluent and 66% (343.2<br />
kg ha -1 year -1 ) of the NMF; E33 - irrigation with effluent and 33% (171.6 Kg ha -1 year -1 ) of<br />
the NMF; E0 - irrigation with effluent and 0% (0 kg ha -1 year -1 ) of the NMF; W100 -<br />
irrigation with water for consumption and 100% (520 Kg ha -1 year -1 ) of the NMF.<br />
In this study, it was evaluated humic acid and whole soil. To obtain the HA was performed<br />
extraction and fractionation of humic components of soil, using the standard procedure<br />
suggested by the International Humic Substances Society (IHSS). For whole soil analyses, the<br />
soil samples were air dried, ground and sieved through a mesh of 212 µm. After this, were<br />
prepared soil pellets using pressure 10 ton.<br />
Fluorescence spectroscopy. Each HA sample was dissolved in a solution of sodium<br />
bicarbonate (NaHCO 3 ) 0,05 mol L -1 with a concentration of 20 mg L -1 . This concentration<br />
was used to minimize the effect of reabsorption of fluorescence and reduce interactions<br />
between molecules. The final pH of the solutions was around 8.0. After preparation of<br />
solutions, the spectra fluorescence were obtained in the modes of emission, excitationemission<br />
(3D) and synchronous scan, according to the methodology proposed by [3, 4, 5].<br />
Laser induced fluorescence (LIF) spectroscopy. The experimental setup of LIF system is<br />
shown in Milori et al. [2]. Humification degree (H LIF ) of SOM was estimated using the ratio<br />
of area under fluorescence emission spectra (excitation at 458 nm) and total organic carbon<br />
concentration (COT).<br />
3. Results and Discussion<br />
Humification degree of humic acid was assessed using three methodologies: Milori (A 465 ),<br />
Zsolnay (A 4 /A 1 ) and Kalbitz (I 468 /I 374 ). The correlation among the methodologies was higher<br />
than 95%. The results of humification degree obtained using methodology of Milori et al. [4]<br />
for different depths and treatments are shown in Figure 1.<br />
<strong>Vol</strong>. 2 Page - 491 -
15th IHSS Meeting- <strong>Vol</strong>. 2<br />
A<br />
465<br />
80000<br />
70000<br />
60000<br />
50000<br />
40000<br />
30000<br />
20000<br />
10000<br />
0<br />
SI W100 E0 E33 E66 E100<br />
Treatments<br />
0 - 10 cm<br />
10 - 20 cm<br />
20 - 40 cm<br />
40 - 60 cm<br />
60 - 80 cm<br />
80 - 100 cm<br />
Figure 1: Values of humification index (A 465 ) obtained for the HA in solution using the methodology<br />
of Milori et al. [4]<br />
Irrigation with wastewater caused a slight increase in the humification degree of HA for all<br />
depths in all treatments when compared with W100 treatment.<br />
Three-dimensional excitation-emission matrix (EEM) fluorescence spectra of the HA are<br />
shown in Figure 2.<br />
λ exc (nm)<br />
(a)<br />
(b)<br />
Intensity (a.u.)<br />
λ em (nm)<br />
λ em (nm)<br />
Figure 2: Three-dimensional excitation-emission matrix (EEM) fluorescence spectra obtained for HA<br />
in the layer of 0-10 cm of: (a) W100 - irrigation with water for consumption and 100% of the NMF;<br />
and (b) E100 - irrigation with effluent and 100% of NFM<br />
Comparing the treatments W100 and E100, the application of wastewater leads to a<br />
significant increase in the intensity of fluorescence emission, caused by an increase in the<br />
concentration of st<strong>ru</strong>ctures bigger and more complexes related with increasing of humification<br />
degree.<br />
The results of humification degree of SOM obtained using LIF for different depths and<br />
treatments are shown in Figure 3.<br />
<strong>Vol</strong>. 2 Page - 492 -
15th IHSS Meeting- <strong>Vol</strong>. 2<br />
H<br />
FIL<br />
1100<br />
1000<br />
900<br />
800<br />
700<br />
600<br />
500<br />
400<br />
300<br />
200<br />
100<br />
0<br />
0 - 10 cm 40 - 60 cm<br />
10 - 20 cm 60 - 80 cm<br />
20 - 40 cm 80 - 100 cm<br />
SI W100 E0 E33 E66 E100<br />
Treatments<br />
Figure 3: H LIF values obtained for all soil samples whole Typic Hapludults in the profile of the<br />
sampling<br />
For LIF spectroscopy using whole soil, irrigation with wastewater during four years also<br />
increased the humification degree of soil organic matter. Similar what was observed for HA in<br />
solution.<br />
4. Conclusions<br />
The application of wastewater seems to lead an increase of humification degree of soil<br />
organic matter, even when compared to irrigation using fresh water. Probably, fresh organic<br />
matter from wastewater is increasing microbiological activity and, this high activity is taking<br />
to a decreasing of soil carbon by degradation of stable fractions [6].<br />
Acknowledgements<br />
Embrapa Agricultural Inst<strong>ru</strong>mentation, University of São Paulo – Chemistry Institute of São<br />
Carlos, CAPES and FAPESP.<br />
References.<br />
1. Christofidis, D. Olhares sobre a política de recursos hídricos no Brasil: o caso da bacia do rio São<br />
Francisco. Brasília: Universidade de Brasília, Brasília DF, 2001. 424p.<br />
2. Milori, D.M.B.P.; Galeti, H.V.A.; Martin-Neto, L.; Dieckow, J.; González-Perez, M.; Bayer, C.;<br />
Salton, J. Organic matter study of whole soil samples using laser-induced fluorescence<br />
spectroscopy . SOIL SCI SOC AM J 70, n. 1, p. 57-63, 2006.<br />
3. Zsolnay, A.; Baigar, E.; Jimenez, M.; Steinweg, B.; Saccomandi, F. Differentiating with<br />
fluorescence spectroscopy the sources of dissolved organic matter in soils subjected to drying.<br />
Chemosphere, v. 38, p. 45-50, 1999.<br />
4. Milori, D. M. B. P.; Martin-Neto, L.; Bayer, C.; Mielniczuk, J.; Bagnato, V. S. Humification<br />
degree of soil humic acids determined by fluorescence spectroscopy. Soil Science, v. 167, p. 739-<br />
749, 2002.<br />
5. Kalbitz, K.; Geyer, W.; Geyer, S. Spectroscopic properties of dissolved humic substances – a<br />
reflection of land use history in a fen area. Biogeochemistry, v. 47, p. 219-238, 1999.<br />
6. Fontaine, S.; Barot, S.; Barré, P.; Bdioui, N.; Mary, B.; Rumpel, C., Nature, 450 (2007) 8.<br />
<strong>Vol</strong>. 2 Page - 493 -
15th IHSS Meeting- <strong>Vol</strong>. 2<br />
Chemical Alteration of Substrates During Initial Thermophilic Phase of<br />
Composting<br />
Caio T. Inácio a , Jasmin Lemke b , Deborah M.V. de Almeida b , Carolina R. Linhares b ,<br />
Etelvino H. Novotny a*<br />
a Embrapa Soils, Rua Jardim Botânico, 1024, Rio de Janeiro-RJ, Brazil; b UFF, Outeiro de São<br />
João Batista, Niterói-RJ, Brazil<br />
E-mail: etelvino@cnps.embrapa.br<br />
1. Introduction<br />
Composting technologies has been used successfully for treatment of organic waste from<br />
agriculture, industrial process and urban activities. Some examples of organic waste are food<br />
waste, orange juice process, swine and cattle manure, poultry, sugar cane mill waste, biosolids<br />
(sludge). These represent a valuable reservoir of plant nutrients in organic forms,<br />
particularly nitrogen (N), phospho<strong>ru</strong>s (P) and sulphur (S). However, before the use of such<br />
materials as fertilizers, they must be converted into a stable product free of odours and<br />
pathogens, and in a physical form that is suitable for soil application. Aerobic-thermophilic<br />
(35-65 ºC) composting is a proven technology that can achieve these objectives. Composting<br />
as a process involves the biological decomposition of organic matter under controlled, aerobic<br />
conditions into a humus-like stable product [1]. The value of a compost as a soil ameliorant<br />
can be due to several factors: (i) to improve the chemical composition of soil through the<br />
supply of plant nutrients; (ii) to improve the physical condition of soil through lower bulk<br />
density, resulting in improved aeration and water holding capacity. Biochemical<br />
manifestations occurring during composting process include an increase in humic substances<br />
over time, specifically, humic acids. Carbohydrates are the primary source of energy for<br />
microorganisms in the process, following by cellulose and hemicellulose. Lignin is degraded<br />
through microbial action to smaller polyphenolic compounds and intermediate phenols. The<br />
enzymatic action turns these compounds in quinines and later condensed humic acids [1].<br />
The purpose of this work was to study the effects of Eucalyptus charcoal fines on composting<br />
process. Although charcoal fines are available residues they are barely used in composting<br />
process of wastes. The use of charcoal can improve air diffusion in composting windrows,<br />
prevent anaerobic conditions and odor and greenhouse gas emissions (CH 4 and N 2 O), and<br />
produce a high quality final product to use in agriculture. To evaluate this, Eucalyptus<br />
charcoal fines was used on composting process during the initial thermophilic phase under<br />
controlled conditions.<br />
<strong>Vol</strong>. 2 Page - 494 -
15th IHSS Meeting- <strong>Vol</strong>. 2<br />
2. Materials and Methods<br />
Bench scale experiment: A 5-days composting experiment (thermophilic phase) was carry out<br />
under controlled conditions using a 3 L bench scale bioreactors. These bioreactors had an air<br />
supply and controlled temperature difference system [2, 3], including insulation. This kind of<br />
control of temperature difference reduces heat looses of bench scale reactor and can provide<br />
and extend duration of thermophilic temperatures similar to those in full-scale.<br />
Nine bioreactors were used in a completely randomized experiment with tree repetitions of<br />
treatments. The experiment includes three treatments: horse manure (T0); horse manure +<br />
charcoal, 3:1 net weight (T1); horse manure + charcoal + orange waste, 1:1:2 net weight (T2).<br />
Each bioreactor was filled with 1 Kg of mixtures. Initial humidity was adjusted for 80% for<br />
all substrates using distilled water. Aeration rate was maintained in 1.25 L min -1 for each<br />
bioreactor, approximately.<br />
Substrate preparation: Horse manure from Race Track is a fairly uniform mixture with straw.<br />
Alfalfa and oat residues used to feeding the animals are present in this substrate. Certified<br />
commercial charcoal was grounded and sieved at 2 mm. Orange bagasse (juice processing)<br />
was size-reduced and homogenized on a blender. Experimental mixtures (treatments) were<br />
homogenized by hand before to fill bioreactors.<br />
Sampling and measurements: Samples of each material and mixture were collected before<br />
experiment beginning and at 5 days of composting process. Samples were dried at 110 ºC in<br />
an air forced drier. Temperatures of composting process in the centre and axial distance inside<br />
each bioreactor were collected and stored by a computer system every 5 minutes.<br />
The FTIR analyses were performed on a spectrophotometer model Perkin Elmer Spect<strong>ru</strong>m<br />
400 FTIR Spectrometer with the spectra resolution of 4 cm -1 in the region from 4000 to 400<br />
cm -1 . The sample pellets for analyses were made using approximately 1 mg of sample and<br />
100 mg of KBr spectroscopic grade and submitting the homogenized mixture to pressure. For<br />
each spect<strong>ru</strong>m 4 scans were summed.<br />
Principal Component Analysis (PCA) was carried out using the obtained spectra. The spectra<br />
pre-processing includes: multiplicative scatter correction; second derivative calculation and;<br />
mean-centering of the data.<br />
<strong>Vol</strong>. 2 Page - 495 -
15th IHSS Meeting- <strong>Vol</strong>. 2<br />
3. Results and Discussion<br />
The used bioreactors are prototypes under development and the presented results are<br />
preliminary. Probably due to the drying of the substrates, caused by the forced aeration and<br />
heating during the initial thermophilic phase the operation was ceased after 5 days and the<br />
internal temperature dropped to room temperature. Due to this, the experiment was<br />
inter<strong>ru</strong>pted. Additionally, a great variability of the internal temperature was observed among<br />
the repetitions and because of this some improvements of the bioreactors will be carried out.<br />
On the other hand, this variability created different composting situation that could be<br />
accessed by the FTIR analysis and it facilitated the evaluation of the chemical changes in the<br />
substrates in the initial phase of the composting.<br />
After varimax rotation of the loadings, the scores of the first PC, that accounted by 68% of the<br />
total variance, clearly grouped the different substrates (Fig. 1a), with lower values for horse<br />
manure (T0) and higher for the treatment with orange bagasse (T2).<br />
PC2 (16% of total variance)<br />
0.15<br />
0.10<br />
0.05<br />
0.00<br />
-0.05<br />
-0.10<br />
T0 d5 (49.7 o C)<br />
T0 d5 (47.7 o C)<br />
T0 d1<br />
(a)<br />
T1 d5 (45.5 o C)<br />
T1 d1<br />
T1 d5 (48.2 o C)<br />
T2 d5 (44.2 o C)<br />
T2 d5 (43.5 o C)<br />
T2 d1<br />
Mineral ν O-H<br />
3698 ν O-H Kaol<br />
3619 ν O-H Kaol<br />
2931 ν C-H 2<br />
2855 ν C-H 2<br />
(b)<br />
(c)<br />
1701 ν C=O COOH<br />
1610 ν C=C Aro<br />
1491 ν C=C Aro<br />
1734 ν C=O COOH<br />
1672 ν C=O (Amide I)<br />
1638 ν C=O (Amide I)<br />
1595 δ N-H (Amide II)<br />
1511 ν C=C 1513 δ N-H (Amide II)<br />
1467 δ C-H<br />
Aro<br />
1468 δ C-H<br />
1424 ν C=C 2<br />
Aro<br />
1271<br />
ν C-O and δ O-H COOH<br />
1221<br />
1161 ν C-OH<br />
1066 ν Si-O<br />
881 δ C-H Aro<br />
875 δ C-H Aro<br />
747 δ C-H Aro<br />
-0.15<br />
-0.4 -0.2 0.0 0.2 0.4 0.6<br />
PC1 (68% of total variance)<br />
1154 ν C-OH<br />
3500 3000 2500 2000 1500 1000<br />
Wavenumber (cm -1 )<br />
Figure 1: (a) Rotated scores of PCA from FTIR spectra. (b) Rotated loadings of the first PC from<br />
FTIR spectra. (c) Rotated loadings of the second PC from FTIR spectra. T0: horse manure; T1: horse<br />
manure + charcoal, 3:1 net weight; T1: horse manure + charcoal + orange waste, 1:1:2. d1: initial<br />
sampling (feedstocks); d5: five days of composting. The maximum temperature reached in each<br />
bioreactor is indicated in parenthesis<br />
<strong>Vol</strong>. 2 Page - 496 -
15th IHSS Meeting- <strong>Vol</strong>. 2<br />
This First PC is characterized by positive loadings for bands attributable to aromatic moieties<br />
(Fig. 1b), due to the presence of charcoal in the T1 and T2 samples, and stretching of C=O<br />
from carboxylic, probably from the orange bagasse. And negative loadings in regions<br />
attributable to amide, polysaccharides (probably cellulose), methilene aliphatic and mineral<br />
contaminants, these chemical groups were expected in the horse’s manure.<br />
The second PC (16% of the total variance) showed a gradient from the feedstocks (initial<br />
substrates) towards the higher reached temperature in each bioreactor (Fig. 1a). In this way,<br />
the analysis of the loadings could help to trace the evolution of the material during the<br />
composting. The loadings of this PC presented positive values for the chemical groups that<br />
accumulate, or are formed, during the initial phase of the composting (Fig. 1c), such as:<br />
aromatic moieties, carboxylic groups and amides. Probably these amides aren’t from the<br />
manure, which wouldn’t be preserved during the initial phase of the composting, but the<br />
nitrogen probably is incorporated into the microbial tissues. Additionally, the silicates,<br />
probably kaolinite, are accumulated. The more important negative loading is from<br />
polysaccharides, confirming the easy decomposition of this class of compounds.<br />
4. Conclusions<br />
During the initial phase of the composting several chemical alterations occurs in the<br />
substrates, such as accumulation of the recalcitrant charcoal; alteration of the substrates by the<br />
partial oxidation to carboxylic groups; mineralization of the carbohydrates and increase of the<br />
amides groups, probably by the nitrogen incorporation into microbial biomass.<br />
Acknowledgements<br />
The Brazilian National Council for Scientific and Technological Development (CNPq) and<br />
Fundação Carlos Chagas Filho de Amparo à Pesquisa do Estado do Rio de Janeiro (FAPERJ)<br />
are thanked for providing research and scientific initiation fellowships to E.H.N., C.R.L and<br />
D.M.V.A. Thanks are due to Dr. Raymond McInerney, University of Limerick, for assistance<br />
with proofreading of the text.<br />
References<br />
1. E. Epstein, The Science of Composting, Technomic Publishing, Pennsylvania, 1997.<br />
2. I.G. Manson and M.W. Milke. Physical modeling of the composting environment: A review. Part<br />
1: Reactor systems. Waste Management. 25 (2005) 481-500.<br />
3. A.MT. Magalhães, P.J. Shea, M.D. Jawson, E.A. Wicklund and D.W.Nelson. Pratical Simulation<br />
of Composting in the Laboratory. Waste Management & Research. 11 (1993) 143-154.<br />
<strong>Vol</strong>. 2 Page - 497 -
15th IHSS Meeting- <strong>Vol</strong>. 2<br />
Study of the Humification Degree of Different Organic Residues During the<br />
Composting<br />
Paulo Roberto Dores-Silva * , Maria Diva Landgraf, Maria Olímpia O. Rezende<br />
Instituto de Química de São Carlos. Av. Trabalhador Sãocarlense, 400, São Carlos, SP,<br />
Brazil, CEP 13566-590<br />
E-mail: tortuga@iqsc.usp.br<br />
1. Introduction<br />
The soil organic matter (OM) includes the waste of plants, animals and microorganisms in<br />
many stages of decomposition and with high association with the other phases of the soil<br />
(solid, aqueous and gas phases) [2] and, thus, a key component in quality and productivity of<br />
agricultural soils, helping in the control of humidity and providing several essential elements<br />
for the development of plants and other organisms.<br />
The human activity generates several kinds of organic wastes with potential impacting, such<br />
residues are released to the environment with no adequate treatment. Following this fact the<br />
use of the organic residues in the agriculture is showed as a key factor for the reduction of the<br />
human activities effects for the environment, appearing as a sustainable and environmentally<br />
adequate alternative [4]. However, to be used in the agriculture the residues must be<br />
decomposed. This is necessary to the conversion of the nutrients present in these residues into<br />
a digestible form and available to the organic fraction of soils.<br />
A viable process for the rational use of residues is the composting, an old method of recycling<br />
of the OM where the OM in transformed into a humified material. Composting is a result of<br />
aerobic biological decomposition of organic substrate, under conditions which allow the<br />
natural development in high temperatures, with formation of a product sufficiently stable for<br />
storage and soil application without adverse environmental effects [3, 6].<br />
Due to the necessity of proving an adequate destiny to organic residues, this research has as<br />
main aim to verify the changes in the physicochemical parameters promoted by the use of the<br />
composting technique in the stabilization of many kinds of organic residues.<br />
2. Materials and Methods<br />
The compounds were produced in windrows with dimensions of about 1.5 m high and 2 m<br />
wide in a covered area. The raw materials had the following proportions: cattle manure (CM);<br />
cattle manure + rice straw in proportion 1:1 in volume (RS); c<strong>ru</strong>shed sugarcane + cattle<br />
manure in a 1:1 ratio by volume (SC); and vegetable waste hydroponics + cattle manure in a<br />
<strong>Vol</strong>. 2 Page - 498 -
15th IHSS Meeting- <strong>Vol</strong>. 2<br />
1:1 ratio by volume (VW), the humidity of the material was maintained between 40 and 60%,<br />
and the material was turned over frequently during the 90 days of the experiment with<br />
controlled temperature [4].<br />
The first collection was made after careful homogenization of the mixtures arranged in piles.<br />
After an interval of 90 days after the beginning of the composting process a collection of the<br />
compound was done to evaluate the physicochemical characterization in accordance with the<br />
procedures described by Kiehl [4].<br />
The physicochemical characterization was made to the initial samples (blank) and to the<br />
composts produced after 3 months of composting according to the following parameters: pH<br />
in CaCl 2 , phospho<strong>ru</strong>s and total Kjeldahl nitrogen (TKN) by spectrophotometer Hach method<br />
480 and 399, respectively, total organic carbon (TOC) via TOC-V CPH Shimadzu, cation<br />
exchange capacity (CEC), by occupying the active sites to exchange with hydrogen ions in 1<br />
mol L -1 glacial acetic acid and OM content, gravimetrically.<br />
3. Results and Discussion<br />
Table 1 shows the physicochemical characterization results of the initial sample (blank) and<br />
of the produced composts.<br />
Table 1: Physicochemical characterization of the initial sample (blank) and of the produced composts<br />
to the follow parameters: OM content; phospho<strong>ru</strong>s content (P); TKN content; TOC content; C/N ratio;<br />
CEC and pH (standard deviatons for n = 3)<br />
Parameters OM (%) P TKN C (%) C/N CEC pH<br />
mg kg -1 (%)<br />
cmol c kg -1<br />
CMI<br />
32.98 887 0.9884 18.43 22.09 19.45 8.98<br />
(2.89) (43.87) (0.03) (0.4076) (1.02) (0.87) (0.03)<br />
CMC<br />
28.65 1030 1.095 15.85 16.92 21.65 8.56<br />
(1.09) (24.30) (0.06) (0.23) (0.84) (0.22) (0.03)<br />
RSI<br />
63.57 519 0.65 40.34 72.06 29.92 8.93<br />
(7.98) (19.80) (0.02) (4.72) (5.59) (0.26) (0.04)<br />
RSC<br />
57.66 551 0.75 33.92 42.81 30.80 8.49<br />
(5.08) (13.08) (0.32) (2.99) (3.05) (0.64) (0.04)<br />
SCI<br />
51.33 544 0.64 30.19 55.62 23.53 7.73<br />
(3.29) (14.89) (0.03) (1.40) (6.19) (0.79) (0.07)<br />
SCC<br />
47.56 586 0.78 28.07 33.54 27.75 7.58<br />
(3.36) (10.27) (0.09) (1.94) (2.03) (0.19) (0.01)<br />
VWI<br />
54.02 931 1.03 31.77 32.92 32.65 8.97<br />
(3.12) (41.35) (0.01) (1.84)<br />
48.76 1036 1.48 28.68<br />
VWC<br />
(1.26) (35.21) (0.10) (0.61)<br />
CMI = Cattle manure initial<br />
CMC = Cattle manure composted<br />
RSI = Rice straw + cattle manure initial<br />
RSC = Rice straw + cattle manure composted<br />
SCI = sugar cane bagasse + cattle manure initial<br />
SCC = sugar cane bagasse + cattle manure composted<br />
VWI = vegetable waste from hydroponics + cattle manure initial<br />
VWC = vegetable waste from hydroponics + cattle manure composted<br />
(2.05)<br />
20.81<br />
(1.60)<br />
(0.40)<br />
34.06<br />
(0.42)<br />
(0.02)<br />
8.74<br />
(0.01)<br />
<strong>Vol</strong>. 2 Page - 499 -
15th IHSS Meeting- <strong>Vol</strong>. 2<br />
As seen in Table 1, a decrease in the OM content occurred in the experiments when it is<br />
compared to the original matrices, this occurs because along the degradation process<br />
promoted by the macrobiotic present in the initial matrices, there is a mineralization process<br />
of organic carbon to CO 2 . The values of total C and OM reflect the large proportion of<br />
decomposed material during the composting process which can be verified by significant<br />
reductions in these parameters over the 90 days of experiment.<br />
Quantities of TKN and P increased during the composting process, which are all higher than<br />
those found in the initial matrices. The increase in TKN and P enhances the fertilizer capacity<br />
of the final compost, as nitrogen and phospho<strong>ru</strong>s are two essential nutrients for growth and<br />
development of plants. According to Atiyeh et al., 2001, the increasing on nutrients such as<br />
nitrogen and phospho<strong>ru</strong>s is directly related to the mineralization of organic matter.<br />
During the composting process, C has a more intense decline in the CMC with a percentage<br />
removal of 13.30%, this is due to lower C/N ratio of the CMI, the remaining wastes have C/N<br />
ratio higher due to the presence of organic matter poor in N and rich in C (lignin), which<br />
explains the smaller percentage of removal found for the composts produced from these<br />
wastes.<br />
Cation exchange capacity showed an increase trend after the composting process. This occurs<br />
because the organic colloids from the earthworms’ humus have a greater ability to adsorb<br />
(bind) cations in soil solution, being able to release then or making exchanges, if there is a<br />
concentration of different ions or a pH variation.<br />
It was observed that the C/N ratio showed a decrease during the composting process, this<br />
occurs due to the percentage reduction of C and to the increase of TKN quantity. It is<br />
interesting to note that the different mixtures of residues showed different values for the C/N<br />
ratio initially, this is due to the dependence of this parameters on the original material, and the<br />
decomposing process promoted by the composting depend on this parameter. This can be<br />
observed by evaluating the removal content of C, the experiment with CM itself was the one<br />
that showed the highest removal C-content of all, this is due to lowest C/N ratio present in this<br />
matrix which facilitates the microbial development, because lower this parameter lower is the<br />
quantity of available N for the development of the microorganisms The speed-up in the<br />
humification process, promoted by the earthworms during the composting, results in a<br />
reduction of the C/N ratio [1]. Although the process seems to be adequate to the OM<br />
stabilization the time elapsed by the composting should be longer than 90 days, because none<br />
of the produced composts meet all the parameters required by the Brazilian legislation [5] in<br />
<strong>Vol</strong>. 2 Page - 500 -
15th IHSS Meeting- <strong>Vol</strong>. 2<br />
terms of OM (minimum 40%) and C/N ratio (maximum 18/1), however all of them meet the<br />
legislation in terms of pH (minimum 6.0).<br />
Considering that the composting is a relatively fast process and of easy execution, the use of<br />
this technique as a tool for recycling of various organic residues, is ideal to be used in the<br />
stabilization of the studied compounds, because in the end on the process it is gotten an<br />
organic fertilizer with high quantity of nutrients which can be used in the agriculture<br />
improving the soil physicochemical characteristics, acting as a fertilizer or conditioner.<br />
4. Conclusions<br />
These results show that the composting process is effective in stabilizing the organic matter,<br />
and can be used to produce organic fertilizers, recycling wastes from agricultural activities<br />
and livestock, raising the levels of TKN and P, increasing the CEC compared to the starting<br />
material, reducing the C/N ratio to values lower than the baseline and making the pH values<br />
near to the neutrality, providing an sustainable and environmentally appropriate alternative of<br />
disposal of the studied organic wastes, requiring only a longer time of composting than the<br />
originally proposed here.<br />
Acknowledgements<br />
The authors thank to the financial support of FAPESP (process 07/50776-4), CAPES and<br />
CNPq. Paulo Roberto Dores-Silva thanks to the program Ensinar com Pesquisa/USP for his<br />
research grant.<br />
References<br />
1. Atiyeh, R.M. Edwards, C.A. Subler, S. Metzger, J.D. Pig Manure vermicompost as a Component<br />
of a horticultural bedding plant medium: effects on physicochemical proprieties and plant growth.<br />
Biores. Technol., 78, 11–20, 2001.<br />
2. Christensen, B. T.; Adv. Soil Sci. 1992, 20, 1.<br />
3. Haug, R.T. Compost Engineering: Principles and Practices. Ann Arbor: Ann Arbor Science,<br />
1980. 655p.<br />
4. Kiehl, E.J. Fertilizantes orgânicos. São Paulo: Agronômica Ceres, 1985. 492 p.<br />
5. Kiehl, E.J. Manual de Compostagem “Maturação e qualidade do Composto”.Piracicaba, 2002. 171<br />
p.<br />
6. Silva, F. A. M.; Villas Boas, R. L.; Silva, R. B., Parâmetros de maturação para diferentes<br />
compostos orgânicos. Rev. Bras. De Agroecologia, 2009. 67–78.<br />
<strong>Vol</strong>. 2 Page - 501 -
15th IHSS Meeting- <strong>Vol</strong>. 2<br />
Use of Raw Domestic Sewage Sludge as Matrix for the Vermicomposting<br />
Process<br />
Paulo Roberto Dores-Silva * , Maria Diva Landgraf, Maria Olímpia O. Rezende<br />
Instituto de Química de São Carlos. Av. Trabalhador Sãocarlense, 400, São Carlos, SP,<br />
Brazil, CEP 13566-590<br />
E-mail: tortuga@iqsc.usp.br<br />
1. Introduction<br />
The sewage sludge is rich on organic matter, besides being a fount of micro- and<br />
macronutrients, what gives to the soil, when it is used as a conditioner or a fertilizer, a higher<br />
capacity of water retention, higher resistance to erosion and, at the same time, provides a<br />
green and an environmentally appropriate resolution to the final destiny of the residue<br />
generated during the treatment of wastewaters in the Treatment Station (WTS).<br />
Processes for stabilization of domestic sewage sludge are designed to minimize two major<br />
undesirable characteristics of the waste: odor and pathogen content. The importance of these<br />
two factors varies according to the final destination for the sludge. Thus, under a management<br />
system for the sludge produced by WTS, the stabilization is a key for the system and should<br />
be defined in coordination with the drainage, sanitation and use of the final product [1].<br />
Although composting of organic waste is an old practice, vermicomposting was developed in<br />
the 40s and 50s, with research by management programs of earthworms at Rothamstead<br />
experimental station in, England.O nly since 1970 the studies on the potential of earthworms<br />
to convert organic waste into a more stabilized organic matter were intensified [2, 5].<br />
The aim of this research was the characterization of the vermicompost from the domestic<br />
sewage and from the mixtures of domestic sewage sludge and soil, treated with earthworms<br />
Eisenia foetida during 3 months.<br />
2. Materials and Methods<br />
The collection of samples of sewage sludge to vermicomposting was held from the previously<br />
dried domestic sewage sludge, about 40% humidity. For the process of vermicomposting it<br />
was used about 60 kg of material.<br />
To perform the experiments three boxes of plywood, not airtight, were set up with 0.70 m<br />
long, 0.70 m wide and 0.70 m high. Each box received 60 kg of a mixture constituted of<br />
domestic sewage sludge (with 40% humidity) and soil in the following proportions: 100%<br />
sewage sludge (A); 75% of sewage sludge and 25% soil (B) by volume; and 50% sewage<br />
<strong>Vol</strong>. 2 Page - 502 -
15th IHSS Meeting- <strong>Vol</strong>. 2<br />
sludge and 50% soil (C) in volume. The inoculation was done with earthworms Eisenia<br />
foetida [3], the boxes were kept in a partially open and a canopy was added to the surface of<br />
the material when it had been prepared in the boxes, in order to protect the worms from light.<br />
After the inoculation of the earthworms, the material was vermicomposted for 3 months.<br />
In the end of the vermicomposting process the samples of vermicompost were collected and<br />
divided in sub samples and, later, the physicochemical characterization was done [3, 4] of the<br />
initial samples (blank) and of the vermicomposts, according to the following parameters: pH<br />
in CaCl 2 , phospho<strong>ru</strong>s and total Kjeldahl nitrogen (TKN) by spectrophotometer Hach, method<br />
480 and 399, respectively , total organic carbon (TOC) via TOC-V COH Shimadzu, cation<br />
exchange capacity (CEC), by occupying the active sites to exchange with hydrogen ions in 1<br />
mol L -1 glacial acetic acid, OM content, gravimetrically and extraction and quantification of<br />
Humic Acids (HA) and Fulvic Acids (FA) [6].<br />
3. Results and Discussion<br />
The physicochemical characterization of the matrices and produced vermicomposts from the<br />
initial mixtures was done and results are presented in table 1. By this characterization it is<br />
possible to compare the vermicompost with matrices A, B and C in the beginning of the<br />
process and verify whereas vermicomposting was efficient in the stabilization of the OM.<br />
Table 1: Physicochemical characterization of the initial sample and of the produced vermicomposts<br />
according to the following parameters: OM content; phospho<strong>ru</strong>s content (P); TKN content; TOC<br />
content; C/N ratio; pH ratio; helminthus viable eggs (HVE); HA content and FA content<br />
Parameters A B C VA VB VC<br />
OM<br />
57.25 38.66 26.25 48.20 30.11 20.71<br />
(0.20) (0.67) (1.76) (0.67) (2.67) (0.58)<br />
TKN %<br />
2.44<br />
1.31<br />
0.82 3.37<br />
1.01<br />
1.86 (0.04)<br />
(0.03) (0.04) (0.06) (0.04)<br />
(0.09)<br />
TOC* %<br />
31.00<br />
21.32 11.56 6.03<br />
15.50 (1.60) 10.31 (0.29)<br />
(2.33)<br />
(0.44) (1.39) (0.44)<br />
pH<br />
4.45<br />
4.75<br />
4.56 4.98<br />
4.25<br />
4.74 (0.03)<br />
(0.03) (0.02) (0.01) (0.01)<br />
(0.02)<br />
C/N ratio 16.69 (1.21) 13.74 (1.48) 14.70 (1.49)<br />
7.64<br />
6.96<br />
7.23 (0.88)<br />
(0.35)<br />
(0.58)<br />
HVE 10.00 4.00 3.00 1.00 < 0.25 < 0.25<br />
% HA** 4.15<br />
(0.33)<br />
4.71<br />
(0.44)<br />
8.34<br />
(0.65)<br />
2.41<br />
(0.21)<br />
9.83<br />
(0.20)<br />
15.40<br />
(0.72)<br />
% FA** 1.31<br />
(0.05)<br />
1.22<br />
(0.16)<br />
2.48<br />
(0.15)<br />
0.44<br />
(0.04)<br />
0.44<br />
(0.07)<br />
1.11<br />
(0.10)<br />
*Values expressed in dried base, humidity determined at 65 º C.; ** Extracted quantity /Organic Matter; Standard deviation for<br />
n = 3; HVE = helminthus viable eggs.<br />
A = Matrix 100% domestic sewage sludge.<br />
B = Matrix 75% domestic sewage sludge 25% soil.<br />
C = Matrix 50% domestic sewage sludge 50% soil.<br />
VA = Vermicompost with matrix 100% domestic sewage sludge.<br />
VB = Vermicompost with matrix 75% domestic sewage sludge 25% soil.<br />
VC= Vermicompost with matrix 50% domestic sewage sludge 50% soil.<br />
<strong>Vol</strong>. 2 Page - 503 -
15th IHSS Meeting- <strong>Vol</strong>. 2<br />
Looking at Table 1 it is seen that there was a gradual decrease in OM content in<br />
vermicompost A, B and C. The earthworms feed on organic matter, showing that the<br />
vermicomposting process is underway. The decrease on OM content also shows the<br />
mineralization of organic carbon to CO 2 . This also explains the decrease in TOC content<br />
observed.<br />
For the pH samples, it is observed a gradual increase in pH of vermicompost containing only<br />
the sewage sludge (A), for the vermicompost B pH did not show a trend, the final pH is<br />
practically the same pH of the first day of vermicomposting and, finally, the pH of the<br />
vermicompost C showed a slight downward trend during the 90 days trial.<br />
As it can be seen, the quantities of total Kjeldahl nitrogen increased during the<br />
vermicomposting process, all are larger than those found in the initial mixtures. The increase<br />
in total Kjeldahl nitrogen enhances the fertilizing capacity of the final product<br />
(vermicompost), as nitrogen is an essential nutrient for growth and development of plants.<br />
According to Atiyeh et al., 2001, the increase of nutrients such as nitrogen and phospho<strong>ru</strong>s is<br />
directly related to the mineralization of organic matter by the earthworms.<br />
The values for the C/N ratio showed a decrease during the process, approximately 50%, and<br />
this is due to the decrease that was observed in the TOC content and an increase in TKN<br />
content. The speed-up in the humification process, promoted by the earthworms during the<br />
vermicomposting, results in a reduction of C/N ratio.<br />
The amount of humic and FAs extracted from vermicompost C is much greater than the<br />
amount extracted from the other studied vermicomposts, either in the beginning or in the end<br />
of the process of vermicomposting. Normalizing for the organic matter content in their<br />
vermicomposts, the vermicompost C continues to present the greatest amount of HA and FA.<br />
During the process of vermicomposting it is observed that for the vermicomposts B and C the<br />
amount of HA increases with vermicomposting. The vermicompost A showed a significant<br />
decrease in the HA content. One explanation for this fact could be the huge amount of<br />
microorganisms present in raw sewage sludge that may have degraded part of the HA present<br />
in the material. It is remarkable to notice that this material (100% sludge) offers the poorest<br />
environment for the earthworms to survive.<br />
For the amount of FA it was observed that it decreases with the vermicomposting process,<br />
which is expected once the FA st<strong>ru</strong>cture is smaller and more easily degradable. Moreover, it is<br />
<strong>Vol</strong>. 2 Page - 504 -
15th IHSS Meeting- <strong>Vol</strong>. 2<br />
believed that the FA "merge" forming the HA. The vermicompost which presented the highest<br />
amount of FA at the end of the process, as shown in the table 1, was the vermicompost C.<br />
The helminthus viable eggs content is reduced during the vermicomposting process, this is<br />
due to the process of feeding of the earthworms. The earthworm feed on organic matter. In<br />
parallel they swallow the ground (in the case of the sludge sewage and mixtures B and C). In<br />
this process they also eat microorganisms and helminthus eggs present in the substrate in<br />
question. When these microorganisms pass through the digestive tract they eventually die and<br />
part of the viable eggs were also degraded. This would be an explanation for the decrease in<br />
the concentration of viable eggs.<br />
The comparison between the three produced vermicomposts shows that the vermicompost that<br />
presents the greatest potential as a fertilizer would be A, but some studies should be<br />
conducted to determine the concentration of toxic elements in this vermicompost to evaluate<br />
its disposal in agricultural soils as a conditioner or a fertilizer.<br />
4. Conclusions<br />
It has been shown in this paper that the sewage sludge can be used as a matrix for the<br />
production of vermicompost, generating a final product with high levels of NKT, P, and a<br />
favorable C/N ratio.<br />
In general, the vermicomposting was efficient to be used as a technique for stabilization of<br />
domestic sewage sludge, and the final substrate of treatment (especially for the vermicompost<br />
A) has a high potential for use in agriculture as fertilizer or as a conditioner.<br />
Acknowledgements<br />
The authors thank financial support of FAPESP (process 07/50776-4), CAPES and CNPq.<br />
Paulo Roberto Dores-Silva thanks program Ensinar com Pesquisa/USP for his research grant.<br />
References<br />
1. Andreoli, C,V, Resíduos Sólidos no Saneamento, Processos de Reciclagem e Disposição Final, 1 a<br />
ed,, Rio de Janeiro, 2001,<br />
2. Atiyeh, R,M, Edwards, C,A, Subler, S, Metzger, J,D, Pig Manure vermiccompost as a<br />
Component of a horticultural bedding plant medium: effects on physicochemical proprieties and<br />
plant growth, Bioresource Technology, 78, 11–20,2001,<br />
3. Kiehl, E,J, Fertilizantesorgânicos, São Paulo: Agronômica Ceres, 1985, 492p,<br />
4. Kiehl, E,J, Manual de Compostagem “Maturação e qualidade do Composto”,Piracicaba, 2002,<br />
171p,<br />
5. Landgraf, M,D, Messias, R,A, Rezende, M,O,O, A Importância Ambiental da<br />
Vermicompostagem: Vantagem e Aplicação, 1 a ed,, Rima: São Carlos, 2005,<br />
6. http://www,ihss,gatech,edu/soilhafa,html, acessadaem Janeiro 2008.<br />
<strong>Vol</strong>. 2 Page - 505 -
15th IHSS Meeting- <strong>Vol</strong>. 2<br />
Photoacoustic Characterization of Humic Acids Extracted from<br />
Vermicomposted Residues<br />
Daniely Forgerini a* , Paulo Roberto Dores-Silva a , Maria Diva Landgraf a , Maria Olímpia<br />
Oliveira Rezende a , Washington Luiz de Barros Melo b<br />
a Instituto de Química de São Carlos. Av. Trabalhador Sãocarlense, 400, São Carlos, SP,<br />
Brazil, CEP 13566-590; b EMBRAPA. Rua XV de Novembro, 1452, São Carlos, SP - Brasil -<br />
CEP 13560-970<br />
E-mail: dforgerini@yahoo.com.br<br />
1. Introduction<br />
Although the composting of organic waste is an ancient practice, the vermicomposting was<br />
developed in the 40 and 50, based on research carried out by management programs of worms<br />
at the experimental station in Rothamstead (England) and only since 1970 this practice has<br />
intensified the studies on the potential of earthworms to convert organic waste into a more<br />
stabilized organic matter (OM).<br />
The OM existing in nature is presented as a complex system of various substances, with<br />
varying on composition and are constantly changing under the action of physical, chemical<br />
and biological process that occur simultaneously, [8].<br />
The material originated from the transformation of OM can be divided into two major<br />
groups. The first, called active OM, which has not decomposed, and the second being the<br />
inactive OM, humified or stabilized, also known as humus, such matter is no longer subject to<br />
intense decomposition, humus can be divided into two fractions: humic fraction and non<br />
humic fraction, [5].<br />
The humic substances (HS) are formed through chemical and biological degradation of OM<br />
and metabolic activity of microorganisms, and consist of humic acids (HA), fulvic acids (FA)<br />
and humin. Little is known about the origin, chemical st<strong>ru</strong>cture and synthesis of such<br />
substances and this fact is due to the heterogeneous nature of HS, [6].<br />
The physical and chemical characteristics of HA, FA and humin extracted from different<br />
locations depend on many factors, among which the merits of the original material, [8].<br />
This work seeks to st<strong>ru</strong>ctural characterization of HA extracted from a mixture of cattle<br />
manure and rice straw (1:1 v:v) composted for 3 months, in order to ascertain the degree of<br />
maturation of HA studied in humus.<br />
<strong>Vol</strong>. 2 Page - 506 -
15th IHSS Meeting- <strong>Vol</strong>. 2<br />
2. Material and methods<br />
The extraction and purification of HA was performed according to the conventional<br />
methodology suggested by the International Humic Substances Society, the ash content was<br />
determined by combustion furnace at a 560 ºC for 4 hours in a platinum c<strong>ru</strong>cible.<br />
The infrared spect<strong>ru</strong>m (IR) was obtained in KBr pellets, with about 0.50 mg of sample to<br />
200.00 mg of KBr. The spectra of UV-Vis were obtained in a solution (NaHCO 3 ) 0.025 mol<br />
L -1 . Approximately 5.00 mg of HA was dissolved in 50.00 mL of solution with pH 8.40. It<br />
was used a UV-Vis Hitachi U3501® with a quartz cuvette of 1 cm length.<br />
The photoacoustic spect<strong>ru</strong>m was obtained using 0.15 g of sieved material of 250 µm in<br />
compressed tablets. These were inserted one at a time, the chamber photoacoustic<br />
photothermal spectrometer. It was obtained spectra in the range of wavelengths from 300 to<br />
800 nm. They were standardized against the charcoal pressed to remove the influence of the<br />
spect<strong>ru</strong>m of xenon lamp in the spect<strong>ru</strong>m of the sample.<br />
All tests were performed in five replicates and the numerical values were determined by the<br />
arithmetic mean.<br />
3. Results and discussion<br />
Figure 1 shows the IR spectra and UV-Vis of humic acids extracted from a mixture of cattle<br />
manure and rice straw vermicomposted (1:1 v:v) (RS).<br />
a) b)<br />
---<br />
---<br />
Figure 1: Infrared spect<strong>ru</strong>m (a) and UV-Vis (b) of humic acids extracted from a mixture of<br />
cattle manure and rice straw (1:1 v:v) (RS)<br />
After doing the extraction and purification of the HA, the analysis of ash content was done in<br />
order to verify the purity degree, what is extremely important for subsequent analysis. The<br />
results obtained for the ash content were below than 5%, indicating that the HA extracted<br />
were sufficiently pure for further analysis, Sutton & Sposito (2005).<br />
<strong>Vol</strong>. 2 Page - 507 -
15th IHSS Meeting- <strong>Vol</strong>. 2<br />
The spect<strong>ru</strong>m of UV-Vis of the HA extracted from RS showed a well marked shoulder near<br />
280 nm characteristic of chromophore groups such as unsaturated or aromatic st<strong>ru</strong>ctures. This<br />
feature was expected since the matrix RS processes these st<strong>ru</strong>ctures in its initial composition,<br />
such as lignins, that come from rice straw.<br />
There is a wide band extending from 3000 to 3600 cm -1 , which is centered at 3400 cm -1 , on<br />
the OH stretch, a band near 2940 cm -1 due to symmetric and asymmetric stretching of<br />
aliphatic CH, a band near 1630 cm -1 on the stretch of C=C aromatic, a band near 1400 cm -1<br />
associated with the symmetric stretching of C=O carboxylate, a broad band near 1170 cm -1 on<br />
the CO stretching of polysaccharide st<strong>ru</strong>ctures and stretching of Si-O.<br />
Figure 2 shows the photoacoustic spect<strong>ru</strong>m of cattle manure and rice straw vermicomposted<br />
and of the purified HA.<br />
0.9<br />
PAV<br />
AH-PAV<br />
0.8<br />
Photoacoustic Spectra (u.a.)<br />
0.7<br />
0.6<br />
0.5<br />
0.4<br />
0.3<br />
0.2<br />
0.1<br />
300 400 500 600 700 800<br />
Wavelength (nm)<br />
Figure 2: Photoacoustic spectra: (a) cattle manure and rice straw vermicomposted (1:1 v:v)<br />
(RS), (b) humic acid extracted from cattle manure and rice straw vermicomposted (1:1 v:v) (HA - RS)<br />
Photoacoustic spectroscopy is based on the photoacoustic effect that appears when the<br />
modulated light focuses on a sample in a sealed chamber filled with gas. The light is absorbed<br />
by the sample, which heats periodically, causing a periodic flow of heat from the sample to<br />
the gas, resulting in a variation pressure. This pressure variation is detected by a microphone<br />
inside the chamber and is known to be proportional to the photoacoustic absorption<br />
coefficients of the chromophores in the sample.<br />
The light scattered by the sample does not cause any problem with the photoacoustic, since<br />
only the light absorbed by the sample is converted to the desired signal. Usually this<br />
technique does not require a rigorous preparation of the sample.<br />
The photoacoustic spectra were obtained from the samples of raw vermicompost and the<br />
purified HA (taken from the same vermicompost), in order to compare the absorption peaks of<br />
both samples and to verify that no prior purification of the sample is required to obtain the<br />
<strong>Vol</strong>. 2 Page - 508 -
15th IHSS Meeting- <strong>Vol</strong>. 2<br />
absorption spect<strong>ru</strong>m of the chromophore groups of the samples. The spect<strong>ru</strong>m of purified HA<br />
(Fig. 2) showed a larger signal due to the absence of interfering. As in the spect<strong>ru</strong>m of UV-<br />
Vis, the photoacoustic spectra show a high absorption near to 280 nm corresponding to the<br />
chromophore groups.<br />
4. Conclusions<br />
Through spectroscopic studies can characterize the HA extracted from cattle manure and rice<br />
straw (1:1 v:v) vermicomposted, resulting in features related to their molecular st<strong>ru</strong>cture.<br />
Acknowledgments<br />
This work was funded by FAPESP # 07/50776-4, CNPq and CAPES.<br />
References<br />
1. Adani, F. Ricca, G. Tambone, F., Genevini, P. Isolation of the stable fraction (the core) of the<br />
humic acid. Chemosphere 65, 1300–1307, 2006.<br />
2. Bertoncini, E.I., D’Orazio, V., Senesi, N., Mattiazzo, M.E. Fluorescence analysis of humic and<br />
fulvic acids from two Brazilian oxisols as affected by biosolid amendment. Anal. Bioanal. Chem.<br />
381, 1281–1288, 2005.<br />
3. Campitelli. P. Ceppi. S. Effects of composting technologies on the chemical and physicochemical<br />
properties of humic acids, Geoderma, 144. 325–333, 2008.<br />
4. http://www.ihss.gatech.edu/soilhafa.html, acessada em Janeiro 2008.<br />
5. Kiehl, E.J. Fertilizantes orgânicos. SP, Ed. Agronômica CERES, 1985. 492p.<br />
6. Messias, R. A., Avaliação est<strong>ru</strong>tural de ácidos húmicos de vermicomposto e turfa por diferentes<br />
técnicas de caracterização. In: IQSC, USP, São Carlos – SP, 134p, 2004.<br />
7. Silva., P. R. D., 2008, Processo de Vermicompostagem de lodo de esgoto doméstico. In: IQSC,<br />
USP, São Carlos – SP, 94p.<br />
8. Stevenson, J.F. <strong>Humus</strong> Chemistry, Genesis, Composition, Reactions. 2 a ed., John Wiley & Sons:<br />
New York, 1994.<br />
9. Suthar, S.; Singh, S. Vermicomposting of domestic waste by using two epigeic earthworms<br />
(Perionyx excavatus and Perionyx sansibaricus) Int. J. Environ. Sci. Tech., 5, 99-106, 2008.<br />
10. Sutton, R., Sposito, G. Molecular st<strong>ru</strong>cture in soil humic substances: the new view. Env. Sci.<br />
Technol. 39, 9009–9012, 2005.<br />
<strong>Vol</strong>. 2 Page - 509 -
15th IHSS Meeting- <strong>Vol</strong>. 2<br />
The Application of Humic Material for Plant Productivity Control in<br />
Malaysia<br />
Alexander I. Popov a,c* , Sergei P. Melnikov b , Marina A. Efremova b , Vaycheslav I. Kuznetsov d ,<br />
Olga V. Fitch e<br />
a The Saint Petersburg State University, 16th line 29, 199127 Saint Petersburg, Russian<br />
Federation; b The Saint Petersburg State Agrarian University, Petersburg’s Road 2/1a, 196600<br />
Saint Petersburg – Pushkin, Russian Federation; c Agro-Physical Research Institute of The<br />
Russian Academy of Agricultural Science, Saint Petersburg Russian Federation; d Bashincom<br />
Ltd, Ufa, Bashkortostan; e AgriSciences UK–Malaysia Ltd, London, UK and Kuala Lumpur,<br />
Malaysia<br />
E-mail: paihumic@gmail.com<br />
1. Introduction<br />
At the beginning of the 21st century there are two important problems of plant cultivation.<br />
The first problem is physiological-biochemical processes control in the plant-soil system, and<br />
the second one is the optimal crop productivity. A basic tendency of modern agricultural is a<br />
production of sufficient supply of foodstuff, fodders, and technical crops. At the same time<br />
the all production of plant growing must be ecological safety [1].<br />
At present, the soil fertility in many developing countries (including Malaysia, for instance)<br />
has low level. Often such problem is the result of low content of humus. A control of a crop<br />
growing by mineral fertilizers does not allow receiving a required quantity of a foodstuff. At<br />
the same time the shortage of microelements is often registered [2].<br />
On the assumption of effective usage of nutrients in the plant-soil system, the main priority in<br />
agriculture is to intensify a production process. It does not mean a finding the single point<br />
called “economical optimum” [1]. Among all methods of influence on crops the most<br />
effective as in economical as well as in industrial respects are the foliar treatment of plants by<br />
humic substances (HS) solutions, especially these solution altered by the microelements [3].<br />
The aim of this publication is to give you the benefits of our experience and knowledge in<br />
usage of humic substances preparation on a whole number of crop (agriculture). These results<br />
were obtained in Malaysia.<br />
2. Materials and Methods<br />
The research work was in progress on AgriSciences UK-Malaysia Ltd and FAMA<br />
inst<strong>ru</strong>ctions. In the capacity of a test subject was selected a lot of crops: rice (Oryza sativa L.),<br />
pumpkin (Cucurbita pepo L.), roselle (Hibiscus sabdariffa L.), papaya (Carica papaya L.),<br />
<strong>Vol</strong>. 2 Page - 510 -
15th IHSS Meeting- <strong>Vol</strong>. 2<br />
pineapple (Ananas sp. Mill.), dragon f<strong>ru</strong>it (Hylocereus undatus (Haw.) Britton & Rose), chilipepper<br />
(Capsicum annuum L.), strawberry (Fragaria sp.), tomatoes (Solanum lycopersicum<br />
L.). In the capacity of the humic preparations were selected the following ones: “Humi” and<br />
“Stimulife”. The first one (production of Bashincom Ltd, Ufa, Bashkortostan) contained the<br />
microelements and the fungicidal preparation “Phytosporin-M”. “Stimulife” was modified by<br />
the microelements. Both preparations are used for the foliar treatment of plants.<br />
3. Results and Discussion<br />
Both humic preparations made for increase of rice grain harvest (Fig. 1).<br />
Grain harvest, kg/ha<br />
6200<br />
6000<br />
5800<br />
5600<br />
5400<br />
5200<br />
5000<br />
Control Humi Stimulife<br />
Figure 1: Rice grain harvest<br />
In addition, the humic preparations were efficient in Malaysian agro climatic conditions. The<br />
effect of HS contained in both preparations acted quickly. It was detected after the 3 weeks<br />
even. Therefore, under the impact of HS the sprouts growth (Figs. 2–3), the quantity of f<strong>ru</strong>its<br />
(Fig. 4) and the f<strong>ru</strong>it’s weight (Fig. 5) were detected.<br />
70<br />
60<br />
Height, cm<br />
50<br />
40<br />
30<br />
20<br />
10<br />
0<br />
Pumpkin Roselle Papaya Pineapple Dragon f<strong>ru</strong>it<br />
Control (background) Humi + background Stimulife + background<br />
Figure 2: Height of crop sprouts<br />
<strong>Vol</strong>. 2 Page - 511 -
15th IHSS Meeting- <strong>Vol</strong>. 2<br />
Height, cm<br />
30<br />
25<br />
20<br />
15<br />
10<br />
5<br />
0<br />
1 2 3 4<br />
Tests<br />
Control (background) Humi + background Stimulife + background<br />
Figure 3: Height of chili-pepper<br />
30<br />
25<br />
20<br />
15<br />
10<br />
5<br />
0<br />
Strawberry<br />
Control<br />
Humi<br />
Stimulife<br />
The quantity of f<strong>ru</strong>its<br />
on 10 plants, pieces<br />
94<br />
92<br />
90<br />
88<br />
86<br />
84<br />
82<br />
80<br />
78<br />
Tomatoes<br />
Control<br />
Humi<br />
The quantity of f<strong>ru</strong>its<br />
on 10 plants, pieces<br />
Stimulife<br />
Figure 4: The quantity of f<strong>ru</strong>its on 10 plants of strawberry and tomatoes<br />
18<br />
F<strong>ru</strong>it’s weight, g<br />
16<br />
14<br />
12<br />
10<br />
Control Humi Stimulife<br />
Figure 5: A weight of one tomato f<strong>ru</strong>it<br />
<strong>Vol</strong>. 2 Page - 512 -
15th IHSS Meeting- <strong>Vol</strong>. 2<br />
In respect to agrobiology, the trophic interrelation between plant and soil is advisably<br />
regarded as specific double trophic chain, in which the utilization of plant litter by soil biota is<br />
accompanied by creation of phytonutrients (by means of same biota). The soil in this system<br />
carries out transformational trophic function. The functioning of plant-soil system is<br />
determined by biological properties of its composing links. Soil organic matter is one of main<br />
trophic links of plant-soil system. The mull-humus is most favorable for growth and<br />
development of plants, it is beyond question. However in modern arable soils this humus type<br />
is absent practically, because the intensive anthropogenic influence results to significant<br />
pauperization of soil biota by earthworms [4, 5]. Consequently, in order to fill lack of mullhumus<br />
in trophic plant-soil system, it is necessary either introduce vermicompost (earthworm<br />
cast compost) in soils or carry out foliar plant treatments by HS solution [1]. A positive effect<br />
of HS on plant productivity may be result from influence of HS on biochemical and<br />
biophysical processes into plants [3]. Possibility of both a coming of complicated organic<br />
molecules (including HS) into plants by roots and assimilation of organic material by plant is<br />
well- proven fact [3]. The understanding of ecological and trophic role of soil organic matter<br />
in plant nutrition opens up new possibilities of crop productivity control. The consumption by<br />
green vascular plants both organic compounds and mineral nutrition increases a number of<br />
functional chains in ecosystems, and is the factor of increase of agroecosystem stability.<br />
4. Conclusions<br />
Accordingly, the both humic preparations (particularly Humi and Stimulife) exerted positive<br />
influence on crop productivity in agro ecological conditions of Malaysia.<br />
Acknowledgements<br />
The work was carried out by the financial support of RFBR, grant: 07-04-00308.<br />
References<br />
1. E.I. Ermakov, A.I. Popov, Herald of the Russian Academy of Agricultural Sciences, 6 (2005), 4 (in<br />
Russian).<br />
2. I. Cakmak, Plenary Lectures of the XIV International Plant Nutrition Colloquium (Hannover,<br />
2001) / Edited by W. J. Horst, A. Bürkert, N. Claassen et al., (2002) Kluwer Academic Publishers,<br />
Dordrecht–Boston–London, 3.<br />
3. A.I. Popov, The Humic Substances: Properties, Const<strong>ru</strong>ction, Formation. E. I. Ermakov (Ed.),<br />
Saint Petersburg University Press, Saint Petersburg, 2004, p. 248 (in Russian).<br />
4. S.I. Ponomareva, Proceedings of Soil Research Institute named V. V. Dokuchaev. Publishers of the<br />
Academy of Sciences of USSR, Moscow, 41 (1953), 304 (in Russian).<br />
5. U. Boström, Swed. J. Agr. Res., 16 (1986) 137.<br />
<strong>Vol</strong>. 2 Page - 513 -
15th IHSS Meeting- <strong>Vol</strong>. 2<br />
Microorganisms and Enzyme Activity in the Formation of Humic<br />
Substances During the Composting Process<br />
Roberto Quintero Lizaola<br />
Colegio de Postgraduados en Ciaencias Agrícolas<br />
Carretera Mexico-Texcoco, Km 36.5, Montecillo, Municipio de Texcoco, Mexico State.<br />
Mexico. C. P. 56 230<br />
E-mail: quintero@colpos.mx<br />
1. Introduction<br />
The use of various organic wastes by various biotransformation processes, the proper<br />
knowledge of microorganisms and enzyme cational in the formation of humic substances with<br />
composting, reduces acquisition time [1]. This research paper reports the dynamic behavior of<br />
microbial bacteria, fungi, actinimicetos, amylolitic, cellulolytic, lipolytic, ligninolytic,<br />
proteolytic, amonificantes, nitrifiers (ammonium oxidizers and nitrite oxidizers), denitrifying<br />
and free nitrogen fixers. Besides the dynamics of amylase enzyme (EC3.2.11), cellulase (EC<br />
3.2 .. 1.4), lipase (EC3.1.1.3), invertase (EC3.2.1.20), protease / EC3.4.23.16), amidase<br />
(EC3.5 .1.11), urease (EC3.5.1.5), nitrogenase (EC3.5.1.5), dehydrogenase (EC1.2.1.12), acid<br />
phosphatase (EC3.1.3.2), alkaline phosphatase (eC3.1.3.1) and arylsulfatase (EC3.1 -6.8)<br />
Quantifying the amount of humic acids in compost.<br />
2. Materials and Methods<br />
Plastic boxes (20 X 31 X 13) placed with ground oat straw (less than 2 mm) and chopped<br />
(less than 4 mm), by-product of the fungus Pleurotus ostreatus and licked up to 80% (weight /<br />
volume). Samples were taken 23, 46, 69, 92, 115 and groups 148 diaspara measure microbial<br />
enzyme activities and humic substances. During sampling periods, the moisture in the<br />
substrate was maintained between 75 and 85%, controlled gravimetrically and with<br />
temperatures between 25 and 30 degrees Celsius. We used a completely randomized design<br />
with five replicates, statistical analysis of variance and corresponding correlations.<br />
3. Results and Discussion<br />
Jas enzymes evaluated the most influential in the formation of humic substances were acid<br />
and alkaline phosphatases, arylsulfatase equally. The first catalyze the hydrolysis of organic<br />
phospho<strong>ru</strong>s esters inotgánico phosphate. The alkaline phosphatase activity increased in the<br />
first 69 days and remained unchanged at later stages.<br />
The organisms that most influenced the formation of humic substances were the<br />
<strong>Vol</strong>. 2 Page - 514 -
15th IHSS Meeting- <strong>Vol</strong>. 2<br />
actinomycetes, cellulolytic and ligninolytic, with correlations of 0.61 in the chopped straw.<br />
4.Conclusions<br />
Enzymes that most influenced the formation of humic substances were the alkaline and acid<br />
phosphatase, arylsulfatase well. Microorganisms actinomycetes, cellulolytic and ligninolytic<br />
ifluyeron more in the training of humic substances.<br />
Acknowledgments<br />
Rosario Gonzalez Estrada, Roberto Sinuhe Quintero and Rodrigo Quintero Gonzalez.<br />
References<br />
1. Quintero-Lizaola, R., R. Ferrera-Cerrato, J. D. Etchevers-Barre, N. E. Garcia-Calderon, R.<br />
Rodriguez-Kabana, G. Alcantar-Gonzalez and A. Aguilar-Santelises. 2003. Enzymes Participating<br />
in the Vermicomposting Process.Terra-Latin. 21:73-80.<br />
<strong>Vol</strong>. 2 Page - 515 -
15th IHSS Meeting- <strong>Vol</strong>. 2<br />
Can Semiarid Soils Admit High Amounts of Urban<br />
Organic Wastes for C Fixation?<br />
Encarnación García, Carlos García, Teresa Hernández *<br />
Department of Soil and Water conservation and Organic Waste Management, Centro de<br />
Edafología y Biología Aplicada del Segura, CEBAS-CSIC, P.O. Box 164, 30100 Espinardo<br />
(Murcia), Spain<br />
E-mail: mthernan@cebas.csic.es<br />
1. Introduction<br />
The increasing generation of wastes, especially of municipal organic wastes, is a problem that<br />
demands an immediate solution. Another problem, of equal importance, is the high level of<br />
degradation existing in the soils of extensive areas of Spain and southern Europe, mainly as a<br />
result of aggressive human activity over many years, to which must be added the adverse<br />
climatology (semiarid). A key factor in this degradation is the low level of organic matter in<br />
these soils. Since in extensive zones of Spain and other European countries, particularly in<br />
those from South Europe, traditional sources of organic matter (peat and manures) are scant,<br />
the interesting question arises of whether both problems (soils and wastes) can be treated<br />
together. More particularly, the idea would be to use the organic matter contained in organic<br />
wastes as soil organic matter source, particularly that from urban wastes (sewage sludge and<br />
organic domestic wastes), since they are cheap and in frequent supply. The aim would be to<br />
improve soil fertility while eliminating otherwise unwanted waste in a rational and<br />
environmental friendly way. This would favour carbon sequestration by increasing the pool of<br />
stable carbon in the soil, helping to mitigate the negative effects derived from CO 2 emissions<br />
to the atmosphere.<br />
Studies already made suggest that the addition to soil of municipal wastes may be an effective<br />
way to recover degraded soils, although little is known on the influence of the degree of<br />
stabilisation of these wastes on soil recovery and on the extent to which C becomes fixed in<br />
the soil. For this reason the objective of this work is to study the influence of the stability of<br />
organic municipal wastes as well as that of the addition of very high amounts of such wastes<br />
on the fixing of C in semiarid soils in a stable way.<br />
<strong>Vol</strong>. 2 Page - 516 -
15th IHSS Meeting- <strong>Vol</strong>. 2<br />
2. Materials and Methods<br />
An incubation experiment was carried out to study the evolution of the amended soils. The<br />
soil used in the incubation experiment was a sandy loam soil, classified as Haplic Calcisol [1],<br />
collected from a semiarid zone sited in Murcia (SE Spain). To 500 g of this soil a mixture (1:3<br />
ratio) of sewage sludge and the organic fraction of domestic wastes, both fresh (FR), and<br />
composted for 30 (FC) and 60 (MC) days were added at an amount enough to incorporate<br />
5.45 % (about 150 t/ha, d 1 ) and 14.5 % (about 450 t/ha wet weight, d 2 ) of organic carbon<br />
(OC) to the soil. Soil without amendment was used as control. The moisture content of the<br />
soils was adjusted and maintained at 60% of the soil water-holding capacity by adding<br />
deionised water and the pots were covered and placed in an incubation chamber for 9 months.<br />
Soils were sampled for analysis at the beginning and after 90, 180 and 270 days of incubation.<br />
Soil-particle fractionation was carried out at the beginning and end of the incubation period.<br />
The procedure for soil-particle fractionation involved the dispersion of soil samples by a lowenergy<br />
sonication and separation of particle-size fractions by a combination of wet sieving<br />
and centrifugation as described by Stemmer et al. [2]. Soil OC content was determined with a<br />
Thermo Finnigan Flash 1112 elemental analyzer (Franklin, MA, USA), after hydrochloric<br />
acid attack to eliminate carbonates.<br />
3. Results and Discussion<br />
Although soil organic C decreased with time in all the amended soils, due to the<br />
mineralization of the added organic matter, all the amended soils showed considerably higher<br />
OC content than the unamended soil at the end of the incubation period (Fig. 1).<br />
% Organic C<br />
3,5<br />
3<br />
2,5<br />
2<br />
1,5<br />
1<br />
0,5<br />
S<br />
FC-d1<br />
FC-d2<br />
MC-d1<br />
0 100 200 300<br />
days<br />
Figure 1: Soil organic C content, %, which was<br />
reflected by higher values of ATP, basal<br />
respiration and dehydrogenase activity<br />
(data not shown)<br />
The enrichment in soil OC content after 9<br />
month of incubation was higher in all cases<br />
at the higher application rate (d 2 ) but, in<br />
agreement with the findings of Stewart et<br />
al. [3], the efficiency of the amendment in<br />
C fixation was lower than when added at<br />
lower rate since the addition of very high<br />
doses of organic amendments encouraged<br />
OC mineralization. Thus, the percentage of<br />
OC lost in the soils amended at higher rate<br />
(d 2 ) after 9 months of incubation was about<br />
<strong>Vol</strong>. 2 Page - 517 -
15th IHSS Meeting- <strong>Vol</strong>. 2<br />
twice higher than that of the soils amended at the lower rate (d 1 ). On the other hand, OC<br />
mineralization was higher in the soils amended with fresh residue than in the soils amended<br />
with composts regardless the application rate (23 % and 13% higher for d 1 and d 2 ,<br />
respectively), which can be explained by the more stable character of the organic matter<br />
added with composts. Organic carbon mineralization decreased in the following order: FR-d 2<br />
(44 %) > FC-d 2 (40 %) ≥ MC-d 2 (39 %) > FR-d 1 > FC-d 1 = MC-d 1 (21 %). OC mineralization<br />
was very intense in the first 3 months due to the great increase in microbial activity produced<br />
by the great amount of substrates added with the organic amendment. After the fist 3 months<br />
of incubation OC was mineralized in a more steadily way due to the diminution of the more<br />
easily biodegradable compounds and the consequent microbial activity decrease.<br />
A soil’s capacity to store organic matter (OM) is related with its association to particles of<br />
clay and silt (2–20 µm diameter), macro-(>250 µm) and micro-aggregates (20–250 µm), and<br />
the macro fraction of the sand sized organic matter [4,5]. In both natural and agricultural soils,<br />
mineral sorption is an important mechanisms leading to C stabilization that protect OM from<br />
microbial attack, thereby increasing the mean residence time of mineral-stabilized C [6].<br />
Initially (7 days after the amendment), the added OC was mainly retained in coarse sand soil<br />
fraction (200–2000 μm) although all soil fractions showed higher OC content in amended<br />
soils than in control, particularly at the higher dose (Fig. 2).<br />
6<br />
5<br />
4<br />
3<br />
2<br />
1<br />
0<br />
Initio<br />
Coarse sand<br />
9 months<br />
3<br />
2<br />
1<br />
0<br />
Initio<br />
Fine sand<br />
9 months<br />
3<br />
2<br />
1<br />
0<br />
Initio<br />
Silt<br />
9 months<br />
3<br />
2<br />
1<br />
0<br />
Initio<br />
Clay<br />
9 months<br />
SD FR-d1 FC-d1 MC-d1 FR-d2 FC-d2 MC-d2<br />
Figure 2: Changes with time of the organic C content in the different soil fractions<br />
The OC retained in coarse sand fraction is the less protected soil carbon and consequently was<br />
the most mineralized fraction after the incubation period. It should be noted that whereas in<br />
soils amended with FC or MC at high rate the percentage of OC retained in coarse sand<br />
diminished with incubation by 16%, in the rest of treatments, including FR at high rate, this<br />
diminution ranged from 27 to 36%. This could suggest that more time is necessary for the<br />
degradation of the huge amount of more stabilized C substrates added with composts.<br />
<strong>Vol</strong>. 2 Page - 518 -
15th IHSS Meeting- <strong>Vol</strong>. 2<br />
In control soil the higher concentrations of OC were found in fine soil particle-size (silt, 2–63<br />
µm, and clay, 0.1–2 µm) and only slightly changes were observed in the carbon linked to<br />
these particle-size fractions after the incubation period, indicating the presence of stable and<br />
protected OC difficult to degrade. Soils treated with MC showed, at both application rates, the<br />
highest OC concentrations in all soil particle-size, with the only exception of coarse sand.<br />
This suggests that mature composts, due to the stabilization of their organic matter throughout<br />
the composting process are more suitable amendment for fixing OC in soil than fresh residue.<br />
Whatever the dose applied, the added OC was mainly retained in the coarse sand fraction and<br />
in clay size particle, differences with control being more noticeable for high dose. However,<br />
in soil amended at high rate, the OC linked to clay particles decreased slightly during the<br />
incubation period, whereas in soils amended at the lower rate the amount of OC linked to this<br />
soil fraction increased significantly (20% in MC treated soils and 10% in FC treated soils),<br />
suggesting a possible saturation in the capability of the clay-sized fraction to protect OC from<br />
microbial attack. Organic carbon fixed to silt-sized particle remained nearly constant during<br />
the incubation period, contrarily to fine sand fraction that tended to increase in compost<br />
treated soils, particularly when treated at the lower dose (Fig. 2).<br />
4. Conclusions<br />
From this study it can be concluded that composted organic wastes are more suitable for<br />
encourage soil OC fixation and protection in soil fine particle-size than fresh ones. As regards<br />
dose, the addition of organic amendments at 450 t/ha led to a higher level of OC fixation than<br />
the addition at 150 t/ha but the efficiency of OC fixation is lower at the higher dose due to the<br />
encouragement of OC losses by mineralization. A great part of the added OC remains<br />
protected by its link with the fine soil particle-size, however, it seems to exist a threshold<br />
beyond which clay size fraction cannot fix more OC.<br />
Acknowledgements<br />
This work has been supported by the Spanish Ministry of Science, Technology and<br />
Innovation within the Project CTM2007-60061TECNO.<br />
References<br />
1. FAO; ISRIC and SICS (1999). Base Referencial Mundial del Recurso Suelo. Roma. 90 p.<br />
2. M. Stemmer, M.H. Gerzabek, and E. Kandeler, Soil Biol. Biochem., 30 (1998) 9–17.<br />
3. C.E. Stewart, K. Paustian, R.T. Conant, A.F. Plante and J. Six, Biogeochemistry 86 (2007) 19–31.<br />
4. B.T. Christensen, in M.R. Carter and B.A: Steward (Ed) St<strong>ru</strong>ctural and Organic Matter Storage in<br />
Agricultural Soils. Lewis Publ., CRC Press, Boca Raton, FL. 1996, p.97–165.<br />
5. J.M. Tisdall, J.M. Oades, J. Soil Sci. 33 (1996) 141–163.<br />
6. K. Kaiser, G. Guggenberger, Eur. J. Soil Sci., 54 (2003) 219–236.<br />
<strong>Vol</strong>. 2 Page - 519 -
15th IHSS Meeting- <strong>Vol</strong>. 2<br />
The Exogenetic Huminous Acids Effectiveness in Forming the Yield of<br />
Agricultural Crops and the Soils Fertility Reproduction<br />
Pusenkova L. a* , Khabirov I. b , Gilyazetdinov S. c , Kuznetsov V. d<br />
a Bashkiria research institute of agricultural Russian academy of agrarian science, Ufa,<br />
Bashkortostan, 450059, Russia; b Bashkir State Agricultural University chair, Ufa,<br />
Bashkortostan, 450059, Russia; c Institute of Biochemistry and Genetics, Ufa Science Centre,<br />
Russian Academy of Sciences, Ufa, Bashkortostan, 450059, Russia; d SIE «BashIncom», Ufa,<br />
Bashkortostan, 450059, Russia; e Ufa, str. R. Zorge, 19, Ufa, Bashkortostan, 450059, Russia<br />
E-mail: L.Pusenkova@mail.<strong>ru</strong><br />
1. Introduction.<br />
It is known that humic acids natural reserves amounts more that 2 trln.t [1]. They may be<br />
widely used for both the plants metabolism biological correction owing to their growth<br />
regulating activity [2] and the soils fertility rising and detoxification as regads heavy metals<br />
soils [3]. In particular sodium humates preparation produced by SIE «BashIncom» were used<br />
[4] as antistress growth regulator sin sugarbeet and potatoes, and also as humic fertilizer.<br />
2. Materials and methods.<br />
The sodium humates were prepared from the Kumertau brown coal deposit (Republic of<br />
Bashkortostan) Humi-20, Humi-90 in doses of 0,2–0,3 l/ha, microfertilizer Borohumi<br />
consisting of humic acids and boric acid as microelement necessary for the dicotyledonous<br />
plants growth and development in the dose of 1.0/ha were used in the tests. The preparations<br />
were applied together with herbicides during the crops surface processing. The Humi<br />
preparations were added during surface processing with herbicides is usefula not only as<br />
rgards reducing herbicide phytotoxicity reducing, especially in dry areas, but also at raising of<br />
the plants steadiness to all the stressful factors at the plants ontogenesis consequent stages.<br />
The humic acids effectiveness was studied during simultaneous application with endophyte<br />
bacteria [5].<br />
Humic fertilizer was applied in doses of 50, 100 and 200 kg/ha simultaneously with the basic<br />
fertilizer. In had been shown before that refined Humi-90 as a meliorant was applicated in the<br />
dose of 8–24 kg/ha.<br />
Field experiments in the sugarbeet sowings in the conditions of the Republic of Bashkortostan<br />
Pre-Ural Steppe Zone. The experimental field soil characteristics: leached black soil, pH–5.4,<br />
Hg- 5.64 mg-equivalent to 100 g of soil, the humus content is 8.72%, phospho<strong>ru</strong>s and<br />
potassium–24.8 and 30 mg per 100 g soils. The crop cultivating generally accepted the<br />
<strong>Vol</strong>. 2 Page - 520 -
15th IHSS Meeting- <strong>Vol</strong>. 2<br />
technology used in the work. Investigations were conducted on the knds and hybrids of<br />
domestic (Lgov. one-seed, LBMS-1) and foreign (Dominica, Christella- KWS, Heraclis, XM-<br />
1820–Syngenta, Federica - SESVanderHave) selections.<br />
The researches were also conducted on potatoes in the conditions off the Pre-Urals Steppe<br />
Zone of the Republic of Bashkortostan (CFF «Agli» in Chishmy region) on the Red Scarlett.<br />
The soil characteristics of the experimental field: leached, midpower blackearth, pH–6.0,<br />
humus contents 7–9%, phospho<strong>ru</strong>s and potassium–20.0 and 15 mg /100 g soil.<br />
The field experiments were conducted according to «The Methodical Inst<strong>ru</strong>ctions for the State<br />
fungicides, Antibiotic Pickles of the Agriculture Crops», M.,1985, 2009.<br />
3. Results and Discussion.<br />
The early conducted investigations showed that when treating the sugar-beet sowings in the<br />
phase of 3–4 pairs of real leaves by the 10% Humi preparation solution (30 mg dose) the root<br />
plants harvest increases by 3,5 t/ha or by 11,8% when the harvest is 29,7 t/ha [6].<br />
In our investigations the effectiveness of sodium humate using in small doses (0,05–0,3 /<br />
kg/ha) was raised by adding highly effective soil micro-organisms with fungicidal effect in<br />
the form of endophyte strain Bacillus subtilis 26D. Besides the new fertilizer was studied.<br />
In the 2005–2009 investigations on the high effectiveness of the double way application<br />
together with the surface of Humi-20, Humi-20 M and Phytosporine-M on the sugar-beet<br />
sowing was grounded. In this case the root plants harvest raised up to 4.4–5.0 t/ha (17.9–<br />
39.2%) (2005 - Chishmy Sugar factory), 2.0–3.2 t/ha (9.3–16.2%) (2007 - Karlaman Sugar<br />
factory), 2.5–3.0 t/ha (16.8–19.9%) (2008 - Karlaman Sugar factory), 4.8–4.9 t/ha (18.8 –<br />
19.1%) (2009 - Chishmy Sugar factory). The root plants technological qualities, grown with<br />
these preparations using were also higher than in comparison to the control: dry substances by<br />
2.0%, sugar substances by 1.0–1.5%.<br />
During the microfertilizer Borohumi adding in the dose of 1 l/ha in the surface sugar-beet<br />
treatment , the beet root harvest increased and amounted 4,9 t/ha, or 19,1% higher than the<br />
control. And besides the sugar contents increased by 0,84% and the gross of yield of sugar by<br />
0,8–1,0 t/ha.<br />
According to the experiments of 2008–2009 double potatoes treatment by the Humi<br />
preparations with adding of endophytous bacteria and the Borohumi microfertilizer decreased<br />
the illnesses development on leaves and stems. The preparations biological activity was from<br />
<strong>Vol</strong>. 2 Page - 521 -
15th IHSS Meeting- <strong>Vol</strong>. 2<br />
33 up to 88%. The potatoes harvest in the case of double treatment of plants by the Humi<br />
biocomplex with Phytosporine-M raises by 9.0–24,4% (1,5–5,8 t/ha) when the harvest is 17.5<br />
and 23.7 t/ha. The double treatment by Borohumi helped to increase the harvest by 5 t/ha<br />
(28.6%) in comparison to the control.<br />
Besides, the potato plants double processing in the vegetation period with the preparation<br />
complex of Humi together with Phytosporine-M reduces the endophytous micromicets<br />
number on the surface and inside the potatoes tubers 10–25 times, providing by means of it<br />
their, best safety in autumn and winter period. So, by the end of the storage term the affected<br />
tubes number was 3.3 times less as compared to the control.<br />
The data show that more prospective is working out of the complex system of stimulation of<br />
yield forming and sugar beet and potatoes steadiness. Besides, the antistress humic acids and<br />
biopreparations specific character of influence on the mechanisms of forming of steadiness to<br />
unfavourable abiotical and biotical factors is taken into considerations without fail.<br />
Investigations on studying effectiveness of brinding into soil the huminous acids dry<br />
preparations in the quantity of 50–200 kg as meliorant for soils enriching with huminous<br />
substance and also for activating of the crops yield forming have already broken out. It is<br />
established that during the huminous preparations 50 kg/ha together with basic mineral<br />
fertilizer bringing in the agricultural crops level of yield raises up to 10%. It is to notice that<br />
these positive results are obtained in leached black soils with high soil humus content.<br />
So, is has been displayed in the work that humic acid preparations contribute to the fertility<br />
raising of rich with humus soils of the Republic of Bashkortostan Steppe Zone.<br />
References<br />
1. I.V.Perminova, Huminous acids as challenge to the XXI centry chemists, Chemistry and life, 2008,<br />
no.1, p.3.<br />
2. A.I.Popov, Huminous substances: properties, st<strong>ru</strong>cture, formation, St.Petersburg, 2004, 246 p.<br />
3. L.K.Sadovnikova, Z.M.Nugmanova, The Preparation Humi as the polluted soils meliorant and<br />
fertilizer, Agrochemical Bulletin, 2007, no.2, p.35.<br />
4. I.T.Shayakhmetov, V.I.Kuznetsov, S.J.Gilyazetdinov, Protective-stimulating and adaptogenetic<br />
properties of the preparation Humi are the huminous acids bioactivated forms. The effectiveness<br />
of its usage in Agriculture, Ufa, 2000, 103 p.<br />
5. S.J.Gilyazetdinov, A.Kh.Nugumanov, L.I.Pusenkova, The antistress preparation and<br />
biofungicides effectiveness in the system of the agricultural crops protection from unfavourrable<br />
abiotical and biotical factors, Ufa, 2008, 340 p.<br />
6. G. Kh.Ishmakova, The sugar-beet productivity forming during phytoregulators application in the<br />
conditions of the south forest-steppe of the Republic of Bashkortostan, Ufa, 2004, 147 p.<br />
<strong>Vol</strong>. 2 Page - 522 -
15th IHSS Meeting- <strong>Vol</strong>. 2<br />
Application of Organic Composts of Agricultural and Urban Residues for<br />
Cultivation of Ocimum Selloi Benth<br />
Lívia Botacini Favoretto a,b* , Wilson Tadeu L. da Silva a , Aurélio Vinicius Borsato c ,<br />
Fabíola M. V. Pereira a , Ladislau Martin-Neto a<br />
a Embrapa Agricultural Inst<strong>ru</strong>mentation Center, R. XV de Novembro, 1452, São Carlos,<br />
Brazil; b Institute of Chemistry of São Carlos – USP, Av. Trabalhador São-Carlense, 400, São<br />
Carlos, Brazil; c Embrapa Pantanal Center, R. 21 de Setembro, 1880, Co<strong>ru</strong>mbá, Brazil<br />
E-mail: liviafavoretto@iqsc.usp.br<br />
1. Introduction<br />
The most widely accepted definition about composting is that it is a controlled exothermic<br />
and biooxidative decomposition of organic materials by autochthonous microorganisms,<br />
resulting in a wet, warm and aerobic environment, with production of carbon dioxide, water,<br />
minerals and, a stabilized organic matter, defined as compost [1]. This is a homogeneous<br />
organic fertilizer, with several characteristics like odor, dark color, biochemical stability,<br />
complexation sites, etc, making improvements in physical, chemical and biological soil and<br />
thus, promoting the physiological development of cultivated species.<br />
The humanity produces a lot of kinds of residues which can be use as raw material in<br />
composting production [2]. P<strong>ru</strong>ning trees is a waste easily found in both <strong>ru</strong>ral and urban areas,<br />
and they are generally discarded. In the cities, this disposal may become a problem, because it<br />
increases the volume of produced waste, overloading quickly deposits or landfills. The orange<br />
peel is the main by-product of cit<strong>ru</strong>s industry, representing about 45% of the total weight of<br />
the f<strong>ru</strong>it and it can becomes a major problem for industry, because it deteriorates very rapidly<br />
during storage. The filter cake is a residue from the ethanol industry and is obtained from the<br />
solid precipitate from the sugarcane juice clarification (to produce sugar or ethanol) and, the<br />
boiler ash. The bovine manure is a waste widely used in natura as organic fertilizer however;<br />
the composting process makes it more stable and enhances its fertilizing properties.<br />
In general, the influence of organic composts in plant production and soil fertility requires<br />
more studies due to the complexity of agroecosystems. There are few studies concerning the<br />
production of medicinal plants, herbs and condiments, in order to obtain higher yield, quality<br />
and efficacy, in an organic production. The objective of this work was to evaluate the<br />
influence of different composts and selected doses, on the production of the medicine plant<br />
Ocimum selloi Benth in a tropical sandy soil, in comparison to mineral fertilizer. The studies<br />
showed differences between composts applied in the soil. Non-additional application of<br />
<strong>Vol</strong>. 2 Page - 523 -
15th IHSS Meeting- <strong>Vol</strong>. 2<br />
mineral fertilizers was done. The results were compared with the former ones observed by<br />
Fialho et al., 2010 [2], using chemical and spectroscopic methods to evaluate the compost<br />
humification.<br />
2. Material and Methods<br />
The methodology comprised the cultivation of Ocimum selloi Benth in a greenhouse in the<br />
region of São Carlos, São Paulo State, Brazil. A sandy soil (62% sand), treated with different<br />
organic composts at different doses, was collected at Canchin Farm in São Carlos - Brazil<br />
(21 o 57’47” S, 47 o 50’35” W). The experiment was completely randomized in a 4×3×3 design<br />
(four treatments in three different doses and three replications). The treatments were: (i) L1 –<br />
compost of tree p<strong>ru</strong>ning, (ii) L2 – compost produced with tree p<strong>ru</strong>ning and cattle manure, (iii)<br />
L3 - compost produced with tree p<strong>ru</strong>ning and orange peel and, (iv) L4 – compost produced<br />
with tree p<strong>ru</strong>ning and filter cake [2]. The organic composts were applied in three different<br />
equivalent doses: 5, 15 or 30 ton ha -1 . Non-additional application of mineral fertilizers was<br />
done. In addition, for comparison purposes, they were done three pots without compost<br />
application and other three ones treated with commercial fertilizer (mineral fertilizer). The<br />
experiment was set up in pots in a greenhouse. The composition of available macro- and<br />
microelements in the composts was done using a 3M HCl extract solution and quantification<br />
by ICP-AES.<br />
Soil samples were sieved and then it was made the liming process to correct the pH, which<br />
were around 4.7. Each pot received 7 kg of soil. An automatic irrigation system of the vessels<br />
was used, which consists of a new drip system for plants, recently patented by Embrapa,<br />
which allows the application of water volume. The system controls the flow of water by<br />
automatic air pressure adjustment. The different composts were ground in a knife mill and<br />
then, according to the experiment, were mixed uniformly to the soil of the vessels in three<br />
different doses. They were selected 42 plants of the same age, with two months of<br />
germination and about the same size. The seedlings were so transplanted to vessels.<br />
Leaves were collected after thee months of experiment. Immediately post-harvest samples<br />
were weighed to obtain fresh weight and so, they were dried in an oven with forced air at 60<br />
°C until mass constant and were re-weighed to obtain dry weight. Dry samples of plant tissue<br />
were c<strong>ru</strong>shed and sent for fertility. Macro- and micronutrients content was determined using<br />
inductively coupled plasma atomic emission spectrometry (ICP-AES). The results of the<br />
fertility analysis, the heights and fresh weight of plants were investigated using Principal<br />
Component Analysis (PCA) [3].<br />
<strong>Vol</strong>. 2 Page - 524 -
15th IHSS Meeting- <strong>Vol</strong>. 2<br />
3. Results and Discussion.<br />
The obtained values of macro- and microelements in the composts are described in Table 1.<br />
Its remarkable the differences among the composts. The availability of the nutrients is<br />
strongly dependent of the raw materials. According to Fialho et al., 2010 [2], the CTC/C of<br />
these composts are different (L2 ~ L3 › L4 › L1), and so, the humification process release in<br />
part the nutrients. In the same article, authors using several spectral analyses (UV/Vis, FTIR<br />
and NMR) describe that samples L2, L3 and L4 reached humification; however, L1 show<br />
poor humification with high C content and lack of other elements, mainly N.<br />
Table 1: Available macro- and microelements in the composts<br />
Compost N P K Ca Mg Fe Mn Cu Zn<br />
(g kg -1 ) (mg kg -1 )<br />
L1 12.1 6.3 8.8 10.2 4.3 6.0 232.0 45.0 155.0<br />
L2 27.3 8.9 8.7 12.3 4.7 2.0 110.0 15.0 63.0<br />
L3 20.6 20.2 8.2 18.0 4.2 17.0 892.0 40.0 121.0<br />
L4 25.8 4.9 8.8 10.4 3.9 3.0 117.0 17.0 54.0<br />
Macro and micronutrients in plant tissue (leaves), the values of heights and the values of dry<br />
leaves were analyzed to evaluate the performance of treatments (L1, L2, L3 and L4).<br />
On Fig. 1, it was showed the results obtained with PCA analyses. Also in score plot of the<br />
Fig. 1-a showed the treatments were separated into two main clusters. The variables<br />
responsible for this separation were Mn an N (Fig. 1-b). It was possible to verify, with these<br />
same plots, the treatment called L2 and L3 were nearest to commercial treatment (mineral<br />
fertilizer) and in the L1 and L4 were nearest to reference samples. In this case, doses between<br />
15 and 30 the compounds showed a tendency to influence sample differentiation.<br />
The most evidence about these treatments was after 3 months of transplanting, the plants<br />
began to show yellowing of leaves, with the exception of treatment with mineral fertilizer (L2<br />
and L3). The yellowing was due to possible nitrogen deficiency plants. The comparison of the<br />
performance of the treatments showed that the plants with best visual characteristics, such as<br />
color of the leaves, were treated with mineral fertilizer. Since plants regarding therapy L1 and<br />
L4 were respectively the first and second to began to yellowing, becoming visually similar<br />
plans relating to reference vessels.<br />
These results were in agreement with the chemical investigations of Fialho et al., 2010 [2]<br />
with the same samples. The results of the cited author showed that the compost L1 did not<br />
change its composition with respect to the starting material because it is a very fibrous<br />
material with high lignin content. Because of the decomposition of this material is hardy.<br />
<strong>Vol</strong>. 2 Page - 525 -
15th IHSS Meeting- <strong>Vol</strong>. 2<br />
In addition, studies focusing on fertility, growth and plant development in bio-active species,<br />
further analysis of the soil and control soil with application of different compounds, will<br />
allow verifying the different content of humic acids. According to Orlov, 1998 [4], the<br />
increased content of humic acids may be an indicator of improving soil humus quality; or<br />
biological activity increase promoting the synthesis of more condensed humic substances.<br />
5.0<br />
(a)<br />
L1-30<br />
Reference<br />
Commercial<br />
L1 and L4<br />
L2 and L3<br />
0.6<br />
(b)<br />
P Zn<br />
Cu<br />
PC2 (21%)<br />
2.5<br />
0.0<br />
-2.5<br />
C<br />
L3-30<br />
C<br />
C<br />
L3-30 L1-30<br />
L1-30<br />
L3-30<br />
L3-15<br />
L4-30<br />
L3-15<br />
L2-15<br />
L2-15<br />
L3-15 L2-15<br />
L2-30<br />
L1-15<br />
L4-15 L4-5<br />
L3-5 L3-5 L1-15<br />
L4-15<br />
L3-5<br />
L2-30<br />
L4-30<br />
L2-30<br />
L2-5<br />
L4-5L1-15<br />
L1-5<br />
L2-5<br />
L4-30<br />
L1-5<br />
L4-5<br />
L4-15 L1-5<br />
L2-5<br />
PC2 (21%)<br />
0.3<br />
0.0<br />
-0.3<br />
K<br />
Mn<br />
N<br />
Fe<br />
Ca<br />
Mg<br />
-4 -2 0 2 4<br />
PC1 (28%)<br />
-0.6<br />
-0.6 -0.3 0.0 0.3 0.6<br />
PC1 (28%)<br />
Figure 1: Principal Component Analysis: Score (a) and loading plots (b) for the data matrix, with 42<br />
samples and 9 variables<br />
4. Conclusions<br />
The results of the analysis of fertility of plants using a computational resource/chemometric<br />
called Principal Component Analysis (PCA), and the experimental observations showed that<br />
the L2 and L3 treatments showed greater similarity to the treatment with mineral fertilizer,<br />
bringing greater benefits than the other (L1 and L4) when applied to the soil in question,<br />
regardless of the amount applied. These results agree to the former chemical and<br />
spectroscopic analyses made by Fialho in our research group [2].<br />
Acknowledgements<br />
Authors are grateful to Embrapa Agricultural Inst<strong>ru</strong>mentation Center and Embrapa Cattle<br />
Southeast Center for infrast<strong>ru</strong>cture; and CNPq for financial support. Authors thank also to<br />
“Laboratório de Biogeoquímica e Nutrição de Plantas” of UFPR for multi-elemental analyses.<br />
References<br />
1. Rodrigues, M. S.; da Silva, F., C.; Barreira, L., P.; Kovacs, A. Compostagem: Reciclegem de<br />
Resíduos Sólidos Orgânicos. In: Gestão de Resíduos na Agricultura e Agroindústria. Botucatu,<br />
FEPAF/Unesp, 2006. p. 64.<br />
2. Fialho, L. L.; da Silva, W., T., L.; Milori, D., M., B., P.; Simões, M., L.; Martin-Neto, L.<br />
Characterization of organic matter from composting of different residues by physicochemical and<br />
spectroscopic methods. Biores. Technol., 101, 1927–1934, 2010.<br />
3. Wold, S.; Esbensen, K.; Geladi, P., Principal Component Analysis, Chemom. Intell. Lab. Syst.<br />
1987, 2, 37.<br />
4. Orlov, D. S. Organic substances of Russian soils. Euras.Soil Sci., Moscow, 31, 946- 953, 1998.<br />
<strong>Vol</strong>. 2 Page - 526 -
15th IHSS Meeting- <strong>Vol</strong>. 2<br />
Evolution of Humic-Like Fractions After Application of Co-Composted<br />
Sewage Sludge to Four Mediterranean Agricultural Soils.<br />
A Soil Microcosm Experiment<br />
Pérez-Lomas A.L. a , Aranda V. b* , Párraga J. a , Delgado R. a , Almendros G. c , Delgado G. a<br />
a Department of Soil Science and Agricultural Chemistry, University of Granada, Spain;<br />
b Department of Geology, University of Jaén, Spain; c CCMA-CSIC, Spain.<br />
E-mail: varanda@ujaen.es<br />
1. Introduction<br />
The sewage sludge production in Spain was 1.012.157 Mg in 2003<br />
(http://wastebase.eionet.eu.int/); one of the practices for recycling sewage sludge is<br />
composting for subsequent use as agricultural amendment. The production of co-compost<br />
(i.e., sewage sludge transformed with woody plant waste from tree p<strong>ru</strong>ning as bulking<br />
st<strong>ru</strong>cturing agent) involves the recycling of residues, leading to organic matter which,<br />
compared to the original waste, behaves as a more stable (aerobic fermentation), more<br />
beneficial (matured organic matter) and value-added substrate. The amendment of soil with<br />
compost is an environmentally-friendly option for organic farming in Southern Spain soils,<br />
where there are large areas of degraded soils with high summer temperatures, low rainfall and<br />
inappropriate agricultural management. The organic amendment contributes to enhanced soil<br />
fertility and further crop development, thus producing both economic and environmental<br />
benefits [1].<br />
Following the application of compost to soil, microbial communities are able to degrade the<br />
organic matter by mineralization or to modify the organic matter by humification, depending<br />
on the local climate [2]. Hence, it is necessary to study the transformation of soil organic<br />
carbon (SOC) after the soil amendment with composts; the total amount of SOC content<br />
ought not be used as the sole indicator of the improvement in soil quality of agricultural soils<br />
[3], other indicators such as the concentration and chemical nature of humic-like substances<br />
are required in order to provide accurate information [1, 4]. Therefore, parameters as humic<br />
acids (HA), fulvic acids (FA), HA/FA ratio or E 4 and E 4 /E 6 parameters (whose increase and<br />
decrease, respectively, indicate a maturation process [4]), show us the real process of organic<br />
matter transformation.<br />
The effect of co-compost from sewage sludge and plant p<strong>ru</strong>ning remain was studied in soil<br />
microcosm conditions and using a 2 3 factorial design. This experimental design involves the<br />
analysis of a classic under-researched topic [5], the relationship between four factors, in this<br />
<strong>Vol</strong>. 2 Page - 527 -
15th IHSS Meeting- <strong>Vol</strong>. 2<br />
case: soil type, addition of co-compost, time and temperature of incubation. This paper<br />
focuses both on the quantitative evolution of the different organic matter fractions, as well as<br />
on some qualitative properties of the resulting HA-like substances.<br />
2. Materials and Methods<br />
Soil samples were collected from the topsoil (0–20 cm) of four Andalusian soils under<br />
Mediterranean climate: Two soils, S1 and S2, are typical for growing olive trees, located in<br />
Jaén (Spain) whereas the other two, S3 and S4, are used for tropical crops on the coast of<br />
Granada (Spain). The soils were air-dried and screened (2 mm diameter). The co-compost<br />
used was manufactured by Biomasa del Guadalquivir, SA (Santa Fé, Granada, Spain). Sludge<br />
from treatment plants in Granada and Motril (Granada) was air-dried, mixed with chopped<br />
remains of plant p<strong>ru</strong>ning (mainly olive and pine) in 1:1 (v:v) and placed in stacks of about 3–<br />
4 m high, turning regularly to prevent anaerobic processes. The co-compost with 10–11<br />
months of maturation was air-dried and sieved (2 mm-holes).<br />
A series of polyvinylchloride containers, of 1.2 L capacity, with a basal filtering layer (ca. 100<br />
g) of acid-washed sea sand, were used as described [6]. The containers were filled with<br />
unamended or amended (140 Mg ha -1 ) soil materials (equivalent to 5.6 g of co-compost 100 g<br />
soil -1 ). The dose used is the highest recommended (http://www.epa.gov, 2005). The<br />
microcosms were incubated at 5 °C (refrigerated chamber) or 35 ºC (oven) for 90 days. The<br />
moisture of the microcosms was kept at values close to field capacity, using hygrometers<br />
(COPERSA ® ).<br />
The standard analyses were determined according to the Soil Conservation Service (1972).<br />
The sequential fractionation procedure for organic matter was similar to that used by [5].<br />
Eight soil samples were tested against three factors at two different levels (2 3 factorial design):<br />
0 days incubation (t-) or 90 days (t+), temperature, 5 ºC (T-) or 35 ºC (T+) and doses of cocompost,<br />
0 Mg ha -1 (c-) or 140 Mg ha -1 (c+). The effects and interactions between factors<br />
were considered to be significant when various criteria, described by [7], coincided.<br />
3. Results and Discussion<br />
The sampled soils are different, including genetic characters, as reflected in Table 1. The soils<br />
showed some common characters, such as the relatively low content of soil organic matter,<br />
the exchange complex dominated by Ca 2+ (not shown) and the slightly basic pH.<br />
<strong>Vol</strong>. 2 Page - 528 -
15th IHSS Meeting- <strong>Vol</strong>. 2<br />
Soil S1 is a relatively evolved<br />
Table 1: Analytical values of soils (arable layer) and co-compost<br />
soil [Hypocalcic Luvic<br />
Characteristics Units Soil 1 Soil 2 Soil 3 Soil 4 Co-compost<br />
Sand (%) 31.0 15.0 27.4 19.2 19.2<br />
Calcisol (Siltic, Chromic)],<br />
Texture Silt (%) 28.5 39.2 56.9 48.2 48.2<br />
rich in iron oxides (reflected<br />
Clay (%) 40.5 45.8 15.7 32.6 32.6<br />
Organic matter (%) 2,58 1.19 1.98 3.08 35.3 by its red colour, 5YR). Soil<br />
Nitrogen (%) 0.30 0.11 0.13 0.21 2.2<br />
C/N 5,00 6.29 8.86 8.53 9.33 S2 is a soil from eroded<br />
Available P (mg kg -1 ) 13.2 3.0 21.2 81.4 3074.2<br />
materials [Calcaric Regosols<br />
pH 8.6 8.0 8.3 8.0 7.7<br />
E.C. 25ºC S m -1 0.5 0.5 4.0 4.0 9.0 (Siltic)], soil S3 is an alluvial<br />
Exchangeable bases cmol (+) kg -1 47.47 59.71 46.25 37.56 50.27<br />
CEC cmol (+) kg -1 31.52 28.91 27.68 27.21 46.35 soil [Epigleyic Fluvisol<br />
(Calcaric, Hypereutric)] and soil S4 is a man-made soil built in terraces [although classified as Haplic<br />
Regosols (Calcaric, Hypereutric)]. The co-compost (Table 1) showed a percentage of soil organic<br />
matter (35.3 g 100 g -1 ) slightly higher than that required for commercial compost [2]. N (2.2%), pH<br />
(7.7), C/N (9.3), available phospho<strong>ru</strong>s (3.1 mg kg -1 ) and exchangeable bases were similar to [2, 4].<br />
Evolution of SOC fractions: Figure 1 shows the evolution of soil fractions. A 2 3 factor analysis was<br />
carried out to quantify the effects of the factors analyzed: incubation (t), temperature (T), co-compost<br />
amendment (c) and the interactions: “t×T”, “t×c”, “T×c” (Table 2), on soil organic fractions.<br />
The incubation in the microcosm is associated generally with mineralization of the SOC, since it lead<br />
to a significant decrease (t, Table 2). In our experiments, the mineralization is higher in the soil with<br />
larger amounts of SOC (S1 and S4) and in the amended soils (t×c interaction, Table 2), what is in<br />
agreement with [8]. The higher temperature (35 ºC), as reported by [9], increases the mineralization of<br />
SOC (factor T and t×T interaction, Table 2).<br />
With regard to the evolution of HA and FA, two trends were observed: one for S1 and S3, and the<br />
other for S2 and S4. The HA of soils S1 and S3, both unamended and amended, are degraded in the<br />
course of the incubation in the microcosm (factor t, Table 2). Similar degradation of HA after compost<br />
addition was described by [4] in field studies. A higher temperature increased the degradation of HA<br />
in S1 (unamended and amended) and in amended S3 (T, t×T or T×c, Table 2). The lower temperature,<br />
in contrast, limits the degradation of HA, as indicated by [10]. We deduced from Fig. 1 that<br />
unamended S3 shows a slight increase in the amount of HA associated with incubation at high<br />
temperature, although these data are not significant (Table 2); this particular increase is concomitant to<br />
the increase in E 4 (arrow A, Figure 3).<br />
Fulvic acid in unamended S1 (t, Table 2) and in unamended and amended S3 (t and t×c, Table 2),<br />
decreased in amount with incubation in the microcosm, to a greater extent than HA, and HA/FA ratio<br />
increased during incubation (t, Table 2). Similar findings were described in [4].<br />
<strong>Vol</strong>. 2 Page - 529 -
% Soil Organic Carbon<br />
3,00<br />
2,50<br />
2,00<br />
1,50<br />
1,00<br />
0,50<br />
0,00<br />
Other organic fractions Fulvic acid Humic acid<br />
5º 35º 5º 35º 5º 35º 5º 35º 5º 35º 5º 35º 5º 35º 5º 35º<br />
To 90 days To 90 days To 90 days To 90 days To 90 days To 90 days To 90 days To 90 days<br />
Amended S1, in contrast,<br />
showed an increase of FA with<br />
incubation (t×c, Table 2). The<br />
higher temperature also<br />
increased the content of FA of<br />
S1 (unamended and amended) (T<br />
0 t/ha 140 t/ha 0 t/ha 140 t/ha 0 t/ha 140 t/ha 0 t/ha 140 t/ha and t×T, Table 2); both increases<br />
Soil S1 Soil S2 Soil S3 Soil S4<br />
of FA could be interpreted as a<br />
Figure 1: Quantitative distribution of soil C in humic & fulvic acids (To, 5<br />
ºC similar to 35 ºC).<br />
degradation of more complex<br />
macromolecular st<strong>ru</strong>ctures within the co-compost, namely the HA-like colloidal fraction [5]; although<br />
we consider probable that FAs establish links with iron oxides of this soil (S1), process described by<br />
[11], which avoids FA degradation. On the contrary, S3 (unamended and amended) showed a decline<br />
in FA associated with the increase of temperature (T and t×T, Table 2). The effect of the high<br />
temperature is concomitant with the decrease of the HA/FA ratio; only unamended S3 showed<br />
increased HA/FA ratio, due to the HA increase, before discussed.<br />
Soil 1<br />
Soil 2<br />
Soil 3<br />
Soil 4<br />
Table 2: Main effects and interactions between factors influencing the evolution of soil organic matter<br />
Main factors<br />
Two-factor<br />
Statistical data<br />
t T c<br />
i<br />
t × T<br />
i<br />
t × c T × c Average r 2 (%) DW<br />
SOC -0.26 -0.14 0.63 -0.14 -0.13 Ns 1.756 99.3 1.75<br />
HA -0.05 -0.01 0.05 -0.01 -0.03 Ns 0.34 97.5 1.75<br />
FA -0.03 0.01 0.17 0.01 0.03 Ns 0.24 99.8 3.15<br />
HA/FA 0.23 -0.18 -0.98 -0.18 -0.45 Ns 1.61 99.4 1.75<br />
SOC -0.18 -0.01 0.67 -0.01 -0.13 Ns 1.00 99.9 2.50<br />
HA 0.03 -0.02 0.09 -0.02 Ns -0.02 0.07 95.7 1.49<br />
FA -0.05 -0.01 0.10 -0.01 -0.05 Ns 0.07 95.1 2.50<br />
HA/FA 1.13 0.32 -1.36 0.32 0.45 Ns 2.23 83.1 2.50*<br />
SOC -0.15 -0.01 0.61 -0.01 -0.17 Ns 1.46 99.9 1.50<br />
HA -0.01 Ns 0.16 Ns Ns -0.02 0.23 98.5 1.67<br />
FA -0.03 -0.02 0.08 -0.02 -0.06 Ns 0.18 97.4 1.50<br />
HA/FA 0.16 Ns 0.31 Ns 0.38 -0.18 1.31 83.0 2.14<br />
SOC -0.26 -0.02 0.57 -0.02 -0.17 Ns 2.03 99.9 1.25*<br />
HA 0.02 Ns 0.07 Ns Ns 0.01 0.33 98.1 1.06*<br />
FA -0.21 -0.05 0.10 -0.045 Ns Ns 0.29 93.9 1.41<br />
HA/FA 1.17 0.41 Ns 0.41 Ns 0.37 1.40 92.7 1.09*<br />
Figure 2: Spectroscopic data of humic acids<br />
Relative units<br />
7,00<br />
6,00<br />
5,00<br />
4,00<br />
3,00<br />
2,00<br />
1,00<br />
0,00<br />
Ratio E4/E6<br />
E4<br />
C<br />
5º 35º 5º 35º 5º 35º 5º 35º 5º 35º 5º 35º 5º 35º 5º 35º<br />
0 days 90 days 0 days 90 days 0 days 90 days 0 days 90 days 0 days 90 days 0 days 90 days 0 days 90 days 0 days 90 days<br />
0 t/ha 140 t/ha 0 t/ha 140 t/ha 0 t/ha 140 t/ha 0 t/ha 140 t/ha<br />
Compost Soil S1 Soil S2 Soil S3 Soil S4<br />
B<br />
15th IHSS Meeting- <strong>Vol</strong>. 2<br />
A<br />
t: time of incubation; T:<br />
temperature of incubation;<br />
c: co-compost application ;<br />
SOC: Soil organic carbon;<br />
HA: Humic acid; FA:<br />
Fulvic acid; DW: Durbin-<br />
Watson coefficient. ns: not<br />
significant; ND: not<br />
determined. *not<br />
significant, but showing a<br />
trend.<br />
Soils S2 and S4 (unamended,<br />
amended) showed, mainly at<br />
high temperature incubation,<br />
changes resembling to<br />
humification: We note an<br />
increase of the HA content in<br />
relation to FA, mainly<br />
observed in the HA/FA ratio (t,<br />
T, t×c and T×c, Table 2) (higher than in S1 and S3), and an increase of the E 4 (arrow B, Figure 3). The<br />
beneficial effect of high temperature on the formation of of HA has also been reported by [12] after invitro<br />
studies. The concentration of FA, on the other hand, decreases with incubation and with<br />
C<br />
B<br />
<strong>Vol</strong>. 2 Page - 530 -
15th IHSS Meeting- <strong>Vol</strong>. 2<br />
increased temperature, both in unamended and amended soils (t and T, Table 2). On the other hand, S2<br />
soil, mainly amended, showed a slight HA degradation at 35 ºC (T, t×T and T×c, Table 2). Therefore,<br />
S2, mainly amended, developed both humification and mineralization processes at high temperature,<br />
whereas at low temperature both processes were hampered (Fig. 1).<br />
4. Conclusions<br />
The evolution of unamended soils, associated with incubation and high temperature, generally exert<br />
two processes: A SOC mineralization associated mainly with soil with comparatively higher SOC<br />
content, and a simultaneous process of humification; the latter leads to the formation of HA as well as<br />
HA/FA ratio and E 4 (arrows A and C, Figure 3) increase. Only unamended soil S1 shows a significant<br />
increase of FA with higher temperature. SOC mineralization increased significantly with co-compost<br />
addition. However, the effect of co-compost addition is influenced by various factors including soil<br />
type and temperature: Soils S2 and S4 (amended), at the higher temperature of incubation, increase the<br />
rates of mineralization (decrease of SOC), concomitant to a humification process (relative increase of<br />
HA, increase of HA/FA ratio and E 4 and decreased E 4 /E 6 ), improving soil properties and contributing<br />
to soil carbon sequestration; whereas lower temperatures limited both processes. Otherwise, in soils S1<br />
and S3 (amended), the higher temperature favoured mineralization but not humification, whereas the<br />
low temperature maintained the SOC levels and even increased the HA/FA ratio (T and T×c, Table 2).<br />
In general, the response of the different soils studied, in relation to the addition of co-compost and the<br />
incubation at different temperatures, is strongly influenced by the characteristics of the original soil.<br />
Therefore, any recommendation on the addition of co-compost to soils should take into account this<br />
dependence of the native substrate. Similar conclusion is described in [8]. In soils with low SOC levels<br />
(S2 and S3), the addition of co-compost led to greater changes than in richer soils (S1 and S4) and the<br />
first type of soils needs more strict amendment control. The conclusions from our tests are limited to<br />
experimental conditions, which is a first step towards predicting its evolution under field conditions.<br />
Acknowledgements: We thank to MICINN of Spain for Project CGL2008-04456/BTE<br />
References<br />
1. G. B<strong>ru</strong>netti, C. Plaza, C.E. Clapp and N. Senesi, Soil Biol. Biochem., 39 (2007) 1355.<br />
2. J. Moreno-Casco and R. Moral-Herrero, Compostaje, Ediciones Mundi-Prensa, Madrid, 2008.<br />
3. G. Almendros, in R. Quintero-Lizaola et al. (Eds.), La Edafología y sus Perspectivas al Siglo XXI,<br />
U.N.A.M., 2000.<br />
4. J.M. Fernández, D. Hernández, C. Plaza and A. Polo, Sci. Total Environ., 378 (2007) 75.<br />
5. M.C. Zancada, G. Almendros, J. Sanz and R. Román, Waste Manage. Res., 22 (2004) 24.<br />
6. R. Sonnleitner, E. Lorbeer and F. Schinner, Appl. Soil Ecol., 22 (2003) 195.<br />
7. G. Almendros, Sci. Total Environ., 81/82 (1989) 569.<br />
8. R.R. Busby, H.A. Torberth and D.L. Gebhart, Soil Biol. Biochem., 39 (2007) 1277.<br />
9. A.J. Franzluebbers, R.L. Haney, C.W. Honeycutt, M.A. Arshad, H.H. Schomberg and F.M. Hons, Soil Biol.<br />
Biochem., 33 (2001) 1103.<br />
10. R. Madrid, M. Valverde, I. Guillen, A. Sánchez and A. Lax, J. Plant Nut. Soil Sci., 167 (2004) 39.<br />
11. Q. Fu and H. Quan, Chemosphere, 63 (2006) 403.<br />
12. E. Contreras, E. Leal and M. Martínez, Revista Técnica de la Facultad de Ingeniería Universidad de Zulia,<br />
27 (2004) 114.<br />
<strong>Vol</strong>. 2 Page - 531 -
15th IHSS Meeting- <strong>Vol</strong>. 2<br />
Rhizosphere and Exogenous Organic Matter Effects on Biological<br />
Indicators of Soil Quality<br />
Beatriz Moreno Sánchez*, Rosa Cañizares González, Emilio Benítez León<br />
Departamento de Protección Ambiental, Estación Experimental del Zaidín (EEZ), CSIC,<br />
Profesor Albareda 1, 18008 Granada<br />
E-mail: beatriz.moreno@eez.csic.es<br />
1. Introduction<br />
In this work, we used two plants, Medicago sativa L. and Dittricchia viscosa L., and a<br />
biostimulation method based on the use of an olive waste vermicompost, to test the separate<br />
and combine effects of an organic amendment and rhizosphere on soil quality indicators.<br />
Enzyme activities, in association with other microbial parameters such as bacterial biomass<br />
and soil bacterial community st<strong>ru</strong>cture have been previously postulated as predictors of<br />
change in soil quality [1], and their combination in sun-ray diagrams has been proposed as a<br />
graphic and comprehensive indicator in this sense [2, 3]. In this study, we create sun-ray plots<br />
with the following microbial parameters: dehydrogenase, β-glucosidase, diphenol oxidase,<br />
phosphatase, urease and diphenol-oxidase activities and bacterial biomass. In addition, soil<br />
bacterial community st<strong>ru</strong>cture via PCR-DGGE was determined.<br />
2. Materials and Methods<br />
The soil used for this study was a calcareous loam soil. Three different sets of samples were<br />
prepared: a) Soil amended with vermicompost from olive-mill waste (V) to reach a soil<br />
organic-carbon content of 30 g dry wt kg -1 . b) Soil planted with Medicago sativa L. or<br />
Dittrichia viscosa L. (M and D) c) Soil with vermicompost and one of the two target plants<br />
(MV and DV). Un-amended and unplanted soil (C) was the control. Soils were incubated for<br />
12 weeks at 25 ºC and at 60% of their water holding capacity.<br />
Enzymes activities: Dehydrogenase, o-diphenoloxidase, urease, β-glucosidase and<br />
phosphatase activities were determined according to von Mersi and Schinner [4] modified by<br />
Garcia et al. [5], Pe<strong>ru</strong>cci et al. [6], Nannipieri et al. [7] and Tabatabai and Bremner [8],<br />
respectively.<br />
Soil-DNA extraction and PCR-DGGE analysis: The DNA extraction, PCR programs and<br />
DGGE analyses were conducted as described Vivas et al. [9].<br />
Real-time PCR assay: Bacterial biomass was determined by Real-time PCR according to<br />
Vivas et al. [9]. The real-time values were calculated as described Quian et al. [10].<br />
<strong>Vol</strong>. 2 Page - 532 -
15th IHSS Meeting- <strong>Vol</strong>. 2<br />
Data analyses: Data were subjected to analysis of variance using the program STATISTICA<br />
(StatSoft Inc., USA). Sun-ray plots [11] were const<strong>ru</strong>cted to show graphically the enzymes<br />
activities and the bacterial biomass of the different treatments. The DGGE band patterns in<br />
different treatments were compared with the UVImap Analysis software (UVitec Limited,<br />
UK). DGGE banding data were used to estimate the Raup and Crick’s probability-based index<br />
of similarity S RC [12]. Cluster analyses based on these indexes were created using the PAST<br />
program [13].<br />
3. Results and Discussion<br />
β-glucosidase and phosphatase activities increased where vermicompost from olive-mill<br />
waste was applied (V), especially when the amendment was present in interaction with plants<br />
(MV and DV). Probably this effect could be due to available organic matter and organic<br />
phosphate compounds released from vermicompost. Urease activity was significantly higher<br />
in amended and planted soils (MV and DV).<br />
Both plants decreased dramatically the bacterial population size of soils (M and D). This<br />
effect disappeared when vermicompost was present, especially in association with D. viscosa<br />
(DV), where an important increase of the overall microbial activity was also reported. The<br />
trend can be easily observed in view of the sun-rays diagrams (Figure 1). Both plants showed<br />
smaller areas than the control soil suggesting that soil quality was not improved in these<br />
treatments. Nevertheless, the areas increased when vermicompost and plants were combined<br />
(MV and DV) mainly because of the high biochemical activity displayed by the organic<br />
amendment. Particularly notable was the interaction between vermicompost and D. viscosa<br />
(DV), where the bacterial population size and microbial and biochemical activity improved.<br />
As a result an area of sun-ray plot roughly three times higher than unamended and unplanted<br />
soil (C) was noticed.<br />
To test whether the similarities observed within and between samples were stronger or weaker<br />
than would be expected by chance, band-matching data was analyzed using Raup and Crick’s<br />
probability-based index of similarity S RC . The S RC values found by comparing the treatments<br />
and the cluster analyses based on them are illustrated in Figure 2. The created S RC cluster<br />
evidenced two clear groups of soils, planted soils (M, MV, D and DV) and unplanted soils (C<br />
and V), were amended or not. Similarities found between these treatments (C-V, M-MV, D-<br />
DV) were significant (S RC >0.95). These facts indicated that the dose of vermicompost applied<br />
was not enough to modify the soil bacterial community st<strong>ru</strong>cture. Previous authors have<br />
evidenced that the microbial community develop in a soil is affected by the specie of plant<br />
<strong>Vol</strong>. 2 Page - 533 -
15th IHSS Meeting- <strong>Vol</strong>. 2<br />
used [14, 15] due to the fact that there are species-specific characteristics of the plants that<br />
influence the microbial community associated with their roots [16].<br />
In the comparison of all treatments to each other, the similarity was no greater than expected<br />
by chance (0.95>S RC >0.05) and we cannot affirm that these samples had dissimilar bacterial<br />
st<strong>ru</strong>cture, even though D. viscosa with vermicompost treatment cluster separately from the<br />
rest. This result is according to the biochemical and microbial estimations obtained for D.<br />
viscosa with vermicompost treatment, indicating that it was the most dissimilar to the rest.<br />
Figure 1: Sun-ray Plots. Data have been harmonized in order to be assembled in a single plot per<br />
treatment. Significant differences are indicated by different letters (P < 0.05).<br />
S1 S2 S+ALF1 S+ALF2 S+OLI1 S+OLI2 S+VC1 S+VC2 S+VC+ALF1 S+VC+ALF2 S+VC+OLI1<br />
S2 1<br />
S+ALF1 0,65 0,6345<br />
S+ALF2 0,646 0,655 1<br />
S+OLI1 0,7475 0,7685 0,999 1<br />
S+OLI2 0,7655 0,742 0,9995 0,9995 1<br />
S+VC1 0,99 0,9895 0,6985 0,699 0,662 0,642<br />
S+VC2 0,992 0,991 0,7135 0,7065 0,656 0,6455 1<br />
S+VC+ALF1 0,749 0,7585 1 1 1 1 0,804 0,825<br />
S+VC+ALF2 0,758 0,7665 1 1 1 1 0,8195 0,8135 1<br />
S+VC+OLI1 0,1795 0,1795 0,7885 0,7855 0,9625 0,9615 0,154 0,166 0,9085 0,905<br />
S+VC+OLI2 0,1915 0,193 0,766 0,785 0,9595 0,9645 0,176 0,158 0,9055 0,9045 1<br />
Similarity<br />
0,95<br />
0,9<br />
0,85<br />
0,8<br />
0,75<br />
0,7<br />
0,65<br />
0,6<br />
0,55<br />
0 1,6 3,2 4,8 6,4 8 9,6 11,2 12,8<br />
M1<br />
D2<br />
M1<br />
M2<br />
D1<br />
MV2<br />
DV1<br />
DV2<br />
V1<br />
V2<br />
C2<br />
C1<br />
Figure 2: Raup and Crick probability-based index<br />
of similarity cluster analyses and similarity<br />
values (S RC ) for DGGE profiles.<br />
<strong>Vol</strong>. 2 Page - 534 -
15th IHSS Meeting- <strong>Vol</strong>. 2<br />
4. Conclusions<br />
D. viscosa and M. sativa modified the soil bacterial community st<strong>ru</strong>cture and reduced<br />
microbial and biochemical activity after three months. The dose of vermicompost was<br />
insufficient to modified the natural characteristics of the soil. However, these last produced a<br />
biostimulant effect and consequently soil quality improved. The proposed indexes could be<br />
feasible indicators of the health soil state.<br />
Acknowledgements<br />
This work has been financed by MICINN through projects REN2003-05359 and CGL2006-<br />
05437.<br />
References<br />
1. N.M. Nielsen, A. Winding, S. Binne<strong>ru</strong>p, B.M. Hansen, N. Kroer, Microorganisms as Indicators of<br />
Soil Health National Environmental Research Institute (NERI). Denmark, 2002, Technical<br />
Report No. 388.<br />
2. Moreno, S. Garcia-Rodriguez, R. Cañizares, J. Castro, E. Benitez, Agr. Ecosyst. Environ., 131<br />
(2009) 333.<br />
3. M. Schloter, O. Dilly, J.C. Munch, Agr. Ecosyst. Environ., 98 (2003) 255.<br />
4. W. von Mersi, F. Schinner, Biol Fert Soil., 11 (1991) 216.<br />
5. C. Garcia, T. Hernandez, F. Costa, Commun. Soil Sci. Plant, 28 (1997) 123<br />
6. P. Pe<strong>ru</strong>cci, C. Casucci, D. Dumonet, Soil Biol. Biochem., 32 (2000) 1927.<br />
7. P. Nannipieri, B. Ceccanti, S. Cervelli, E. Matarese, Soil Sci. Soc. Am. J., 44 (1980) 1011.<br />
8. M.A. Tabatabai, J.M. Bremner, Soil Biol. Biochem., 1 (1969) 301.<br />
9. Vivas, B. Moreno, S. Garcia-Rodriguez, E. Benitez, Bioresource Technol., 100 (2009) 1319.<br />
10. H. Quian, B. Hu, D. Cao, W. Chen, X Xu, Y Lu, B. Environ. Contam. Tox.,78 (2007) 239.<br />
11. Dilly, H.P. Blume, Adv. GeoEcol., 31 (1998) 121.<br />
12. D. Raup, R.E. Crick, J. Paleontol., 53 (1979) 1213.<br />
13. Ø. Hammer, D.A.T. Harper, P.D. Ryan, Palaeontologia Electronica, 4 (2001) 9.<br />
14. P. Marschner, C-H. Yang, R. Liebere and D.E. Crowley, Soil Biol. Biochem., 33 (2001) 1437.<br />
15. J.L. Kirk, J.N. Klironomos, H. Lee, J.T. Trevors, Environ. Pollut., 133 (2005) 455.<br />
16. B.T. Walton, T.A. Anderson, Appl. Environ. Microbiol., 56 (1990) 1012.<br />
<strong>Vol</strong>. 2 Page - 535 -
15th IHSS Meeting- <strong>Vol</strong>. 2<br />
Effects of cattle manure and sewage sludge on the transformation of soil<br />
organic matter<br />
1. Introduction<br />
Izabella Pisarek, Mariusz Głowacki<br />
Opole University, Department of Land Protection, 22 Oleska St., 45-052 Opole,<br />
Poland<br />
E-mail: izapis@uni.opole.pl; marglo@uni.opole.pl<br />
Soil organic matter (SOM) plays an important role in maintaining soil quality. The reduction<br />
of SOM, especially humic substances (HS), frequently observed in studies of soils, constitutes<br />
a significant indicator of soil degradation [1, 2, 3, 4]. Supplementing the soil with organic<br />
matter is therefore necessary. Many types of organic substances: organic wastes, sewage<br />
sludge, composts and natural fertilizers are used for this purpose. Its nutritional components<br />
can be utilized by cultivated plants and its organic matter can improve the balance of HS in<br />
soils. Rates of organic matter transformation depend upon several factors, ranging from the<br />
type of organic substances input to the soil, the soil type and its properties, the climatic<br />
conditions and land management practices [2, 4]. The fitting of kinetic equations to<br />
transformation, including decomposition curves allows the calculation of the potentially<br />
process of carbon mineralization and HS creation, or its rate.<br />
The goal of this study was to verify whether the application of two different organic materials<br />
(sewage sludge and cattle manure) in different doses efficiently promotes organic matter<br />
transformation in Cambisol under agriculture use.<br />
2. Materials and Methods<br />
Soil. The investigated soil is on arable lands in Głubczyce Tableland and represent Cambisol<br />
developed from silts clay. Used soil there were. The characteristics of used soil (before the<br />
experiment was started) are given in Table 1. The soil samples were taken for analysis every 6<br />
months, together for 42 months.<br />
Table 1: Some properties of A horizon (0-30 cm) used soil<br />
pH KCl particles (%) OM (%) C total N total C/N<br />
15th IHSS Meeting- <strong>Vol</strong>. 2<br />
Used organic material. Two organic material were used for the experiment: sewage sludge<br />
from The Sewage Treatment Plant of Opole (was stored for 12 years on the sludge pond) and<br />
cattle manure from a farm of Głubczyce. The properties of sewage sludge and cattle manure<br />
are given in Table 2.<br />
Table 2: Some properties of organic materials<br />
Material pH H2O d.m. OM C total N total C/N<br />
(%) g·kg -1<br />
Salinity<br />
gKCl⋅kg -1<br />
Sewage<br />
sludge<br />
Cattle<br />
manure<br />
6,8 24,0 27,56 163,9 11,8 13,9 6,00<br />
8,3 26,8 61,70 356,1 22,5 15,8 12,30<br />
Experimental treatments. The experiments were performed as 42 months field study by the<br />
random plots on the arable lands. The experiments consists of 20 plots in 5 combination and 4<br />
replication.<br />
Table 3: Scheme of experiment<br />
Treatment<br />
SS 30<br />
SS 50<br />
SS 80<br />
CM<br />
C<br />
Combinations<br />
Soil + 30 Mg·ha -1 of sewage sludge<br />
Soil + 50 Mg·ha -1 of sewage sludge<br />
Soil + 80 Mg·ha -1 of sewage sludge<br />
Soil + 30 Mg·ha -1 of cattle manure<br />
Control<br />
Analysis. The following parameters were determined in soil samples (in particles
15th IHSS Meeting- <strong>Vol</strong>. 2<br />
Data calculation. The kinetic functions used for first – order graphic kinetic model:<br />
where: log C = log C 0 - t, where C – final concentration, C 0 – initial concentration, K1 –<br />
the rapid rate constants.<br />
Analysis of variance (V in %) and LSD at p < 0,05 were calculated to compare the different<br />
treatments as regards organic matter transformation.<br />
3. Results and Discussion<br />
After application of organic materials, higher concentration of organic carbon was determined<br />
at the experimental objects. It was confirmed by the variance analysis for total carbon<br />
concentration (LSD = 1,1). The study showed that addition of organic material increase the<br />
transformation (decomposition) rate of organic matter (Fig.1). The kinetic equations showed<br />
also increase of the rapid rate constants of SOM decomposition after organic material<br />
application (highest with 80 Mg·ha -1 of sewage sludge addition, K1 = 2,0 months). These<br />
results were consistent with research of Pedra et. al. [2]. Fractional composition of SOM<br />
showed significant differences between combination and variation of carbon content in<br />
analyzed fractions.<br />
Figure 1: Organic carbon rate during experiment<br />
<strong>Vol</strong>. 2 Page - 538 -
15th IHSS Meeting- <strong>Vol</strong>. 2<br />
Figure 2: Influence of addition of sewage sludge and cattle manure on the humic – Ca complexes<br />
concentration (in % of % total carbon)<br />
Especially, the amount of humic compounds bounded with Ca increase after sewage sludge<br />
addition (Fig. 2). It showed differences in organic matter transformation in soil under<br />
experimental treatments. The total nitrogen concentration was proportional to doses of<br />
organic matter and varied similarly to the content of total carbon. After 6 months of organic<br />
material application C/N ratio dependent of doses of amendaments. In the following months<br />
of experiments C/N ratio was narrowest and range in initial time of experiment from 11,5 to<br />
9,5 in the final (at SS 80 plots). Although transformation of SOM especially decomposition,<br />
studies are numerous [1,2,3], the quantity and nature of the HS creation are interesting.<br />
4. Conclusions<br />
1. This study showed that addition of sewage sludge and cattle manure increase the rapid<br />
rate constants of SOM transformation.<br />
2. Optimal dose of organic material (which increased the amount of HS including HS<br />
bounded with Ca) was 80 Mg·ha -1 of sewage sludge.<br />
3. Single application of used organic materials improves content of HS and also<br />
accelerates its decomposition.<br />
References<br />
1. M.P. Bernal, M.A. Sanchez-Monedero, C. Paredes, A. Roig, Agriculture Ecoszstems and<br />
Environment, 69 (1998) 175 -189.<br />
2. F. Pedra, A. Polo, A. Ribeiro, H. Dominguus, Soil Biology and Biochemistry ,39 (2007) 1375 -<br />
1382.<br />
3. M. Klavins, Dipane J., K. Babre, Chemosphere, 44 (2001) 737 - 742.<br />
4. I. Pisarek, Humic Substances and Ecosystems. 5 (2003) 93-99.<br />
5. American Colloid company Procedure, No 3009 (1998).<br />
<strong>Vol</strong>. 2 Page - 539 -
15th IHSS Meeting- <strong>Vol</strong>. 2<br />
<strong>Vol</strong>. 2 Page - 540 -
ManyThankstoaloursponsors!