From Molecular Understanding to Innovative ... - Humus.ru
From Molecular Understanding to Innovative ... - Humus.ru
From Molecular Understanding to Innovative ... - Humus.ru

You also want an ePaper? Increase the reach of your titles
YUMPU automatically turns print PDFs into web optimized ePapers that Google loves.
Volume I<br />
<strong>From</strong> <strong>Molecular</strong> <strong>Understanding</strong><br />
<strong>to</strong> <strong>Innovative</strong> Applications<br />
of Humic Substances<br />
Proceedings of the 14 th International Meeting<br />
of the International Humic Substances Society<br />
Edi<strong>to</strong>rs<br />
Irina V. Perminova<br />
Natalia A. Kulikova<br />
September 14-19, 2008<br />
Moscow – Saint Petersburg<br />
Russia
Copy of this publication can be ordered at:<br />
Department of Chemistry<br />
Lomonosov Moscow State University<br />
Leninskie Gory 1-3<br />
119992 Moscow<br />
Russia<br />
E-mail: ihss@org.chem.msu.<strong>ru</strong><br />
Tel./Fax: +7(495)939-55-46<br />
(Attn: Dr. Irina Perminova)<br />
<strong>From</strong> <strong>Molecular</strong> <strong>Understanding</strong> <strong>to</strong> <strong>Innovative</strong> Applications of Humic<br />
Substances; Proceedings of the 14 th International Meeting of the International Humic<br />
Substances Society, September 14-19, 2008, Moscow – Saint Petersburg, Russia,<br />
Edi<strong>to</strong>rs: I. V. Perminova, N. A. Kulikova, Vol. II, <strong>Humus</strong> Sapiens, Moscow, 2008, 380 pp.
Dedication <strong>to</strong> the memory of Professor Dmitry S. Orlov<br />
This book is <strong>to</strong> commemorate the memory of Professor Dmitry Orlov, who was an<br />
outstanding Soviet/Russian scientist. Dmity Orlov contributed immensely in<strong>to</strong> development<br />
of humus chemistry. His works gave seeds <strong>to</strong> many contemporary ideas about genesis,<br />
st<strong>ru</strong>cture and functions of soil humic substances. Dmitry Orlov was a system-scientist. His<br />
fundamental work: “The general theory of humification” laid foundations <strong>to</strong> quantitative<br />
description of evolution of soil humic substances. He was a bright thinker and a great<br />
teacher. His books, thoughts, and pupils are the best memorial <strong>to</strong> his deal and spirit. We<br />
were fortunate <strong>to</strong> know him personally and hoped so much <strong>to</strong> give a chance <strong>to</strong> the<br />
international community <strong>to</strong> experience his <strong>to</strong>uch at the IHSS-14 conference in September<br />
2008. This was <strong>to</strong> be the first IHSS conference in Russia, and he inaugurated the<br />
conference by accepting an offer <strong>to</strong> become an honorable head of its scientific committee.<br />
To commemorate outstanding contribution and devotion of Professor Orlov <strong>to</strong> humic<br />
science, the scientific committee of the conference has decided <strong>to</strong> dedicate IHSS-14 <strong>to</strong> his<br />
name. Let his spirit be and live with us.<br />
Irina V. Perminova<br />
Сoordina<strong>to</strong>r of CIS-IHSS<br />
Co-Chair of the Organizing Committee<br />
of the IHSS-14 Meeting<br />
iii
Scientific Committee<br />
Orlov, Dmitry S. Lomonosov Moscow State University, Russia (Honorable Chairman)<br />
Abbt-Braun, Gud<strong>ru</strong>n, University of Karls<strong>ru</strong>he (TH), Germany<br />
Bloom, Paul, University of Minnesota, St. Paul, USA (President IHSS)<br />
Chen, Yona, The Hebrew University of Je<strong>ru</strong>salem, Rehovot, Israel<br />
Chukov, Serafim N., Saint Petersburg State University, Russia<br />
Clapp, C. Edward, USDA-ARS/University of Minnesota, St. Paul, USA<br />
Coates, John D., University of California, Berkeley, USA<br />
Cooper, William T., Florida State University, Tallahassee, USA<br />
Gjessing, Egil T., University of Oslo, Norway<br />
Frimmel, Fritz H., Universiy of Karls<strong>ru</strong>he (TH), Germany<br />
Fukushima, Masami, Hokkaido University, Hokkaido, Japan<br />
Hatcher, Patrick G., Ohio State University, Columbus, USA<br />
Hatfield, Kirk, University of Florida, Gainesville, USA<br />
Hertkorn, Norbert, Helmholtz Zent<strong>ru</strong>m Muenchen, Neuherberg, Germany<br />
Knicker, Heike, Technical University of Munich, Germany<br />
Koroleva, Olga V., Bach Institute of Biochemistry of RAS, Russia<br />
Martin-Ne<strong>to</strong>, Ladislau, Embrapa, Sao Carlos, Brazil<br />
Miyajima, Toh<strong>ru</strong>, Saga University, Japan<br />
De Nobili, Maria, University of Udine, Italy (Past President IHSS)<br />
Perdue, E. Michael, Georgia Institute of Technology, Atlanta, USA<br />
Perminova, Irina V. Lomonosov Moscow State University, Russia (Co-Chair)<br />
Senesi, Nicola, University of Bari, Italy<br />
Swift, Roger, University of Qeensland, Australia<br />
Tipping, Ed, Lancaster Environment Centre, UK<br />
Tombacz, Etelka, University of Szeged, Hungary<br />
Twardowska, Irena, Institute of Environmental Engineering of PAS, Zabrze, Poland<br />
Schmitt-Kopplin, Philippe, Helmholtz Zent<strong>ru</strong>m Muenchen, Neuherberg, Germany<br />
Weber, Jerzy, Agricultural University of Wroclaw, Poland<br />
(Co-Chair, Vice-President IHSS)<br />
iv
Organizing Committee<br />
Lunin, Valery, Academician of RAS, Dean of Dept. of Chemistry, Lomonosov MSU<br />
(Co-Chair of the Organizing Committee)<br />
Perminova, Irina, Сoordina<strong>to</strong>r of CIS-IHSS<br />
(Co-Chair of the Organizing Committee)<br />
Ryzhnev, Vadim, General Direc<strong>to</strong>r, JSC "NPO “Chimav<strong>to</strong>matika"<br />
(Co-Chair of the Organizing Committee)<br />
Kulikova, Natalia, Dept. of Soil Science, Lomonosov MSU<br />
(Secretary of the Organizing Committee)<br />
Abakumov, Eugeny, Dept. of Soil Ecology, SPbSU<br />
Aparin, Boris, Chair of Soil Ecology Department, SPbSU<br />
Bezuglova, Olga, Dept. of Agrochemistry, SFU<br />
Dubenenkov, Ivan, Dept. of Chemistry, Lomonosov MSU<br />
Khitrov, Nikolay, Direc<strong>to</strong>r of Dokuchaev Soil Science Institute of RAAS<br />
Kholodov, Vladimir, Dokuchaev Soil Science Institute of RAAS<br />
Kononikhin, Alexey S., Institute of Biochemical Physics of RAS<br />
Konstantinov, Andrey, Dept. of Chemistry, Lomonosov MSU<br />
Kudryavtsev, Alexey, Dept. of Chemistry, Lomonosov MSU<br />
Nadporozhskaya, Marina, Soil Ecology Department, SPbSU<br />
Nikolaev, Eugene, Institute of Biochemical Physics of RAS<br />
Philippova, Olga, Dept. of Soil Science, Lomonosov MSU<br />
Popov, Igor, Institute of Biochemical Physics of RAS<br />
Popov, Vladimir, Direc<strong>to</strong>r of Bach Institute of Biochemistry of RAS<br />
Shoba, Sergei, Corr. Member of RAS, Dean of the Dept. of Soil Science, MSU<br />
Sorkina, Tatyana, Dept. of Chemistry, Lomonosov MSU<br />
Tarasova, Natalia, Corr. Member of RAS,<br />
Mendeleev Chemical Technology University<br />
Yakimenko, Olga, Dept. of Soil Science, Lomonosov MSU<br />
Organizing Committee – Organizations<br />
Lomonosov Moscow State University (MSU)<br />
JSC "NPO “Chimav<strong>to</strong>matika"<br />
Saint Petersburg State University (SPbSU)<br />
Emanuel Institute of Biochemical Physics of RAS<br />
Bach Institute of Biochemistry of RAS<br />
Dokuchaev Soil Science Institute of RAAS<br />
Russian Academy of Agricultural Sciences<br />
NCP "Center for Biogenic Resources "<strong>Humus</strong> Sapiens"<br />
Holding "Biomir 2000"<br />
v
Sponsors<br />
General sponsor – Government of Moscow (www.mos.<strong>ru</strong>)<br />
IHSS – Travel Awards (www.ihss.gatech.edu)<br />
Sponsor – IUPAC (www.iupac.org)<br />
Exhibition sponsor – Biomir 2000 (www.humate-sakhalin.<strong>ru</strong>)<br />
Conference sponsor – Biocorrection (www.biocorrection.com)<br />
Conference sponsor – Russian Foundation for Basic Research (www.rfbr.<strong>ru</strong>)<br />
Poster session sponsor – B<strong>ru</strong>ker (www.b<strong>ru</strong>ker.<strong>ru</strong>)<br />
Technical support – Epson (www.epson.<strong>ru</strong>)<br />
vi
Preface<br />
The 20 th century was the century of the petrochemical economy. With oil prices<br />
steadily climbing up, development of alternative feeds<strong>to</strong>cks is critical <strong>to</strong> maintain the<br />
viability of the manufacturing industry. The 21 st century is announced a century of<br />
bioeconomy based on a use of plant biomass produced by pho<strong>to</strong>synthesis within biological<br />
rather than geologic time. With the sources encompassing lignites, peats, sapropels,<br />
composts, organic wastes, and others, humic materials occupy a niche between fossil<br />
rocks and fresh biomass.<br />
The most striking feature of humic materials is constellation of unique properties such<br />
as non-<strong>to</strong>xicity, biocompatibility, resistance <strong>to</strong> biodegradation, and polyfunctionality. As a<br />
result, these materials can be competitive on the market of biobased products, e.g.,<br />
biocompatible plastic, “green” chemicals (flocculants, chela<strong>to</strong>rs), biosorbents, de<strong>to</strong>xicants.<br />
Development of advanced fractionation can refine biomedical properties of humics<br />
inherent in the minor fractions. They can be used as elici<strong>to</strong>rs, immunomodula<strong>to</strong>rs, and<br />
others.<br />
To elucidate the growing economic potential of humic materials, the 14 th Meeting of<br />
International Humic Substances Society (IHSS-14) was entitled “<strong>From</strong> molecular<br />
understanding – <strong>to</strong> innovative applications of humic materials”. In appreciation of the<br />
industrial importance of the emerging concepts of humic science and technology, the<br />
conference was supported by International Union of Pure and Applied Chemistry (IUPAC).<br />
The meeting was invited by the Commonwealth of Independent States (CIS) IHSS Chapter<br />
and was held on September 14 – 19, 2008, aboard the ship traveling from Moscow <strong>to</strong><br />
Saint Petersburg (Russia) (see the web-site: www.ihss-14.humus.<strong>ru</strong>). The aim of this<br />
conference was <strong>to</strong> expand the existing attitude <strong>to</strong>ward humic substances as most<br />
abundant components of organic matter in soil and water <strong>to</strong> much broader understanding<br />
of potential of humic materials as alternative feeds<strong>to</strong>ck for biobased economy. This aim<br />
was in line with the long standing traditions of theoretical and applied science intrinsic <strong>to</strong><br />
the Soviet-Russian schools in humic research. The works of soil scientists (M. Kononova,<br />
L. Alexandrova, D. Orlov), laid foundations <strong>to</strong> humification theory, <strong>to</strong> understanding<br />
st<strong>ru</strong>cture and biospheric functions of humic substances. The coal chemists (G. Stadnikov,<br />
T. Kukharenko) contributed the most in<strong>to</strong> industrial production of humates and elaborated<br />
the first state standard pro<strong>to</strong>col for determination of humic acid yield. The pioneering works<br />
of L. Khristeva (Ukraine) on physiological activity broadened substantially agricultural<br />
vii
applications of humates. The Belo<strong>ru</strong>ssian scientists (N. Bambalov, F. Puntus) achieved<br />
substantial progress in production of biologically active humics from peat and sapropel.<br />
The main <strong>to</strong>pics of the conference were: 1) <strong>Molecular</strong> understanding of humic<br />
substances (HS) and natural organic matter (NOM), 2) HS and NOM in the changing<br />
environment, 3) Physical-chemical and biological properties of HS and NOM, 4)<br />
Knowledge-based design and advanced separation of humic materials, 5) Industrial<br />
production and innovative applications of HS. The unique feature of this conference<br />
became the satellite exhibition “Humic materials – resources for the 21 st century”. The<br />
purpose of organizing the scientific conference and industrial exhibition at the same venue<br />
was <strong>to</strong> bring <strong>to</strong>gether a league of experienced scientists with an association of engineers<br />
and business people. This was <strong>to</strong> create among the participants an awareness of the<br />
current status of research in humic science and technology. At the meeting, 84 oral and<br />
158 poster presentations were given followed up by six round table discussions with about<br />
sixty short oral presentations. Twelve companies were presenting their products and<br />
technologies at the exhibition which are presented in the separate exhibition catalogue.<br />
This book summarizes the proceedings of the IHSS-14 and is dedicated <strong>to</strong> Professor<br />
Dmitry Orlov (deceased) – the honorable chair of the Scientific Committee of the<br />
conference. All papers have been subject <strong>to</strong> peer review by at least one referee – member<br />
of the Scientific Committee. We thank all members of international Scientific Committee<br />
and the authors for their helpful collaboration. The sincerest appreciation goes <strong>to</strong><br />
Dr. Natalia A. Kulikova – scientific secretary of the IHSS-14 who <strong>to</strong>ok over responsibility<br />
for abstract submission, reviewing, and formatting. Special thanks <strong>to</strong> our sponsors who<br />
contributed greatly in organization of this meeting.<br />
We wish the conference and all its distinctive participants full and highly deserved<br />
success – outcome of five days spent in the unique atmosphere of the ship traveling from<br />
Moscow <strong>to</strong> Saint Petersburg along the rivers of Russia!<br />
August 2008<br />
Irina V. Perminova<br />
Сoordina<strong>to</strong>r of CIS-IHSS<br />
Co-Chair of the Organizing Committee<br />
of the IHSS-14 Meeting<br />
viii
Dear colleagues and friends of humic sciences,<br />
It is a great pleasure for me <strong>to</strong> have opportunity <strong>to</strong> welcome <strong>to</strong> the 14 th International<br />
Meeting of the International Humic Substances Society. The scientific program indicates<br />
that IHSS-14 will bring <strong>to</strong>gether a distinguished group of researchers, who would create a<br />
stimulating and dynamic professional meeting. It will be most enjoyable <strong>to</strong> discuss with<br />
colleagues and friends with whom we can exchange our recent experiences and research,<br />
while meeting new people who share our common interests may create new friendships.<br />
The place of the meeting is also very important. Certainly, visits <strong>to</strong> Kremlin and Armory in<br />
Moscow, as well as <strong>to</strong> Hermitage in Saint Petersburg must delight and provide plenty of<br />
impressions. Furthermore, exciting venue, such as a four-deck ship traveling from Moscow<br />
<strong>to</strong> Saint Petersburg, makes this event very special. This is my second visit <strong>to</strong> Russia.<br />
Being aware of great hospitality and cordial reception by Russian colleagues, I am<br />
convinced that gathering all participants for a week in this not <strong>to</strong>o big area will result in a<br />
really very specific atmosphere. During our way, we will have occasion <strong>to</strong> visit renowned<br />
Russian his<strong>to</strong>rical and architectural attractions, including Uglich, Goritsy, and Kizhi Islands.<br />
The conference organizers, leading by Irina Perminova, deserve our sincerest appreciation<br />
and thanks for all these arrangements, indeed. <strong>From</strong> the other hand, none of participants<br />
can leave a ship during its way, thus conference room should be quite well occupied<br />
during scientific sessions.<br />
Humic substances research and scientists are very special, as well. Significant<br />
benefits of soil organic matter <strong>to</strong> crop productivity have been recognized by agriculturalists<br />
since ancient times, while research on humic substances dates back two centuries. In<br />
1798 Achard used base extraction of soil <strong>to</strong> obtain a darkly colored solution for his studies,<br />
while Berzelius published in 1806 on humic substances isolated from a spring Porla in<br />
Sweden. Although studies of humic substances in terrestrial and aquatic environments<br />
have been conducted for more than 200 years, only in the last three decades our<br />
understanding of the st<strong>ru</strong>cture and reactivity of these complex materials has increased<br />
ix
dramatically. The International Humic Substances Society, an organization that was<br />
conceived and brought in<strong>to</strong> being 27 years ago, contributed <strong>to</strong> that progress very much.<br />
The founders of IHSS provided a fo<strong>ru</strong>m in which scientists from very diverse backgrounds<br />
and scientific disciplines could meet <strong>to</strong> discuss their common interests. Such a gathering<br />
stimulated the formulation of ideas and sharing of knowledge, which would lead <strong>to</strong> a<br />
greater scientific understanding of humic substances nature. <strong>From</strong> small group at the<br />
beginnings in 1981, IHSS have grown <strong>to</strong> over 800 members in 58 countries. Nowadays,<br />
we have an internationally accessible reference and standard humic substances collection,<br />
and a recommended standard procedure for their extraction. Numerous contributions<br />
presented at previous 13 International Meetings of the IHSS played a c<strong>ru</strong>cial role in<br />
enhancing the knowledge of the st<strong>ru</strong>cture, function and reactions of these materials.<br />
Nevertheless, we have only taken the first step on the long way <strong>to</strong>wards unveiling the<br />
properties of humic matter. It is enough <strong>to</strong> say, that we are still not able <strong>to</strong> provide accurate<br />
definition of humic substances, thus IHSS Board adopted only a description of humic<br />
substances, available at IHSS website from this year.<br />
The future of our science is in the young. Without them, the lines of investigation<br />
would disappear and much of the progress made in the last years would be dashed.<br />
Having this in mind, the Society offers financial support for students, allowing them <strong>to</strong><br />
attend biannual meetings, and <strong>to</strong> become full partners in our achievements <strong>to</strong> increase<br />
knowledge on humic substances. The IHSS board appreciated very much a great<br />
response of students <strong>to</strong> the last call for Travel Support Award. Submitted contributions<br />
were of very high scientific level, and applying students indicated great achievements. I am<br />
especially looking forward <strong>to</strong> scientific sessions <strong>to</strong> learn from the 17 students who were<br />
awarded IHSS Travel Support Award <strong>to</strong> attend this meeting.<br />
The 14 th International Meeting of the IHSS is entitled "<strong>From</strong> molecular understanding<br />
<strong>to</strong> innovative applications of humic substances". The conference presents a promising<br />
program, enabling participants <strong>to</strong> discuss very different issues. I want <strong>to</strong> invite all of you <strong>to</strong><br />
bring your recent findings and discuss in friendly and stimulating ambiance. The abstracts<br />
you find in this book are an excellent basis for a thorough exchange of ideas. Have a good<br />
week with us.<br />
August 2008<br />
Jerzy Weber<br />
President of the International Humic<br />
Substances Society (IHSS)<br />
x
On behalf of the International Union of Pure and Applied Chemistry (IUPAC) I would<br />
like <strong>to</strong> extend a warm welcome <strong>to</strong> all of you <strong>to</strong> this IUPAC sponsored 14 th Conference of<br />
the International Humic Substances Society. The biannual IHSS meetings provide a great<br />
opportunity for humic researchers, chemical engineers and humate producers of many<br />
countries <strong>to</strong> come <strong>to</strong>gether and <strong>to</strong> learn about the latest discoveries in humic science and<br />
technology. The unique peculiarity of the current meeting lies on the technological focus<br />
reflected already in the title “<strong>From</strong> molecular understanding – <strong>to</strong> innovative applications of<br />
humic materials” strengthened by the Satellite Exhibition “Humic materials – resources for<br />
the 21 st century”. This will be the first time when this kind of exhibition will take place in the<br />
framework of the conference, which demonstrates the growing economic potential of<br />
humus-containing raw materials and humic-based products.<br />
I believe that IHSS-14 will draw attention of industrial chemists and policy-makers <strong>to</strong><br />
the prospect of conversion of huge resources of humified biomass in<strong>to</strong> alternative<br />
feeds<strong>to</strong>ck for bio-based products. The conference and exhibition will provide a great<br />
networking opportunity for scientists and commercial sec<strong>to</strong>r worldwide. In addition, this<br />
event is a perfect and unique opportunity for young scientists <strong>to</strong> learn about the emerging<br />
humic-based technologies which will surely become a significant part of “green” chemistry<br />
industry.<br />
The special atmosphere of the meeting organized by the Russian hosts of IHSS-14<br />
aboard the ship traveling from Moscow <strong>to</strong> Saint Petersburg will stimulate brain s<strong>to</strong>rming<br />
and exciting discussions on the newest discoveries and prospects of humic science and<br />
technology. This book is a great survey of the latest research and achievements in the<br />
field of humic science and technology, which provides a reader with a snapshot of newest<br />
xi
trends in this exciting area. I wish all the success <strong>to</strong> this meeting. And may it carry along<br />
the spirit of IUPAC who serves <strong>to</strong> advance the worldwide aspects of the chemical sciences<br />
and <strong>to</strong> contribute <strong>to</strong> the application of chemistry in the service of Mankind.<br />
My special appreciations <strong>to</strong> the organizers, especially <strong>to</strong> Prof. Irina Perminova and<br />
welcome <strong>to</strong> IHSS-14 in Russia!<br />
August 2008<br />
Jung-Il Jin<br />
President of the International Union of<br />
Pure and Applied Chemistry (IUPAC)<br />
xii
On behalf of the Government of Moscow and of myself I am glad <strong>to</strong> welcome<br />
organizers, participants and guests <strong>to</strong> the 14 th Meeting of the International Humic<br />
Substances Society – the pre-eminent fo<strong>ru</strong>m in the field of fundamental and applied humic<br />
research!<br />
It is fair and deeply symbolic that the Lomonosov Moscow State University became<br />
the venue of the Opening Session of this conference held for the first time in Russia. The<br />
Lomonosov Moscow State University is a cradle of many scientific schools of Russia. MSU<br />
was also alma mater of Professor Dmitry Sergeevich Orlov – the founder of modern<br />
Russian school of humus chemistry.<br />
Studies on the role of humic substances in global climate change belong <strong>to</strong> the<br />
newest branches of environmental chemistry. Of particular importance is the satellite<br />
exhibition of the conference «Humic materials – resources for the 21 st century».<br />
I am deeply convinced that this conference will contribute <strong>to</strong> further developments in<br />
fundamental research as well as broaden practical applications of scientific developments.<br />
My wish <strong>to</strong> all participants and guests of the conference is that your interactions are<br />
intense, energizing, and creative, that new scientific contacts evolve and of course I wish<br />
you success in realizing all of your plans!<br />
September 14, 2008<br />
Yuriy Mikhailovich Luzhkov<br />
The Mayor of Moscow<br />
xiii
Contents<br />
Volume I<br />
Section I – Novel methods and approaches <strong>to</strong> molecular understanding<br />
of humic substances and natural organic matter<br />
Agent-Based Modeling of Natural Organic Matter ..........................................................3<br />
Cabaniss S.<br />
Probing Local pH in Hydrophobic Domains of Humic Acids: an EPR Based<br />
Method ................................................................................................................................7<br />
Deligiannakis Y., Chris<strong>to</strong>foridis K., Drosos M. Weiner L.<br />
Study on Self-Assembling Mechanism of IHSS Humic and Fulvic Standards ...........11<br />
Drastík M., Čtvrtníčková A., Kučerík J.<br />
Multiple Charged Constituents in Suwannee River Natural Organic Matter...............15<br />
Gaspar A., Kunenkov E., Lock R., Desor M., Perminova I., Schmitt-Kopplin Ph.<br />
Depicting <strong>Molecular</strong> Dissimilarity in Complex Materials..............................................19<br />
Hertkorn N., <strong>From</strong>mberger M., Schmitt-Kopplin Ph., Perdue E.M.<br />
Isolation and Characterization of Humic and Fulvic Acids from Thermal<br />
Waters as an Unexplored Biogeosystem.......................................................................23<br />
Kovács K., Sajgó C., B<strong>ru</strong>kner-Wein A., Kárpáti Z., Gáspár A., Tombácz E., Schmitt-<br />
Kopplin Ph.<br />
Hydrous Pyrolysis of Natural Organic Matter from a Highly Coloured Surface<br />
Water.................................................................................................................................27<br />
Allpike B., McDonald S., Joll C., Kagi R.<br />
High Resolution and Hyphenated Analytics as Tools for Exploring Chemical<br />
Space of HS and NOM from Various Environments .....................................................31<br />
Schmitt-Kopplin Ph., Hertkorn N., Harir M., Lucio M. Gaspar A., Kanavati B.,<br />
Fekete A., Gebefuegi I.<br />
X-Ray Spectromicroscopy of Organic Matter in the Environment ..............................35<br />
Thieme J.<br />
Effects of pH, Temperature, and Organic and Inorganic Ions on the<br />
Dissolution Kinetics of Humic Acid Particles ...............................................................39<br />
Brigante M., Zanini G., Avena M.<br />
Spectroscopic Evaluation of Charcoal Derived Humic-Like Acid ...............................43<br />
Ferreira E.J.B., Brocchi E.A., Maurício G.M., Nunes R.A., Benites, V.<br />
Properties of Hydration Shell of IHSS Humic Standards .............................................47<br />
Bursáková P., Průšová A., Kučerík J.<br />
xv
Insights in<strong>to</strong> the Composition of Humin from an Irish Grassland Soil .......................51<br />
Byrne C.M., Novotny E.H., Hatcher P.G., Hayes M.B.H.<br />
Characterization of Soil Organic Matter in Different Particle-Size Fractions by<br />
CP/MAS 13 C NMR along a Slope of Subtropical Mountain Forest ...............................55<br />
Chiu Ch.-Yu., Luang W.-W., Chen J.-Sh.<br />
Characterization of Chernozem Humic Acid SEC-PAGE Fractions Using DRIFT<br />
Spectroscopy and Thermal Analysis .............................................................................59<br />
Montecchio D., Cavani L., Gioacchini P., Francioso O., T<strong>ru</strong>betskaya O.,<br />
T<strong>ru</strong>betskoj O., Ciavatta C.<br />
Au<strong>to</strong>dock Simulation of Interactions among Humic Substances and Proteins .........63<br />
Polano M., Anselmi C., Leita L., De Nobili M.<br />
St<strong>ru</strong>ctural Characteristics of Soil Humin Fractions in Different Tillage Systems ......65<br />
Dou S., Li K., Wang Q.-H., Liang Y.<br />
A Water Soluble Polymer as a Working St<strong>ru</strong>ctural Model for Humic Acids:<br />
H-binding and Spectroscopic Properties ......................................................................69<br />
Drosos M., Giannakopoulos E., Deligiannakis Y.<br />
Characterization of Humic Acids from Peat Column Using Pyrolysis-GC/MS ...........73<br />
Eglite L., Klavins M., Sire J., Dobele G., Telysheva G., Jurkjan V.<br />
Random Generation of 3D St<strong>ru</strong>ctures of Humic Substances ......................................75<br />
Porquet A., Chapron Y., Filella M.<br />
Biodegradation of Humic Acid by White Rot Fungi Determined by 1 H NMR<br />
Spectroscopy and Ultra-High Resolution FTICR Mass Spectrometry.........................77<br />
Grinhut T., Hertkorn N., Schmitt-Kopplin Ph., Hadar Y., Chen Y.<br />
Limitations in High Resolution NMR Analysis of Humic Acids ...................................81<br />
Hänninen K.<br />
Investigation of Chemical St<strong>ru</strong>cture of Natural Organic Matters from<br />
Dried Figs .........................................................................................................................83<br />
Hatano K.-I., Kubota K., Tanokura M.<br />
Spectral Characterization of Plant-Derived Dissolved Organic Matter .......................87<br />
He Zh., Mao J., Honeycutt W., Ohno T., Hunt J.F., Cade-Menun B.J.<br />
Capillary Electrophoresis and Fluorescence Excitation-Emission Matrix<br />
Characterization of Soil Mobile and Calcium Humates ................................................91<br />
He Zh., Ohno T., Olk D.C., Wu F., Honeycutt C.W., Mao J.<br />
Characterization of Synthetic (Core) Humic Substances Made from<br />
Dihydroxylated Phenylpropanoids.................................................................................95<br />
Kloecking R., Helbig B., Kinne M., Kleiner C., Poerschmann T.G.J., Podgorski D.,<br />
Cooper W.T.<br />
xvi
High Resolution Ultrasonic Spectroscopy as Aid in Study of Complexation of<br />
Humic Acids .....................................................................................................................99<br />
Klučáková M., Kučerík J., Pekař M., Válková D.<br />
Characterization of Mumijo (Shilajit) from Different Regions by FTICR Mass-<br />
Spectrometry..................................................................................................................103<br />
Kononikhin A, Vladimirov G., Kunenkov E., Perminova I., Popov I., Garmash A.,<br />
Nikolaev E.<br />
Extraction and Characterisation of Humin Fraction from Amazonian<br />
Anthropogenic Dark Earths Soils (“Terra Preta de Índios”) ......................................105<br />
Novotny E.H., Hayes M.H.B., Song G., deAzevedo E.R., Bonagamba T.J.<br />
Measuring Soil Amino Compounds by Anion Chroma<strong>to</strong>graphy-Pulsed<br />
Amperometry .................................................................................................................109<br />
Olk D.C., Fortuna A.-M., Honeycutt C.W.<br />
Membrane Processes Applied <strong>to</strong> the Study of Marine Dissolved Organic<br />
Matter..............................................................................................................................113<br />
Huguet A., Casademont E., Roux-de Balmann H., Ibalot F., Parlanti E.<br />
Studies of the St<strong>ru</strong>cture of Extracted Humic Acid from Naharhoran Forest<br />
Gorgan’s Soil .................................................................................................................117<br />
Sardashti A.R., Alidoost M.<br />
Application of a Novel Polarity Method for the Analysis of Natural Organic<br />
Matter during Water Treatment.....................................................................................121<br />
Rosario-Ortiz F.L., Gerringer F.W., Suffet I.H.<br />
Separation and Isolation of Soil Humic Acid Fluorescence Species by Tandem<br />
Ultrafiltration-PAGE.......................................................................................................125<br />
T<strong>ru</strong>betskaya O.E., Shaloiko L.A., Demin D.V., Richard C., T<strong>ru</strong>betskoj O.A.<br />
NMR Approaches for Characterization of Soil HA Fractions Obtained by<br />
SEC-PAGE ......................................................................................................................129<br />
T<strong>ru</strong>betskoj O.A., T<strong>ru</strong>betskaya O.E., Ruhl I.D., Hatcher P.G.<br />
Comparison of Humic Acid and Metal Salt Interactions in Capillary<br />
Electrophoresis..............................................................................................................133<br />
Übner M., Kaljurand M., Lopp M.<br />
Comparison of Mumijo (Shilajit) and Humic Acids (HA) Chemical Composition<br />
Using FTICR Mass-Spectrometry .................................................................................137<br />
Vladimirov G., Kononikhin A., Kunenkov E., Perminova I., Popov I., Garmash A.,<br />
Nikolaev E.<br />
Solid Phase Micro Extraction (SPME): A Powerful Tool for Complex Natural<br />
Organic Matter Investigation ........................................................................................139<br />
Walter S., Freitag S., Neunlist S., Hadj-Mebarek A., Gabelica Z.<br />
xvii
Section II – Natural organic matter and humic substances as markers of<br />
climate change and anthropogenic repercussions<br />
Evolution of Soil Humic Substances............................................................................145<br />
Chukov S.<br />
<strong>Humus</strong> and the Birth of Pedology : Müller, Dokuchaev and Successors .................149<br />
Feller C., Sastriques F.O., Chen Y.<br />
Freshwaters: Do ‘Humics’ Always Represent 50% of NOM? .....................................151<br />
Filella M., Quentel F., Chanudet V.<br />
Atmospheric HULIS: How Humic-Like Are They?.......................................................155<br />
Graber E.R., Rudich Y.<br />
Short Time Humification and Mineralisation of Different Pyrogenic Materials<br />
under Controlled Labora<strong>to</strong>ry Conditions.....................................................................159<br />
Hilscher A., Siewert C., Knicker H.<br />
Sedimentary Organic Matter in the Earth System: Origin and Fate ..........................163<br />
Huc A.-Y.<br />
Biological and <strong>Molecular</strong> St<strong>ru</strong>cture Analyses of the Controls on Soil Organic<br />
Matter Dynamics ............................................................................................................167<br />
Paul E.A., Magrini K., Conant R., Follett R.F., Morris S.J.<br />
Genesis of Cambisol, Luvisol and Rendzic Lep<strong>to</strong>sol of Samara Forest-Steppe<br />
Ridges with Special Reference <strong>to</strong> Characteristic of Humic Acids.............................171<br />
Abakumov E.V., Fujitake N., Kosaki T.<br />
Paramagnetic Activity of Humic Acids in Soil Chronosequence of Former<br />
Sandy Quarry, Leningrad Region, Russia ...................................................................175<br />
Abakumov E., Ryumin A., Chukov S., Kechaikina I.<br />
Global Warming and Effects of Sea-Salts on Dissolved Natural Organic Matter<br />
(DNOM) Draining <strong>From</strong> a Sub-Catchment Upstream Lake Terjevann,<br />
Southernmost Norway...................................................................................................177<br />
Andersen D.O.<br />
Characterization of Soil Organic Matter from Flooded Rice Fields<br />
Contaminated by Geogenic Arsenic in Bangladesh...................................................181<br />
Breider F., Hassouna M., Pfeifer H.-R., Abraham A., Garnier J.-M.<br />
Soil Organic Matter Chemical and Physical Fractionation: a Comparison on a<br />
Developing Soil..............................................................................................................185<br />
Celi L., Cerli C., Guggenberger G., Kaiser K.<br />
Study on the Role of Microorganism in the St<strong>ru</strong>cture of Soil Humic Acid ...............187<br />
Cui J.-T., Dou S., Zhang W., Feng L.-W.<br />
xviii
Impact on SOM of an Oxisol after Application of Sewer Effluent Treated by<br />
Brazilian Septic Cesspool Biodigester ........................................................................191<br />
da Silva W.T.L, Faustino A.S., Nogueira A.R.A., Simões M.L., Martin-Ne<strong>to</strong> L.<br />
Organic Matter in Oxisol Profiles under Pasture Submitted <strong>to</strong> Periodic<br />
Burning in the Past........................................................................................................195<br />
Dick D.P., Martinazzo R., Mangrich A.S., Pereira B.F., Dalmolin R.S.D., Knicker H.<br />
Chemical and Spectroscopic Characterization of Humic Acids Isolated from<br />
Urban Soils.....................................................................................................................199<br />
D’Orazio V., Traversa A., Senesi N.<br />
Effect of Different F<strong>ru</strong>it Tree Cultivation on Humic Substances and Soil<br />
Properties.......................................................................................................................203<br />
Licznar M., Licznar S.E., Drozd J., Weber J.<br />
Long-Term Effects of Wildfires in the Characteristics of Soil Organic Matter: a<br />
Study in Mediterranean Sh<strong>ru</strong>blands.............................................................................207<br />
Duguy B., Rovira P., Vallejo V.R<br />
Organic Carbon S<strong>to</strong>cks in Bulgarian Soils..................................................................211<br />
Filcheva E., Koulikov A., Rousseva S.<br />
Use of Lipid Biomarkers in Sediment and Aquatic Systems .....................................215<br />
Fouchard S., Freitag S., Zeller F., Llopiz P., Walter S., Neunlist S.<br />
Thermal Properties in Soil Particle-Size Fractions of Andosols, with Different<br />
Land-Use, in the Trans-Mexican Volcanic Range .......................................................219<br />
Covaleda S., Gallardo J.F., García-Oliva F., Prat C., Bravo M., Kirchmann H.,<br />
González M.I.<br />
Soil Organic Carbon S<strong>to</strong>cks and Humic Substances in Extremely Acid Soils,<br />
Sierra Norte de Oaxaca, México ...................................................................................223<br />
García-Calderón N.E., Galicia-Palacios M.S., Álvarez A.G., Lasso T.A., Krasilnikov P.<br />
Mechanisms of Soil Carbon S<strong>to</strong>rage in Experimental Grasslands ...........................227<br />
Steinbeiss S., Temper<strong>to</strong>n V.M., Gleixner G.<br />
The Content of Humic Substances in Ground Water from Agricultural Area in<br />
Opole Region, Poland....................................................................................................231<br />
Glowacki M., Pisarek I.<br />
Espectroscopic Features of Humic Substances in Diagnostic Horizons from<br />
Andosols as Seen by FT-IR and 13 C CPMAS NMR ......................................................235<br />
González-Pérez J.A., Knicker H., Rodríguez A.R., Arbelo C.D.,<br />
González-Vázquez R., González-Vila F.J.<br />
Characterization of Humic and Fulvic Acids in Tropical Spodosols by FTIR<br />
and Fluorescence Spectroscopy..................................................................................239<br />
González-Pérez M., Vidal-Torrado P., Martin-Ne<strong>to</strong> L., Milori D.M.P.B., Colnago L.A.<br />
xix
Distribution of Water Soluble Organic Nitrogen (WSON) in Acidic Forest Soils,<br />
Southwestern China ......................................................................................................243<br />
Guo J., Zhang Yi, Zhang X.<br />
Evolution and NOM........................................................................................................247<br />
Hänninen K.<br />
Long Term Trends of DOC and Colour in Raw Water from a Forest Lake<br />
Caused by Increased Precipitation and Changed Precipitation Chemistry..............249<br />
Hongve D., Haaland S., Riise G., Fausk<strong>ru</strong>d S.L.<br />
Role of Aromaticity Degree in the Stability of Humic Substances ............................253<br />
Kislinger J., Novák F., Kučerík J.<br />
Humic Acids St<strong>ru</strong>cture as a Reflection of Bioclimatic Fac<strong>to</strong>r of Soil Formation<br />
in Boreal Ecosystems....................................................................................................257<br />
Klenov B., Almendros G.<br />
Bioluminescent Moni<strong>to</strong>ring of De<strong>to</strong>xification Processes...........................................261<br />
Kudryasheva N., Fedorova E., Rozhko T., Alexandrova M., Mogil’naya O.,<br />
Vydryakova G., Bondareva L., Bolsunovsky A., S<strong>to</strong>m D.<br />
<strong>Humus</strong> Substances in Natural and Technogenic Polluted Waters in Priamurje ......265<br />
Levshina S.<br />
Analysis of Pore Water Dissolved Organic Matter by UV-spectroscopy and<br />
Spectral Fluorescence Signatures Technology ..........................................................269<br />
Makarõtševa N., Lepane V., Alliksaar T., Tõnno I.<br />
Risk Assessment of Soil Degradation and Possible Soil Recultivation in<br />
Mining in Priokhotje Region .........................................................................................273<br />
Makhinova A.F., Makhinov A.N.<br />
Variation in Lipid Relative Abundance and Composition among Different Peat<br />
Bog Profiles....................................................................................................................277<br />
Malawska M., Mętrak M., Wiłkomirski B.<br />
Characterization of Humic Substances Isolated from Various Peat Bog<br />
Profiles............................................................................................................................279<br />
Mętrak M., Brechowskych-Jaworska N., Malawska M.<br />
Characterization of Soil and Humic Acids Extracted from Native Forest and Oil<br />
Shale Industrialization Rehabilitated Areas ................................................................281<br />
Pereira B.F., dos San<strong>to</strong>s J.V., Mangrich A.S., Pillon C.N.<br />
Diversity of Fractional Composition of Humic Substances and the Content of<br />
Total and Availability Forms of Some Metals in Selected Soils of the Opole<br />
Region, Poland...............................................................................................................285<br />
Pisarek I., Głowacki M.<br />
xx
Characterization of Microbiological Effects on the Composition and<br />
Pho<strong>to</strong>chemical Properties of DOM in Coastal Sands Using Ultrahigh<br />
Resolution Mass Spectrometry and 3-D Excitation/Emission Fluorescence<br />
Spectroscopy .................................................................................................................289<br />
Podgorski D., Cooper W.T., Dittmar T., Huettel M., Kostka J.<br />
Reactive Polyphenols and Dissolved Nutrients in a Nitrogen-Limited<br />
Headwater Catchment in Western Oregon, USA.........................................................291<br />
Rasmussen J., Lajtha K., Caldwell B.<br />
Density Fractions of SOM in Mediterranean Forest Soils: Characterization by<br />
TMAH-Thermochemolysis-GC-MS................................................................................295<br />
Rovira P., Grasset L., Amblès A.<br />
Use of Bioluminescent Assay Systems <strong>to</strong> Moni<strong>to</strong>r De<strong>to</strong>xification Processes in<br />
Radionuclide’ Solutions ................................................................................................299<br />
Rozhko T., Kudryasheva N., Alexandrova M., Mogil’naya O., Vydryakova G.,<br />
Bondareva L., Bolsunovsky A.<br />
Humification of Peat and Characteristics of its Humic Substances Depending<br />
on their Origin and Age.................................................................................................303<br />
Šīre J., Kļaviņš M.<br />
The Impact of Land Use Conversion on Carbon and Humic Substances.................307<br />
Slepetiene A., Maryganova V., Slepetys J., Liaudanskiene I., Kavoliute F.,<br />
Kadziuliene Z.<br />
Char and Humin Fractions in Amazonian Dark Earths...............................................311<br />
Song G., Novotny E.H., Hayes M.H.B., de Azêvedo E.R., Bonagamba T.J.<br />
Diverse Microbial Carbon Turnover and Dynamics in Temperate and Tropical<br />
Forest Soils ....................................................................................................................315<br />
Throckmor<strong>to</strong>n H.M., Bird J.A., Fires<strong>to</strong>ne M.K., Horwath W.R.<br />
The Comparison between <strong>Humus</strong> St<strong>ru</strong>cture of 5 <strong>to</strong> 1 μm Particle-Size<br />
Fractions and Fine Clay Fractions in Soils of Locally Hydromorphic<br />
Landscapes ....................................................................................................................319<br />
Tischenko S.A., Bezuglova O.S.<br />
Properties of Humic Acids in Forest Soils: Influence of Different Plant<br />
Covering .........................................................................................................................323<br />
Traversa A., Said-Pullicino D., D’Orazio V., Gigliotti G., Senesi N.<br />
Fluorescence Spectroscopy of Humic Acids Isolated from Different Litters<br />
and Corresponding Underlying Soils...........................................................................327<br />
Traversa A., D’Orazio V., Senesi N.<br />
In Situ Humification and Humics Preservation in Phosphatic Pellets, under<br />
Sulfate Reducing Conditions........................................................................................331<br />
Trichet J., Hassen-Trabelsi A.B.<br />
xxi
Comparison of 13 C NMR Spectra of Fulvic Acids from Neighboring Two Clear<br />
Water Lakes in Japan ....................................................................................................333<br />
Tsuda K., Aso S., Kodama H., Yonebayashi K., Fujitake N.<br />
Correlation between Optical and Chemical Properties of DNOM ..............................337<br />
Vogt R.D., Gjessing E.T.<br />
Difference between Humic Acids from Soils Derived under Different Tree<br />
Species in a Temperate Rain Forest, as Measured with 13 C CPMAS-NMR ...............341<br />
Tseng T.-Y., Wang Y.-N., Chiou C.-R., Wang M.-K., Yeh H.-J., Chen T.-H.<br />
<strong>Humus</strong> Level in Soils of South Kazakhstan Irrigated Massifs ...................................345<br />
Wiłkomirski B., Ibraeva M., Otarov A., Suska-Malawska M.<br />
The Role of Lichens in Carbon Preservation in Soils of Tundra Zone......................349<br />
Zavarzina A., Knoblauch C., Zavarzin A., Pfeiffer E.-M.<br />
Volume II<br />
Section III – Physical, chemical and biological properties of natural<br />
organic matter and humic substances<br />
The Specific UV-Absorbance of Dissolved Organic Matter (DOM) Explains the<br />
5-fold Variation of the Copper Mobilisation by DOM in an Agricultural Soil<br />
Horizon ...........................................................................................................................353<br />
Amery F., Degryse F., De Troyer I., Cheyns K., Mertens J., Smolders E.<br />
Strength of Methylmercury Binding by Fulvic Acid and Aquatic NOM .....................357<br />
Brezonik P., Bloom P., Khwaja A.<br />
Organo-Mineral Complexes and Their Effects on the Physico-Chemical<br />
Properties of Soils .........................................................................................................361<br />
Chen Y., Tarchitzky J.<br />
Reactive and Refrac<strong>to</strong>ry Components of Dissolved Organic Matter (DOM) in<br />
Peatland Soil Porewaters and their Relation <strong>to</strong> Climate Change ..............................365<br />
Cooper W., D’Andrilli J., Jones M., Chan<strong>to</strong>n J.<br />
Interactions between Dissolved Organic Matter and Organic Contaminants in<br />
Aquatic Environment.....................................................................................................367<br />
De Perre C., Le Ménach K., Ibalot F., Budzinski H., Parlanti E.<br />
Greenhouse Effect and Mitigation by Soil Carbon Sequestration in Tropical<br />
Areas: Importance and Characteristics of Humic Substances..................................371<br />
Martin-Ne<strong>to</strong> L., Segnini A., Primavesi O., da Silva W.T.L., Milori D.M.B.P.,<br />
Simões M.L.<br />
What Is Making up Dissolved Organic Matter in Anthropized Aquatic System? .....375<br />
Pernet-Coudrier B., Pouliquen S., Varrault G., Muresan B., Mouchel J.-M.<br />
Humic Substances in Soils and in Their Drainage Waters.........................................379<br />
Hayes M.H.B., Swift R.S.<br />
xxii
Size Exclusion Chroma<strong>to</strong>graphy Investigation of the Pho<strong>to</strong>catalytic<br />
Degradation of Natural Organic Matter........................................................................383<br />
Tercero Espinoza L.A., ter Haseborg E., Weber M., Karle E., Peschke R.,<br />
Frimmel F.H.<br />
Interaction between Pentachlorophenol and Soil Organic Matter: Sorption-<br />
Desorption Reaction and Hysteresis ...........................................................................387<br />
Xu J., He Y., Wang H., Wu J., Huang P.M.<br />
Modeling Zn Adsorption and Desorption <strong>to</strong> Soils.......................................................391<br />
Shi Z., Di Toro D.M., Allen H.E., Sparks D.L.<br />
Use of Diffusive Gradient in Thin-Films (DGT) for the in vitro Study of the<br />
Effects of Humic Fractions and Metals on the Growth of a Phy<strong>to</strong>pathogenic<br />
Fungus............................................................................................................................395<br />
Berloco M., Loffredo E., Mortimer R., Senesi N.<br />
A Relationship of P Chemical Speciation and PZSE in Allophanic Synthetic<br />
Surfaces Enriched with Natural Humic Acids from Chilean Andisols ......................399<br />
Canales J., Mora M.L., Aguirre M.J., Gaviño R., Antilén M., Briceño M.<br />
Correspondence Analysis of Microbe Species in the Formation of Humic Acid .....401<br />
Zhang W., Cui J.-T., Dou S., Cao T.-S.<br />
Testing Online Collaboration on Trace Metal-Humic Binding Modelling..................405<br />
Filella M.<br />
Influence of Sorption <strong>to</strong> Dissolved Humic Substances on Transformation<br />
Reactions of Organic Compounds in Water................................................................409<br />
Georgi A., Kopinke F.-D.<br />
Ultrafiltration Behaviour of Nitrophenols in the Presence of Humic<br />
Substances.....................................................................................................................411<br />
Ghaemi N., Madaeni S.S., Cudini A., Ber<strong>to</strong>ni A., De Nobili M.<br />
Interaction Selectivity between Lignin and Phenolic Compounds............................413<br />
Barrera Garcia V.D., Bellat J.P., Cayot Ph., Voilley A., Gougeon R.D., Chassagne D.<br />
Experimental Analysis of Sorption of Environmental Chemicals <strong>to</strong> Model Soil<br />
Organic Matter ...............................................................................................................417<br />
Hammer H., Paschke A., Schüürmann G.<br />
Influence of Suwannee River Fulvic Acid on the Speciation and Toxicity of<br />
Uranium, Aluminium and Arsenic <strong>to</strong> Australian Tropical Freshwater Species ........421<br />
Hous<strong>to</strong>n M., Ng J., Noller B., Markich S., van Dam R.<br />
Uptake of Humic Substances by Plants: a Study Using Tritium<br />
Au<strong>to</strong>radiography and FTICR MS Analysis ...................................................................425<br />
Kulikova N., Badun G., Kunenkov E., Korobkov V., Tyas<strong>to</strong> Z., Chernysheva M.,<br />
Tsvetkova E., Perminova I.<br />
xxiii
Effect of Humic Substances on Metal Desorption <strong>From</strong> Sediments under<br />
Conditions of Experimental Simulation.......................................................................427<br />
Linnik P., Malinovskaya L., Zubenko I., Zubko A.<br />
Acid-Base Properties of Dissolved Humic Substances in Landscape Waters of<br />
the Southern Primorye (Russia) ...................................................................................431<br />
Lutsenko T.N., Bratskaya S.Yu.<br />
Pho<strong>to</strong>chemical Reactivity of Australian Floodplain River and Billabong Fulvic<br />
Acids upon Exposure <strong>to</strong> UV-B Radiation.....................................................................435<br />
McDonald S., Prenzler P.D., Bishop A.G., Robards K.<br />
Complexation of Mercury <strong>to</strong> Dissolved Organic Matter Isolated from an<br />
Anthropized Aquatic Ecosystem..................................................................................439<br />
Muresan B., Pernet-Coudrier B., Cossa D., Varrault G.<br />
Development and Validation of Antioxidant Capacity Assessment Pro<strong>to</strong>col for<br />
Humic and Humic-Like Substances .............................................................................441<br />
Nikolaev I., Klein O., Kulikova N., Stepanova E., Koroleva O.<br />
Dissolved Organic Matter in Urban Water: a Protective Role <strong>to</strong> Organisms ............445<br />
Pernet-Coudrier B., Pouliquen S., Muresan B., Varrault G., Galceran J.,<br />
Tusseau-Vuillemin M.-H., Mouchel J.-M.<br />
Physiological Activity of Humic Substances from Bark Compost ............................449<br />
Popova T., Chakalov K., Savov V., Mi<strong>to</strong>v K., Angelova G.<br />
The Probable Mechanism of Biological Effect of Humic Substances.......................453<br />
Popov A.I.<br />
Chemical and Optical Characteristics of HS Isolated from the South Moravian<br />
Soils ................................................................................................................................457<br />
Pospíšilová L., Fasurová N., Jurica L., Pokorný E.<br />
Relationship between Spectral and Pho<strong>to</strong>sensitizing Properties in Bulk and<br />
Fractionated Humic Substances ..................................................................................461<br />
Richard C., ter Halle A., Guyot G., T<strong>ru</strong>betskaya O.E., T<strong>ru</strong>betskoj O.A., Corrado G.,<br />
Cavani L., Ciavatta C.<br />
Diffusivity of Cu 2+ in the Humic Gel .............................................................................465<br />
Sedláček P., Klučáková M., Malenovská M.<br />
The Role of Hormonal System in Protection of Wheat Plants<br />
Induced by HUMI M........................................................................................................469<br />
Shakirova F., Kusnetsov V., Lubyanova A., Fatkhutdinova R., Bez<strong>ru</strong>kova M.,<br />
Nurgalieva R.<br />
Effects of Soil Organic Matter Conformation and Substrates Addition on the<br />
Fate of Xenobiotics in Soils ..........................................................................................473<br />
Shchegolikhina A., Stumpe B., Marschner B.<br />
xxiv
The Influence of Humic Acids on the Pho<strong>to</strong>transformation of Organic<br />
Chemical Contaminants in Water.................................................................................477<br />
Sokolova I., Tchaikovskaya O., Mayer G., Yudina N.<br />
Potentiometric and IR Quantification of Metal Binding in Humic Substances.........481<br />
Szpoganicz B., da Silva M.R., Koslova V., Szpoganicz B.P., Martini M., Costa T.G.<br />
A Rapid Batch Procedure for Assessment of Humic Substances and<br />
Biodegradable Components of Organic Matter in Natural and Contaminated<br />
Materials .........................................................................................................................485<br />
Van Zomeren A., van der Sloot H.A., Comans R.N.J.<br />
Natural Organic Matter in Some Tributaries of the Dnieper River and their<br />
Effect on Phy<strong>to</strong>plank<strong>to</strong>n Growth ..................................................................................489<br />
Vasylchuk T., Klochenko P.<br />
The Influence of Apparent <strong>Molecular</strong> Size of Aquatic Humic Substances<br />
during Coagulation with Ferric Chloride .....................................................................493<br />
Sloboda E., Di Bernardo Dantas A., Di Bernardo L., Vieira E.M.<br />
Influence of Tropical Humic Substances and Copper on the Survival and<br />
Reproduction of Tropical Cladocerans (Daphnia similis and Ceriodaphnia<br />
silvestrii).........................................................................................................................497<br />
Barbosa D.S., Vieira E.M., Barbosa D.S., Espíndola E.L.G., Malpass G.R.P.<br />
Buffer Properties of Humic Acids in the System with Phosphate Ions.....................499<br />
Warchulska P., Sokołowska Z.<br />
Population of Humic Acid Degrading Microorganisms under Different Soil<br />
Types and Vegetation Types ........................................................................................503<br />
Yanagi Y., Yoda K., Ogura K., Fujitake N.<br />
Section IV – Nature- and man-made design of humic materials<br />
and their properties<br />
Radiochemical Approach for Studying Properties of Humic Substances................509<br />
Chernysheva M.G., Badun G.A., Perminova I.V., Korobkov V.I., Tyas<strong>to</strong> Z.A.,<br />
Belyaeva E.Yu., Kudryavtsev A.V., Tsvetkova E.A., Kulikova N.A.<br />
Oxidative Degradation of Chlorophenol by Iron-Porphyrin Catalyst Bound <strong>to</strong><br />
Humic Acid via Formaldehyde Polycondensation......................................................513<br />
Fukushima M., Shigematsu S.<br />
Biorefinery Chars as Potential Sources of Soil Humics.............................................517<br />
Hayes D.J.<br />
Synthesis of Alkoxysilylated Humic Derivatives with Different Modification<br />
Rate Capable of Self-Adhering <strong>to</strong> Mineral Surfaces ...................................................521<br />
Karpiouk L.A., Perminova I.V., Ponomarenko S.A., Muzafarov A.M., Hatfield K.<br />
xxv
Hybrid Sorbents on the Basis of Magne<strong>to</strong>-Active Nanoparticles and Humic<br />
Substances.....................................................................................................................525<br />
Zaripova A., Kydralieva K., Dzhardimalieva G., Pomogailo S., Golubeva N.,<br />
Pomogailo A., Jorobekova S.<br />
Preparation and Characterization of Biodiesel Industry Waste Partially<br />
Carbonized Material in Order <strong>to</strong> Produce an Organic Soil Conditioner....................529<br />
Mangrich A.S., Novotny E.H., Nicolini K.P., Bonagamba T.J., de Souza A.A.,<br />
de Azevedo E.R., Wypych F.<br />
Interaction of Modified Humic Substances with Np(V): Influence of Monomer<br />
Nature on Redox Properties of Humic Substances ....................................................533<br />
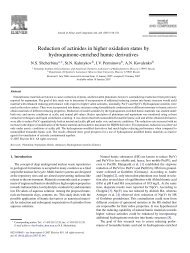
Shcherbina N.S., Perminova I.V., Bolkova A., Kovalenko A.N., Kalmykov S.N.,<br />
Petrosyan V.S.<br />
Microbial Oxidation of Humic Substances: Agricultural Consequences..................537<br />
Van T<strong>ru</strong>mp J.I., Jones N.N., Achenbach L.A., Coates J.D.<br />
TG Study of the γ-irradiation Effect on PVA with Addition of Sodium and<br />
Ammonium Salts of Humic Acids ................................................................................541<br />
Bakajová B., Pekař M., Ilčin M., Kučerík J.<br />
In vivo Algae Growth Moni<strong>to</strong>ring in Sea Water Containing Production Water<br />
Treated with Humic Compounds..................................................................................545<br />
Nunes R.A., Mauricio, M.H.P., Mauricio G.M., Brocchi E.A., Araújo M.A.V.<br />
New Mechanochemical and Cavitations Technology and Products Deep<br />
Chemical Modification of Peat......................................................................................549<br />
Efanov M., Galochkin A., Chernenko P., Novozhenov V.<br />
Effect of Humic and Fulvic Acids on the Anaerobic Hydrolysis of<br />
Lignocellulosic Biomass...............................................................................................553<br />
Fernandes T.V., Sciubidlo I., Sancho N.R., Blazquez A.P., Zeeman G., van Lier J.J.B.<br />
Pyrolysis of Biomass and the Genesis and Oxidations of the Chars .......................557<br />
Jordan M., Kwapinski W., Leahy L., Hayes M.H.B.<br />
Retention of Plu<strong>to</strong>nium on Model Kaolin-Humic Complexes.....................................561<br />
Kholodov V., Novikov A., Goriachenkova T., Kozinskaja I., Perminova I.<br />
Synthesis, Biological Activity and De<strong>to</strong>xifying Properties of Carbonylated<br />
Humic Substances.........................................................................................................563<br />
Li S., Kydralieva K., Kulikova N., Perminova I., Jorobekova S.<br />
Extraction and Characterization of Organic Fractions Isolated from a China<br />
Ball Clay Quarried in Devon South West England......................................................567<br />
McInerney R., Stuart J., Novotny E.H., Hayes M.H.B., Young K.<br />
Efficiency of Lignite as an Antioxidant for Polyolefines ............................................571<br />
Pekař M., Bakajová B., Kučerík J.<br />
xxvi
Mitigating Activity of Humic Substances and Their Si-enriched Derivatives in<br />
relation <strong>to</strong> Wheat Seedlings under Salt-Stress Condition..........................................573<br />
Philippova O.I., Kulikova N.A., Karpiouk L.A., Lebedeva G.F., Perminova I.V.<br />
Evaluation of the Quality Assurance of Ultrafiltration Separation for Humic<br />
Substances by Chemical Probes .................................................................................577<br />
Revchuk A.D., Suffet I.H.<br />
Results of a Study on Obtaining of the Humic Containing Plasticizers and<br />
Their Influence on the Physic-Mechanical Properties for the Cement and<br />
Concrete Mixtures .........................................................................................................581<br />
Sanjaasuren R., Nordov E., Erdenebat Ts., Norjinbadam S.<br />
Humic Substances as Stabilizing Agents for Superparamagnetic<br />
Nanoparticles .................................................................................................................585<br />
Chekanova A., Sorkina T., Dubov A., Goodilin E., Kulikova N., Perminova I.<br />
Sorption of Np(V) on<strong>to</strong> Hybrid Clay-Based Materials: Montmorillonite-<br />
Melanoidin ......................................................................................................................587<br />
Vicente Vilas V., de la Rosa S.R., Kratz J.V.<br />
Section V – Industrial production, standardization<br />
and innovative application of humic materials<br />
Primary Energy Production by Pho<strong>to</strong>reduced Humic Materials................................593<br />
Van T<strong>ru</strong>mp J.I., Coates J.D.<br />
Characterization of Organic and Organomineral Liquid Fertilizers...........................597<br />
Dominguez D.X., Benites V.M., Santa Maria L.C.D., Szpoganicz B., Simões M.L.<br />
Standardization and Legislative Regulations of Commercial Humic and<br />
Humic-Based Products .................................................................................................601<br />
Sequi P., Ciavatta C.<br />
A Perspective on over a Decade of On-Farm Research on the Influence of<br />
Humates Products on Crop Production.......................................................................603<br />
Seyedbagheri M.-M.<br />
Organogenic Waste Materials as Promising Metal Sorbents.....................................605<br />
Twardowska I., Janta-Koszuta K., Miszczak E., Stefaniak S.<br />
Commercial Humates: The Origin of Organic Matter and Its Environmental<br />
Role.................................................................................................................................607<br />
Yakimenko O., Lapenis A., Aranson J.<br />
Greenhouse Experiment on the Effect of Humic Substances on Solubilization<br />
of Ogun Phosphate Rock ..............................................................................................609<br />
Adesanwo O.O., Dunlevey J.N., Adetunji M.T., Diatta S., Osiname O.,<br />
Adesanwo J.K., Kolawole A.<br />
xxvii
St<strong>ru</strong>ctural Components and Biological Activity among Humic Substances of<br />
Low-Mineralized Silt Sulphide Muds............................................................................613<br />
Avvakumova N.P., Zhdanova A.V.<br />
Beneficial Effects of the Complex Humic Microfertilizer Applied <strong>to</strong> the<br />
Ornamental Plum Hessei...............................................................................................617<br />
Bezuglova O.S., Perminova I.V., Neganova N.M.<br />
Use of Natural and Modified Materials <strong>to</strong> Minimize Influence of Sulfide Tailings ....619<br />
Bogush A., Voronin V.<br />
Humic Acids of Brown Coals of the Russia South Far East: Extraction and<br />
Complexing Properties <strong>to</strong>ward Gold, Platinum, and Palladium ................................623<br />
Bratskaya S., Volk A., Ivanov V., Sukhoverkhov S., Avramenko V.<br />
Influence of Humics Containing Materials on Poinsettia Hydroponics ....................627<br />
Chakalov K., Popova T., Savov V., Angelova G.<br />
Thermal Analysis of Standard Humic Acids................................................................631<br />
Montecchio D., Francioso O., Gioacchini P., Ciavatta C.<br />
Pho<strong>to</strong>remediation Properties of Dissolved Organic Matter Extracted from<br />
Compost .........................................................................................................................635<br />
Coelho C., Ter Halle A., Guyot G., Richard C., Cavani L., Ciavatta C.<br />
Potentials of Technical Lignins for Application as Soil Amendments: Free<br />
Radical Scavengers and Biological Activity................................................................639<br />
Dizhbite T., Telysheva G., Bikovens O., Mutere O., Andersone A.<br />
Influence of Selected Conditions on Chemical Properties of Humic<br />
Substances Formed during Composting of Municipal Solid Wastes (MSW) ...........643<br />
Bekier J., Drozd J., Jerzykiewicz M.<br />
Effect of Potassium Humate on Advanced Pota<strong>to</strong> Cultivars for Water Deficit<br />
Tolerance in Ardabil Region, Iran.................................................................................647<br />
Hassanpanah D., Gurbanov E., Gadimov A., Shahriari R.<br />
Effect of Potassium Humate and Kadostim on Plantlets of Advanced<br />
Pota<strong>to</strong> CVs......................................................................................................................651<br />
Hassanpanah D., Gurbanov E., Gadimov A., Shahriari R.<br />
Effect of Potassium Humate on Production of Advanced Pota<strong>to</strong><br />
Mini-Tuber CVs ..............................................................................................................655<br />
Hassanpanah D., Gurbanov E., Gadimov A., Shahriari R.<br />
The Stimulation of Microorganisms Activity of Petropolluted Soils by Humic<br />
Preparations...................................................................................................................659<br />
Ivanov A., Maltzeva E., Yudina N., Svarovskaya L.<br />
Coal Biodegradation by Basidiomycetes for Production of Biofertilizers and<br />
Soil Conditioners ...........................................................................................................663<br />
Klein O., Stepanova E., Kulikova N., Koroleva O.<br />
xxviii
Influence of Humic Substances on the Foam Formation and Cy<strong>to</strong><strong>to</strong>xicity of<br />
Detergents ......................................................................................................................667<br />
Kloecking H.-P., Junek R., Kloecking R., Schoenherr J.I.<br />
Effect of Different Physiologically Active Substances in Conditions of<br />
Greenhouse Industrial Production...............................................................................671<br />
Komarov A., Karpenco V., Naida N.<br />
Efficacy of Silicious Lignin Products Application for Biological Agriculture<br />
Exemplified by Experiments with Red Clovers ...........................................................673<br />
Lebedeva G., Telysheva G., Tiltina L., Volperts A.<br />
Inhibi<strong>to</strong>ry Action of New Organic Substrates for Ornamental Plants and Their<br />
Humic Fractions on the Growth of the Phy<strong>to</strong>pathogenic Fungus Pythium<br />
ultimum...........................................................................................................................677<br />
Loffredo E., Berloco M., Senesi N.<br />
Artificial Humic Substances as Possible Compensa<strong>to</strong>rs of the Destroyed<br />
Links in Carbon Cycle ...................................................................................................681<br />
Nadporozhskaya M., Fedoros E., Shipov V.<br />
Isolation of Humic Substances from Underground Brine Water of Chiba,<br />
Southeast Japan ............................................................................................................685<br />
Ken N., Hideki E., Tatsuaki Y.<br />
Biotic Control of Humic Substances Eco<strong>to</strong>xicity and Their Remediation Effect<br />
in Contaminated Environment......................................................................................687<br />
Terekhova V., Poputnikova T., Fedoseeva E., Rakhleeva A., Vavilova V., Kaniskin M.,<br />
Timofeev M., Ibatullina I., Yakovlev A.<br />
Extraction and Exchange Behavior of Metal Species in Therapeutically<br />
Applied Peat Characterized by Competitive Extractants ...........................................691<br />
Romão L.P.C., Rosa A.H., Silva Â.A.M.J., Lobo F.A., Goveia D., Frace<strong>to</strong> L.F.,<br />
Rocha J.C., Burba P.<br />
Study of the Parameters that Influence on the Process of Alkaline Extraction<br />
of Humic Substances from Peat...................................................................................695<br />
Silva Â.A.M.J., Rosa A.H., Duarte J.G.C., Moretti J.P., Lobo F.A., Goveia D.,<br />
Frace<strong>to</strong> L.F., Rocha J.C., Romão L.P.C.<br />
Evaluation of Tropical Peat as a Potential Medium for Bioremediation of<br />
Vanadium........................................................................................................................699<br />
Cunha B.B., de Jesus A.M.D., Bellin I.C., Romão L.P.C., Rosa A.H.<br />
Influence of Soybean Chelates on Chemical and Biochemical Properties of<br />
Humic Substances from Biotransformed Lignite .......................................................703<br />
Savov V., Mi<strong>to</strong>v K., Chakalov K., Popova T., Angelova G.<br />
In Vitro Effect of Potassium Humate on Terminal Drought Tolerant Bread<br />
Wheat..............................................................................................................................707<br />
Shahriari R., Gurbanov E., Gadimov A., Hassanpanah D.<br />
xxix
The Effect of Bioaugmentation on the PCP Degradation in Soil Amended with<br />
Humic Acids ...................................................................................................................711<br />
Skokanová M., Dercová K.<br />
Application of White Rot Fungi for the Removal of Natural Organic Matter.............715<br />
Solarska S., Roddick F., Lawrie A.<br />
Synthesis and Use of Iron Humates for Correction of Iron Deficiency<br />
Chlorosis in Higher Plants ............................................................................................719<br />
Sorkina T.A., Kulikova N.A., Necvetay A.M., Philippova O.I., Lebedeva G.F.,<br />
Perminova I.V.<br />
Use of Soil Microorganisms for Producing Standard Samples of Humic Acids ......721<br />
Stepanov A., Zviagyntsev D., Lisak L., Shapovalov A., Putsykin Yu.<br />
Metabolic and Immune-Modulating Properties of Commercial Humic<br />
Preparations Produced from Peat................................................................................723<br />
Stepchenko L., Mihailenko E.<br />
Chemical and Plant Growth Stimula<strong>to</strong>ry Properties of Lignohumate .......................725<br />
Yakimenko O., Gladkov O., Poloskin R.<br />
New Express Technique for Determination of Antioxidant Activity of Humic<br />
Substances.....................................................................................................................727<br />
Yashin A.Ya., Fedin P.A., Perminova I.V.<br />
The Metal Ions Sorption by the Humic-Containing Anion Exchangers.....................729<br />
Mitchenko A., Mitchenko T., Makarova N., Shevchuk H.<br />
Humic Acids of Pelosilt (Sapropel) as Prospective Biogenic Stimula<strong>to</strong>rs<br />
for Medicine and Cosme<strong>to</strong>logy Use .............................................................................733<br />
Puntus F. A., Puntus A. F.<br />
Author Index...................................................................................................................737<br />
xxx
Section I<br />
Novel methods and approaches <strong>to</strong> molecular understanding<br />
of humic substances and natural organic matter
Agent-Based Modeling of Natural Organic Matter<br />
Steve Cabaniss<br />
Dept. Chemistry, University of New Mexico, Albuquerque, NM 87131 USA<br />
Keywords: humic, fulvic, model, s<strong>to</strong>chastic, agent-based model<br />
1. INTRODUCTION<br />
Two types of models for natural organic matter (NOM) are commonly in usest<strong>ru</strong>ctural<br />
and functional. St<strong>ru</strong>ctural models are a<strong>to</strong>mic connectivity maps- chemical<br />
st<strong>ru</strong>ctures- which may have been obtained from the experience and creativity of a<br />
researcher or group of researchers (1) or calculated from a set of analytical and st<strong>ru</strong>ctural<br />
constraints (2). Functional or predictive models are sets of equations which represent a<br />
specific aspect of NOM behavior, for example metal complexation (3) or the production of<br />
reaction oxygen species (4). Functional models are typically calibrated with experimental<br />
data from multiple NOM samples, and contain only average st<strong>ru</strong>ctural information (e.g. UV<br />
absorbance, MW) but no specific st<strong>ru</strong>ctures.<br />
In this talk, I will describe a third type of model, which represents individual molecules<br />
or pseudo-molecules as software agents. Each molecule behaves according <strong>to</strong> a set of<br />
chemically reasonable <strong>ru</strong>les, interacting with its environment and with other molecules<br />
over time.<br />
2. MATERIALS AND METHODS<br />
The agent-based model treats time as a discrete variable, advancing in steps of 0.1<br />
hours and using a pseudo-random number <strong>to</strong> determine whether a molecule reacts and, if<br />
so, how. Each molecule is represented by its elemental and functional group composition<br />
and by a series of reaction probabilities and properties calculated from the composition<br />
data and environmental variables. Environmental variables which influence the reaction<br />
probabilities include pH, moisture, dissolved oxygen, temperature, light, exo-enzyme<br />
activities, and bacterial density. The algorithm, including equations for probability<br />
calculation, has been previously published (5), as have estimation equations for various<br />
chemical properties (6). The AlphaStep desk<strong>to</strong>p version of the model was used in the<br />
simulations; it was programmed in Delphi version 6, and typical simulations of ~10,000<br />
molecules for 5 months of simulated time require
Reaction Count<br />
3. RESULTS AND DISCUSSION<br />
Using this agent-based model (ABM), we can simulate many aspects of NOM<br />
behavior, including elemental and functional group composition, size distribution,<br />
bioavailability <strong>to</strong> microbes, metal complexation and reactive transport. In addition, we can<br />
examine how specific environmental fac<strong>to</strong>rs can affect these behaviors- for example, how<br />
differences in precursors lead <strong>to</strong> differences in bioavailability, or how exposure <strong>to</strong> sunlight<br />
affects metal complexation.<br />
One advantage of the ABM is that we can simulate the evolution of humic<br />
substances from specific precursor molecules and observe not only changes in bulk<br />
properties (%C, MW n , etc.) but also the reactions leading <strong>to</strong> these changes. For example,<br />
Figure 1 shows how the production of –COOH groups lags the pho<strong>to</strong>lysis of conjugated<br />
alkenes in a simulation of protein and lignin fragments exposed <strong>to</strong> sunlight.<br />
300<br />
250<br />
200<br />
150<br />
100<br />
1400<br />
1200<br />
1000<br />
800<br />
600<br />
400<br />
50<br />
0<br />
200<br />
0<br />
0 1000 2000 3000 4000 5000<br />
Time (hours)<br />
Figure 1. Surface water incubation of biopolymers: Reaction counts per 50 hour interval for<br />
C=C oxidation <strong>to</strong> diol (squares, right Y axis), alcohol oxidation <strong>to</strong> aldehyde or ke<strong>to</strong>ne (X),<br />
aldehyde oxidation <strong>to</strong> -COOH (circles).<br />
Metal complexation is simulated a priori (without calibration on NOM) by combining<br />
the AlphaStep output (molecular st<strong>ru</strong>cture data) with a quantitative st<strong>ru</strong>cture-property<br />
relationship (QSPR) <strong>to</strong> predict a metal binding K’ for each molecule in the assemblage.<br />
These K’ values can then be used <strong>to</strong> calculate binding in solution of known NOM content<br />
(Fig. 2). The results are semi-quantitative, which is quite remarkable given that the model<br />
is not calibrated using any NOM complexation data.<br />
4
17<br />
16<br />
Cu(II) Binding Titration<br />
pCu<br />
15<br />
14<br />
13<br />
12<br />
11<br />
A priori model<br />
Xue and Sigg, 1993<br />
6 7 8 9<br />
pCu T<br />
Figure 2. An a priori simulation of metal complexation by aquatic NOM compared with CSV<br />
data from a Swiss lake (7).<br />
% C loss per day<br />
0.5<br />
0.4<br />
0.3<br />
0.2<br />
0.1<br />
0<br />
Microbial consumption rates<br />
W1S8<br />
Water<br />
W1S3<br />
1.2 1.25 1.3 1.35 1.4 1.45<br />
A<strong>to</strong>mic H:C<br />
Figure 3. Simulated microbial consumption from simulated aquatic NOM (Water) and NOM<br />
containing a mixture of aquatic and soil NOM (W1S8, W1S3).<br />
The agent-based model can also be used <strong>to</strong> examine ecological problems- for<br />
example, the counter-intuitive observation that reduced (high H:C) NOM can be more<br />
bioavailable <strong>to</strong> microbes than more oxygenated NOM (8). In the logical extreme, this<br />
suggests that hexane should be more bioavailable than sucrose! Another puzzling<br />
observation is the finding that in some ecosystems larger NOM appears more bioavailable<br />
than the smaller NOM (9). Possible explanations of these phenomena include higher<br />
energy content in larger, reduced NOM and lack of enzymes <strong>to</strong> degrade carbohydrates.<br />
5
Assuming that bacteria can only utilize small, at least partially oxygenated molecules,<br />
model simulations nonetheless show that in some cases more reduced NOM gives faster<br />
uptake rates (Figure 3) and that high MW NOM may be taken up more quickly than low<br />
MW material (data not shown). This demonstrates the presence of emergent properties<br />
arising from the complex humic mixture- overall behavior which appears <strong>to</strong> contradict the<br />
individual model <strong>ru</strong>les.<br />
4. CONCLUSIONS<br />
The ABM approach <strong>to</strong> the evolution of humic substances over time provides a<br />
comprehensive way of linking individual st<strong>ru</strong>cture and reactivity with macroscopic<br />
measurements and behaviors.<br />
ACKNOWLEDGEMENTS<br />
This research funded by NSF DEB 0113570. The author would like <strong>to</strong> thank<br />
G. Madey, P. Maurice, L. Leff and the memory of R. Wetzel, collaborating scientists on the<br />
project.<br />
REFERENCES<br />
1. Leenheer, J.A., Wershaw, R.L., Reddy, M.M. 1995. Environ. Sci. Technol. 29, 399-405.<br />
2. Diallo, M.S., Simpson, A., Gassman, P., Faulon, J.L., Johnson, J.H., Goddard, W.A., Hatcher,<br />
P.G. 2003. Environ. Sci. Technol. 37, 1783-1793.<br />
3. Tipping, E. Cation Binding by Humic Substances, 2005. Cambridge University Press,<br />
Cambridge, England, 444 pp.<br />
4. Hoigné, J. 1990. In: Aquatic chemical kinetics, W. Stumm, ed. John Wiley & Sons pp. 43-70.<br />
5. Cabaniss, S.E., Madey, G., Leff, L., Maurice, P.A., Wetzel, R.G. 2005. Biogeochem. 76, 319-<br />
347.<br />
6. Cabaniss, S.E.; Madey, G.; Leff, L.; Maurice, P.A.; Wetzel, R.G. 2007. Biogeochem. 86, 269-<br />
286.<br />
7. Xue H.B., Sigg L.L. 1993. Free cupric ion concentration and Cu(II) speciation in a eutrophic<br />
lake. Limnol. Oceanog. 38 1200-1213.<br />
8. Sun, L., Perdue, E.M., Meyer, J.L., and Weis, J. (1997) Use of elemental composition <strong>to</strong><br />
predict bioavailability of dissolved organic matter in a Georgia river Limnol. Oceanog. 42: 714-<br />
721.<br />
9. Amon, R.M.W. and Benner, R. (1996) Bacterial utilization of different size classes of dissolved<br />
organic matter Limnol. Oceanog. 41, 41-51.<br />
6
Probing Local pH in Hydrophobic Domains of Humic Acids:<br />
An EPR Based Method<br />
Yiannis Deligiannakis 1 , Kostantinos Chris<strong>to</strong>foridis 1 , Marios Drosos 1 , Lev Weiner 2<br />
1 Lab of Physical Chemistry, Dept. of Environmental & Natural Resources Management, Greece,<br />
ideligia@cc.uoi.gr<br />
2 Weizmann Institute of Sciences, Rehovot, Israel<br />
Keywords: humic, radical, local pH, spin probe, EPR<br />
1. INTRODUCTION<br />
Despite the focused efforts by many labs during the last 30 years, vital aspects of the<br />
st<strong>ru</strong>cture and fundamental physicochemical aspects of Humic Acids (HA) are largely<br />
unknown. It is currently accepted that humic acids contain both hydrophilic as well as<br />
hydrophobic domains which are the locus of sequestration of xenobiotic molecules.<br />
However vital information on the detailed nature, the accessibility of the hydrophobic<br />
domains is lacking.<br />
On the other hand, HA behave as polyelectrolytes which bear variable charge<br />
modulated by pH. It is considered that this pH-dependent charge is modulated by the local<br />
pKa of the chargeable st<strong>ru</strong>ctural groups i.e. carboxylates and phenolics. Traditionally only<br />
the water accessible hydrophilic fraction of the chargeable groups can be probed by H-<br />
binding or metal binding studies. However the function of chargeable groups in<br />
hydrophobic domains, local pKa, and their geometrical location are largely unknown.<br />
In this context we have developed a novel methodology by using the Spin-Probe<br />
method with Electron Paramagnetic Resonance (EPR) spectroscopy. A series of specific<br />
spin-probes with varying hydrophobicity as well as pH sensitivity were used and studied<br />
with EPR spectroscopy. The experiments were carried out in well characterized HA<br />
samples of varying molecular weight providing information of the local environment of the<br />
spin-probes, their mobility, and local pKa values.<br />
2. MATERIALS AND METHODS<br />
The interaction between three pH-sensitive nitroxide spin probes with humic acid was<br />
studied by X-band EPR spectroscopy. The humic acid sample was isolated using standard<br />
extraction procedures recommended by the International Humic Substances Society (2).<br />
The EPR experiments were carried out at acidic, neutral and alkaline pH values. At each<br />
7
pH a spin probe with appropriate pK value was used. The time dependence of the EPR<br />
spect<strong>ru</strong>m of the spin probe was moni<strong>to</strong>red at room temperature.<br />
3. RESULTS AND DISCUSSION<br />
Several humic acid samples were prepared and incubated at different pH values. A<br />
detailed pH titration was performed for each nitroxide spin probe and studied with EPR<br />
spectroscopy in the presence and absence of humic acid. In the absence of humic acid,<br />
buffered solutions were used <strong>to</strong> fix the pH at the desired values. A pKa shift of the spin<br />
probe was observed in the presence of humic acid in two of the three cases studied.<br />
Figure 1 shows a detailed pH titration of a spin probe in the presence and absence of<br />
humic acid. The shift of pKa of the spin probe molecule from pKa = 8.8 <strong>to</strong> pKa = 9.2 in the<br />
presence of humic acid was observed. This result illustrates the difference of the local pH<br />
value in the hydrophobic interior of humic macromolecule with respect <strong>to</strong> the pH value of<br />
the aqueous solution.<br />
16.0<br />
15.8<br />
With humic acid<br />
Without humic acid<br />
15.6<br />
15.4<br />
HPF (G)<br />
15.2<br />
15.0<br />
14.8<br />
14.6<br />
14.4<br />
14.2<br />
8.0 8.5 9.0 9.5 10.0 10.5<br />
pH<br />
Figure 1. pH titration of a spin probe in the absence (pKa = 8.8, dashed line) and in the<br />
presence of humic acid (pKa = 9.2, solid line).<br />
This is the first demonstration of the applicability of the pH-sensitive spin probe<br />
method for this type of macromolecules.<br />
8
In each experiment, the intensity of the EPR signal of the spin probe was moni<strong>to</strong>red<br />
as a function of time. In the presence of humic acid the time dependent increase of the<br />
anisotropy of the spin probe spect<strong>ru</strong>m was observed. This trend was not observed in the<br />
absence of humic acid. This increase may be attributed <strong>to</strong> the penetration of the spin<br />
probe <strong>to</strong> the hydrophobic regions of the macromolecule.<br />
The time dependent decrease of the intensity of the spin probe's EPR signal was<br />
also moni<strong>to</strong>red. This could be explained by the reduction of nitroxyl radical <strong>to</strong> EPR-silent<br />
hydroxylamine. This reduction is most likely induced by the phenol-type indigenous free<br />
radicals presented in humic acids (3).<br />
3290 3300 3310 3320 3330 3340<br />
Magnetic Field (G)<br />
Figure 2. Reduction of the spin probe by humic acid as a function of time. Incubation time:<br />
solid line t = 10 min, dashed line t = 60 min.<br />
4. CONCLUSIONS<br />
A systematic study of the local pKa and redox characteristics can be performed by<br />
using pH-sensitive-hydrophobic spin probes and EPR spectroscopy. This pro<strong>to</strong>col can<br />
provide accurate information on the physicochemical properties of the hydrophobic<br />
domains of HA not accessible by water nor by water soluble probes i.e. metals, H + . In<br />
addition, the acknowledged sensitivity of spin-probes can be exploited <strong>to</strong> map colloidal<br />
properties and aggregation phenomena in HA.<br />
9
ACKNOWLEDGEMENTS<br />
This work was supported by a COST-P15 STSM Grant [ COST-STSM-P15-03176].<br />
REFERENCES<br />
1. Weiner, L.M. 2007. Stable Nitroxyl Radicals as pH, Thiol and Electron Transfer Probes, Appl.<br />
Magn. Reson. 31,357-373.<br />
2. Swift, R.S. 1996. Organic matter characterization. In: Methods of Soil Analysis: Part 3,<br />
Chemical Methods (eds D.L. Sparks, J.M. Bartels & J.M. Bigham), Soil Science Society of<br />
America, Madison, WI, pp. 1018-1020.<br />
3. Chris<strong>to</strong>foridis, K.C.; Un, S.; Deligiannakis, Y. 2007. High-Field 285 GHz Electron<br />
Paramagnetic Resonance Study of Indigenous Radicals of Humic Acids, J. Phys. Chem. A.<br />
111, 11860-11866.<br />
10
Study on Self-Assembling Mechanism of IHSS Humic and Fulvic<br />
Standards<br />
Martin Drastík, Anna Čtvrtníčková, Jiří Kučerík<br />
Institute of Physical and Applied Chemistry, Faculty of Chemistry, Brno University of Technology,<br />
Purkyňova 118, 612 00 Brno, Czech Republic, kucerik@fch.vutbr.cz<br />
Keywords: IHHS humic and fulvic standards, aggregation mechanisms, HRUS<br />
1. INTRODUCTION<br />
Humic substances (HS) are ubiqui<strong>to</strong>us and also the most occurring organic matter on<br />
the Earth. They can be generally characterized as yellow <strong>to</strong> black mixture of compounds<br />
rich in oxygen-containing functional groups (carboxyl group -COOH; phenolic and alcoholic<br />
-OH group; ke<strong>to</strong>nic and quinoic -C=O group) which are bound on both aromatic and<br />
aliphatic carbon skele<strong>to</strong>n. Due <strong>to</strong> their high heterogeneity and chemical character they<br />
tend <strong>to</strong> self-aggregate forming various molecular organisations. The knowledge on the<br />
aggregates mass and nature is of a great importance since the mass of aggregates<br />
influences the function of HS in nature (e.g. in case of higher plants low molecular weight<br />
components of HS were shown <strong>to</strong> be particularly active (1) while high molecular mass<br />
components have only residual activity (2)).<br />
Despite an intensive research on humic substances, the mechanism and way of<br />
aggregation is still not precisely known. There are several views and works claiming that<br />
humic substances exhibit the critical micelle concentration (CMC). This view supposes that<br />
amphiphilic molecules exist solely as single unit species at concentrations lower than the<br />
CMC, whereas at higher concentration ordered aggregates or micelles are formed.<br />
Wershaw (3) proposed that interactions playing role in aggregation are mainly hydrophobic<br />
(π–π and charge transfer) and H bonds. Character of prevailing interactions strongly<br />
depends on pH and ionic strength of solution (4). Von Wand<strong>ru</strong>szka (5) demonstrated the<br />
existence of submicellar aggregates at concentration under supposed CMC (i.e. under<br />
2 g L –1 ). These conclusions were confirmed by Kučerík et al. (4) who observed<br />
aggregation of lignite humic acids even at concentration approximately 0.001 g L –1 . Similar<br />
results have surprisingly been obtained also at elevated pH and at high ionic strength<br />
although such conditions are not supposed <strong>to</strong> be supportive for self-aggregation of<br />
amphiphilic molecules (4).<br />
The aim of this work was <strong>to</strong> bring new insights in<strong>to</strong> aggregation mechanisms of<br />
several HS standards obtained from the International Humic Substance Society (IHSS)<br />
11
employing the high resolution ultrasonic spectroscopy (HRUS). The behaviour of sodium<br />
salts of humic and fulvic acids (NaHA, NaFA) was investigated from very low concentration<br />
(0.001 g L –1 ) up <strong>to</strong> 3.5 g L –1 .<br />
2. MATERIALS AND METHODS<br />
HS standards (Table 1) were purchased from IHSS, titrated <strong>to</strong> pH 7.5 with<br />
0.1 M NaOH in au<strong>to</strong>matic titra<strong>to</strong>r (Schott, TitroLine Alpha Plus). After a constant value was<br />
reached for 60 min, the sodium humate solution was filtered and freeze-dried. The product<br />
was milled in an agate mortar and s<strong>to</strong>red at room temperature in a sealed container.<br />
Table 1. Examined IHSS humic and fulvic standards<br />
1S104H-5 2S102F 2S101H 1S103H<br />
Leonardite Humic<br />
Acid Standard<br />
Elliott Soil Fulvic<br />
Acid Standard II<br />
Suwannee River<br />
Humic Acid Standard II<br />
Florida Peat Humic<br />
Acid Standard<br />
For moni<strong>to</strong>ring ultrasonic velocity and attenuation a HRUS102 device (Ultrasonic-<br />
Scientific) was employed. It consists of two independent quartz cells tempered by a water<br />
bath; cell 1 serves as sample cell and cell 2 as reference. All experiments were carried out<br />
at 25.00 ± 0.02°C, under constant stirring (600 rpm) and at 8 different frequencies. The<br />
resolution of the spectrometer is down <strong>to</strong> 10 –5 % for ultrasonic velocity and 0.2% for<br />
attenuation measurement. NaHA and NaFA were dissolved in deionised water <strong>to</strong> obtain<br />
concentrations of 1, 5 and 10 g L –1 , respectively. In order <strong>to</strong> assess mechanism of<br />
aggregation, 1 mL of deionised water was added <strong>to</strong> each cell. The solution in cell 1 was<br />
added stepwise every 10 min (i.e. when constant ultrasound velocity values were<br />
achieved) with prepared NaHA or NaFA solutions.<br />
The concentration increment in the ultrasonic velocity A was calculated from the<br />
equation (6):<br />
U1<br />
− U2<br />
A ≅<br />
U ⋅ c ⋅ ρ<br />
2<br />
0<br />
where U 1 and U 2 are the values of ultrasonic velocity in solution and solvent, respectively,<br />
c is the weight concentration of the solute and ρ 0 is the density of the solvent. A is<br />
determined by the compressibility of water in the hydration shell of the solute molecules<br />
and, in the case of molecular aggregates, by their intrinsic compressibility (7).<br />
12
3. RESULTS AND DISCUSSION<br />
HRUS has become a powerful <strong>to</strong>ol in colloidal chemistry due <strong>to</strong> its sensitivity <strong>to</strong><br />
moni<strong>to</strong>r any conformational change in a solution under study. Figure 1 reports the<br />
dependence of A on concentration of NaHA and NaFA. Constant value of A can be<br />
observed when molecules are freely dissolved in the solution (i.e. do not form aggregates).<br />
When CMC is reached, change of the concentration increment in the ultrasonic velocity A<br />
occurs, which indicates interaction among molecules (i.e. aggregates formation) (7). It is in<br />
line with our previous observation that humic molecules tend <strong>to</strong> aggregate also in diluted<br />
solutions at concentrations significantly lower than concentrations reported as critical<br />
micelle concentration (typically in range 2-10 g L –1 ) (4).<br />
Figure 1. Dependence of ultrasonic velocity increment on concentration.<br />
Extrapolation of obtained dependences <strong>to</strong> infinite dilution has been published as a<br />
measure of affinity of molecules <strong>to</strong> stuck <strong>to</strong> each other (7). As it can be seen, the highest<br />
increase at infinite dilution gave the lignite humic acid sample (1S104H-5). On the other<br />
hand, the lowest affinity showed sample Suwannee River (2S101H). It is in accordance<br />
with the chemical character of that sample, i.e. ratio of aliphatic/aromatic C distribution (cf.<br />
web page IHSS). In fact, our data are in line with the E4/E6 ratio traditionally interpreted as<br />
13
a degree of humification. It is noteworthy that results obtained from ultrasonic<br />
measurement, which is based on completely different principle, are in compliance with<br />
optical methods.<br />
Furthermore, ultrasound velocity was measured at 8 different frequencies and at all<br />
frequencies did not differ, which implies that although humic molecules aggregate, the<br />
compressibility of resulted organizations do not decrease the ultrasonic velocity. Ultrasonic<br />
waving is mechanical in nature and causes compression and decompression of present<br />
aggregates. Therefore if no decrease in ultrasonic velocity was observed, formation of<br />
spherical, i.e. highly compressible micelles, or micelle-like aggregates can be excluded.<br />
4. CONCLUSIONS<br />
High resolution ultrasonic spectroscopy can be used <strong>to</strong> study assembling mechanism<br />
of several systems including humic substances solutions. Sodium salts of humic and fulvic<br />
acids self-aggregate from low concentrations but form only small associates and no<br />
micelle-like st<strong>ru</strong>ctures occur.<br />
ACKNOWLEDGEMENTS<br />
The financial support of Ministry of Education of the Czech Republic, project MSM<br />
0021630501 and Grant Agency project number GA 104/08/0990 are acknowledged.<br />
REFERENCES<br />
1. Vaughan, D., 1967. Effect of humic acid on the development of invertase activity in slices of<br />
beetroot tissues washed under aseptic conditions. <strong>Humus</strong> et Planta IV, pp. 268-271.<br />
2. Ladd, J.M., Butler, J.H.A., 1971. Inhibition and stimulation of proteolytic enzyme activities by<br />
soil humic acids. Australian Journal of Soil Research 7, pp. 253-261.<br />
3. Wershaw, R.L., 1986. A new model for humic materials and their interactions with hydrophobic<br />
chemicals in soil–water and sediment–water systems. Journal of Contaminant Hydrology 1,<br />
pp. 29-45.<br />
4. Kučerík, J., Šmejkalová, D., Čechlovská, H., Pekař, M., 2007. New insights in<strong>to</strong> aggregation<br />
and conformational behaviour of humic substances: Application of high resolution ultrasonic<br />
spectroscopy. Organic Geochemistry 38, pp.2098-2110.<br />
5. Engebretson, R.R., von Wand<strong>ru</strong>szka, R., 1994. Microorganization of dissolved humic acids.<br />
Environmental Science and Technology 28, pp. 1934-1941.<br />
6. Kankia, B.I., Funck, T., Uedaira, H., Buckin, V., 1997. Volume and compressibility effects in<br />
the formation of metal-EDTA complexes. Journal of Solution Chemistry 26, pp. 877-888.<br />
7. Buckin, V., Kudryashov, E., Morrissey, S., Kapustina, T., Dawson, K., 1998. Do surfactants<br />
form micelles on the surface of DNA? Progress in Colloid Polymer Science 110, pp. 214-219.<br />
14
Multiple Charged Constituents in Suwannee River Natural Organic<br />
Matter<br />
Andras Gaspar 1 , Erast V. Kunenkov 2 , Richard Lock 3 , Michael Desor 4 , Irina Perminova 2 ,<br />
Philippe Schmitt-Kopplin 1<br />
1 Institute of Ecological Chemistry, Helmholtz Zent<strong>ru</strong>m München, German Research Center for<br />
Environmental Health, andras.gaspar@helmholtz-muenchen.de<br />
2 Organic Chemistry Division, Department of Chemistry, Lomonosov Moscow State University,<br />
Leninskie Gory 1-3, 119992 Moscow, Russia<br />
3 Waters Corporation, Atlas Park, Simonsway Manchester, M22 5PP<br />
4 Waters GmbH, Helfmann-Park 10, Eschborn 65760 Germany<br />
Keywords: organic matter, FTICR/MS, Ion mobility MS, charge state, molecular formulas<br />
1. INTRODUCTION<br />
Natural organic matters are complex biogeochemical non-repetitive materials existing<br />
in such a vast amount, that their quantity easily exceed the amount of functional<br />
biomolecules (1, 2). And furthermore their continuous reformation, degradation and<br />
diagenesis, which are governed by the rather fundamental restrains of thermodynamics<br />
and kinetics, result their extreme intricacy. Therefore the molecular level understanding of<br />
such supermixtures is extremely difficult. However the proper characterization of such a<br />
vast system is feasible only if minimal–invasive sampling techniques (3,4) and afterwards<br />
several high-end analytical techniques are combined, since generally applied methods, for<br />
instance elemental analysis, IR spectroscopy describe them only with an averaged<br />
characteristic (5). To verify this, surplus information were presented here, by utilizing FT-<br />
ICR/MS and Q-TOF-IM/MS and integrated mathematical data analysis. FT-ICR<br />
measurements give sufficient mass accuracy and resolution even in broadband mode (6),<br />
enabling postulate exact molecular formulae and determine the charge-state (a singly (or<br />
doubly) charged 13 C 12 C n-1 ion will be higher in m/z by 1 (or 0.5) than the corresponding<br />
12 C n nuclide). Therefore application of such a method <strong>to</strong> resolve and describe individual<br />
humic constituents is preferable. Despite of ultra-high resolution, non-adequate settings of<br />
any kind of experimental settings might mislead the general result of the characterization<br />
(7-9). Since the occurrences of poly-carboxylic acids and -hydroxyl groups, and their<br />
relative high abundances had been shown in these type of mixtures (10-12), the formation<br />
of multiply charged negative ions in the ESI experiments would have been expected.<br />
Though it should be noted, that the denoted properties of large molecules might change<br />
15
during their transformation from polyelectrolyte state in solution <strong>to</strong> the detected ions in the<br />
gas phase. On the other hand, till now, the presence of probable multiple charged<br />
constituents were only assumed, moreover sometimes depicted as “bumps”, but without<br />
further details (9, 13).<br />
2. MATERIALS AND METHODS<br />
The sample, SRDOM was dissolved in methanol directly before the analysis. Ultrahigh<br />
resolution mass spectra of the sample, was acquired at the Helmholtz Zent<strong>ru</strong>m<br />
München with a B<strong>ru</strong>ker APEX Qe Fourier transform mass spectrometer (FTICR-MS)<br />
equipped with a 12 Tesla superconducting magnet and an Apollo II electrospray source.<br />
The sample was injected with direct infusion with the flow rate of 2 μL/min. The spect<strong>ru</strong>m<br />
was obtained in negative mode with the number of data points per measurements of 4 MW<br />
(time domain size) with the typical resolution of 5*10 5 . The number of scans was 11000 for<br />
1 μg/mL sample concentration. The spect<strong>ru</strong>m was externally calibrated on arginin clusters<br />
and then internally recalibrated with fatty acids. Once the exact masses of the molecules<br />
had been determined, their molecular formulae were batch-calculated by a software <strong>to</strong>ol,<br />
written in-house and provided by E.V. Kunenkov. Ion mobility (IM) measurements were<br />
carried out in negative modus, on a Waters Synapt High Definition MS system in the<br />
Waters Application Labora<strong>to</strong>ry (Manchester).<br />
3. RESULTS AND DISCUSSION<br />
Herein, the obtained high resolution mass spectra of SRDOM (Suwannee river<br />
dissolved organic matter) and SRFA (Suwannee river fulvic acid) revealed beside the<br />
usually characterized single charged constituents further multiple charged species, and<br />
were described for the first time. In the spect<strong>ru</strong>m of 1µg/mL SRDOM, beside the regular<br />
pattern of singly charged nominal masses, a second series with 0.5 Da mass width,<br />
between 250-560 m/z mass range were visible. Since ESI negative ion 12 Tesla FTICR<br />
mass spectra of SRDOM resolved over 120.000 peaks, with the average resolution of<br />
≥ 300.000 molecular formula assignment with a software <strong>to</strong>ol, written in-house, with less<br />
than 0.5 ppm was possible, resulting over 6000 assigned molecular formulae. The most<br />
significant mass differences between C c H h O o N n S s and 13 CC c-1 H h O o N n S s were Δm = 1 Da<br />
(singly charged) and 0.5 Da (doubly charged). Afterwards, the charge sorted constituents<br />
were plotted based on their H/C and O/C elemental ratios in van Krevelen diagrams.<br />
The peculiar presentation of assigned molecular formulas, enables <strong>to</strong> individually<br />
describe certain st<strong>ru</strong>ctural properties of the observed constituents within this<br />
16
supermixtures. Although we have <strong>to</strong> note that, in several cases, differentiation between<br />
-<br />
charge states were not possible since constituents with C x H y O z and C 2x H 2y O 2- 2z elemental<br />
composition, denote the same position in the van Krevelen diagram. But still, one of the<br />
most remarkable difference between charge states is that, molecules assigned as doubly<br />
charged, are densely situated in higher O/C field than the single charged ones.<br />
Beside FTICR measurements, ion mobility experiments were also conducted in order<br />
<strong>to</strong> support the observed results (14). SR DOM sample were injected without preliminary<br />
separation in different concentration (100-0.5 μg/mL) resulted similar results independent<br />
of the applied concentration. ESI negative ion TOF-Ion Mobility mass spectra and drift time<br />
vs. m/z distribution of SRDOM, obtained on Synapt HDMS system, confirmed also the<br />
existence of multiple-charged constituents through visible separation of molecules, based<br />
on their charge-states. In the drift map, at least two distribution of ions were presented:<br />
group of doubly charged constituents with shorter drift time and a group of singly charged<br />
molecules with longer drift time.<br />
The efficiency of an au<strong>to</strong>mated formula assignment, developed by E. V. Kunenkov,<br />
was also tested successfully. For this purpose, beside the complete FTICR mass spectra,<br />
an expanded m/z region of 348.8-350.6 was selected, and the possible molecular formulas<br />
were individually assigned (51 constituents, belonged <strong>to</strong> 10 different series), with built in<br />
software of B<strong>ru</strong>ker Data Analysis 3.4). Mass accuracy for all assignments were ≤ 90 ppb.<br />
4. CONCLUSIONS<br />
Overall, our results show for the first time that expanded and carefully selected<br />
experimental (measurement and data analysis) settings and combined high-end analytical<br />
<strong>to</strong>ols can eventuate the extension of the existing knowledge on molecular level<br />
understanding of such a supermixtures.<br />
REFERENCES<br />
1. Hedges, J. I.; Oades, J. M. 1997, Org. Geochem., 27, 319-361.<br />
2. Vandenbroucke, M.; Largeau, C. 2007, Org. Geochem., 38, 719-833.<br />
3. Davis, J.; Benner, R. 2005, Deep-Sea Research Part II-Topical Studies in Oceanography 52,<br />
3396-3410.<br />
4. Benner, R.; Biddanda, B.; Black, B.; McCarthy, M. 1997 Mar. Chem., 57, 243-263.<br />
5. Hertkorn, N.; Ruecker, C.; Meringer, M.; Gugisch, R.; <strong>From</strong>mberger, M.; Perdue, E. M.; Witt,<br />
M.; Schmitt-Kopplin, P. 2007, Anal. and Bioanal. Chem., 389, 1311-1327.<br />
6. Kim, S.; Rodgers, R. P.; Marshall, A. G. 2006, Int. J. of Mass Spectrom., 251, 260-265.<br />
7. McIntyre, C.; McRae, C. 2005, Org. Geochem. 36, 543-553.<br />
17
8. Kujawinski, E. B.; Hatcher, P. G.; Freitas, M. A. 2002, Anal. Chem. 74, 413-419.<br />
9. Brown, T. L.; Rice, J. A. 2000, Anal. Chem. 72, 384-390.<br />
10. Hertkorn, N.; Benner, R.; <strong>From</strong>mberger, M.; Schmitt-Kopplin, P.; Witt, M.; Kaiser, K.; Kett<strong>ru</strong>p,<br />
A.; Hedges, J. I. 2006, Geochim. Et Cosmochim. Acta 70, 2990-3010.<br />
11. Ritchie, J. D.; Perdue, E. M. 2003, Geochim. Et Cosmochim. Acta 67, 85-96.<br />
12. Perdue, E. M. 1985, In Humic substances in soil sediment and water. Geochemistry, isolation<br />
and characterisation; Aiken, G. R., McKnight, D. M., Wershaw, R. L., MacCarthy, P., Eds.;<br />
Wiley-Interscience: New York, pp 493-526.<br />
13. Stenson, A. C.; Landing, W. M.; Marshall, A. G.; Cooper, W. T. 2002, Anal. Chem. 74, 4397-<br />
4409.<br />
14. Kanu, A. B.; Dwivedi, P.; Tam, M.; Matz, L.; Hill Jr., H. H. 2008, J. of Mass Spectrom. 43, 1-22.<br />
18
Depicting <strong>Molecular</strong> Dissimilarity in Complex Materials<br />
Norbert Hertkorn 1 , M. <strong>From</strong>mberger 1 , Ph. Schmitt-Kopplin 1 , E. M. Perdue 2<br />
1 Institute of Ecological Chemistry, Helmholtz Zent<strong>ru</strong>m Muenchen, German Research Center for<br />
Environmental Health, Ingolstaedter Landstrasse 1, D-85764 Neuherberg, Germany,<br />
hertkorn@helmholtz-muenchen.de<br />
2 School of Earth and Atmospheric Sciences, Georgia Institute of Technology, Atlanta, Georgia,<br />
30332, USA<br />
Keywords: NOM, compositional space, intrinsic averaging, isomers, complexity<br />
1. INTRODUCTION<br />
Natural complex organic materials if classified by their means of synthesis and<br />
function divide in<strong>to</strong> discrete molecules which often derive from genetic codes that can be<br />
fractionated in<strong>to</strong> unambiguously defined molecular fractions within the scope of current<br />
high-performance separation technology, and complex non-repetitive materials which<br />
cannot be purified in the conventional meaning of purity because of even higher intricacy.<br />
The fate of this vast group of molecules in the bio- and geosphere is governed<br />
according <strong>to</strong> the rather fundamental restraints of thermodynamics and kinetics. In these<br />
intricate materials, the “classical” signatures of the (often ultimately biotic) precursor<br />
molecules, like lipids, glycans, proteins have been attenuated, often beyond recognition,<br />
during a succession of biotic and abiotic (e.g. pho<strong>to</strong>- and redox chemistry) reactions (1).<br />
Because of this loss of biochemical signature, these materials can be designated nonrepetitive<br />
complex systems. Examples include freshwater, marine, and soil organic matter,<br />
kerogens and aerosols, among others.<br />
2. MATERIALS AND METHODS<br />
The findings mentioned here have been derived over several years from multinuclear<br />
high-field (11.7 T) NMR spectra and high-field (9.4 and 12 T) FTICR mass spectra of<br />
natural organic matter (NOM) samples of terrestrial, freshwater and marine origin.<br />
3. RESULTS AND DISCUSSION<br />
The current perception of natural organic matter (NOM) molecular st<strong>ru</strong>cture is defined<br />
by the available analytical methods, which typically depict data-reduced projections of the<br />
chemical st<strong>ru</strong>cture space (i. e., the complement of all chemical st<strong>ru</strong>ctures present in NOM).<br />
Related <strong>to</strong> the t<strong>ru</strong>e molecular diversity of NOM, the extent of data reduction encountered in<br />
any spectra or chroma<strong>to</strong>grams always ranges in the extremes. Accordingly, severe<br />
intrinsic averaging, caused by a non-avoidable, massive signal overlap masks molecularlevel<br />
alterations of NOM in any standard analytical technique. For similar reasons, bulk<br />
properties of NOM, like elemental ratios and acidity, regularly fall within remarkably narrow<br />
ranges (Figure 1).<br />
19
Figure 1. Information transfer in organic st<strong>ru</strong>ctural spectroscopy.<br />
The images depicted here define a three dimensional space composed of the area of<br />
the image (pixel resolution in x- and y-axes) and the depth of the color space. This threedimensional<br />
space offers n options <strong>to</strong> depict dissimilarity (n = x * y * color-depth). Only at<br />
considerable extent of information, significant resolution is attained <strong>to</strong> enable meaningful<br />
assessment of data; otherwise, intrinsic averaging precludes meaningful interpretation.<br />
See reference 1 for color image and relationships <strong>to</strong> resolution in separation and<br />
spectroscopic methods.<br />
Figure 2.<br />
20
<strong>Molecular</strong> level precision analytical data represent projections of the vast <strong>to</strong>tal<br />
st<strong>ru</strong>cture space of molecules, for which count estimates range from 10 60 <strong>to</strong> 10 200 . Mass<br />
spectra reflect the isomer-filtered complement of the entire space of these molecular<br />
st<strong>ru</strong>ctures. The compositional space of molecules can be probed with current ultrahighresolution<br />
FTICR mass spectroscopy, resulting in molecular signatures (i.e. single peaks<br />
for molecules in absence of fragmentation). NMR spectra represent site- and iso<strong>to</strong>pespecific<br />
projections within molecular environments. These a<strong>to</strong>mic signatures provide<br />
unsurpassed detail about short range molecular order. <strong>Molecular</strong> signatures (arrangement<br />
of chemical bonds including connectivities, stereochemistry and spatial proximity) can be<br />
assembled from NMR data by use of complementary multinuclear 1,2,3D NMR<br />
experiments, obtainable from a single sample. Reconst<strong>ru</strong>ction of chemical st<strong>ru</strong>ctures from<br />
NMR and MS data is available by back-projection, which in case of mixture analysis is<br />
commonly preceded by separation (Figure 3).<br />
Figure 3.<br />
The currently accessible discrete and quantized analytical voxel space <strong>to</strong> describe<br />
complex systems in the range of 10 8-14 voxels is defined by the significant resolution of the<br />
complementary techniques NMR (depicting short range order within and among<br />
molecules), FTICR mass spectrometry (depicting molecular mass and formulae of gasphase<br />
ions) and high-performance separation (depict capacity <strong>to</strong> investigate both ions and<br />
molecules) and therefore capable <strong>to</strong> provide the necessary detail for a meaningful<br />
molecular level analysis of very complex mixtures. The various projections of this bucket<br />
space, like separation / MS, separation / NMR and NMR / MS can be realized in the form<br />
of direct hyphenation and via mathematical analysis of (these correlated) data sets.<br />
21
The availability of high-resolution organic st<strong>ru</strong>ctural spectroscopy has the capacity <strong>to</strong><br />
advance c<strong>ru</strong>cial paradigm shifts in the molecular-level analysis of NOM. The combined use<br />
of NMR spectroscopy and FTICR mass spectrometry has enabled the identification of<br />
CRAM (carboxyl-rich alicyclic molecules) as major constituents of marine organic matter<br />
(2). The occurrence of CRAM in freshwater and terrestrial environments seems likely,<br />
considering the global distribution of biomolecules and the similarities of biogeochemical<br />
processes among environments (3). Another recent study has revealed a near complete<br />
turnover of groundwater fulvic acids within decades in a karst aquifer (4), even in absence<br />
of the two key abiotic degradation pathways, pho<strong>to</strong>- and redox chemistry. Again, these<br />
extraordinary molecular-level st<strong>ru</strong>ctural alterations were only revealed by highperformance<br />
non-target organic st<strong>ru</strong>ctural spectroscopy. Even fairly advanced analytical<br />
<strong>to</strong>ols at the level of standard 13C-CP/MAS solid-state spectroscopy and unit-resolution<br />
mass spectrometry would have failed <strong>to</strong> detect these extensive changes because of<br />
intrinsic averaging (5).<br />
Based on this novel perspective, molecular level alterations of such magnitude and<br />
swiftness must be considered as commonplace in the processing of “refrac<strong>to</strong>ry” NOM,<br />
which then has <strong>to</strong> be perceived, in contrast <strong>to</strong> conventional wisdom, as a rather more<br />
active participant in the global carbon cycle.<br />
4. CONCLUSIONS<br />
High-resolution organic st<strong>ru</strong>ctural spectroscopy has the capacity <strong>to</strong> advance c<strong>ru</strong>cial<br />
paradigm shifts in the molecular-level analysis of NOM, which then has <strong>to</strong> be perceived, in<br />
contrast <strong>to</strong> conventional wisdom, as a rather more active participant in the global carbon<br />
cycle.<br />
ACKNOWLEDGEMENTS<br />
We thank the Journal office of Analytical Bioanalytical Chemistry (Springer Science<br />
and Business Media) for the permission <strong>to</strong> use reproduced figures in analogy <strong>to</strong> Ref. 1.<br />
REFERENCES<br />
1. Hertkorn, N., et al. 2007. Anal. Bioanal. Chem. 389, 1311-1327.<br />
2. Hertkorn, N., et al. 2006, Geochim. Cosmochim. Acta, 70, 2990-3010.<br />
3. Lam, B., et al. 2007, Environ. Sci. Technol., 41, 8240-8247.<br />
4. Einsiedl. F., et al. 2007. Geochim. Cosmochim. Acta, 71, 5474-5482.<br />
5. Kelleher, B.P. and Simpson, A.J. 2006. Environ. Sci. Technol., 40, 4605-4611.<br />
22
Isolation and Characterization of Humic and Fulvic Acids from Thermal<br />
Waters as an Unexplored Biogeosystem<br />
Krisztina Kovács 1 , Csanád Sajgó 2 , Alice B<strong>ru</strong>kner-Wein 2 , Zoltán Kárpáti 4 , András Gáspár 3 ,<br />
Etelka Tombácz 1 , Philippe Schmitt-Kopplin 3<br />
1 University of Szeged, Department of Colloid Chemistry, 6720 Szeged, Aradi Vt. 1., Hungary,<br />
kkriszta@chem.u-szeged.hu<br />
2 Institute for Geochemical Research, Hungarian Academy of Sciences, 1112 Budapest, Budaörsi<br />
út 45., Hungary<br />
3 Helmholtz Zent<strong>ru</strong>m München, German Research Center for Environmental Health, Institute of<br />
Ecological Chemistry, 85764 Neuherberg, Ingolstädter Landstr. 1., Germany<br />
4 Budapest Sewage Works Ltd., North-Pest Wastewater Treatment Plant; 1044 Budapest, Timár u.<br />
1, Hungary<br />
Keywords: thermal water, humic fractions, FTICR/MS<br />
1. INTRODUCTION<br />
The recent interest in groundwater from deep aquifers seems <strong>to</strong> be increasing. The<br />
term thermal water is used, if the temperature of tapped groundwater is above 30ºC. The<br />
development of thermal spas for balneotherapy and the exploitation of geothermal energy<br />
have been in the focus of the use of this natural resource recently (1).<br />
Hungary is one of the countries of favourable geothermal conditions. In this area, hot<br />
water could be exploited, of which temperature is approximately 100ºC, from wells tapped<br />
from a depth of 2000 m. These waters got <strong>to</strong> present position long time ago, and their<br />
chemical composition altered profoundly during geological range of time.<br />
The hot waters contain several dissolved mineral and organic components. Their<br />
chemical composition depends on the geological location of well and changes instantly<br />
during production. Degassing, evaporation of volatile organics, precipitation of salts and<br />
minerals take place due <strong>to</strong> decreasing pressure and temperature. In addition, oxidation<br />
processes producing new compounds rapidly occur when hot water in reductive condition<br />
reaches up <strong>to</strong> ground level and comes in<strong>to</strong> contact with atmospheric oxygen. The<br />
dissolved organic matter (DOM), such as humic substances (HS) attracted less attention<br />
so far, although these organic macromolecules are always present in all kind of<br />
groundwater. In this work the isolation of humic substances from thermal water at a depth<br />
of about 1000 m and molecular characterization of fulvic and humic acids (FA and HA) will<br />
be shown.<br />
23
2. MATERIALS AND METHODS<br />
Groundwater sample of temperature of 46ºC was collected from well tapped from<br />
993 m from the region of Makó (Southeast Hungary) in Feb<strong>ru</strong>ary 2006. This hot water is<br />
alkali-hydrocarbonated with pH value of 8.2 and more than 1000 mg L -1 <strong>to</strong>tal dissolved<br />
solid content. The samples were s<strong>to</strong>red in plastic containers below 5ºC until processing.<br />
After sampling of hot water, it could be observed significant change in appearing yellowish<br />
water color in a day or two. This phenomenon was followed up with UV-vis spectroscopy.<br />
Isolation of organic matter was according <strong>to</strong> the procedure of International Humic<br />
Substance Society “Method for Preparation of IHSS Aquatic Humic and Fulvic Acids” (2).<br />
Humic acid (HA) and fulvic acid (FA) concentrations in thermal water sample were 1.92<br />
and 1.24 mg L -1 , respectively, on the basis of the amounts of isolated material in the<br />
reference <strong>to</strong> the volume 100 L of the water sample.<br />
The isolated HA and FA were characterized by elemental analysis, potentiometric<br />
acid-base titration and FTIR spectroscopy. In addition, high-resolution mass spectra of HA<br />
and FA for molecular formula assignment were acquired on a B<strong>ru</strong>ker APEX Qe Fourier<br />
transform ion cyclotron resonance mass spectrometer (FTICR/MS) equipped with a<br />
12 Tesla superconducting magnet and an APOLLO II ESI source. The HA and FA s<strong>to</strong>ck<br />
solutions were prepared by dissolving 1-1 mg of samples in trace amount of NH 4 OH and<br />
Milli-Q purified water, and only in Milli-Q water, respectively. The working solutions were<br />
diluted from the s<strong>to</strong>ck solutions with methanol such that the concentration of organic<br />
matter was about 10 ppm. The measurements were carried out in negative ionization<br />
mode. Mass spectra obtained were calibrated with respect <strong>to</strong> fatty acids. Then formula<br />
calcula<strong>to</strong>r software was used <strong>to</strong> calculate all possible formulas based on the requirement<br />
that the mass calculated for a given chemical formula agrees with the measured mass<br />
within ± 0.001 Da.<br />
3. RESULTS AND DISCUSSION<br />
Table 1. Elemental composition and calculated a<strong>to</strong>mic ratios of HA and FA samples<br />
Weight percent, %<br />
A<strong>to</strong>mic ratio<br />
Sample<br />
C H N S O O/C H/C<br />
HA 57.68 4.26 2.16 1.69 34.21 0.44 0.89<br />
FA 53.19 4.13 1.28 1.70 39.70 0.55 0.97<br />
FA exhibits lower C, higher O contents and higher O/C ratio than HA (Table 1).<br />
These results are in agreement with the general finding for HAs and FAs from different<br />
sources (soil, freshwater, marine water, peat) (3). However, the values of O/C and<br />
especially H/C ratios of hot water HA and FA samples are consistently lower than those<br />
from other sources.<br />
24
-10<br />
net pro<strong>to</strong>n surface excess, mmol g -1<br />
-8<br />
-6<br />
-4<br />
-2<br />
pH<br />
0<br />
2 4 6 8 10 12<br />
Figure 1. The pH-dependent dissociation of acidic groups on HA (■) and FA (□)<br />
in 0.01 M NaCl.<br />
The absolute value of net pro<strong>to</strong>n surface excess is equivalent <strong>to</strong> the amount of<br />
negatively charged, i.e. dissociated acidic groups of HA and FA.<br />
The shape of pro<strong>to</strong>n binding curves (Fig. 1) is characteristic of HSs, and the amounts<br />
of acidic groups are in the range of standard and reference HA and FA samples of IHSS<br />
The pH-based estimates of the carboxyl and phenolic functional group contents of HA and<br />
FA are 7.8, 4.1 as well as 14.3 and 5.2 mmol g C -1 . Carboxyl groups constitute two third<br />
and three fourth of the <strong>to</strong>tal acidity for HA and FA samples, respectively (4). Although<br />
relative amount of phenolic OH content of HA is higher than that of FA, the phenolic<br />
compounds are more abundant in FA.<br />
Table 2. IR absorbance values and ratios of those in case of HA (■) and FA (□) at different<br />
wavenumbers, assigned <strong>to</strong> K1: aliphatic/carbonyl, K2: aliphatic/aromatic and K3:<br />
carbonyl/aromatic ratios<br />
Measured absorbance<br />
Calculated ratio<br />
Sample<br />
aliphatic carbonyl aromatic K1 K2 K3<br />
HA 0.086 0.403 0.277 0.21 0.31 1.45<br />
FA 0.143 1.324 0.494 0.11 0.29 2.68<br />
Table 2 shows that aliphatic, carbonyl and aromatic content is higher in case of FA<br />
correlating with the higher O/C and H/C ratios from elemental analysis and greater<br />
carboxyl and phenolic functional group contents from acid-base titrations. In addition, the<br />
aromatic contents are more dominant than aliphatic ones in both HA and FA samples, the<br />
proportions of those are very similar as reflecting by the almost same K2 ratios. The<br />
maximum of absorbances appear at wavenumber belonging carbonyl groups. pH-based<br />
estimates of the carboxyl functional group contents correspond with the K3 ratios.<br />
<strong>Molecular</strong> formulae obtained from high-resolution mass spectra by using formula<br />
calcula<strong>to</strong>r software were sorted on the basis of heteroa<strong>to</strong>mic composition <strong>to</strong> establish<br />
different compound classes, i.e. formulae with the same constitution of heteroa<strong>to</strong>ms (O, N<br />
and S). The relative abundances of formulae as showed for oxygen containing compounds<br />
25
in Fig. 2 were calculated by dividing with the summed intensity for all species identified (5).<br />
It also comes up that FA is more oxygenated shifting the maximum of relative abundances<br />
<strong>to</strong>ward molecules with higher O content (Fig. 2). Moreover detailed insight could be gained<br />
since the most abundant compounds of HA and FA with 7 and 10 O a<strong>to</strong>ms, respectively.<br />
2 0<br />
relative abundance, %<br />
1 6<br />
compound classes<br />
1 2<br />
8<br />
4<br />
0<br />
O O<br />
2<br />
O<br />
3<br />
O<br />
4<br />
O<br />
5<br />
O<br />
6<br />
O<br />
7<br />
O<br />
8<br />
O<br />
9<br />
O<br />
10<br />
O<br />
11<br />
O<br />
12<br />
O<br />
13<br />
O O O<br />
14 15 16<br />
Figure 2. Only oxygen containing compound classes identified in HA (■) and FA (□).<br />
4. CONCLUSIONS<br />
Novel results on molecular characterization of HA and FA samples isolated by IHSS<br />
method from an unexplored biogeosystem were showed. Their properties are in the region<br />
of natural organic matter especially characteristic of humic substances. The significant<br />
darkening of water s<strong>to</strong>red even at low temperature after sampling is interesting and needs<br />
detailed investigation in future. The HA and FA samples isolated will be the subjects of<br />
detailed organic geochemical investigations <strong>to</strong> reveal their origin and biogenesis.<br />
ACKNOWLEDGEMENTS<br />
This work was funded by the Hungarian National Science Foundation (OTKA)<br />
through grants T-48829 and K69109, and supported by the Environmental Doc<strong>to</strong>ral School<br />
at University of Szeged and IHSS Training Bursary 2007.<br />
REFERENCES<br />
1. Kühn, M., Niewöhner, C., Isenbeck-Schröter, M., Schulz, H. D. 1998. Water Research, 32,<br />
265-274.<br />
2. Thurman, E. M., Malcolm, R. L. 1981. Environ. Sci. Technol. 15, 463-466.<br />
3. Rice, J. A., MacCarthy, P. 1991. Org. Geochem., 17, 635-648.<br />
4. Ritchie, J. D., Perdue, E. M. 2003. Geochimica et Cosmochimica Acta, 67, 85-96.<br />
5. Hughey, C. A., Rodgers, R. P., Marshall, A. G., Qian, K., Robbins, W. K. 2002. Org.<br />
Geochem., 33, 743-759.<br />
26
Hydrous Pyrolysis of Natural Organic Matter from a Highly Coloured<br />
Surface Water<br />
Bradley Allpike 1 , Suzanne McDonald 1 , Cynthia Joll 1 and Robert Kagi 1<br />
1 Curtin Water Quality Research Center, Curtin University of Technology, Kent St Bentley, Perth,<br />
Western Australia, 6102, Suzanne.McDonald@curtin.edu.au<br />
Keywords: NOM, pyrolysis, hydrous pyrolysis<br />
1. INTRODUCTION<br />
Analytical pyrolysis has been extensively applied for the st<strong>ru</strong>ctural characterisation of<br />
natural organic matter (NOM). The attraction of the technique lies in its ability <strong>to</strong> reduce<br />
complex macromolecular material <strong>to</strong> lower molecular weight (MW) compounds more<br />
amenable <strong>to</strong> analysis by gas chroma<strong>to</strong>graphy-mass spectrometry (GC-MS). Heating of the<br />
sample in an inert environment over a time period typically less than 30 seconds <strong>to</strong><br />
temperatures in excess of 500°C (flash pyrolysis) results in fragmentation and partial<br />
defunctionalisation of macromolecules as a result of the large amounts of thermal energy<br />
acquired by the sample (1). However, a significant portion of flash pyrolysis products is<br />
often highly polar, precluding their analysis by GC-MS (2). Reducing the polarity of<br />
products, particularly if controlled such that enough of the hydrocarbon st<strong>ru</strong>cture is<br />
preserved <strong>to</strong> enable recognition of its primary precursor, would be advantageous.<br />
Low temperature pyrolysis can facilitate the artificial maturation of recent NOM on<br />
labora<strong>to</strong>ry time-scales in an analogous manner <strong>to</strong> the natural geological formation of fossil<br />
fuels (3). The study of petroleum formation kinetics using low energy pyrolysis has proved<br />
popular (4-7), however, studies on characterisation of recent or extant NOM has received<br />
little attention (2, 8).<br />
Hydrous pyrolysis is a low energy pyrolysis technique involving the heating of NOM in<br />
a sealed vessel in the presence of water at temperatures below its supercritical point<br />
(374°C) (4). Koopmans et al. (9-12) have shown the potential of this technique by<br />
identifying hydrocarbon biomarkers weakly bound via S or O linkages <strong>to</strong> the Kerogen<br />
moiety of immature, sulfur rich organic sediments. In this study, we investigate the<br />
potential of hydrous pyrolysis as a technique for characterisation of dissolved NOM, using<br />
solid samples isolated from a highly coloured surface water as well as NOM still in<br />
solution.<br />
27
2. MATERIALS AND METHODS<br />
A surface water sample from the Quickup River Dam, Denmark, and Western<br />
Australia was collected in September 2006. The highly coloured water (1000 L) was<br />
collected in a 1000 L polyethylene container and filtered through a 0.45 μm membrane.<br />
The filtered sample was concentrated <strong>to</strong> approximately 20 L by reverse osmosis (RO) and<br />
s<strong>to</strong>red at 4°C until required. A small sub-sample (1 L) of the RO retentate was subjected <strong>to</strong><br />
lyophilisation without further treatment and the solid NOM collected. The NOM isolate was<br />
analyzed by hydrous pyrolysis by the procedure outlined below.<br />
NOM (100 mg) and purified water (2 mL) was placed in a stainless steel container<br />
(6 mL internal volume) in a nitrogen environment <strong>to</strong> eliminate the presence of oxygen and<br />
sealed at either end with Swagelok ® fittings. The stainless steel container was heated <strong>to</strong><br />
330°C for 72 hours and allowed <strong>to</strong> cool <strong>to</strong> room temperature for 12 hours. Contents of the<br />
container were extracted with dichloromethane and concentrated (2 mL) using a Kederna-<br />
Danish apparatus, and dried over anhydrous MgSO 4 (Sigma-Aldrich, AR grade). The dried<br />
extract was analyzed by GC-MS. A sample of the RO permeate (5 mL) was also analyzed<br />
using the identical procedure as above, apart from the addition of water <strong>to</strong> the system.<br />
3. RESULTS AND DISCUSSION<br />
Two hydrous pyrolysis chroma<strong>to</strong>grams from a NOM sample isolated from a highly<br />
coloured source water in the south west of Western Australia are presented in Figure 1.<br />
Heating of the solid NOM isolate at 330°C over 72 hours resulted in almost 200 identifiable<br />
products detected by GC-MS following extraction of the aqueous phase with DCM. An<br />
almost identical suite of products was obtained from hydrous pyrolysis of the<br />
corresponding RO NOM concentrate. Analysis of the pyrolysis products indicated that the<br />
sample contained significant input from polysaccharides, suggested by the abundance of<br />
cyclopentenones and furan derivatives. As well, a small number of protein markers were<br />
detected and lignin input appeared substantial.<br />
28
a)<br />
b)<br />
Time (min)<br />
10 20 30 40 50 60 70 80 90 100 110 120 130<br />
Figure 1. GC-MS analysis of hydrous pyrolysis product extracts;<br />
a) 100 mg of solid NOM + 2 mL of H 2 O; b) 5 mL RO NOM concentrate.<br />
Significantly, the almost identical nature of the two pyrograms indicated the potential<br />
for hydrous pyrolysis of aqueous NOM samples, eliminating the need for complex isolation<br />
procedures. Comparison of hydrous pyrolysis results with a pyrogram obtained from flash<br />
pyrolysis of the same solid NOM isolate (results not shown) revealed a number of similar<br />
products. The relative abundances of similar compounds from each technique differed;<br />
however, hydrous pyrolysis was able <strong>to</strong> generate a significantly greater number of<br />
products identifiable by GC-MS. A particular advantage of hydrous pyrolysis is the ability <strong>to</strong><br />
analyze gaseous products, collected upon opening of the sealed container, Hydrous<br />
pyrolysis also provides the potential <strong>to</strong> analyze the water phase for pyrolysis products not<br />
extractable by DCM. Hydrous pyrolysis should, therefore, enable a far greater percentage<br />
of the products of pyrolysis <strong>to</strong> be identified than is the case using traditional online flash<br />
pyrolysis techniques.<br />
REFERENCES<br />
1. Hatcher, P.G., Dria, K.J., Kim, S. and Frazier, S.W. (2001) Modern Analytical Studies of Humic<br />
Substances. Soil Science, 166, 770-794.<br />
2. Greenwood, P.F., Leenheer, J.A., McIntyre, C., Berwick, L. and Franzmann, P.D. (2006)<br />
Bacterial biomarkers thermally released from dissolved organic matter. Organic Geochemistry,<br />
37, 597-609.<br />
29
3. Horsfield, B., Disko, U. and Leistner, F. (1989) The micro-scaled simulation of maturation:<br />
outline of a new technique and its potential applications. Geologische Rundschau, 78, 361-<br />
374.<br />
4. Lewan, M.D., Spiro, B., Illich, H., Raiswell, R., Mackenzie, A.S., Durand, B., Manning, D.A.C.,<br />
Comet, P.A., Berner, R.A. and De Leeuw, J.W. (1985) Evaluation of Petroleum Generation by<br />
Hydrous Pyrolysis Experimentation. Philosophical Transactions of the Royal Society of London<br />
A, 315, 124-134.<br />
5. Lewan, M.D., Winters, J.C. and McDonald, J.H. (1979) Generation of oil-like pyrolyzares from<br />
organic-rich shales. Science, 203, 897-899.<br />
6. Barth, T., Borgund, A.E. and Lise Hopland, A. (1989) Generation of organic compounds by<br />
hydrous pyrolysis of Kimmeridge oil shale--Bulk results and activation energy calculations.<br />
Organic Geochemistry, 14, 69-76.<br />
7. Dieckmann, V., Schenk, H.J. and Horsfield, B. (2000) Assessing the overlap of primary and<br />
secondary reactions by closed- versus open-system pyrolysis of marine Kerogens. Journal of<br />
Analytical and Applied Pyrolysis, 56, 33-46.<br />
8. Berwick, L., Greenwood, P., Kagi, R. and Croue, J.-P. (2007) Thermal release of nitrogen<br />
organics from natural organic matter using micro scale sealed vessel pyrolysis. Organic<br />
Geochemistry, 38, 1073-1090.<br />
9. Koopmans, M.P., Carson, F.C., Sinninghe Damste, J.S. and Lewan, M.D. (1998) Biomarker<br />
generation from Type II-S Kerogen in clays<strong>to</strong>ne and limes<strong>to</strong>ne during hydrous and anhydrous<br />
pyrolysis. Organic Geochemistry, 29, 1395-1402.<br />
10. Koopmans, M.P., De Leeuw, J.W., Lewan, M.D. and Sinninghe Damste, J.S. (1996) Impact of<br />
dia- and catagenesis on sulphur and oxygen sequestration of biomarkers as revealed by<br />
artificial maturation of an immature sedimentary rock. Organic Geochemistry, 25, 391-426.<br />
11. Koopmans, M.P., Schaeffer-Reiss, C., de Leeuw, J.W., Lewan, M.D., Maxwell, J.R., Schaeffer,<br />
P. and Sinninghe Damste, J.S. (1997) Sulphur and oxygen sequestration of n-C37 and n-C38<br />
unsaturated ke<strong>to</strong>nes in an immature kerogen and the release of their carbon skele<strong>to</strong>ns during<br />
early stages of thermal maturation. Geochimica et Cosmochimica Acta, 61, 2397-2408.<br />
12. Koopmans, M.P., Sinninghe Damste, J.S., Lewan, M.D. and De Leeuw, J.W. (1995) Thermal<br />
stability of thiophene biomarkers as studied by hydrous pyrolysis. Organic Geochemistry, 23,<br />
583-596.<br />
30
High Resolution and Hyphenated Analytics as Tools for Exploring<br />
Chemical Space of HS and NOM from Various Environments<br />
Philippe Schmitt-Kopplin, Hertkorn, N., Harir, M., Lucio, M. Gaspar, A., Kanavati, B.,<br />
Fekete, A. Gebefuegi, I.<br />
HelmholtzZent<strong>ru</strong>m Muenchen; German Research Center for Environmental Health, Institute of<br />
Ecological chemistry, molecular BioGeochemistry, Ingolstädter Landstrasse 1, 85764 Neuherberg,<br />
Germany, Schmitt-kopplin@helmholtz-muenchen.de<br />
Keywords: high resolution, analytics, NOM<br />
There is a high need in combining orthogonal analytical <strong>to</strong>ols for the characterization<br />
of complex organic mixtures such as natural organic matter (NOM). The presentation<br />
focuses on novel <strong>to</strong>ols and methods for a molecular understanding of NOM and humic<br />
substances (HS).<br />
NOM consist in a continuum in molecular st<strong>ru</strong>ctures leading <strong>to</strong> higher levels of<br />
complexity from which derives their particular physical-chemical properties. Analyzing the<br />
functions of NOM needs the perfect choice of scale-adapted analytical <strong>to</strong>ols when looking<br />
at their interactions with natural or anthropogenic chemical or biological systems in the<br />
environment (soil, water, aerosols) or looking at chemical transformation processes of<br />
humic like compounds (HS, lignins, composts etc.) in<strong>to</strong> added value chemicals at the labscale.<br />
Bulk analysis may be sufficient or molecular resolution may be needed. All the<br />
process from (i) sample preparation <strong>to</strong> (ii) molecular analysis and (iii) data integration and<br />
modelisation needs <strong>to</strong> be considered and adapted <strong>to</strong> the natural materials <strong>to</strong> be analyzed<br />
(Fig. 1).<br />
In the emerging field of Metabolomics which was defined by Nicholson et al 1999 (3)<br />
as “The quantitative analysis or description of all low molecular weight metabolites<br />
in specified cellular, tissue or biofluid compartments” the need is given <strong>to</strong> adapt the<br />
analytical <strong>to</strong>ols and methods <strong>to</strong> cover the highest analyzable chemical space (2). The<br />
same approach is needed in the field of Humics where techniques are combined and<br />
needs <strong>to</strong> be validated (avoiding artifacts and false assignments). Adequate sampling and<br />
preparation (cleanup or concentration of target compounds) is followed with a separation<br />
of the analytes based on their st<strong>ru</strong>ctural properties (charge, size,<br />
hydrophilicity/hydrophobicity …) and a detection strategy offering best sensitivity or best<br />
profiling properties.<br />
31
Complex NOM/HS Sample<br />
Small molecules<br />
Target/non-target<br />
Sample preparation molecular analysis Data Post-Analysis<br />
Desalting/Concentration<br />
Native/derivatisation<br />
SPE,<br />
µSPE (MEPS),<br />
Monoliths<br />
Nanoparticles<br />
Foaming/Bursting<br />
Mixtures<br />
Separation (LC/UPLC, CE, GC)<br />
Spectroscopy (UV, IR, NMR)<br />
Spectrometry (Q, IT, TOF, ICR)<br />
Ionization selectivity<br />
Statistics<br />
Allignements, normalizations<br />
Elementary compositions<br />
(CHONPS), functional groups<br />
Classical statistics<br />
Cluster, PCA, PLS-DA / SIMCA<br />
Multidisciplinary approach<br />
process understanding<br />
Unraveling chemical complexity<br />
Figure 1. Analytical approaches for complex organic systems from sample preparation,<br />
molecular analysis and further chemometrics.<br />
In our humics fields of investigation various levels of the analytical approaches can<br />
be distinguished:<br />
- targeted analysis: quantitative evaluation of concentrations of chemicals (organic<br />
and inorganic, natural and anthropogenic, ambient <strong>to</strong> trace amounts) from various<br />
matrices after precise and adapted sample preparation (cleanup and concentration) (1).<br />
When following a hypothesis driven approach specific compounds can be quantified within<br />
the humic matrice. Cleanup and sample preconcentration (solid phase (micro)extraction –<br />
SPE) are essential and constitute the first steps in the analysis, followed by a<br />
electrophoretic or chroma<strong>to</strong>graphic separation (capillary electrophoresis,<br />
electrochroma<strong>to</strong>graphy, liquid chroma<strong>to</strong>graphy, gas chroma<strong>to</strong>graphy) and an adapted<br />
detection (UV-Vis., fluorescence, mass spectrometry).<br />
- metabolite profiling – within this approach all classes of metabolites (i.e. lipids,<br />
sugars, peptides, proteins etc…) are analyzed in the mixtures. In the corresponding life<br />
science investigation field one would consider proteomics, lipidomics, glycomics.<br />
- non-targeted analysis – here new technologies are developed and optimized for a<br />
qualitative/semi-quantitative evaluation of the presence of chemical classes in complex<br />
32
mixtures – molecular inven<strong>to</strong>ry needed <strong>to</strong> allow process descriptions or discovery of new<br />
biomarkers (4).<br />
High-end technologies such as Nuclear Magnetic Resonance Spectroscopy (NMR)<br />
and especially Ion Cyclotron Resonance Fourier Transform Mass Spectrometry (ICR-<br />
FT/MS) presented more in details, are ideal <strong>to</strong>ols <strong>to</strong> get st<strong>ru</strong>ctural information on a large<br />
quantity of components within one single sample especially when using high field magnets<br />
(Fig. 2).<br />
Figure 2. Detail on m/z 628 showing the effect on peak resolution on the limitation in<br />
st<strong>ru</strong>ctural information in ultrahigh resolution mass spectrometry<br />
(sample is PM 2.5 aerosol particle extract).<br />
The combined use of separation/cleanup technologies and liquid microhandling, with<br />
new ionization techniques (APPI, APLI) and ultrahigh resolution mass spectrometry<br />
certainly are uniquely suited for identification of known and hither<strong>to</strong> unknown metabolites<br />
and possible biomarkers in very complex samples and for the analysis of often inseparable<br />
mixtures (5).<br />
33
REFERENCES<br />
1. Chen, J., X. Zhao, R. Lehmann, J. Fritsche, P. Yin, Ph. Schmitt-Kopplin, W. Wang, X. Lu, H.U.<br />
Häring, E. D. Schleicher, G. Xu, Strategy for biomarker discovery and identification based on<br />
LC-MSn in metabonomics research., Anal. Chem., (2008), 80, 1280-89<br />
2. Hertkorn N., M. Meringer, R. Gugisch, C. Ruecker, M. <strong>From</strong>mberger, E. M. Perdue, M. Witt ,<br />
Ph. Schmitt-Kopplin, High-precision frequency measurements: indispensable <strong>to</strong>ols at the core<br />
of molecular-level analysis of complex systems. Analytical Bioanalytical Chemistry, (2007),<br />
389, 1311-1327<br />
3. Nicholson, JK., Lindon JC, Holmes E (1999) `Metabonomics’: understanding the metabolic<br />
responses of living systems <strong>to</strong> pathophysiological stimuli via multivariate statistical analysis of<br />
biological NMR spectroscopic data, Xenobiotica 29, 1181-1189.<br />
4. Rosselló-Mora, R., M. Lucio, A. Peña, J. Bri<strong>to</strong>-Echeverría, A. López-López, M. Valens-Vadell,<br />
M. <strong>From</strong>mberger, J. Antón, Ph. Schmitt-Kopplin, Metabolic evidences of biogeographic<br />
isolation of the extremophilic bacterium Salinibacter <strong>ru</strong>ber. Nature – ISME Journal, (2008), 2,<br />
242-253.<br />
5. Schmitt-Kopplin, Ph., Englmann, M., Rossello-Mora, R., Schiewek, R., Brockmann,K.J.,<br />
Benter, Th., Schmitz, O.J., Combining Chip-ESI with APLI (cESILI) as a multimode source for<br />
the analysis of complex mixtures with ultrahigh resolution mass spectrometry, Anal. Bioanal.<br />
Chem. In press 2008.<br />
34
X-Ray Spectromicroscopy of Organic Matter in the Environment<br />
Juergen Thieme<br />
University of Goettingen, Institute for X-Ray Physics, Friedrich-Hund-Platz 1, 37077 Goettingen,<br />
Germany, jthieme@gwdg.de<br />
Keywords: X-ray spectromicroscopy, synchrotron radiation, laser plasma X-ray source, organic<br />
matter, soil, humic substances, XANES<br />
1. INTRODUCTION<br />
X-ray microscopy achieves a much higher resolution than light microscopy due <strong>to</strong> the<br />
much shorter wavelength of X-rays compared <strong>to</strong> visible light. The smallest st<strong>ru</strong>ctures that<br />
can be seen in an X-ray microscope at present are less than 15 nm in size. Between the<br />
K-absorption edge of Carbon and of Oxygen the linear absorption coefficient of water is<br />
low compared <strong>to</strong> of organic or inorganic matter. This gives rise <strong>to</strong> a natural amplitude<br />
contrast even when imaging specimen in aqueous media with X-rays within this energy<br />
range. No drying, fixation or staining of a sample is necessary. By choosing the used X-ray<br />
energy appropriately, it is possible <strong>to</strong> perform spectromicroscopy studies. Maps of the<br />
distribution of a specific element in a sample can be obtained. It is possible <strong>to</strong> use nearedge<br />
resonances for XANES-studies. As the used X-ray energy is raised <strong>to</strong> match the<br />
absorption edge, resonances reflecting the chemical bonding state of the element can be<br />
detected. As a result of the refractive index of matter being close <strong>to</strong> unity scattered X-ray<br />
light will not be reflected from inner surfaces in inhomogeneous media. Clear images<br />
without scattering background are obtained even when studying thick and inhomogeneous<br />
samples. Therefore, X-ray microscopy images can be used for a <strong>to</strong>mographic<br />
reconst<strong>ru</strong>ction of thick samples. Comprising, X-ray spectromicroscopy is a powerful <strong>to</strong>ol for<br />
addressing key questions in many scientific areas, e.g. <strong>to</strong> study st<strong>ru</strong>ctures in the<br />
environment showing dimensions on the nanoscale.<br />
2. MATERIALS AND METHODS<br />
Soil colloids have been imaged <strong>to</strong> visualize the appearance of st<strong>ru</strong>ctures on the<br />
nano- and microscale (1). The effect of changing chemical conditions in an aqueous<br />
environment on the appearance of these st<strong>ru</strong>ctures has been imaged and evaluated.<br />
Morphological effects of biologically induced redox changes of humic substances have<br />
been imaged <strong>to</strong>mographically conveying a detailed three-dimensional presentation of the<br />
specimen st<strong>ru</strong>cture (2). Using the spectromicroscopy potential, the distribution of organic<br />
35
and inorganic components has been studied; spectra have been analyzed for major<br />
chemical constituents (3). To achieve reasonable exposure times X-ray microscopes need<br />
highly brilliant X-ray sources, e.g. synchrotron radiation from electron s<strong>to</strong>rage rings.<br />
Several successfully <strong>ru</strong>nning X-ray microscopes have been installed at these large-scale<br />
facilities worldwide. However, only few electron s<strong>to</strong>rage rings exist worldwide, hampering<br />
the dissemination of X-ray microscopy as a useful technique. Recently, new developments<br />
in laser plasma sources for X-rays made first microscopy and spectroscopy experiments<br />
possible using a table<strong>to</strong>p setup. Images of soil colloids in aqueous suspension have been<br />
taken in the first successful experiments with a labora<strong>to</strong>ry size soft X-ray microscope (4).<br />
Humic acids, fulvic acids, and organic matter from soils have been characterized and<br />
compared by XANES spectroscopy using a table<strong>to</strong>p laser plasma X-ray source (5).<br />
3. RESULTS AND DISCUSSION<br />
The two soil samples in fig. 1, show in the colloidal size range clusters of particles<br />
with many different appearances. However, particles with similar shapes can be identified<br />
quickly. In this size range all samples mainly consist of clay particles making these<br />
similarities comprehensible. In addition, microorganisms are very often attached <strong>to</strong> the<br />
particles. They can be found in the images as ellipsoidal or round shapes with a distinct<br />
membrane. The images clearly show the desired morphology of clusters of colloids or<br />
nanoparticles. A micro zone plate with dr n = 25 nm has been used as the microscope<br />
objective, resulting in a resolution in the images of about the same value. As a result,<br />
single particles within the clusters can easily be identified.<br />
A stack of images of a chernozem soil sample have been taken in small energy steps<br />
around the K-absorption edge of Carbon. Fig. 2 shows one of these images and three<br />
regions marked in light gray. Integrating the transmission signal I 1 of each region as a<br />
function of energy and using the region marked dark gray as I 0 the spectra below each<br />
image could be obtained as -ln(I 1 /I 0 ), which yields the optical density. The left image and<br />
the appendant spect<strong>ru</strong>m below clearly reveal the L II - and L III -absorption features of<br />
potassium, a strong indication for clay particles. The spect<strong>ru</strong>m in the middle reveals the<br />
organic origin of the particle marked in the image. Image and spect<strong>ru</strong>m at the left shows<br />
the result of the sum of all particles from that flock. The differences in the spectra illustrate<br />
clearly the higher information content of spatially resolved data.<br />
36
Figure 1. Transmission X-ray microscopy images of two soil types, luvisol (left) and gleysol<br />
(right), imaged in aqueous media with the X-ray microscope at BESSY II with a resolution<br />
of about 25 nm. The scalebar indicates 2 µm.<br />
Figure 2. Selected regions marked in light gray from a stack of images and the<br />
corresponding spectra at the carbon K-absorption edge. The region used for I 0 is marked<br />
dark gray. The scalebar indicates 2 µm.<br />
Imaging experiments with soil colloids in aqueous media using a labora<strong>to</strong>ry size soft<br />
X-ray microscope have been performed in collaboration with the Royal Institute of<br />
Technology/Albanova, Biomedical and X-Ray Physics, in S<strong>to</strong>ckholm, Sweden. First<br />
XANES spectra of organic matter from colloidal samples from the environment have been<br />
obtained in collaboration with the Laser Labora<strong>to</strong>ry in Goettingen, Germany. Fig. 3 shows<br />
exemplary results from both collaborations.<br />
37
hv-Carbon vs OD-Humin-Carbon<br />
p y<br />
1,8<br />
1,6<br />
1,4<br />
1,2<br />
1,0<br />
0,8<br />
0,6<br />
0,4<br />
0,2<br />
0,0<br />
270 275 280 285 290 295 300 305 310<br />
E / V<br />
Figure 3. Left: X-ray microscopy image of colloidal particles of a chernozem soil in an<br />
aqueous suspension taken with a labora<strong>to</strong>ry size soft X-ray microscope. The scalebar<br />
indicates 1 µm. Right: XANES spect<strong>ru</strong>m of a humic substance from a chernozem soil<br />
obtained using a spectrometer with a table<strong>to</strong>p laser plasma X-ray source.<br />
4. CONCLUSIONS<br />
X-ray spectromicroscopy is be a suitable <strong>to</strong>ol for examining colloidal st<strong>ru</strong>ctures in<br />
their original aqueous matrix. Imaging as well as spectroscopy allow the characterization<br />
of morphology and chemistry of organic matter in relation <strong>to</strong> other elements. Laser<br />
plasmas as intense X-ray sources will be an alternative light source in the next future for<br />
many X-ray spectromicroscopy experiments making this technique more accessible.<br />
ACKNOWLEDGEMENTS<br />
This work has been supported by the Federal Minister of Education and Research<br />
(BMBF) under contract numbers 05KS1MG1/9 and 02WU9893/0. It has been funded by<br />
DFG under contract number Th 445/8-1 and /8-2 as well as within the frame of the SFB<br />
755 “Nanoscale Pho<strong>to</strong>nic Imaging”.<br />
REFERENCES<br />
1. Thieme, J., Gleber, S., Mitrea, G., Guttmann, P. 2007. Optics and Precision Engineering 12,<br />
1878-1885.<br />
2. Thieme, J., McNulty, I., Vogt, S., Paterson, D. 2007. Environmental Science & Technology,<br />
6885-6889.<br />
3. Mitrea, G., Thieme, J., Guttmann, P., Heim, S., Gleber, S. 2008. Journal of Synchrotron<br />
Radiation 15, 26-35.<br />
4. Thieme, J., Bertilson, M., von Hofsten, O., Takman, P., Hertz, H. 2008. Submitted.<br />
5. Thieme, J., Gleber, S., Sedlmair, J., Niemeyer, J., Peth, C., Mann, K. 2008. In preparation.<br />
38
Effects of pH, Temperature, and Organic and Inorganic Ions on the<br />
Dissolution Kinetics of Humic Acid Particles<br />
Maximiliano Brigante 1 , Graciela Zanini 1,2 and Marcelo Avena 1<br />
1 Departamen<strong>to</strong> de Química, Universidad Nacional del Sur, Av. Alem 1253, (8000) Bahía Blanca,<br />
Argentina, brigante@uns.edu.ar<br />
2 CERZOS (CONICET-UNS). Departamen<strong>to</strong> de Agronomía, Universidad Nacional del Sur, (8000)<br />
Bahía Blanca, Argentina<br />
Keywords: soil humic acid, humic acid-water interface, dissolution rate<br />
1. INTRODUCTION<br />
Humic acids (HA) represent an important and active fraction of the refrac<strong>to</strong>ry organic<br />
matter in soils, sediments and natural waters. Their ability <strong>to</strong> become solubilized in water<br />
under different conditions may affect greatly the distribution and transport of contaminants<br />
in the environment. Information about the dissolution behavior of particulate HA can be<br />
assessed by dissolution kinetic experiments, <strong>to</strong>pic that has been rather unexplored in the<br />
scientific literature. This kind of studies is needed <strong>to</strong> properly identify the conditions that<br />
promote dissolution of HA, <strong>to</strong> quantify the dissolution rates under different conditions and<br />
<strong>to</strong> assess information regarding the mobility of HA and the fate of their attached pollutants.<br />
Dissolution kinetic studies may also provide mechanistic information on the dissolution<br />
process, and fundamental information about the reactivity of the solid HA particle/water<br />
interface. This article presents a study of the dissolution kinetics of solid HA particles<br />
under different conditions and in the presence of different anionic and cationic species in<br />
solution. Data is used <strong>to</strong> gain insights in<strong>to</strong> fac<strong>to</strong>rs that promote or prevent dissolution.<br />
2. MATERIALS AND METHODS<br />
The HA was taken from an andisol (A Co<strong>ru</strong>ña, Spain). It was obtained according <strong>to</strong><br />
the procedure recommended by the IHSS. General characteristics of this sample can be<br />
found elsewhere (1). Dissolution kinetic experiments were carried out in a cylindrical,<br />
water-jacketed reaction vessel under N 2 bubbling. Before starting a kinetic experiment,<br />
100 mL of a 10 -3 M KCl solution containing also a known concentration of another<br />
substance (carboxylic acids, herbicides or inorganic cations) were placed in the reaction<br />
vessel. The pH of the solution was then adjusted <strong>to</strong> the desired value with KOH and/or HCl<br />
solutions. The dissolution experiment was started by adding a known weight (between<br />
15 and 20 mg) of solid HA <strong>to</strong> the mentioned solution. At different reaction times, a 5 mL<br />
39
aliquot was withdrawn, the particles were separated from the supernatant by<br />
sedimentation or centrifugation and the supernatant was immediately analysed <strong>to</strong> quantify<br />
the concentration of dissolved HA by UV-VIS spectroscopy. After the quantification, that<br />
<strong>to</strong>ok around 30 seconds, the supernatant and the HA particles were reintroduced in<strong>to</strong> the<br />
reaction vessel. This procedure was repeated during several hours in order <strong>to</strong> achieve<br />
complete dissolution of the sample or <strong>to</strong> gather enough data points. Special care was<br />
taken in keeping constant pH (± 0.1 units) during the whole dissolution <strong>ru</strong>n by adding<br />
minute amounts of KOH and/or HCl.<br />
3. RESULTS AND DISCUSSION<br />
The dissolution kinetics of the studied HA can be evaluated by plotting the degree of<br />
progress of the dissolution reaction, α, as a function of time, t. α=0 means that 0% of the<br />
solid HA has been dissolved, whereas α=1 means that 100% of the HA has been<br />
dissolved. Fig. 1a shows different dissolution curves (α vs. t) for the studied HA at different<br />
pH. <strong>From</strong> data such as those plotted in Figure 1a the dissolution rate, R, which is defined<br />
as the slope of the dissolution curve, can be also plotted (Fig 1b). The results shown in<br />
Fig. 1a and 1b reveal that R is strongly dependent on pH: there is a 400-fold increase in R<br />
when the pH is changed from 4 <strong>to</strong> 11. The dissolution mechanism is believed <strong>to</strong> be related<br />
<strong>to</strong> the depro<strong>to</strong>nation of carboxylic and phenolic functional groups of the HA molecules,<br />
which results in the breaking of some hydrogen bonds that hold the HA molecules <strong>to</strong>gether<br />
in the solid, leaving the molecules more susceptible for detachment (2). This depro<strong>to</strong>nation<br />
also results in an increased electrostatic repulsion among surface molecules, which may<br />
contribute <strong>to</strong> increase their rate of detachment from the surface.<br />
The dissolution rate is also increased by increasing temperature (Fig. 1c) and stirring<br />
rate (not shown). The apparent activation energy of the process (35 kJ mol -1 ) and the<br />
effects of stirring rate indicate that there is a mixed-control (surface and transport) of the<br />
dissolution kinetics under our experimental conditions. The dissolution rate at constant pH<br />
is also strongly dependent on Ca 2+ concentration (Fig. 1d), decreasing as Ca 2+<br />
concentration increases. Very similar results were obtained with others cations (Mg 2+ , Sr 2+ ,<br />
and Ba 2+ ). These ions are believed <strong>to</strong> rapidly adsorb at the particle surface decreasing the<br />
electrostatic repulsion among HA molecules. Cations could also act as bridges between<br />
functional groups of two adjacent molecules increasing the attractive forces between them,<br />
contributing <strong>to</strong> decrease the dissolution rate.<br />
40
Figure 1. a) Dissolution curves of the studied HA at different pH in 10 -3 M KCl without the<br />
addition of other substance. b) Effect of pH on R. c) Dissolution curves at different<br />
temperatures and pH=10. d) Effect of Ca 2+ concentration (values in the figure) on the<br />
dissolution rate at pH 9.<br />
The effects of monocarboxylic acid (formic, acetic, and propionic) and herbicides<br />
(glyphosate, 2,4-D, and paraquat, PQ) on the dissolution behavior of HA particles are<br />
shown in Fig. 2. At any pH the presence of monocarboxylic acids produces an increase in<br />
the R as compared <strong>to</strong> the behavior observed in KCl solutions (Fig 2a). The dissolution rate<br />
increases in the order propionic>acetic>formic, suggesting that monocarboxylic acids are<br />
able <strong>to</strong> adsorb, dis<strong>ru</strong>pting the interactions among HA molecules in the solid phase and<br />
promoting the dissolution. The larger the aliphatic chain of the acid is, the bigger the<br />
interaction becomes, and the faster the dissolution. This interacting ability of<br />
monocarboxylic acids was already demonstrated by Piccolo et al. (3) for humic acid<br />
aggregates in solution.<br />
The dissolution rate also significantly increases at all investigated pH when anionic<br />
herbicides (glyphosate and 2,4-D) are present in aqueous solution (Fig. 2b). Nevertheless,<br />
the cationic herbicide PQ presents a dual effect. It decreases the dissolution rate at pH>7<br />
and increases the rate at pH7, where the HA has a relatively high negative<br />
charge, PQ seems <strong>to</strong> act as other cations (Ca 2+ , Mg 2+ , Sr 2+ , Ba 2+ ) do, increasing the<br />
bonding among HA molecules in the solid phase. At pH
HA is relatively low, PQ appears <strong>to</strong> act as carboxylic acids, dis<strong>ru</strong>pting interactions among<br />
HA molecules.<br />
Figure 2. a) Effect of monocarboxylic acids on the dissolution rate of the studied HA at<br />
different pH. b) Effect of herbicides on the dissolution rate of the studied HA<br />
at different pH.<br />
4. CONCLUSIONS<br />
The results of this work show that the dissolution kinetics of solid HA particles is<br />
strongly dependent on pH and temperature. It is also highly dependent on the<br />
concentration of dissolved species in aqueous media. In general, anionic species tend <strong>to</strong><br />
accelerate the dissolution rate, whereas cationic species tend <strong>to</strong> slow down the rate.<br />
These effects may have a profound impact on the mobility of HA and attached pollutants in<br />
aqueous media.<br />
ACKNOWLEDGMENTS<br />
This work was financed by CONICET and SECYT (Argentina). M. Brigante thanks<br />
CONICET for the fellowship granted. The authors thank F. Arce (University of Santiago de<br />
Compostela, Spain) and his research group, who kindly provided the HA sample.<br />
REFERENCES<br />
1. Zanini, G., Avena, M., Fiol, S., Arce, F. 2006. Chemosphere, 63, 430-439.<br />
2. Brigante, M., Zanini, G., Avena, M. 2007. Colloid Surf. A, 294, 64-70.<br />
3. Piccolo, A., Conte, P., Cozzolino, A. 1999. Eur. J. Soil Sci. 50, 687-694.<br />
42
Spectroscopic Evaluation of Charcoal Derived Humic-Like Acid<br />
Edney Joubert Bittencourt Ferreira 1 ; Eduardo Albuquerque Brocchi 1 ;<br />
Gloria Maria Maurício 1 ; Raul Almeida Nunes 1 ; Vinicius de Melo Benites 2<br />
1 Departamen<strong>to</strong> de Ciência de Materiais e Metalurgia, PUC-Rio Rio de Janeiro, RJ - Brasil 22453-<br />
900, ebrocchi@puc-rio.br<br />
2 Embrapa Solos – Jardim Botânico, Rio de Janeiro, RJ - Brasil - CEP 22460-000<br />
Keywords: humic-like, charcoal, spectroscopic, fluorescence, UV-Vis<br />
1. INTRODUCTION<br />
The aim of this work is <strong>to</strong> study the suitability of using different charcoals in order <strong>to</strong><br />
produce humic-like acid. Fluorescence and UV-visible spectroscopy were applied <strong>to</strong><br />
evaluate the humidification degree by using different index: E 4 /E 6 (2, 8), A 254 /A 465 (8) (UV-<br />
Vis spectroscopic); I 400 /I 360 (4) and I 470 /I 360 (4) (fluorescence spectroscopy in synchronousscan<br />
mode); A 440 (5) and A 4 /A 1 (9) (fluorescence spectroscopic in emission scan).<br />
2. MATERIALS AND METHODS<br />
2.1. Organic Material<br />
It has been used different types of charcoal from: sugar cane bagasse; orange<br />
bagasse; sugar cane straw; Elephant grass (Pennisetum purpureum) and Eucalyptus<br />
grandis. Humic acid was also extracted from humus samples from compost of leaves<br />
grass and commercial compost by earthworm.<br />
2.2. Oxidation and extraction<br />
Approximately 5.0 g of dry charcoal was mixed with 200 mL of 25% of nitric acid. The<br />
mixture was heated at 80°C in reflux condition for 4 h. After this time, the samples were<br />
kept at room temperature for 12 h (6). After oxidation, the samples were filtered using a<br />
0.45 µm cellulose membrane. The filtrate separate was considered fulvic acid and the solid<br />
material was dissolved in 0.1M KOH (50 mL solution/g solid) and shaked for 12 h in sealed<br />
flask with N 2 atmosphere. Humics substances have been separated applying the method<br />
recommended by the International Humic Substances Society (IHSS). Total carbon<br />
concentration was determined by oxidation with sodium dichromate by pho<strong>to</strong>metric<br />
methods.<br />
2.3. Spectropho<strong>to</strong>metric measurements<br />
2.3.1. UV-visible spectroscopy<br />
43
Humic acid of the charcoal from sugar cane bagasse (BC), charcoal from orange<br />
bagasse (BL), charcoal from straw of sugar cane (PC), charcoal from elephant grass (CE),<br />
charcoal from E. grandis (CV), compost of leaves grass (C) and commercial compost by<br />
earthworm (HM) were dissolved at 20 mg/L in de NaHCO 3 0.05 mol/L and pH was kept in<br />
8.5. Ultraviolet and visible spectropho<strong>to</strong>metric measurements have been made between<br />
190 and 900nm with a Cary-100 UV-VIS Varian inc spectropho<strong>to</strong>meter using quartz cells<br />
(1 × 1 cm). E 4 /E 6 (2, 8) and A 254 /A 436 (8) ratios were calculated by measured absorbances.<br />
2.3.2. Fluorescence Spectroscopy<br />
Each humic acid sample was also dissolved at 20 mg/L in NaHCO 3 0.05 mol/L and<br />
pH was kept in 8.5 (5). Fluorescence spectra has been collected using a fluorescence<br />
spectropho<strong>to</strong>meter from Pho<strong>to</strong>n Technology International ® equipped with both excitation<br />
and emission monochroma<strong>to</strong>rs. Emission scan were collected between 260-660nm with<br />
excitation wavelength of 240 nm and these spectra were divided in<strong>to</strong> four regions. Than<br />
rations between the last quarter (A 4 ) (580-650nm) (9) and the first quarter (A 1 ) (350-<br />
420 nm) (9) were calculated. Emission scan spectra was also collected with excitation<br />
wavelength of 440 nm and the <strong>to</strong>tal area under the spectra (A 440 ) (5) was calculated.<br />
Synchronous spectra were recorded with excitation wavelength range 300-475 nm and a<br />
Δλ of 55 nm. The fluorescence intensity in 360, 400 and 470 nm was determined and the<br />
ratios between these intensities were calculated I 400 /I 360 (4) and I 470 /I 360 (4).<br />
3. RESULTS AND DISCUSSION<br />
3.1. UV-visible spectroscopy analysis<br />
The UV-Vis spectra of different samples have showed a high absorption in the 210-<br />
240 nm range and a decrease in absorption with the wavelength increase. It is a typical<br />
result for humic acid. Characterization of the samples by different index is showed in<br />
Table 1. It can be seen low ratio E 4 /E 6 for samples C and HM and high value for samples<br />
BL, PC, BC, CE and CV. Ratio A 254 /A 436 shows greater value for HM, BL and C. The low<br />
values for E 4 /E 6 or A 254 /A 436 ratio can be attributed <strong>to</strong> absorption by aromatic C=C<br />
functional groups as well as <strong>to</strong> the high degree of condensation of the aromatic rings.<br />
3.2. Fluorescence spectroscopy analysis<br />
Fluorescence spectra of humic-like acid obtained by acid oxidation exhibits a broad<br />
feature emission band with a maximum at ~510 nm. This band is consistent with data<br />
published by IHSS. In the other hand, samples C and HM showed a different behavior, as<br />
the intensity decreases by increasing the wavelength.<br />
44
Table 1. Ratios of the measured UV-Vis absorbencies<br />
HM CV BL C PC BC CE<br />
E 4 /E 6 3.65 4.25 7.60 3.52 6.42 6.20 5.89<br />
A 254 /A 436 5.338 4.151 5.766 5.161 4.466 4.255 4.490<br />
Fluorescence synchronous spectra are presented in Figure 1. Most of the samples<br />
(BL, CE, PC, BC and CV) show a similar behavior with a more intense peak at 350 nm and<br />
a shoulder between 410-470 nm, where the intensity decreases continuously. The sample<br />
HM showed a slightly difference with more intense peak at ~375 nm. Sample C showed a<br />
different behavior with an intense decrease of intensity until 330 nm.<br />
Figure 1. Fluorescence synchronous-scan excitation spectra (Δλ = 55 nm).<br />
The index obtained with fluorescence spectroscopic (Table 2) reinforces the<br />
conflicting types of evaluation. Index I 400 /I 360 indicates that HM, CE and C as the most<br />
humificated. I 470 /I 360 indicates as being the samples CE, PC, BC. The index A 440 indicates<br />
BL, CE and PC while the A 4 /A 1 indicates BC, PC and BL, as the most humificated,<br />
respectively. Therefore, it seems that each group of a specific chemical species should be<br />
evaluated by a specific index.<br />
Table 2. Ratios of the measured fluorescence spectroscopic parameters<br />
Sample<br />
I 400 /I 360<br />
Fluorescence Parameter<br />
I 470 /I 360 A 440 . 10 6 A 4 /A 1<br />
HM 0.77 0.31 1.75 0.08<br />
CV 0.52 0.27 0.65 0.15<br />
BL 0.64 0.42 4.59 0.16<br />
C 0.71 0.29 0.70 0.15<br />
PC 0.69 0.54 2.71 0.19<br />
BC 0.65 0.47 1.48 0.19<br />
CE 0.73 0.61 3.47 0.15<br />
45
4. CONCLUSIONS<br />
UV-Vis spectra show a typical humic acid behavior for all samples. The ratio E 4 /E 5 for<br />
samples HM and C shows lower value indicating high degree humification. The same<br />
information was also taken from A 4 /A 1 and I 470 /I 360 Fluorescence index. All these values<br />
are near of those given in some references.<br />
Synchronous spectra of sample C showed a similar profile of compost materials (4).<br />
Also, the same spectra of sample HM showed a similar profile with those from compost of<br />
soil mill olive waste; commercial humic acid by Aldrich Chemicals; compost of a mixture of<br />
animal manures and non-composted animal manure (4). All others samples showed<br />
similar profiles of the soil humic substances from China and Czech Republic (4).<br />
All index values and the profile of UV-Vis and Fluorescence obtained scan graphics<br />
are in accordance with reported references showing the suitability of using different<br />
charcoals as starting material <strong>to</strong> produce humic-like acid.<br />
REFERENCES<br />
1. Abbt-Braun. G; Fritz. H.F. 1999. Basic characterization of Norwegian NOM samples –<br />
Similarities and Differences. Environmental International. Vol.25 pp. 161-180.<br />
2. Chen. Y.. Senesi. N.. Schnitzer. M.. 1977. Information provide on humic substances by E4/E6<br />
ratios. Soil Sci. Soc. Am. J. 41. 352– 358.<br />
3. Fuentes. M.. Gonzáles-Gaitano. G.. García-Mina. J. 2006. The Usefulness of UV-visible and<br />
Fluorescence spectroscopy <strong>to</strong> study the chemical nature of humic substances from soil and<br />
composts. Organic Geochemistry 37. 1949-1959.<br />
4. Kalbitz.K. Geyer.W. Geyer.S. 1999. Spectroscopic properties of dissolved humic substances –<br />
a reflection of land use his<strong>to</strong>ry in a fen area. Biogeochem. 47 219-238.<br />
5. Milori. D.M. B. P; Martins-Ne<strong>to</strong>. L; Bayer. C. et al. 2002 Humification degree of soil humic acid<br />
determined by fluorescence spectroscopy. Soil Science 167.11<br />
6. Trompowsky. P.M. et al. 2005. Characterization of humic like substances obtained by<br />
chemical oxidation of eucalyptus charcoal. Organic Geochemistry 36. p 1480-1489.<br />
7. Senesi. N.. Mian. T.M. Provensano. M.R. B<strong>ru</strong>netti. G. 1989. Spectroscopic and compositional<br />
comparative characterization of IHSS reference and standard fulvic and humic acid f various<br />
origins. Sci. Total Environ. 81/92. 143.<br />
8. Shirshova. L.T. et al. 2006. Spectroscopic characterization of humic acid isolated from soil<br />
using different extraction procedures. Geoderma 133. 204-216.<br />
9. Zsolnay. A et al. 1999. Differentiating with fluorescence spectroscopy the sources of dissolved<br />
organic matter in soils subjected <strong>to</strong> drying. Chemosphere. 38 45-50<br />
46
Properties of Hydration Shell of IHSS Humic Standards<br />
Petra Bursáková, Alena Průšová, Jiří Kučerík<br />
Institute of Physical and Applied Chemistry, Faculty of Chemistry, Brno University of Technology,<br />
Purkyňova 118, 612 00 Brno, Czech Republic, kucerik@fch.vutbr.cz<br />
Keywords: humic substances, DSC, hydration<br />
1. INTRODUCTION<br />
Humic substances have a profound effect in many processes including cell biology of<br />
living organisms. As they are both hydrophobic and hydrophilic in nature, their function is<br />
closely related <strong>to</strong> the properties of water shell intimately bound on humic molecules and<br />
consequently on humic aggregates. A strong affinity of water molecules <strong>to</strong> stick <strong>to</strong> each<br />
other via H-bonds and formation of specific clusters is a driving force assembling humic<br />
molecules in<strong>to</strong> complicated organizations. Water is involved in these processes in a variety<br />
of ways, ranging from direct bridging <strong>to</strong> collective effects (such as hydrophobic effects) (1).<br />
The enumeration of water molecules is c<strong>ru</strong>cial in order <strong>to</strong> understand how biomolecular<br />
processes work.<br />
Phase transition behaviour of sorbed water in HS-water systems was investigated as<br />
a function of water content (W c ) using differential scanning calorimetry (DSC). Basically,<br />
three types of water can be distinguished by phase transition of sorbed water (2): free<br />
water (W f ) whose melting/crystallization temperature and enthalpy are not significantly<br />
different from those of normal (bulk) water; those water species exhibiting large differences<br />
in transition enthalpies and temperatures, or those for which no phase transition can be<br />
observed calorimetrically, known as freezing-bound water (W fb ) (2, 3); and non-freezing<br />
water (W nf ) which is strongly associated with the molecule and shows neither<br />
crystallization exotherms nor melting endotherms on DSC curves (2, 3).<br />
2. MATERIALS AND METHODS<br />
Material<br />
IHSS Standard samples were measured: Suwannee River II HA 2S101H (SRHA),<br />
Suwannee River II FA 2S101F (SRFA), Elliot Soil HA 1S102H (ESHA), Elliot Soil II FA<br />
2S102F (ESFA), Pahokee Peat HA 1S103H (PPHA), Pahokee Peat II FA 2S103F (PPFA).<br />
DSC Measurements<br />
The IHSS Standard samples were placed in aluminum pans (∼5 mg) and excess<br />
water was added. Surplus water was allowed <strong>to</strong> evaporate slowly at room temperature<br />
47
until the desired water content was obtained. Subsequently, the pans were hermetically<br />
sealed and left <strong>to</strong> equilibrate at room temperature overnight. Differential scanning<br />
calorimetry (DSC) was performed by using the TA Inst<strong>ru</strong>ments Q200, equipped with a<br />
nitrogen gas-cooling unit, <strong>to</strong> measure phase transition of sorbed water. The measurements<br />
were conducted ranging from 40 <strong>to</strong> –90°C and then from –90 <strong>to</strong> 30°C at 3°C min –1 under<br />
the flow of nitrogen (50 mL min –1 ). The temperature scale and heat of transition were<br />
calibrated using distilled water and indium as standards, respectively.<br />
Water content determination<br />
The thermogravimetry analysis (TGA TA Inst<strong>ru</strong>ments Q5000) was used <strong>to</strong> measure<br />
water content of original IHSS Standard samples so that the real concentration of water<br />
(W c ) in the samples could be recalculated. The W c was determined:<br />
W c (g/g) ═ weight of water (g) in HS / weight of dry HS (g).<br />
Assuming both melting enthalpies for freezing-bound water (W fb ) and free water (W f )<br />
<strong>to</strong> be 334 J g –1 water, weights of W fb and W f (g water/ g HS) could be calculated from the<br />
endothermic heating transitions. The weight of non-freezing water (W nf ) was obtained<br />
using the expression:<br />
W nf ═ W c – (W fb + W f ).<br />
3. RESULTS AND DISCUSSION<br />
IHSS standard samples with water content from 10 <strong>to</strong> 150% were measured. At the<br />
highest water content a large heating endotherm could be observed in the region of 0°C<br />
whose enthalpy of transition was close <strong>to</strong> that of bulk water (333 J g –1 ). This endotherm<br />
was ascribed <strong>to</strong> the melting of the freezing water in the hydrated HS-water system. At<br />
lower water content an endothermic transitions appeared below 0°C when the system was<br />
heated. This peak indicated the presence of freezing-bound water in a humic sample, i.e.<br />
water which is already affected by the interaction with humic molecules. Its clusters<br />
st<strong>ru</strong>cture differs from those of bulk water and is physically recognizable by shifted<br />
temperature of melting.<br />
Representative DSC heating curve of ESFA with water content W c 0.408 is given in<br />
Fig. 1 where various endothermic transitions at different temperatures, attributed <strong>to</strong> the<br />
melting of different types of ice, can be observed. These endothermic peaks, or better<br />
shoulders, marked with arrows, indicate that there are more than three types of<br />
freezing-bound water in the ESFA-water system. In fact, the enthalpy of melting differs<br />
48
from that ice which was attributed <strong>to</strong> the freezing water. Due <strong>to</strong> the different st<strong>ru</strong>cture of ice<br />
such enthalpy can drop down <strong>to</strong> 312 J g –1 (4).<br />
Measurement of sample from various sources showed in some cases different<br />
results. For instance, sample SRFA did not gave the peak melting around –30°C which<br />
indicates i) less complicated and heterogeneous molecular st<strong>ru</strong>cture than corresponding<br />
humic acid SRHA ii) lower hydrophobicity of fulvic acids.<br />
Figure 1. DSC heating curve for ESFA-water system with W c 0.408.<br />
Obtained results are in line with the theory that there exist more that one type of<br />
freezing-bound water and those significantly differ in their physical properties. In case of<br />
ES and SR HAs the presence of amorphous “glassy” ice was observed.<br />
Table 1 reports the content of non-freezing water calculated from DSC experiments.<br />
All values are determined in the range 0.38 <strong>to</strong> 0.57 g water per gram of humic substance<br />
and for their calculation the enthalpies in the range from 333 <strong>to</strong> 312 J g –1 were used (4). It<br />
is noteworthy, that in case of humic substances originated from aqueous system the<br />
higher content of non-freezing water was determined for humic instead of fulvic acid while<br />
in case of other humic “couples” vice versa. It implies the theory that water is in humic<br />
substances bound not only on the surface of aggregate but also in<strong>to</strong> the secondary humic<br />
st<strong>ru</strong>cture.<br />
49
Table 1. Comparison of non-freezing water content range in IHSS Standard samples<br />
with similar water content<br />
IHSS Standard sample<br />
W nf<br />
SRHA 0.556 - 0.536<br />
SRFA 0.380 - 0.397<br />
ESHA 0.503 - 0.511<br />
ESFA 0.560 - 0.569<br />
PPHA 0.484 - 0.495<br />
PPFA 0.516 - 0.524<br />
4. CONCLUSIONS<br />
Differential scanning calorimetry represents a technique which can help <strong>to</strong> recognize<br />
the differences in properties of water surrounding humic matter. Although same DSC<br />
technique limitations associated with processes of ice formation should be taken in<strong>to</strong><br />
account (e.g. supercooling effect) that method can bring new information regarding the<br />
function of humic substances in biological processes.<br />
ACKNOWLEDGEMENTS<br />
The financial support of Ministry of Education of the Czech Republic, project MSM<br />
0021630501 is acknowledged.<br />
REFERENCES<br />
1. Shimizu, S. 2004. Proc. Natl. Acad. Sci., 101, 1195-1199.<br />
2. Liu, J., Cowman, M. K. 2000. Journal of Thermal Analysis and Calorimetry, 59, 547-557.<br />
3. Prawitwong, P., Takigami, S., Phillips, G. O. 2007. Food Hydrocolloids, 21, 1368-1373.<br />
4. Hatakeyama, H., Hatakeyama, T. 1998. Thermochemical Acta, 308, 3-22.<br />
50
Insights in<strong>to</strong> the Composition of Humin from an Irish Grassland Soil<br />
Corinna M. Byrne 1,2 , Etelvino H. Novotny 3 , Patrick G. Hatcher 4 and Michael H.B. Hayes 1<br />
1 Chemical and Environmental Sciences Dept., University of Limerick, Ireland, corinna.byrne@ul.ie<br />
2 Teagasc Environmental Research Center, Johns<strong>to</strong>wn Castle, Co. Wexford, Ireland. 3 Embrapa<br />
Solos, Rio de Janeiro-RJ, Brazil, 4 Alfriend Chemistry Dept., Old Dominion University, Norfolk, VA,<br />
USA.<br />
Keywords: humin, humic substances, solid-state 13 C NMR spectroscopy<br />
1. INTRODUCTION<br />
Humin is defined as the fraction of the humic substances (HS) that is insoluble in<br />
aqueous solution at any pH value (1). Because of its insolubility it has been the least<br />
studied of all the humic fractions (2). Humin typically represents more than 50% of the<br />
organic carbon (C) in a soil, and is regarded as the residual organic C that remains after<br />
extraction of the HAs and FAs (3). Based on data from solid-state 13 C Nuclear Magnetic<br />
Resonance (NMR) spectroscopy, it has been concluded that a repeating aliphatic<br />
st<strong>ru</strong>ctural unit, possibly attributable <strong>to</strong> branched and cross-linked algal or microbial lipids,<br />
are common <strong>to</strong> both sediment and soil humin samples (4). Humin becomes enriched in<br />
these aliphatic substances because of their selective preservation during organic<br />
diagenesis (2). To investigate the composition of humin, The Clonakilty soil, a well drained<br />
Brown Podzolic soil in grassland lysimeter studies at the Teagasc Soils Research Centre,<br />
Johns<strong>to</strong>wn Castle, Co. Wexford, Ireland and was used in the present study.<br />
2. MATERIALS AND METHODS<br />
Soil samples were H + -exchanged and exhaustively extracted with 0.1 M NaOH, at pH<br />
7.0, then with NaOH solution adjusted <strong>to</strong> pH 10.6, then at pH 12.6, then with 6 M urea in<br />
the 0.1 M solution. Extracts were pressure filtered (0.2 μm membrane) at each pH, and<br />
sediment on the filter was returned for extraction by the next solvent in the series. The fine<br />
clays retained on the filter after extraction with the 6M urea system were collected,<br />
dialysed, and freeze dried. To isolate the humin organic C, the residue was treated with<br />
10% HF <strong>to</strong> dissolve the aluminosilicates. Some samples were further extracted with a<br />
DMSO-concentrated H 2 SO 4 (94% DMSO: 6% H 2 SO 4 ) mixture <strong>to</strong> isolate a humin fraction<br />
following extraction in aqueous base and in the basic urea medium. Solid-state 13 C NMR<br />
spectroscopy experiments were carried out at 13 C and 1 H frequencies of 100.5 and 400.0<br />
MHz, respectively. Typical cross-polarization times of 1 ms, acquisition times of 13 ms,<br />
51
and recycle delays of 500 ms were used. For Variable Amplitude Cross-Polarization<br />
(VACP) experiments a Magic-Angle Spinning (MAS) frequencies of 13 kHz was used.<br />
Bloch Decay experiments were carried out while spinning at 13 kHz with a recycle delay of<br />
1 s and a sweep width of 27 kHz.<br />
3. RESULTS AND DISCUSSION<br />
Figure 1. 13 C CP-MAS NMR spect<strong>ru</strong>m of Humin isolated from the 0-10 cm depth while<br />
spinning at 13 kHz, with a cross-polarization time of 1 ms, acquisition time of 13 ms and a<br />
recycle delay of 500 ms.<br />
Fine clay was isolated from soil at the 0-10 cm depth after exhaustive extraction with<br />
NaOH followed by NaOH and Urea. The organic matter in the isolated fine clay is<br />
classified as humin as it was found <strong>to</strong> be insoluble in aqueous media at any pH. Figure 1<br />
shows the spect<strong>ru</strong>m for 0-10 cm depth humin. In aerobic soils, the spectra of humin show<br />
the presence of polysaccharides and aromatic st<strong>ru</strong>ctures most likely derived from the lignin<br />
of vascular plants. However, another major component of humin contains paraffinic<br />
carbons and is thought <strong>to</strong> be derived from algal or microbial sources. A major peak in the<br />
humin spectra is that of aliphatic carbons at 30 ppm. Cutin and cutan from plant cuticles<br />
are considered <strong>to</strong> be major contribu<strong>to</strong>rs <strong>to</strong> this region. These st<strong>ru</strong>ctures may well be the<br />
major contribu<strong>to</strong>rs <strong>to</strong> the carboxyl or amide groups (peak at 175 ppm) (2).<br />
Proteinaceous substances would give rise <strong>to</strong> resonances in the 0-50 ppm region of<br />
13 C NMR spectra, but usually the aliphatic signals of protein are centered more closely<br />
<strong>to</strong>ward 20, 40, and 50 ppm than the 30 ppm resonance (2). Humin contains significantly<br />
less carboxyl than the corresponding HA isolate (not shown). There is little indication for<br />
lignin-like st<strong>ru</strong>ctures in the spectra because of the absence of significant peaks at 56 ppm<br />
and at 150 ppm for methoxyl and O-aromatic carbons, respectively.<br />
52
Figure 2. 13 C Bloch Decay NMR spect<strong>ru</strong>m of Humin isolated from the 0-10 cm depth while<br />
spinning at 13 kHz with a recycle delay of 1 s and a sweep width of 27 kHz.<br />
Figure 2 shows the Bloch decay 13 C NMR spect<strong>ru</strong>m for the 0-10 cm depth humin.<br />
Again the dominance of aliphatic signals is evident. The spect<strong>ru</strong>m shows an aliphatic<br />
region characterized by a small peak at 14 ppm, from CH 3 , and a large peak for mainchain<br />
CH 2 (30 ppm). It can be seen that the main-chain CH 2 groups are composed of both<br />
amorphous chains (29 ppm) and crystalline chains (32 ppm) (5)<br />
Figure 3. 13 C CP-MAS NMR spect<strong>ru</strong>m of the DMSO/H 2 SO 4 extract of Humin while<br />
spinning at 13 kHz, with a cross-polarization time of 1 ms, acquisition time of 13 ms and a<br />
recycle delay of 500 ms.<br />
53
A DMSO-concentrated H 2 SO 4 mixture has been employed <strong>to</strong> isolate a humin fraction<br />
following extraction in aqueous base and in the basic urea medium (6). It was shown that<br />
≥ 70% of the traditional humin fraction could be solubilised. The spect<strong>ru</strong>m of the dried<br />
extract can be seen in Figure 3. It contains mainly aliphatic signals with some very minor<br />
contributions from carbohydrates and carboxyl signals.<br />
4. CONCLUSIONS<br />
The humin samples studied contain contributions from aliphatic, carbohydrate, and<br />
little aromatic and carboxyl resonance. The strong aliphatic resonance would support the<br />
theory of the “selective preservation” of the more aliphatic compounds. It is necessary <strong>to</strong><br />
st<strong>ru</strong>cturally define the paraffinic components of humin and <strong>to</strong> ascertain whether these are<br />
t<strong>ru</strong>ly biomolecules or are rapidly transformed products of decomposition of vegetal matter<br />
(2). Data will be shown <strong>to</strong> highlight the contribution of cutin/cutan <strong>to</strong> the humin fraction.<br />
Further work needs <strong>to</strong> be done on this, in addition <strong>to</strong> analyses of the organic matter in the<br />
lower depths, <strong>to</strong> determine the contribution of biomolecules <strong>to</strong> humin.<br />
ACKNOWLEDGEMENTS<br />
The work is part of a project supported by Teagasc, EPA and SFI Ireland. We<br />
acknowledge the assistance in NMR provided by Professor Eduardo R. de Azevedo and<br />
Prof. Ti<strong>to</strong> J. Bonogamba.<br />
REFERENCES<br />
1. Rice, J.A. 2001. Humin. Soil Sci. 166, 848-857.<br />
2. Hatcher et al., 1985 Hatcher, P., I. Breger, G. Maciel, and N. Szeverenyi. 1985. Geochemistry<br />
of humin. In Humic Substances in Soil, Sediment, and Water. G. R. Aiken, D.M. McKnight,<br />
R.L. Wershaw, and P. MacCarthy (eds.). John Wiley, New York, pp. 275–302.<br />
3. Kononova, M. M. 1966. Soil Organic Matter. T. A. Nowakowski and A. C. D. Newman<br />
(transla<strong>to</strong>rs). Pergamon Press, Oxford.<br />
4. Hatcher, P.G., VanderHart, D.L., Earl, W.L.. 1980. Use of solid-state 13C NMR in st<strong>ru</strong>ctural<br />
studies of humic acids and humin from Holocene sediments. Org. Geochem. 2, 87–92.<br />
5. Hu, W.-G., Mao, J., Xing, B., Schmidt-Rohr, K., 2000. Poly(methylene) crystallites in humic<br />
substances detected by nuclear magnetic resonance. Environ. Sci. Technol. 34, 530–534.<br />
6. Simpson, A.J., Song, G., Smith, E., Lam, B., Novotny, E.H., and Hayes, M.H.B. 2007.<br />
Unravelling the St<strong>ru</strong>ctural Components of Soil Humin using Solution State NMR Spectroscopy.<br />
Environ. Sci. Technol. 41, 876-883.<br />
54
Characterization of Soil Organic Matter in Different Particle-Size<br />
Fractions by CP/MAS 13 C NMR Along a Slope of Subtropical<br />
Mountain Forest<br />
Chih-Yu Chiu, Wen-Wen Luang and Jenn-Shing Chen<br />
Research Center for Biodiversity, Academia Sinica, Taipei 115, Taiwan, bochiu@sinica.edu.tw<br />
Keywords: CP/MAS 13 C NMR; forest; particle size<br />
1. INTRODUCTION<br />
Soil organic matter (SOM) represents one of the largest reservoirs of carbon on the<br />
global scale and is related <strong>to</strong> the biological activity in terrestrial ecosystems. Soil along a<br />
hillslope usually exhibits remarkable differences in morphology that may be attributed <strong>to</strong><br />
the influences of moisture status, microclimate and vegetation. Fac<strong>to</strong>rs affected by<br />
<strong>to</strong>pography that differs the status of organic matter in the soil profile. Physical fractionation<br />
of soil according <strong>to</strong> particle size supported by chemical, biological and physical analyses of<br />
the fractions obtained has proven <strong>to</strong> be a useful <strong>to</strong>ol in process-oriented SOM research (3,<br />
4).<br />
This study investigated the characteristics of the soil organic matter (SOM) solid-state<br />
CP/MAS 13 C NMR spectroscopy at different slope positions in a perhumid mountain forest<br />
ecosystem. The sampling site, Yuanyang Lake, is featured with high annual rainfall (>4000<br />
mm) and elevation from 1670 <strong>to</strong> 2169 m in northeastern Taiwan. The surface soils<br />
collected were fractionated in<strong>to</strong> different particle sizes in order <strong>to</strong> clarify biological<br />
significance inside SOM.<br />
2. RESULTS AND DISCUSSION<br />
Fig. 1 shows the functional groups in most of the bulk soils were in the same<br />
abundance order despite the generally wide proportion range.<br />
Alkyl-C and carboxyl-C content increased slightly with decreasing particles size as<br />
shown in Table 1. This result is consistent with other studies showing that<br />
carbonyl/carboxyl content increases with degree of humification (5, 6). The increase in<br />
carboxyl-C might come from the lignin side-chain oxidation as well as other chemical<br />
reactions. As for aromatic-C, it seems that no consistent trend was observed.<br />
55
Fig. 1. Topographic change of solid-state CP/MAS 13 C NMR spectra for different horizons<br />
of per-humid forest soils. (a) alkyl-C, (b) O-alkyl-C, (c) di-O-alkyl-C,(d) aromatic-C,<br />
(e) carboxyl-C.<br />
On the other hand, O-alkyl-C and di-O-alkyl-C contents show different trends. The<br />
decrease in these two groups of carbons as particle size decreases from coarse <strong>to</strong> fine<br />
indicates that the extent of decomposition was more pronounced for small size fraction<br />
than large size fraction. This result strongly suggests that extent of O-alkyl-C<br />
decomposition is higher at the summit than that at other sides.<br />
Table 1. Relative intensities of the 13 C CP/MAS spectra in different soils<br />
Functional group (%)<br />
Site Horizon<br />
Alkyl-C O-alkyl-C Di-O-alkyl-C Aromatic-C Carboxyl-C<br />
Alkyl-C/<br />
O-Alkyl-C<br />
Summit Oi 26.5 45.5 10.2 13.9 3.8 0.48<br />
Oe 31.7 43.5 8.9 11.8 4.1 0.61<br />
Oa 32.6 40.1 9.0 13.0 5.2 0.66<br />
Footslope Oi 27.9 40.4 9.2 16.6 5.8 0.56<br />
Oe 28.9 41.4 9.1 15.1 5.5 0.57<br />
Oa 30.3 39.5 9.1 15.0 6.1 0.62<br />
Lakeshore Oi 29.3 40.4 10.2 14.2 6.0 0.58<br />
Oe 30.4 38.9 10.3 13.8 6.7 0.62<br />
Oa 31.0 40.1 9.9 13.1 5.9 0.62<br />
56
Table 2. The Alkyl-C/O-Alkyl-C ratios of solid-state CP/MAS 13 C NMR spectra in each<br />
particle size (mm) fraction of different soils<br />
Site 250<br />
Summit 1.05 0.85 0.74 0.61 0.32<br />
Footslope 0.92 0.98 0.73 0.62 0.55<br />
Lakeshore 0.62 0.77 0.69 0.52 0.5<br />
As suggested by (1), the ratio of alkyl-C <strong>to</strong> O-alkyl-C and di-alkyl-C (A/(O-A+di-O-A))<br />
could be used as indica<strong>to</strong>r <strong>to</strong> assess the degree of decomposition. It is clear that small<br />
particle size fraction has higher degree of decomposition as shown in Table 2. The results<br />
show that higher extent of decomposition occurred at summit than that at footslope or<br />
lakeshore. In general, drainage of soils at lakeshore site was much poorer than those at<br />
summit and footslope sites. SOM at lakeshore was the least humified.<br />
Table 3. Total C, N content (mg/g) and C/N ratio at different horizons and sites<br />
Horizon<br />
Summit Footslope Lakeshore<br />
C N C/N C N C/N C N C/N<br />
Oi 352 8.9 39.7 542 12.8 42.3 363 12.6 28.7<br />
Oe 492 17.5 28.2 512 19.1 26.7 187 8.7 21.6<br />
Oa 492 22.1 22.3 477 22.9 20.8 177 7.4 23.9<br />
In general, soil at footslope contained higher C and N content which might be due <strong>to</strong><br />
downhill erosion and deposition (Table 3). Soils at lakeshore regions have lower C and N<br />
content because of flooding (2).<br />
3. CONCLUSIONS<br />
Both the 13 C NMR and C/N results suggest that extent of decomposition was higher<br />
at summit than those at lakeshore and footslope. Based on a humification index of<br />
alkyl/(O-alkyl-C+di-O-alkyl-C), the degree of humification increased with the decrease of<br />
the particle size. Combining the physical fractionation with chemical analysis <strong>to</strong>ols could<br />
provide valuable information in SOM characterization.<br />
57
REFERENCES<br />
1. Baldock, J.A., Oades, J.M., Nelson, P.N., Skene, T.M., Golchin, A., Clarke, P., 1997.<br />
Australian Journal of Soil Research, 35, 1061-1083.<br />
2. Chen, J.S., Chiu, C.Y., 2000. Geoderma, 96, 19-30.<br />
3. Christensen, B. T., 1992. Adv. Soil Sci., 20, 1-90.<br />
4. Mathers, N.J., Mao, X.A., Xu, Z.H., Saffigna, P.G., Berners, P.S.J., Perera, M.C.S., 2000.<br />
Australian. J. Soil Research., 38, 769-787.<br />
5. Quideau, S.A., Anderson, M.A., Graham, R.C., Chadwick, O.A., T<strong>ru</strong>mbore, S.E., 2000. Forest<br />
Ecology and Management, 138, 19-27.<br />
6. Zech, W., Ziegler, F., Kogel-Knabner, I., Haumaier, L., 1992. Science of the Total<br />
Environment, 118, 155-174.<br />
58
Characterization of Chernozem Humic Acid SEC-PAGE Fractions Using<br />
DRIFT Spectroscopy and Thermal Analysis<br />
Daniela Montecchio 1 , Luciano Cavani 1 , Paola Gioacchini 1 , Ornella Francioso 1 ,<br />
Olga T<strong>ru</strong>betskaya 2 , Oleg T<strong>ru</strong>betskoj 3 , Claudio Ciavatta 1<br />
1 Department of Agro-Environmental Science and Technology, Alma Mater Studio<strong>ru</strong>m University of<br />
Bologna, V.le Fanin 40, I-40127 Bologna, Italy, daniela.montecchio@unibo.it<br />
2 Branch of Institute of Bioorganic Chemistry, Russian Academy of Sciences, 142292 Pushchino,<br />
Russia<br />
3 Institute of Basic Biological Problems, Russian Academy of Sciences, 142292 Pushchino, Russia<br />
Keywords: soil humic acid, PAGE, SEC, DRIFT, TG-DTA<br />
1. INTRODUCTION<br />
St<strong>ru</strong>ctural characterization of humic acids (HA) is a focal point <strong>to</strong> understand and<br />
establish a relationship between their st<strong>ru</strong>cture and biological properties. However, the<br />
complexity of HAs seriously limits the application of a single analytical approach. A step<br />
<strong>to</strong>wards improving our understanding of HAs role in the environments is <strong>to</strong> develop<br />
methods which can provide a complete characterization of HA st<strong>ru</strong>cture.<br />
Infrared spectroscopy (FT-IR) is considered a powerful <strong>to</strong>ol in distinguishing<br />
individual st<strong>ru</strong>ctural differences in a heterogeneous organic mixture. Particular attention<br />
was devoted <strong>to</strong> diffuse reflectance infrared Fourier transform (DRIFT) spectroscopy as a<br />
technique for analysis of humic substances from different origins (1-3). Combining this<br />
technique with thermal analysis (thermogravimetric analysis, TG and differential thermal<br />
analysis, DTA) or thermogravimetry–differential scanning calorimetry (TG-DSC) important<br />
information has been achieved on HA from different origin (3-4) or on humification process<br />
in soils and composts (3). TG-DTA analysis involves a continuous and simultaneous<br />
measurement of weight loss and energy change during heating of the sample. The mass<br />
loss can be used <strong>to</strong> compare the relative abundance of more or less labile C whilst the<br />
position of DTA peaks reflects the st<strong>ru</strong>cture and chemical composition of the sample.<br />
In the present paper the Chernozem HA and its fractions obtained by combination<br />
size exclusion chroma<strong>to</strong>graphy and polyacrylamide gel electrophoresis (SEC-PAGE setup)<br />
were investigated using DRIFT spectroscopy and TG-DTA analysis.<br />
2. MATERIALS AND METHODS<br />
The soil sample was taken from the A horizon of a Chernozem soil located in Kursk<br />
region, Russia. Method for HA extraction and their fractionation by SEC-PAGE set-up on<br />
59
different on molecular size (MS) and electrophoretic mobilities (EM) fractions A, B and<br />
C+D are reported elsewhere (5). The MS of fractions decreased with increasing of their<br />
EM. Fraction A had the highest MS and fraction C+D - the smallest MS.<br />
The elemental analysis (C and N) and the 13/12 C iso<strong>to</strong>pic ratio (δ 13 C) analyses were<br />
carried out using an elemental analyser (CHNS-O mod. EA 1110) coupled with an iso<strong>to</strong>pe<br />
ratio mass spectrometer (IRMS) (Finnigan MAT Mod. Delta Plus) (4).<br />
TG and DTA were carried out simultaneously using a TG-DTA92 inst<strong>ru</strong>ment<br />
(Setaram, France) as described in a previous paper (2).<br />
The infrared spectra were recorded with a B<strong>ru</strong>ker TENSOR series FT-IR<br />
Spectropho<strong>to</strong>meter (Madison, WI) equipped with an apparatus for diffuse reflectance<br />
(Spectra-Tech. Inc., Stamford, CT) (1).<br />
3. RESULTS AND DISCUSSION<br />
The elemental analysis results are shown in Table 1. The amount of N generally<br />
increased in the fractions and it showed an opposite trend with respect <strong>to</strong> that of the C.<br />
The δ 13 C became more negative in the lower fractions. The increased amount of N and the<br />
negative deviations of δ 13 C in the fractions with respect <strong>to</strong> HA might be due <strong>to</strong> urea traces<br />
immobilized during fractionation procedures (6).<br />
Table 1. Elemental and iso<strong>to</strong>pic analyses (δ 13 C) of HA and its fractions A, B and C+D.<br />
Samples C (%) N (%) C/N δ 13 C(‰)<br />
HA 54 5.4 10.0 -25.17<br />
A 46 7.6 6.1 -25.81<br />
B 48 9.0 5.3 -26.63<br />
C+D 48 6.8 7.1 -27.22<br />
1716<br />
2940<br />
1588<br />
1248<br />
1417<br />
2620<br />
K-M<br />
HA<br />
A<br />
B<br />
C+D<br />
3500 3000 2500 2000 1500 1000 500<br />
Wavenumber (cm -1 )<br />
Figure 1. DRIFT spectra of HA and its fractions A, B and C+D.<br />
60
The DRIFT spectra of humic fractions (Figure 1) indicated significant st<strong>ru</strong>ctural<br />
modifications. In particular, in HA appeared two strong bands at 1716 and 1248 cm -1 that<br />
are characteristic of C=O stretching and C–O stretching motions in pro<strong>to</strong>nated carboxyl<br />
groups COOH, respectively. In addition, the broad band at around 2600 cm −1 suggested<br />
the formation of intermolecular H-bonding between COOH groups in acid dimers (2).<br />
In contrast, in all fractions, the relative intensity of bands at 1716 and 1248 cm −1<br />
decreased whilst the bands at around 1588 and 1417 cm -1 , which possibly correspond <strong>to</strong><br />
C=O stretching and C–O stretching motions in not pro<strong>to</strong>nated carboxyl groups COO -<br />
and/or N-H bending, did not show changes in the relative intensity. Moreover, the<br />
disappearing of the band at 2600 cm -1 in fractions, suggests that H-bond are mostly<br />
broken by the action of urea.<br />
The intensity of the 1040 cm - 1 band decreases with fraction MS. This band<br />
corresponds <strong>to</strong> C-O vibrations of ethers or alcohols and can be attributed <strong>to</strong><br />
carbohydrates. Thus one can conclude that their concentration decreases with decreasing<br />
of fraction MS. Other characteristic bands appearing at 2940 and 2825 cm −1 were<br />
assigned <strong>to</strong> C-H vibrations in methyl and methylene groups in aliphatic components. The<br />
relative intensity of these bands noteworthy decreased in lower MS fractions B and C+D.<br />
457<br />
Exo<br />
329<br />
373<br />
390<br />
394<br />
340<br />
378<br />
344<br />
465<br />
490<br />
496<br />
100 200 300 400 500 600<br />
Temperature (°C)<br />
HA<br />
A<br />
B<br />
C+D<br />
Figure 2. DTA of HA and its fractions A, B and C+D.<br />
The DTA curves of HA and its fractions (Figure 2) were mainly characterized by two<br />
exothermic reactions: the first (300–450 °C) corresponded <strong>to</strong> the decarboxylation reaction<br />
of acidic groups, proteins, carbohydrates and fatty acid decomposition, while the second<br />
(450–600°C) was attributed <strong>to</strong> the breakdown of aromatic st<strong>ru</strong>ctures and cleavage of the<br />
C-C bond (2, 4). Different thermal profiles and mass losses were measured in fractions A,<br />
61
B, C+D. In high MS fraction A a strong mass loss (about of 63%) was observed for the 1 st<br />
peak and a mass loss of about 18% for the 2 nd peak, indicating that the thermal<br />
decomposition mainly involved carboxyl groups and aliphatic components. In fraction B<br />
decreased the mass loss of the 1 st peak (about 44%) and increased that of the 2 nd peak<br />
(about 25%). In the lower MS fraction C+D we observed a noteworthy decreased of the 1 st<br />
exothermic reaction (loss mass about 31%) while thermal reaction of 2 nd peak was<br />
prevalent. A shift of the 2 nd peak <strong>to</strong>wards lower temperature in C+D than those of A and B<br />
fractions suggested the presence in C+D of aromatic moieties with a large number of<br />
oxygenate substituents.<br />
4. CONCLUSIONS<br />
TG-DTA and DRIFT analysis of Chernozem HA fractions A, B, C+D obtained by<br />
SEC-PAGE setup showed important st<strong>ru</strong>ctural modifications with respect <strong>to</strong> HA<br />
unfractionated. This data is likely <strong>to</strong> have a broad environmental significance because the<br />
lower MS humic st<strong>ru</strong>ctures are directly involved in chemical/biological processes at soilplant<br />
interface.<br />
ACKNOWLEDGEMENTS<br />
This research was supported with funds provided by INTAS grant 06-8055 and<br />
University of Bologna (ex Quota 60%, 2006).<br />
REFERENCES<br />
1. Francioso, O., Sánchez-Cortés, S., Tugnoli, V., Marzadori, C., Ciavatta, C. 2001. J. Mol.<br />
St<strong>ru</strong>ct. 565, 481-485.<br />
2. Montecchio, D., Francioso, O., Carletti, P., Pizzeghello, D., Chersich, S., Previstali, F. and<br />
Nardi, S. 2006. J. Thermal Anal. Cal. 83, 393 - 399.<br />
3. Francioso, O., Ferrari, E., Saladini M., Montecchio, D., Gioacchini, P., Ciavatta C. 2007. J.<br />
Haz. Mat. 149, 408-417.<br />
4. Francioso, O., Montecchio, D., Gioacchini, P., Ciavatta, C. 2005. Appl. Geochem. 20/3, 537-<br />
544.<br />
5. T<strong>ru</strong>betskoj, O.A., T<strong>ru</strong>betskaya, O.E., Afanas'eva G.V., Reznikova, O.I., Saiz-Jimenez, C.<br />
1997. J.Chromat. A 767, 285-292.<br />
6. Sànchez-Cortés, S., Corrado, G., T<strong>ru</strong>betskaya, O.E., T<strong>ru</strong>betskoj, O.A., Hermosin, B., Saiz-<br />
Jimenez, C., 2006. Appl. Spectr., 60, 48-53.<br />
62
Au<strong>to</strong>dock Simulation of Interactions Among Humic Substances and<br />
Proteins<br />
Maurizio Polano 1,2 , Claudio Anselmi 3 , Liviana Leita 4 and Maria De Nobili 2<br />
1 SISSA Neurobiology Sec<strong>to</strong>r, Basovizza, Trieste, Italy<br />
2 Dept. of Agriculture and Enviromental Sciences, Università di Udine, Italy<br />
3 International School for Advanced Studies (SISSA/ISAS) and CNR-INFM-DEMOCRITOS<br />
Modelling Centre for Research in A<strong>to</strong>mistic Simulation, Trieste, Italy<br />
4 C.R.A. Consiglio per la Ricerca e Sperimentazione in Agricoltura, Centro di Ricerca per lo Studio<br />
delle Relazioni Pianta-Suolo, Sede Distaccata di Gorizia, Italy<br />
Keywords: computer simulation, docking, humic substances, protein, prion.<br />
1. INTRODUCTION<br />
Computer simulation was employed in this work <strong>to</strong> individuate possibile binding sites<br />
of humic substances <strong>to</strong> proteins and in particolar with segments 121-231 of the murine<br />
prion protein and 90-231 of the human prion protein. The simulation was carried out with<br />
the aid of the program Au<strong>to</strong>Dock 3.05 (1). Au<strong>to</strong>dock was developed <strong>to</strong> provide an<br />
au<strong>to</strong>mated procedure for predicting the interaction of ligands with biomacromolecular<br />
targets and was initially tested on a number of protein-substrate complexes characterized<br />
by x-ray crystallography. The original procedure used a Monte Carlo simulated annealing<br />
technique for configurational exploration using grid-based molecular affinity potentials and<br />
has proven <strong>to</strong> be a powerful approach <strong>to</strong> the problem of molecular docking. In the later<br />
versions, which adopt an Au<strong>to</strong>Grid procedure, the protein is embedded in a threedimensional<br />
grid and a probe a<strong>to</strong>m is placed at each grid point. The energy of interaction<br />
of this single a<strong>to</strong>m with the protein is assigned <strong>to</strong> the grid point. An affinity grid is<br />
calculated for each type of a<strong>to</strong>m in the substrate, typically carbon, oxygen, nitrogen and<br />
hydrogen, as well as a grid of electrostatic potential, either using a unit positive point<br />
charge as probe, a Poisson-Boltzmann finite difference method. Au<strong>to</strong>Dock version 3.0,<br />
utilizes a new, hybrid search technique based on a modified genetic algorithm, with 2-point<br />
crossover and random mutation.<br />
2. MATERIALS AND METHODS<br />
The HA initial model st<strong>ru</strong>ctures were generated by means of PRODRG server (2).<br />
Geometry optimization was then performed using the PM3 semiempirical method as<br />
implemented in Gaussian 03 program. Partial point charges were calculated by means of a<br />
63
ab-initio single-point calculation at HF/6-31G(d) level and RESP fitting. The PrP C model<br />
(from V121 <strong>to</strong> S232) derived from the NMR st<strong>ru</strong>cture of the prion proteins was obtained<br />
from the Protein Data Bank.<br />
The au<strong>to</strong>mated docking procedure was performed considering the protein static. The<br />
Lamarckian genetic algorithm was used as search method, starting from a population of<br />
1000 individuals with a maximum of 750,000 energy evaluations and 256x256x256 points<br />
grid with 0.3 Å spacing. All other parameters were left as the default. As a result, 1000<br />
different complexes were obtained. Electrostatic potentials at the proteins surfaces were<br />
calculated by solving the Poisson-Bolzmann equation using the MOLMOL program.<br />
3. RESULTS AND DISCUSSION<br />
The humic model molecules can assume many different conformations and bind <strong>to</strong> at<br />
several different positions on the surface of the proteins without any apparent specificity. In<br />
order <strong>to</strong> cast light on the binding between proteins and HA, we therefore analyzed the<br />
docked complexes in order <strong>to</strong> find which amino acids, are more frequently found in the<br />
proximity (
St<strong>ru</strong>ctural Characteristics of Soil Humin Fractions in Different Tillage<br />
Systems<br />
Sen Dou, Kai Li, Qing-hai Wang, Yao Liang<br />
College of Resource and Environmental Science, Jilin Agricultural University, No. 2888. Xincheng<br />
Street, Changchun, 130118, Jilin Province,China, dousen@public.cc.jl.cn<br />
Keywords: st<strong>ru</strong>ctural characteristics, humin composition, iron-linked HM (HMi), clay-combined HM<br />
(HMc), tillage system<br />
1. INTRODUCTION<br />
Soil humin (HM) is an important fraction of humic substances, accounting for 30% <strong>to</strong><br />
50%. HM is of great significance in agricultural production, environmental protection and<br />
carbon sequestration (1). Pallo method fractionate HM in<strong>to</strong> iron-linked HM (HMi), claycombined<br />
HM (HMc), inherited HM and highly developed HM (2), Because there are less<br />
inherited HM, Dou combined it with highly developed HM in<strong>to</strong> a new one and named<br />
insoluble humin residues (HMr) (2).<br />
The information on the effect of tillage systems on humic substances could be found,<br />
such as Pérez (4) and Slepetiene (5), but very limited. Especially the report on HM<br />
compositional fractions (HMi, HMc and HMr) has not appeared. In order <strong>to</strong> evaluate the<br />
effects of different tillage systems on the different HM fractions, the elemental composition,<br />
thermal properties, IR spectra and solid 13 C-NMR spectra of HMi and HMc extracting from<br />
black soils of different tillage systems were analyzed in this paper.<br />
2. MATERIALS AND METHODS<br />
Black soil samples (Argiudolls in USDA Soil Taxonomy) were collected from the longterm<br />
field experiment of Changchun Institute of Geography and Agricultural Ecology,<br />
Chinese Academy of Sciences that was established at Dehui county (N44°21′, E148°150′),<br />
Changchun city, Jilin province, China, in 2001. The climate is temperate continent<br />
monsoon climate with a yearly average temperature of 4.4°C. The tillage treatments were<br />
ridge tillage (crop residues on the ridge of the harvest were not cleared until the next<br />
sowing, and no disturbance between the harvest and the next sowing, RT), no tillage<br />
(using the crop residues of harvest <strong>to</strong> cover soil and no moving when next sowing, NT)<br />
and autumn plough (the crop residues of the harvest were directly ploughed in<strong>to</strong> soil in the<br />
autumn, AP). The tillage plots (RT, NT and AP) were 5.2m×20m with successive maizebean<br />
rotation for 5 years and arranged 4 replications. The above samples are all from<br />
65
0~20cm <strong>to</strong>psoil. With the Pallo method, fractionated soil organic matter in<strong>to</strong> humic acid<br />
(HA), fulvic acid (FA) and HM, and then fractionate HM in<strong>to</strong> HMi, HMc and HMr. The HMi<br />
and HMc were purified and freeze dried. Elemental composition was determined by Vario-<br />
EL III (Germany). Differential thermal analysis (DTA) was conducted with Shimazu TG-60<br />
(Japan). The IR spectra were measured with KBr pellet method by a Nicolet AVATAR 360<br />
inst<strong>ru</strong>ment (USA) and semi-quantitative treating was carried out. The E 4 /E 6 ratios and<br />
LogK values were calculated as the method of Dou (3). Solid 13 CP/MAS NMR were<br />
recorded on B<strong>ru</strong>ker AV400 (Switzerland). The other measurements were proceeded by<br />
conventional methods.<br />
3. RESULTS AND DISCUSSION<br />
3.1. <strong>Humus</strong> composition<br />
The soil <strong>to</strong>tal carbon contents of RT, NT and AP were 18.58 g kg -1 , 18.09 g kg -1 , and<br />
18.15 g kg -1 , respectively. The carbon proportion ranges of HA and FA were 26.8~34.71%<br />
and 7.27~14.37%, and the carbon proportions of HMs for RT, NT and AP were 32.73%,<br />
32.88% and 33.49%, respectively.<br />
3.2. Elemental compositions of HMi and HMc<br />
The C, H, N, and O+S contents of the extracted HMi and HMc under 3 tillage<br />
treatments were showed in Table 1. The element compositions of HMi and HMc were<br />
different in 3 tillage systems. The average C/H ratio of HMc was higher than HMi. This<br />
indicated that the molecular condensation degree of HMc was higher than HMi. Under<br />
different tillage systems, The HMi of NT had the highest C/H (1.194) ratios. For HMc the<br />
sequence of C/H ratio was RT>NT>AP, and NT was quite close <strong>to</strong> RT. It indicated that NT<br />
was the highest one for the molecular condensation degrees of HMi and HMc.<br />
Table1. Elemental composition of HMi and HMc under different tillage systems<br />
Samples<br />
C H N O+S<br />
(g kg -1 )<br />
C/H C/N O/C<br />
NT-HMi 540.0 37.68 25.54 396.8 1.194 24.67 0.551<br />
AP-HMi 510.7 37.77 25.62 425.9 1.127 23.26 0.626<br />
RT-HMi 485.9 44.98 25.66 443.4 0.900 22.09 0.684<br />
Average-HMi 512.2 40.14 25.61 422.1 1.074 23.34 0.620<br />
NT-HMc 551.6 30.19 33.16 385.1 1.522 19.40 0.524<br />
AP-HMc 519.7 29.56 32.26 418.4 1.465 18.79 0.604<br />
RT-HMc 534.2 29.07 32.57 404.2 1.531 19.13 0.567<br />
Average-HMc 535.2 29.61 32.67 402.6 1.506 19.11 0.565<br />
Note: RT, NT and AP represent ridge tillage, no tillage and autumn plough,<br />
respectively. The notes for the treatments in the following figures were same.<br />
66
3.3. Thermal properties of HMi and HMc<br />
As we can see from Figure 1, the HMi and HMc had exothermic peaks in moderate<br />
(250~301°C) and high (401~446°C) temperature regions. The average heat ratio of the<br />
high <strong>to</strong> moderate temperature exothermic regions (H 3 /H 2 ratio) of HMi was higher than<br />
HMc. The heat of <strong>to</strong>tal reactions (H t ) and the H 3 /H 2 ratio of HMc in the NT treatment were<br />
the highest in the 3 tillage systems and were 14.7 KJ g -1 and 97.0, respectively. This<br />
showed that HMc had lower aromatic/aliphatic ratio compared with HMi and that<br />
aromatic/aliphatic ratio for HMc of NT were the highest in the 3 tillage systems.<br />
Figure 2. The IR spectra of HMi under<br />
Figure 1. The DTA of HMi and HMc under<br />
different tillage systems.<br />
different tillage systems.<br />
3.4. IR spectra of HMi and HMc<br />
It can be seen from Figure 2 and Figure 3 that the aliphatic C-H vibration (2920cm -1 ,<br />
2850 cm -1 ) and the 2920/1620 ratios of HMc were stronger than HMi. Comparing IR<br />
spectra of different tillage treatments, the sequences of the 2920/1620 ratios for HMi and<br />
HMc were AP(0.362)>RT(0.262)>NT(0.069) and RT(0.837)>AP(0.598)>NT(0.179),<br />
respectively. This showed that HMc was more aliphatic than HMi.<br />
3.5. Solid 13CP/MAS NMR spectra of HMi and HMc<br />
The signals of HMc at 173ppm, 72ppm, 55ppm and 29ppm were stronger than HMi<br />
(Figure 4). The average relative carbon contents of alkyl were HMi(33.3%)>HMc(30.9%),<br />
but it was opposite for the contents of O-alkyl and carboxyl. The HMi and HMc had more<br />
aromatic C (18.3-23.2%)and less aliphatic C (44.7-44.8%) compared with the AP(16.3-<br />
18.7% for aromatic C and 47.3-50.3% for aliphatic C). This indicated that NT was more<br />
favorable <strong>to</strong> increasing the aromatic st<strong>ru</strong>cture and decreasing the aliphatic st<strong>ru</strong>cture, which<br />
was consistent with the results of the E 4 /E 6 ratios and the LogK values.<br />
67
Figure 3. The IR spectra of HMc under<br />
different tillage systems.<br />
Figure 4. The 13 C-NMR spectra of HMi<br />
under different tillage systems.<br />
4. CONCLUSIONS<br />
The molecular condensation degree, complex degrees and the amount of aliphatic<br />
groups were HMc>HMi. Under different tillage systems, NT was highly favorable <strong>to</strong><br />
increasing the condensation and complex degrees of HMi and HMc.<br />
ACKNOWLEDGEMENTS<br />
National Natural Science Foundation of China (NSFC) (40271069, 4041076) and the<br />
Specialized Research Fund for the Doc<strong>to</strong>ral Program of Higher Education (SRFDP)<br />
(20040193002).<br />
REFERENCES<br />
1. Rice, J.A. 2001. Soil Science. 11, 848-857.<br />
2. Pallo, F.J.P. 1993. In: Soil Organic Matter Dynamics and Sustainability of Tropical Agriculture,<br />
K. Mulongoy and R. Merckx (Eds), Awiley-Sayce, Leuven, Belgium, pp. 109-120.<br />
3. Dou, S., Xiao, Y.C., Zhang, J.J. 2006. Acta pedologica sinica. 43, 934-940.<br />
4. Pérez, M.G., Martin-Ne<strong>to</strong>, L., Saab, S.C., et al. 2004. Geoderma. 118, 181-190.<br />
5. Bayer, C., Martin-Ne<strong>to</strong>, L., Mielniczuk, J., et al. 2002. Geoderma. 105, 81-92.<br />
68
A Water Soluble Polymer as a Working St<strong>ru</strong>ctural Model for Humic<br />
Acids: H-binding and Spectroscopic Properties<br />
Marios Drosos, Evangellos Giannakopoulos, Yiannis Deligiannakis<br />
Lab of Physical Chemistry, Dept. of Environmental & Natural Resources Management, Seferi 2,<br />
30100 Agrinio, Greece. ideligia@cc.uoi.gr<br />
Keywords: humic, model, polymer<br />
1. INTRODUCTION<br />
HA occur ubiqui<strong>to</strong>usly in terrestrial and aquatic environments, indicating that many<br />
precursors and several formation pathways exist. Distinguishing among these pathways<br />
has been difficult because individual scientists have tended <strong>to</strong> concentrate their efforts on<br />
specific types of samples (e.g. soil, sediment or water) for which different isolation or<br />
fractionation methods are often used (1). Humic acids ultimately result from abiotic and<br />
biotic polymerisation and polycondensation reactions involving such small precursors (1).<br />
The relative importance of abiotic and biotic processes in humification in soils and<br />
sediments still remains obscure even though much research has been devoted <strong>to</strong> them<br />
(2). For example the oxidative polymerization of phenols, which is an important precursor<br />
reaction in the formation of HA, is catalysed both by enzymes and abiotic (inorganic)<br />
catalysts (2, 3, 4) Polyphenols have been shown <strong>to</strong> be important precursors in the abiotic<br />
formation of HA (4). More particularly, the oxidative polymerization of polyphenols in soils<br />
is thought <strong>to</strong> be one of the major processes of formation of humic substances (5).<br />
According <strong>to</strong> the polyphenolic theory (6) , humic acids are formed from simple phenols and<br />
phenolic acids via the formation of a semiquinone radical (7). Coupling of semiquinones<br />
originating from diphenols can lead <strong>to</strong> the formation of stable humic polymers under the<br />
catalytic action of Mn (IV) oxides (2). In the present case, we have focused our work on<br />
molecules bearing both carboxy and phenolic moieties as well as radical activity. In this<br />
model, pro<strong>to</strong>catechuic acid (3,4-dihydroxybenzoic acid), and gallic acid (3,4,5-<br />
trihydroxybenzoic acid) are among the main low molecular weight aromatic acids formed<br />
after lignin degradation (7). As we have reported recently (7, 8) polymerization of the<br />
mono-, di-, and trihydroxyphenolic compounds may occur in alkaline media i.e. under<br />
ambient O 2 . i.e. under conditions where radicals are formed.<br />
In the present work, we have investigated the oxidative co-polymerization of some<br />
simple hydrobenzoic molecules which have been shown <strong>to</strong> be good models certain<br />
physicochemical properties of humic acids. As we show by controlling the pH, redox<br />
69
potential and the ratio of the polyphenolics, a water soluble polymer is produced that<br />
mimics certain key- physicochemical and spectroscopic properties of humic acids.<br />
3. RESULTS AND DISCUSSION<br />
The UV-Vis spect<strong>ru</strong>m for the water soluble polymer derived by copolymerisation of<br />
gallic acid and pro<strong>to</strong>catachuic acid is shown in Figure 1. The spect<strong>ru</strong>m bears strong<br />
resemblance with the UV-Vis spect<strong>ru</strong>m for HA (6).<br />
3<br />
E4/E6: 7.12<br />
E4/E6: 7.28<br />
E4/E6: 7.23<br />
100ppm<br />
300ppm<br />
400ppm<br />
A<br />
2<br />
1<br />
0<br />
500 600 700 800<br />
nm<br />
Figure 1. UV-Vis spectra (pH 8, 0.05M NaHCO3 ) for the synthetic HA at various<br />
concentration. The calculated E4/E6 ratios are shown for each concentration.<br />
FT-IR Spectroscopy:<br />
The FT-IR spectra for the synthetic polymer, Figure 2, exhibit the typical FT-IR bands<br />
of humic substances in the regions of 3410 cm -1 (H-bonded OH groups), 2920 cm -1<br />
(aliphatic C-H stretching), 1720 cm -1 (C=O stretching of COOH and ke<strong>to</strong>nes), 1620 cm -1<br />
(aromatic C=C and H-bonded C=O), 1400 cm -1 (O-H deformation, CH 3 bending, C-O<br />
stretching of phenolic OH, and COO - antisymetric stretching of aryl esters), 1250 cm -1 (C-O<br />
stretching and OH deformation of COOH, C-O stretching of aryl esters), and 1050 (C-O<br />
stretching of polysaccharide or polysaccharide-like substances ) (6).<br />
70
Leonardite HA<br />
Synthetic HA<br />
Absorbance<br />
ga+prc<br />
prc<br />
ga<br />
4000 3500 3000 2500 2000 1500 1000 500<br />
Wavenumber (cm -1 )<br />
Figure 2. FT-IR Spectra of gallic acid, pro<strong>to</strong>catechuic acid and both of them as monomers<br />
versus the polymer form of synthetic HA and showing the similarity <strong>to</strong> Leonardite HA.<br />
H-Binding: The pH-dependence of the charge of the synthetic polymer determined<br />
from the H-binding data is plotted in Figure 3. The charging curve in Figure 3 show that in<br />
the pH range 4 <strong>to</strong> 10, soil HA show a charge variation ~ 4.5 [equiv. Kg -1 ].<br />
charge (equiv kg -1 )<br />
-6<br />
-4<br />
-2<br />
0<br />
4 6 8 10<br />
Figure 3. Charge vs. pH curves for the synthetic polymer. Solid lines is NICA-Donnan fit <strong>to</strong><br />
the data by using the parameters listed in Table 1.<br />
71<br />
pH
The H-binding data can be fitted by using the NICA-Donnan model which invokes two<br />
sets of distributed pKa values in the range 4-6 corresponding <strong>to</strong> carboxy groups, and pKa<br />
=7-9 corresponding <strong>to</strong> phenolic groups, similar <strong>to</strong> that typically observed in natural humic<br />
acids (6). The H-binding curve for the synthetic polymer bears strong resemblance with the<br />
H-binding curves usually reported for natural humic acids (6). Moreover the H-binding data<br />
can be quantitatively fitted, by using the NICA-Donnan parameters listed in Table 1<br />
Table 1. Otimal Parameter Values for the Pro<strong>to</strong>n Binding Data for the NICA-Donnan Model<br />
Sample R 2 b Q 1 Q 2 Q 1 % Q 2 % m 1 m 2 logK 1 logK 2<br />
Synthetic 0.9995 0.68 4.05 5.39 42.9 57.1 0.47 0.18 4 6.7<br />
4. CONCLUSIONS<br />
A polymer derived from copolymerization of gallic acid and pro<strong>to</strong>catachuic acid can<br />
be precipitated from aqueous solution at pH
Characterization of Humic Acids from Peat Column Using Pyrolysis-<br />
GC/MS<br />
Linda Eglite 1 , Maris Klavins 1 , Janis Sire 1 , Galina Dobele 2 , Galina Telysheva 2 ,<br />
Vilhelmina Jurkjan 2<br />
1 University of Latvia, 19 Raina Blvd. LV 1586, Riga, Latvia, linda.eglite@gmail.com<br />
2 Latvian State Institute of Wood Chemistry, 27 Dzerbenes Str. LV 1006, Riga, Latvia<br />
Keywords: peat, humic acid, pyrolysis-GC/MS<br />
1. INTRODUCTION<br />
The importance of humic acids (HA) in nature is invaluable. Despite HA are involved<br />
in many processes in environment (carbon and nutrient cycles, buffering capacity of soils<br />
and water, interactions with mineral particles and organic pollutants) the understanding of<br />
their st<strong>ru</strong>ctural chemistry is still insufficient. One approach for investigation of complicated<br />
st<strong>ru</strong>cture of humic substances is use of degradation methods of well characterized<br />
samples, following with analyses of degradation products. In this study the pyrolitical<br />
degradation of humic acids were performed and product analysis with GC/MS were done.<br />
The aim of this study was <strong>to</strong> find out basic st<strong>ru</strong>ctural similarities/ dissimilarities between<br />
various humic acid samples isolated from deferent depths of peat column.<br />
2. MATERIALS AND METHODS<br />
Peat samples were collected from high type bog Ploce, Mazais Veikenieks and<br />
Dizais Veikenieks, Western part of Latvia. 5 profiles of peat column were separated: 0-25,<br />
25-52, 52-75, 75-98, 98-118 cm and extraction of humic acids were performed using 0.1 M<br />
NaOH. The age of the peat samples were detected using carbon dating. The chemical<br />
nature and st<strong>ru</strong>ctural composition of those samples of humic substances were analyzed<br />
with an off-line tetramethylammonium hydroxide (TMAH) treatment procedure followed up<br />
with Py-GC/MS (1). In the same samples their element composition and spectral<br />
characterization (UV, fluorescence, IR, 1 H NMR, 13 C NMR) has been determined.<br />
3. RESULTS AND DISCUSSION<br />
The macromolecules of humic substances in the process of pyrolysis decompose <strong>to</strong><br />
80-100 various low molecular compounds. The main degradation products obtained by Py-<br />
GC/MS (Fig. 1) were the alkanes, alkenes, methyl derivatives of phenols and alkylphenols,<br />
phenolic and aliphatic acids. These findings allow <strong>to</strong> compare different humic substances<br />
according <strong>to</strong> their st<strong>ru</strong>ctural composition.<br />
73
Table 1. The characteristic of peat, used for isolation of humic acids<br />
Peat sample<br />
Depth,<br />
cm<br />
Peat age,<br />
years<br />
Peat type<br />
Ploce 110 -130 110-130 1670 High type cot<strong>to</strong>n-grass – sphagnum peat<br />
Mazais Veikenieks 30-60 30-60 650 High type Magellan’s sphagnum peat<br />
Mazais Veikenieks 90-125 90-125 1180 Low type tree – grass peat<br />
Dizais Veikenieks 0-25 0-25 520 High type fuscum peat<br />
Dizais Veikenieks 25-52 25-52 750 High type fuscum peat<br />
Dizais Veikenieks 52-75 52-75 980 High type fuscum peat<br />
Dizais Veikenieks 75-98 75-98 1165 High type fuscum peat<br />
Dizais Veikenieks 98-118 98-118 1350 High type fuscum peat<br />
Figure 1. GC/MS chroma<strong>to</strong>graphy of humic acid isolated from Dizais Veikenieks 25-52.<br />
4. CONCLUSIONS<br />
Despite studied peat samples very much differ in their origin and botanical<br />
composition, the properties of their degradation products and other characteristic indicate<br />
high degree of similarity.<br />
REFERENCES<br />
1. Leh<strong>to</strong>nen, T., Peuravuori, J., Pihlaja, K. 2000. Analytica Chimica Acta, 424, 91–103.<br />
74
Random Generation of 3D St<strong>ru</strong>ctures of Humic Substances<br />
Alain Porquet 1 , Yves Chapron 1 and Montserrat Filella 2<br />
1 Alpine Institute of Environmental Dynamics, L’Entropierre, Rue du Puy 108, F-38660 La Terrasse,<br />
France<br />
2 SCHEMA, Rue Principale 92, L-6990 Rameldange, Luxembourg, filella@schema.lu<br />
Keywords: humic, fulvic, 3D st<strong>ru</strong>ctures, random generation<br />
The impact of humic substances on key environmental and biogeochemical<br />
processes cannot be overstated. Yet, despite decades of investigations, the fundamental<br />
question of the 3D st<strong>ru</strong>ctures of humic substances remains unresolved. This is the<br />
underlying reason behind the ongoing debate about the molecular and supramolecular<br />
st<strong>ru</strong>cture of humic substances in aqueous solutions, in soils and at mineral-water<br />
interfaces (i.e., t<strong>ru</strong>e macromolecular entity versus supramolecular assemblage of relatively<br />
small molecules). In addition, the application of computational modeling -widely used in<br />
many areas of modern chemical, biological and geological sciences- <strong>to</strong> the investigation of<br />
humics and their interactions is jeopardized by the lack of reliable 3D st<strong>ru</strong>ct<strong>ru</strong>res because<br />
it requires the input of the detailed a<strong>to</strong>mic st<strong>ru</strong>cture of the substances studied.<br />
Patrick MacCarthy, in an extremely clarifying book chapter published in 2001, stated<br />
the following “First Principle of humic substances” (1): “Humic substances comprise an<br />
extraordinary complex, amorphous mixture of highly heterogeneous, chemically reactive<br />
yet refrac<strong>to</strong>ry molecules, produced during early diagenesis in the decay of biomatter, and<br />
formed ubiqui<strong>to</strong>usly in the environment via processes involving chemical reactions of<br />
species randomly chosen from a pool of diverse molecules and through random chemical<br />
alteration of precursor molecules” (bold ours). It follows from this principle that two different<br />
approaches can be applied when trying <strong>to</strong> solve the problem of the 3D st<strong>ru</strong>cture of humic<br />
substances: (i) <strong>to</strong> assume a mean st<strong>ru</strong>cture whose properties reflect the mean properties<br />
experimentally measured in humic substances; (ii) <strong>to</strong> mimic the random nature of humic<br />
st<strong>ru</strong>ctures by generating random st<strong>ru</strong>ctures from predefined fragments. Both approaches<br />
have been used in the generation of 3D st<strong>ru</strong>ctures of humic substances. Earlier<br />
computational studies exploited fixed ‘building-block’ st<strong>ru</strong>ctures, such as the well-known<br />
Steeling and TNB (Temple-Northeastern-Birmingham) st<strong>ru</strong>ctures (2, 3) const<strong>ru</strong>cted on the<br />
basis of known elemental analysis and distributions of organic functional groups. The<br />
generation of 3D st<strong>ru</strong>ctures using an algorithm of computed-assisted st<strong>ru</strong>cture elucidation<br />
75
(CASE) <strong>to</strong> a comprehensive set of spectroscopic and analytical data (4) is an example of<br />
the second approach.<br />
We have developed a program (FULVITOR, written in C) for the generation of<br />
statistical series of 3D st<strong>ru</strong>ctures from a given collection of elementary chemical functional<br />
groups (the fragment database). The gradual assembly of the various fragments present in<br />
the database is performed randomly according <strong>to</strong> an original ‘self-generation’ algorithm.<br />
Our conceptual approach extends <strong>to</strong> 3D st<strong>ru</strong>ctures the s<strong>to</strong>chastic methodology originally<br />
developed by Murray and Linder in RANDOM (5-7) for 2D st<strong>ru</strong>ctures. The algorithm, as<br />
well as the links between the fragment database composition and the final ensemble of<br />
produced st<strong>ru</strong>ctures, have been described in detail in (8). FULVITOR contains two<br />
additional modules that test whether the st<strong>ru</strong>ctures obtained during the generation process<br />
adjust <strong>to</strong> some pre-established steric and chemical constraints. A first fragment database<br />
has been built <strong>to</strong> specifically model Suwannee River fulvic acid (SRFA). It is composed of<br />
27 fragments chosen on the basis of a number of published experimental data. The<br />
analysis of 5000 st<strong>ru</strong>ctures generated by FULVITOR for SRFA shows that their elementary<br />
analysis differs by less than 1% from experimental values. Additionally, the calculated<br />
mass distribution overlaps experimental distributions obtained by Fluorescence Correlation<br />
Spectroscopy, Field Flow Fractionation and Nuclear Magnetic Resonance.<br />
REFERENCES<br />
1. MacCarthy, P. 2001. In: Humic Substances. St<strong>ru</strong>ctures, Models and Functions, E.A. Ghabbour<br />
and G. Davies (Eds.), Royal Society of Chemistry, Cambridge, pp. 19-30.<br />
2. Davies, G., Fataftah, A., Cherkasskiy, A., Ghabbour, E.A., Radwan, A., Jansen, S.A., Kolla, S.,<br />
Paciolla, M.D. Sein, L.T.J., Buermann, W., Balasubramanian, M., Budnick, J., Xing, B. 1997. J.<br />
Chem. Soc. Dal<strong>to</strong>n Trans. 21, 4047-4060.<br />
3. Steelink, C. 1985. In: Humic Substances in Soil, Sediment, and Water, G.R. Aiken, D.M.<br />
McKnight and R.L. Wershaw (Eds.), John Wiley, New York, pp. 457-476.<br />
4. Diallo, M.S., Simpson, A., Gassman, P., Faulon, J.-L., Jonhson, J.-H., Goddard, W.A.,<br />
Hatcher, P.G. 2003. Environ. Sci. Technol. 37, 1783- 1793.<br />
5. Murray, K., Linder, P.W. 1983. J. Soil Sci. 34, 511-523.<br />
6. Murray, K., Linder, P.W. 1984. J. Soil Sci. 35, 217-222.<br />
7. Linder, P.W., Murray, K. 1987. Sci. Tot. Environ. 64, 149-161.<br />
8. Porquet, A., Bianchi, L., S<strong>to</strong>ll, S. 2003. Coll. Surf. A 217, 49-54.<br />
76
Biodegradation of Humic Acid by White Rot Fungi Determined by<br />
1 H NMR Spectroscopy and Ultra-High Resolution FTICR<br />
Mass Spectrometry<br />
Tzafrir Grinhut 1 , Norbert Hertkorn 2 , Philippe Schmitt-Kopplin 2 , Yitzhak Hadar 1 and<br />
Yona Chen 1<br />
1 Faculty of Agricultural, Food and Environmental Quality Sciences, The Hebrew University of<br />
Je<strong>ru</strong>salem, P.O. Box 12, Rehovot 76100, Israel, granit@agri.huji.ac.il<br />
2 GSF-Forschungszent<strong>ru</strong>m für Umwelt und Gesundheit, Institut für Ökologische Chemie,<br />
Ingolstaedter Landstrasse 1, 85758 Neuherberg, Germany<br />
Keywords: humic substances, white rot fungi, NMR, FTICR-MS<br />
1. INTRODUCTION<br />
Humic acids (HA), the main fraction of humic substances, comprise an extraordinarily<br />
complex, amorphous mixture of highly heterogeneous, chemically reactive yet refrac<strong>to</strong>ry<br />
molecules (1). White rots fungi (WRF) are among the most efficient HA degraders due <strong>to</strong><br />
their nonspecific oxidizing enzymes: manganese peroxidase (MnP), lignin peroxidase (LiP)<br />
and laccase. In addition, other enzymes such as hydrolases are probably involved during<br />
biodegradation (2), and numerous studies regarding <strong>to</strong> the enzymatic patterns have been<br />
performed (2,3). However, little is known about the chemical changes occurring during the<br />
biodegradation. Here, we present in-depth analyses of HA biodegradation by WRF using<br />
1 H NMR spectroscopy and Fourier transform cyclotron resonance mass spectrometry<br />
(FTICR-MS), an advantageous combination, considering the complex composition of both<br />
HA, the fungal medium and its metabolites.<br />
2. MATERIALS AND METHODS<br />
2.1. Organisms: Trametes sp. M23 and Phanerochaete sp. Y6 were grown on PDA<br />
plates (4).<br />
2.2. Media and culture condition: The fungi were grown in shaked Erlenmeyer flasks<br />
containing defined medium and 300 mg l -1 HA. HA was extracted from compost as<br />
described previously (4). The fungi were incubated at 35 o C. The degradation products<br />
were collected from the incubated cultures on days 3, 5, and 8 by filtration through glassmicrofiber<br />
filters, followed by 0.22-µm filter. Control treatments were tested without HA and<br />
in non-inoculated flasks. For organic st<strong>ru</strong>ctural spectroscopy, HA were isolated from 2 ml<br />
acidified samples (20 µl formic acid, 25%) by solid phase extraction on preconditioned C 18 -<br />
77
disks (Varian, Inc.; conditioning with pure methanol and with 0.25% formic acid). Elution<br />
was done with methanol ("hypergrade" quality, Merk, Darmstadt, Germany).<br />
2.3. Chemical and physical analyses: The UV-VIS spectra were measured using an<br />
Ultrospec 2100 pro (Amersham Biosciences) <strong>to</strong> asses bleaching of the HA.<br />
FTICR mass spectrometry: Negative ion ESI mass spectra were acquired on a<br />
B<strong>ru</strong>ker Dal<strong>to</strong>nics (Bremen, Germany) 12 T Apex Qe FTICR mass spectrometer equipped<br />
with an Advion (Ithaca, NY, USA) TriVersa Nanomate on-chip nano-electrospray system.<br />
Spectra were calibrated internally on clusters of fatty acids in the required mass range.<br />
Mass errors of these peaks were always less than 0.1 ppm. Mass spectra were exported<br />
<strong>to</strong> peak lists and elemental formulas were calculated using a program written in-house.<br />
Double bond equivalents (DBE) and aromaticity index (AI) were calculated as previously<br />
described (5). The following elements and number of a<strong>to</strong>ms were considered in the<br />
calculation: 12 C (1-100), 1 H (1-200), 16 O (0-80), 14 N (0-5), 32 S (0-1), with the following<br />
restrictions applied after calculations: H/C < 2.2, O/C < 1, N/C < 0.5, and DBE ≥ 0.<br />
1 H-NMR spectroscopy: spectra were acquired with a B<strong>ru</strong>ker (Rheinstetten, Germany)<br />
DMX 500 NMR spectrometer operating at 500.13 MHz pro<strong>to</strong>n frequency. SPE derived<br />
methanolic solutions were evaporated in vacuum solubilized in CD 3 OD, evaporated again<br />
and redissolved in 700 µl 0.1 N NaOD prior <strong>to</strong> NMR acquisition. One-dimensional 1 H NMR<br />
spectra were recorded using the first increment of the presat-NOESY sequence (90°( 1 H) =<br />
9.3 µs; acquisition time = 4.7 s, relaxation delay = 10.3 s, mixing time = 1 ms, exponential<br />
line broadening = 0.3 Hz). NMR integration was performed manually from printed spectra.<br />
3. RESULTS AND DISCUSSION<br />
3.1. HA bleaching: the extent of bleaching was considered <strong>to</strong> be an indica<strong>to</strong>r of the<br />
HA degradation rate. A comparison of the bleaching abilities of Trametes sp. M23 and<br />
Phanerochaete sp. Y6, presented in Fig 1, shows large bleaching ability for both fungi with<br />
P. Y6 appearing more active under these conditions. These results are similar <strong>to</strong> previous<br />
HA degradation experiments with fungi grown on perlite as a solid support (4). Although<br />
perlite simulates fungal growth under aerobic condition, the use of liquid cultures with<br />
defined media allowed us <strong>to</strong> eliminate the NaOH extraction. Under liquid culture<br />
conditions, the samples were more homogenous and the isolation of the HA degradation<br />
products was more straightforward.<br />
3.2. 1 H-NMR spectroscopy and FTICR mass spectrometry: 1 H NMR spectra of the<br />
HA extracted from the fungal cultures at days 3, 5, and 8 are shown in Fig 1. Integration of<br />
the 1 H-NMR spectra according <strong>to</strong> specific regions of chemical shift provides the amounts of<br />
78
non-exchangeable pro<strong>to</strong>ns shown in Table 1. About 12% of the non-exchangeable pro<strong>to</strong>ns<br />
of the HA extracted from the non inoculated control were assigned <strong>to</strong> terminal aliphatic<br />
groups, whereas after 8 days of biodegradation this amount decreased <strong>to</strong> almost half in<br />
both treatments (6.3 % for both P. Y6 and T. M23 respectively). A similar decrease was<br />
observed for the NMR resonance with δ( 1 H) = 0.9-1.3 ppm, assigned mainly <strong>to</strong> CH 2 groups<br />
(Fig. 1). Remarkable decrease in aromaticity was also detected during biodegradation: the<br />
amount of the non-exchangeable aromatic pro<strong>to</strong>ns of HA extracted from the control<br />
(12.8%) decreased <strong>to</strong> near half its initial value in day 8 for both fungi (6.1 and 5.8%,<br />
respectively, Table 1). The aromatic index (AI), computed from the FTICR-MS data (Table<br />
1) exhibits sizable decrease in case of P. Y6 and near constancy in case of T. M23. Within<br />
the chemical shift region of 2.8-4.4 ppm we noticed an increase in both treatments as<br />
compared with the control, indicating an increase of oxygen-containing functional groups in<br />
HA during biodegradation. These findings are in agreement with the increase in the O/C<br />
elemental ratios observed using the FTICR mass spectral data. (Table 1).<br />
Absorbance (456 (465 nm)<br />
nm)<br />
0.8<br />
0.7<br />
0.6<br />
0.5<br />
0.4<br />
0.3<br />
0.2<br />
0.1<br />
0<br />
A1 Phanerochaete sp, Y6 B1 Trametes sp, M23<br />
Medium + HA<br />
(control)<br />
Medium<br />
+ HA<br />
A2<br />
Day 3 Day 5 Day 8<br />
Day 3 Day 5 Day 8<br />
Absorbance (465 nm)<br />
Absorbance<br />
(465 nm)<br />
0.8<br />
0.7<br />
0.6<br />
0.5<br />
0.4<br />
0.3<br />
0.2<br />
0.1<br />
0<br />
Medium + HA<br />
(control)<br />
Day 8<br />
Day 8<br />
Medium +<br />
Day 3<br />
HA<br />
B2<br />
Day 3 Day 5 Day 8<br />
Day 5 Day 8<br />
Day 5<br />
Day 5<br />
Day 3<br />
Day 8<br />
Day 5<br />
Day 3<br />
Medium +<br />
Medium +<br />
HA (control)<br />
Day 3<br />
HA (control)<br />
ppm 9<br />
8 7<br />
6 5<br />
4 3<br />
2 1<br />
ppm9<br />
8 7<br />
6 5<br />
4 3<br />
2 1<br />
Figure 1. Decolorization of HA by Phanerochaete sp. Y6 (A1) and Trametes sp. M23 (B1).<br />
1 H-NMR spectra (A2 and B2) of HA extracted during biodegradation.<br />
4. CONCLUSIONS<br />
In summary, we observed bleaching of HA in liquid culture. Degradation of HA was verified<br />
by physical and chemical changes measured during the process by two different WRF<br />
using 1 H NMR spectroscopy and FTICR mass spectrometry. During the process we<br />
detected oxidation, dealkylation and a decrease in the aromatic content of the HA.<br />
79
Table 1. (A) 1H-NMR integrals of six major resonance regions of the spectra presented<br />
above; (B) Aromaticity index and elemental analyses as detected by FTICR-MS<br />
A<br />
1 H NMR section integrals<br />
Assignment<br />
δ( 1 H) ppm<br />
HA extracted from<br />
fungal medium<br />
P.6<br />
day 3<br />
P.Y6<br />
day 5<br />
P.Y6<br />
day 8<br />
T.M23<br />
day 3<br />
T.M23<br />
day 5<br />
T.M23<br />
day 8<br />
% 1 H NMR integral<br />
10.0-6.0 C ar -H 12.8 7.3 6.1 7.2 13.1 16.8 5.8<br />
6.0-4.8<br />
R n C=CH<br />
OCO-CHR<br />
0.6 3.3 0.9 0.7 1.5 1.5 0.9<br />
4.4-2.8<br />
R n CHOR,<br />
R n NCH<br />
38.9 41.2 52.0 48.9 36.1 33.4 61.8<br />
2.8-1.7<br />
C ar -CH n<br />
R 2 NCH n 11.6 14.1 13.9 16.4 9.6 10.4 8.1<br />
RC(=O)CHR n<br />
1.7-0.9 R n CH 24.3 21.6 19.8 20.5 26.7 26.6 17.1<br />
0.9-0.5 RCH 3 11.8 12.5 7.3 6.3 13.0 11.3 6.3<br />
B<br />
FTICR mass spectral analyses<br />
aromaticity index<br />
analyses (AI) (%) *<br />
17.6 11.1 11.2 5.3 10.9 13.8 11.0<br />
computed average<br />
elemental<br />
compositions<br />
% weight<br />
C 62.6 59.0 58.3 58.8 60.4 58.7<br />
H 6.1 6.5 5.9 6.4 6.7 6.4<br />
N 4.0 3.6 4.7 5.7 2.6 5.1<br />
O 24.8 27.0 27.1 26.6 27.1 26.9<br />
* % AI was calculated as summing the number of all molecules with AI above 0.67,<br />
divided by <strong>to</strong>tal number of molecules detected<br />
ACKNOWLEDGEMENTS<br />
The authors wish <strong>to</strong> thank the DFG, Germany, project: "Irrigations with municipal<br />
effluents: effects on physical soil properties, contaminant transport, soil carbon dynamics,<br />
soil microbial activity and crop quality"; the Ring foundation project: "Degradation and<br />
transformations of humic substances in the environment"; for their financial support; the<br />
IHSS for the research fellowship granted <strong>to</strong> the first author; We thank Silvia Thaller and<br />
Eva Holzmann for the technical assistance.<br />
REFERENCES<br />
1. MacCarthy P, 2001. Soil Science 166:738-751.<br />
2. Grinhut T, Hadar Y and Chen Y, 2007. Fungal Biology Reviews 21, 179-189.<br />
3. Steffen K.T, Hatakka A, Hofrichter M, 2002. Applied and Environmental Microbiology 68, 3442-<br />
3448.<br />
4. Granit T, Chen Y, Hadar Y, 2007. Soil Biology and Biochemistry 39, 1040-1046.<br />
5. Koch B.P, Dittmar T, 2006. Rapid Communications in Mass Spectrometry 20, 926-932.<br />
80
Limitations in High Resolution NMR Analysis of Humic Acids<br />
Kari Hänninen<br />
University of Jyväskylä, Department of Biological and Environmental Science, P.O.Box 35, FIN-<br />
40014 University of Jyväskylä, kahannin@bytl.jyl.fi<br />
Keywords: humic acid, 13 C NMR, olefinic and aromatic double bonds<br />
1. INTRODUCTION<br />
According <strong>to</strong> the wet chemical determinations the st<strong>ru</strong>cture of humic acids (HA) is not<br />
very aromatic. Yields of aromatic degradation products are usually less than 3%. On the<br />
other hand, according <strong>to</strong> the 13 C NMR analyses the aromatic st<strong>ru</strong>cture of HA is claimed <strong>to</strong><br />
be more than 30%.<br />
The aim of this study was <strong>to</strong> find out why two chemical methods give contradic<strong>to</strong>ry<br />
rather than expected complementary results when applied <strong>to</strong> the st<strong>ru</strong>ctural study of HA.<br />
2. MATERIALS AND METHODS<br />
This study is made deductively, studying the potentials of modern high resolution<br />
NMR spectroscopy <strong>to</strong> resolve reliably olefinic and aromatic double bond carbon and<br />
pro<strong>to</strong>ns in the st<strong>ru</strong>cture of HA.<br />
3. RESULTS AND DISCUSSION<br />
Olefinic and aromatic pro<strong>to</strong>ns and carbons in single, well-defined compounds having<br />
conjugated carbon-carbon double bonds can be differentiated from each other by high<br />
resolution NMR. The number of carbons and pro<strong>to</strong>ns in the st<strong>ru</strong>ctures of these single<br />
compounds are relatively few. So the number of magnetically non-equivalent carbons and<br />
pro<strong>to</strong>ns are also low. NMR spectra contain now only few signals which furthermore are<br />
very sharp. In 13 C NMR spect<strong>ru</strong>m the signals are practically sharp lines, the chemical shift<br />
values of which can be accurately determined.<br />
The spect<strong>ru</strong>m also exhibits a characteristic fine splitting provided by the spin-spin<br />
coupling of the adjacent pro<strong>to</strong>ns or carbons. This method is important in 1 H NMR<br />
spectroscopy ( 13 C NMR is usually <strong>ru</strong>n with the decoupling mode). For st<strong>ru</strong>ctural<br />
identification of organic molecules the combined data of chemical shift values and that of<br />
spin-spin coupling is required.<br />
HA have a very heterogeneous st<strong>ru</strong>cture. In 13 C NMR or 1 H NMR spectroscopy this<br />
means that the number of magnetically non-equivalent pro<strong>to</strong>ns and carbons are very large.<br />
81
Each of them gives, of course, a sharp peak with low intensity, but with slightly different<br />
chemical shift value. Actually, these shifts are so close <strong>to</strong> each other that the resolution<br />
power of the present NMR inst<strong>ru</strong>ments cannot differentiate them as isolated lines. This is<br />
causing broadening of the line widths which is appearing in 1 H or in 13 C NMR spectra as a<br />
single broad peak.<br />
First of all, this means that spin-spin coupling cannot provide any fine splitting and so<br />
reliable st<strong>ru</strong>ctural identification thereof is not possible. The st<strong>ru</strong>ctural identification of HA<br />
must be based on the chemical shift values alone.<br />
The chemical shift values of olefinic and aromatic pro<strong>to</strong>ns or carbons are, however,<br />
overlapping due <strong>to</strong> broad peak. This renders the differentiation of olefinic carbons or<br />
pro<strong>to</strong>ns from those of aromatic ones extremely uncertain, practically impossible.<br />
The assignment of a certain 13 C NMR or 1 H NMR signal of HA as aromatic in terms of<br />
chemical shift values is possible only, when it is otherwise proved that the particular HA in<br />
question does not contain olefinic double bonds. So far the non-existence of olefinic<br />
st<strong>ru</strong>ctures in HA has not proved.<br />
In spite of that, the signals due <strong>to</strong> the unsaturated carbons of HA are widely assigned<br />
solely as aromatic in many HA studies. This assignment is more or less wishful thinking.<br />
In terms of aromaticity the spectral determinations comes closer <strong>to</strong> the values<br />
provided by wet chemical analyses when we accept the fact that the carbon-carbon double<br />
bonds in HA are more olefinic than aromatic of nature.<br />
4. CONCLUSIONS<br />
The 1 H and 13 C NMR spectra of HA are rather reliably telling the amount of carboncarbon<br />
unsaturation, the sum of olefinic and aromatic double bonds. Due <strong>to</strong> the limitations<br />
of the high resolution NMR analysis in the HA research, the interpretation of 1 H and 13 C<br />
NMR signals solely as aromatic on the basis of chemical shift values is inaccurate.<br />
82
Investigation of Chemical St<strong>ru</strong>cture of Natural Organic Matters<br />
from Dried Figs<br />
Ken-ichi Hatano 1 , Kenji Kubota 1 , Masa<strong>ru</strong> Tanokura 2<br />
1 Department of Chemistry and Chemical Biology, Graduate School of Engineering, Gunma<br />
University, 1-5-1 Tenjin-cho, Gunma 376-8515, Japan, hatano@chem-bio.gunma-u.ac.jp<br />
2 Department of Applied Biological Chemistry, Graduate School of Agricultural and Life Sciences,<br />
University of Tokyo, 1-1-1 Yayoi, Tokyo 113-8657, Japan<br />
Keywords: chemical st<strong>ru</strong>cture; Ficus carica; humic substance; organic matter; proteinase inhibi<strong>to</strong>r<br />
1. INTRODUCTION<br />
Humic substances (HS) are polyelectrolytes produced by the abiotic alteration of plant<br />
and animal tissue during the early decomposition of natural organic matter and are found<br />
in the soils, sediments, and surface waters on the earth (1). They are important<br />
components of soil refrac<strong>to</strong>ry organic matter and play critical roles in sediment processes<br />
such as metal reduction and pollutant transport. Recently, Hatano has found that<br />
decomposing plant tissues, dried figs contains novel colored materials, P and B samples<br />
(2). They were revealed not <strong>to</strong> adsorb a column of CM-Sephadex under any condition,<br />
while they strongly adsorbed a DEAE-Sephadex column. This indicates that these<br />
samples have a lot of strong negative charges, which is a representative characteristic of<br />
HS. It is worth noting that the UV-vis absorption and IR spectra of the P and B samples<br />
resemble those of HS (2), indicative of a kind of HS (2).<br />
Previously, we measured the preliminary spectra of the P and B samples by using<br />
matrix-assisted laser desorption ionization–time-of-flight mass spectrometry (MALDI-TOF-<br />
MS). As a result, these samples were revealed <strong>to</strong> consist of relatively small molecules with<br />
molecular masses around 500–1400 Da (2), although the detailed chemical and<br />
conformational st<strong>ru</strong>cture could not be determined. In this presentation, we focus on the<br />
sample B due <strong>to</strong> its high ionization efficiency and chose several MS techniques <strong>to</strong> obtain<br />
insight in<strong>to</strong> the st<strong>ru</strong>ctural regularities as observed in a kind of HS, fulvic acids. As a<br />
consequence, the regularities of molecular mass patterns were also observed on the MS<br />
spectra of the B sample (3), but the elemental analysis and solid-state nuclear magnetic<br />
resonance spectra showed that the sample was not typical humic materials, indicative of a<br />
novel organic matter (3). At last, we propose the putative chemical st<strong>ru</strong>cture of the sample<br />
B, based on the above-mentioned data.<br />
83
2. MATERIALS AND METHODS<br />
2.1. Materials<br />
Dried fig f<strong>ru</strong>it in California (Black Mission) was purchased from a local market, and<br />
the P and B samples were purified as described previously (2). S<strong>to</strong>ck solutions of the<br />
samples for MS analysis were prepared in Milli-Q water at a concentration of 1 mg mL -1 .<br />
2,5-dihydroxybenzoic acid (DHB) was purchased from Sigma–Aldrich (St. Louis, MO).<br />
2.3. Mass spectrometry<br />
Fast a<strong>to</strong>m bombardment (FAB)-MS was carried out on a JEOL JMS-SX102<br />
spectrometer (JEOL, Tokyo, Japan) for the initial characterization. Thioglycerol and 1-N<br />
hydrochloric acid were added <strong>to</strong> the s<strong>to</strong>ck solution in a volume ratio of 5:1. The JMS-<br />
SX102 has a mass range of 3500 Da at 8-kV accelerating potential, and approximately<br />
0.5–0.7 μL of the thioglycerol matrix containing the sample was applied <strong>to</strong> a stainless steel<br />
sample stage mounted on the end of a high-vacuum push rod.<br />
MALDI-TOF-MS analysis was performed on a KOMPACT MALDI-4 mass<br />
spectrometer (Shimadzu/Kra<strong>to</strong>s, Manchester, UK). A DHB matrix-saturated solution was<br />
prepared in a 3:7 mixture of ace<strong>to</strong>nitrile and Milli-Q water containing 0.1% trifluoroacetic<br />
acid. The dried-droplet technique was used for MALDI-TOF-MS sample preparation. The<br />
mass spectra were recorded in both linear and reflection modes, and the mass range was<br />
m/z 0–3000.<br />
Tandem MS (MS/MS) experiments were conducted using a Q-TOF-II mass<br />
spectrometer (JASCO International/Micromass, Manchester, UK) equipped with a<br />
Nanoflow electrospray ionization (ESI) interface. Sample solutions were prepared by<br />
tenfold dilution of the s<strong>to</strong>ck solutions in methanol/0.28% ammonia (1:1) and introduced in<strong>to</strong><br />
a Nanoflow capillary with a flow rate set <strong>to</strong> 10–50 nL min -1 .<br />
3. RESULTS AND DISCUSSION<br />
3.1. FAB and MALDI-TOF mass spectra<br />
The FAB-MS spectra of the P and B samples in a positive ion mode were very similar<br />
<strong>to</strong> each other, although the signal-<strong>to</strong>-noise ratio (S/N) was relatively poor (data not shown).<br />
The mass-distribution shapes of the sample B indicated a shifted-sinebell function with a<br />
periodicity of 44 Da, and the maximum molecular weight of the B sample was estimated<br />
approximately 1500 Da. We call the fragment of 44 Da as a quark (Q) module for an<br />
explanation of the fragmentation scheme.<br />
The MALDI-TOF mass spectra of the sample B showed obvious regularities in peak<br />
appearance (3). There were two peak-appearance groups (higher peaks at m/z 361, 699,<br />
84
1037, 1375; lower ones at m/z 537, 875, 1213, 1566). The mass difference between the<br />
two groups (for example, peaks at m/z 361 and 537) certainly indicated 176 Da; on the<br />
other hand, the differences among the peaks within each group (for instance, peaks at m/z<br />
361 and 699) were 338 Da. Here, we respectively designate the fragments of 176 Da and<br />
338 Da as a<strong>to</strong>m modules, A1 and A2. Each peak had some additional peaks, probably the<br />
precursor ions [M–O] + and [O–M–O] + , indicating that each precursor ion has two etherlinkage<br />
sites.<br />
In the post-source decay (PSD) spect<strong>ru</strong>m of the B sample, the most intense product<br />
ion at m/z 361 would probably be a starting material for the polymerization of the sample<br />
B, since sample fragmentations in the source region are strongly induced in the PSD<br />
experiments (3). The product ions at m/z 355, 361, and 377 would be the oxygen and<br />
sodium adduct of the A2 module, probably [A2–O] + , [A2–Na] + , and [O–A2–Na] + ,<br />
respectively. Actually, sodium ions were detected as a peak at m/z 23 in the spect<strong>ru</strong>m.<br />
3.2. ESI-Q-TOF tandem mass spectra<br />
In the ESI-Q-TOF mass spect<strong>ru</strong>m, two mass distributions (m/z ranges of 100–400<br />
and 1000–1500) indicated monovalent anions with 1.0-Da inter-peak spacing; in contrast,<br />
the distribution in the range of m/z between 600–900 showed divalent anions that were<br />
observed at every half-mass (3). We observed three peak clusters at the beginning of m/z<br />
624, 712, and 800 in the enlarged spect<strong>ru</strong>m, each of which would have two binding sites<br />
such as [M–K] – and [K–M–K] – . The mass difference between the three clusters appeared<br />
<strong>to</strong> be 88 Da, which corresponded <strong>to</strong> singly charged ions at m/z 176.<br />
In the product-ion spectra of m/z 712, 731, and 750, the fragmentation ion at m/z 175<br />
was the most intense among the other peaks and was considered as a representative<br />
repeated st<strong>ru</strong>cture of the parent ions (3). Accordingly, these product ions would be<br />
assembled by a number of the A1 modules. We also observed the other important<br />
fragments of 113, 131, 193, and 351 Da, indicating elimination of water from three Q<br />
modules, three Q modules, the addition of water <strong>to</strong> the A1 module, and two A1 modules,<br />
respectively. Thus, we could explain the constitution of all the product ions by using the Q<br />
module, which is consistent with the results of the FAB-MS experiment (data not shown).<br />
3.3. Putative molecular st<strong>ru</strong>cture<br />
We propose here the fragmentation scheme of the sample B, which allows us <strong>to</strong><br />
predict the preliminary molecular st<strong>ru</strong>cture (Q module) (Figure 1A). The sample would be<br />
composed of the modules A1 and A2, each of which is made of the Q module. The A1<br />
module would be formed by polymerization of four Q modules (Figure 1B), while the<br />
module A2 might be formed by trimerization of the dehydrated polymer from three Q<br />
85
modules (Figure 1C). The modules A1 and A2 might connect with each other, probably by<br />
polymerizations, ether linkages, and hydrogen bonding, leading <strong>to</strong> a mass variety of the B<br />
sample (designed as a molecular module) as observed in the MS spectra. For example,<br />
the precursor ion of 891 Da, one of the molecular (M) module, might be composed of one<br />
A1 module and two A2 modules, one of which is the sodium and oxygen adduct. Thus, we<br />
could explain almost all M modules of the sample B by using the modules Q, A1, and A2.<br />
However, we must remember that these product ions were observed just by ionization of<br />
the MS experiments. In this scheme, we do not address the large amounts of nitrogen<br />
observed in the elemental analysis (3). Probably, the nitrogen a<strong>to</strong>ms would constitute a<br />
part of the unionized moiety, which might be involved in hydrogen bond like O–H···N.<br />
Similarly, the P sample would be composed of the Q module basically, since we also<br />
observed the 44-Da inter-peak spacing in the FAB-MS spect<strong>ru</strong>m. The molecular st<strong>ru</strong>cture<br />
of the P sample would be much more complicated than that of the B sample.<br />
Figure 1. Schematic representation of<br />
the Q (A), A1 (B), and A2 modules (C).<br />
Triangles indicate the backbone of the Q<br />
module, and available double bonds in<br />
the Q module are shown as solid lines<br />
from the triangles. The module A2 at m/z<br />
338 would be formed by trimerization of<br />
the dehydrated tri-Q polymer at m/z 113.<br />
ACKNOWLEDGEMENTS<br />
We wish <strong>to</strong> thank Dr. Noriko Kagi (JASCO International, Japan) for the use of a<br />
Micromass Q-Tof II spectrometer with a Nanoflow ESI interface and for her analytical and<br />
technical support. The authors are grateful <strong>to</strong> Dr. Jun Ashida (Varian Technologies Japan<br />
Ltd., Japan) for the use of a Varian Unity INOVA 400WB spectrometer. Drs. Kimihiro Go<strong>to</strong><br />
(Sumika Chemical Analysis Service) and Koji Nagata (University of Tokyo, Japan) are also<br />
appreciated in the elemental analyses and FAB-MS measurements, respectively.<br />
REFERENCES<br />
1. Aiken, G. R., McKnight, D. M. 1985. In Humic Substances in Soil, Sediment and Water, 1-9.<br />
2. Hatano, K-i. 2006. J. Agric. Food Chem., 54, 562-567.<br />
3. Hatano, K.-i., Kubota, K., Tanokura, M., 2008. Food Chem. 107, 305-311.<br />
86
Spectral Characterization of Plant-Derived Dissolved Organic Matter<br />
Zhongqi He 1 , Jingdong Mao 2 , Wayne Honeycutt 1 , Tsu<strong>to</strong>mu Ohno 3 , James F. Hunt 3 ,<br />
Barbara J. Cade-Menun 4<br />
1 USDA-ARS, New England Plant, Soil, and Water Labora<strong>to</strong>ry, Orono, ME 04469, USA,<br />
Zhongqi.He@ars.usda.gov<br />
2 Dept. of Chemistry & Biochemistry, Old Dominion University, Norfolk, VA 23529, USA<br />
3 Dept. of Plant, Soil, and Environmental Sciences, Univ. of Maine, Orono, ME 04469, USA<br />
4 Geol. & Environ. Sci. Dept., Stanford University, Stanford, CA 94305, USA<br />
Keywords: dissolved organic matter, Fourier-transform infrared spectroscopy, nuclear magnetic<br />
resonance spectroscopy<br />
1. INTRODUCTION<br />
Dissolved organic matter (DOM) derived from fresh or early-stage decomposing soil<br />
amendment materials may play an important role in the process of organic matter<br />
accumulation (1). The DOM can influence many chemical processes, due <strong>to</strong> its reactivity<br />
with both soil solution components and soil surfaces (1, 2). Previously, DOM extracted<br />
from plant biomass representing commonly employed U.S. agricultural amendments was<br />
used <strong>to</strong> investigate P sorption inhibition by DOM (2). The results demonstrated that the<br />
extent of inhibition is closely related <strong>to</strong> the chemical st<strong>ru</strong>cture of both the DOM and the<br />
sorbing surface (2). However, the mechanism by which this inhibition operates remains<br />
unresolved (2). Characterization by wet chemistry methods demonstrated that, in contrast<br />
<strong>to</strong> previously-published observations, characteristics of these DOMs were wide ranging,<br />
varying greatly within fractions for different sources (1). In this work, therefore, we<br />
characterized the plant-derived DOM with Fourier-transform infrared (FT-IR), solution 31 P<br />
nuclear magnetic resonance (NMR), and solid-state 13 C NMR spectroscopies. Spectral<br />
information obtained from this study will provide a better understanding of the relationship<br />
between DOM composition and behavior in soil environments. For comparison, DOM from<br />
dairy manure was also characterized in the same way.<br />
2. MATERIALS AND METHODS<br />
Plant shoot biomass was obtained from field grown Alfalfa (Medicago sativa L.), corn<br />
(Zea mays L.), crimson clover (Trifolium incarnatum L.), hairy vetch (Vicia villosa L.), lupin<br />
(Lupinus albus L.), soybean (Glycine max L. Merr.), and wheat (Triticum aestivum L.), airdried,<br />
and ground <strong>to</strong> pass through a 1-mm sieve. The dairy cattle (Bos tau<strong>ru</strong>s) manure<br />
sample was acquired locally, air-dried, and passed through a 2-mm sieve. The DOM was<br />
87
extracted with a 40:1 (v:w) water <strong>to</strong> sample ratio using cold water and refrigerating (4 o C)<br />
the suspension for 18 h with periodic shaking by hand. The suspensions were then<br />
centrifuged (900 × g) for 30 min prior <strong>to</strong> vacuum filtering through 0.4 micron pore size<br />
polycarbonate filters (2). The DOM extracts were then freeze-dried and kept at a<br />
dessica<strong>to</strong>r at room temperature until use.<br />
Freeze-dried DOM was dissolved in 0.6 mL 10 M NaOH, 1.0 mL D 2 O, and 0.6 mL<br />
water and was allowed <strong>to</strong> stand for 30 min with occasional vortexing. Solution 31 P NMR<br />
spectra were acquired at 242.75 MHz on a Varian INOVA600 MHz spectrometer equipped<br />
with a 10-mm broadband probe, using a 90° pulse, 0.68-s acquisition, 4.32-s pulse delay,<br />
82.4-μsec dwell time, 17.9-μsec pulse width and 12-Hz spinning (3).<br />
The Fourier Transform-Infrared Spectra (FT-IR) were obtained in the 450-4,000 cm -1<br />
range on a PerkinElmer Spect<strong>ru</strong>m One FT-IR Spectropho<strong>to</strong>meter from discs containing<br />
about 1 mg sample and 100 mg KBr. Each sample was scanned 24 times with a resolution<br />
of 2 cm -1 . All spectra were normalized.<br />
Solid-state 13 C NMR spectroscopic analysis was performed in a B<strong>ru</strong>ker DSX400<br />
spectrometer at 100 MHz for 13 C using 7-mm sample ro<strong>to</strong>rs for best sensitivity, in a<br />
double-resonance probe head. Three experiments (Fig. 2) were <strong>ru</strong>n for each sample (4, 5).<br />
3. RESULTS AND DISCUSSION<br />
The solution 31 P NMR spectra of DOM extracted from alfalfa and soybean shoots<br />
were relatively simple (Fig. 1) as both contain only orthophosphate and monoester P. The<br />
distribution between the two types of P is 86% orthophosphate and 14% monoester P in<br />
alfalfa shoot. However, the distribution in soybean shoot was 68% orthophosphate and<br />
32% monoester P. Within the monoester P of soybean shoot DOM, 70% is phytate P.<br />
DOM from corn shoot contained less monoester P (8% of <strong>to</strong>tal P) and the other five DOM<br />
samples contained orthophosphate only (data not shown).<br />
FT-IR spectra of plant-derived DOM were typical for natural organic matter (data not<br />
shown). However, there were some differences observed among the eight DOM samples.<br />
For example, the bands at 1678 and 1529 cm -1 were more obvious in the FT-IR spect<strong>ru</strong>m<br />
of lupin DOM, suggesting it contained more olefinic or aromatic compounds. In the spectra<br />
of alfalfa and wheat DOM, the bands at 1400 cm -1 were broad and strong, suggesting<br />
these two DOM sources contain more aliphatic and/or phenolic groups.<br />
The solid-state 13 C NMR spectra of the seven plant-derived DOM samples can be<br />
classified in<strong>to</strong> three groups (Fig. 2). The spectra of three leguminous plants, alfalfa, hairy<br />
vetch, and soybean, are quite similar. The spectral characteristics indicated that these<br />
88
DOM sources were primarily composed of soluble carbohydrates and certain soluble<br />
organic acids, amino acids, peptides, and phenolic compounds. The spectra of the other<br />
two leguminous plants, crimson clover and lupin, seem similar but with three sharp peaks<br />
at 35, 51, and 176 ppm. The three additional peaks indicate that these two DOM sources<br />
could contain significant aspartate. The spectra of wheat and corn are also similar <strong>to</strong> each<br />
other and similar <strong>to</strong> those of soybean DOM, although certain differences exist. In contrast,<br />
the spectra of dairy manure are significantly different. Its spectra are broad and more<br />
featureless, indicating humification with significant amounts of nonpro<strong>to</strong>nated carbons and<br />
lignin residues.<br />
4. CONCLUSIONS<br />
Dissolved organic matter from seven plant shoots and a dairy cattle manure were<br />
characterized by FT-IR, solution 31 P and solid-state 13 C NMR spectroscopic techniques.<br />
The spectral data provided P and C bonding information for these DOM samples. All DOM<br />
sources were primarily composed of soluble carbohydrates, as well as some other soluble<br />
organic compounds such as organic acids, amino acids, and phenolic compounds. In<br />
contrast, dairy manure displayed properties characteristic of humified products. The<br />
differential st<strong>ru</strong>ctures of these DOM sources could be useful for understanding their effects<br />
on soil nutrient availability <strong>to</strong> plants.<br />
Soybean<br />
8 7 6 5 4 3 2 1 PPM<br />
Alfalfa<br />
30 20 10 0 -10 -20 PPM<br />
Figure 1. Solution 31 P NMR spectra of dissolved organic matters extracted from soybean<br />
and alfalfa shoots.<br />
89
Figure 2. Spectral editing for identification of functional groups in 13 C NMR. Three<br />
experiments were conducted: 13 C CP/TOSS spectra showing qualitative st<strong>ru</strong>ctural<br />
information; corresponding dipolar-dephased 13 C CP/TOSS spectra showing<br />
nonpro<strong>to</strong>nated carbons and mobile segments like CH 3 , acquired after a period of 40 μs<br />
without decoupling; and selection of sp 3 -hybridized carbon signals by a chemical-shift<br />
anisotropy filter, which in particular identifies OCO carbons near 100 ppm, which are<br />
typical of sugar rings. (a) Soybean, (b) Lupin, (g) Corn, and (d) Dairy manure.<br />
REFERENCES<br />
1. Hunt, J.F., T. Ohno, Z. He, C.W. Honeycutt, and D.B. Dail. 2007. J. Environ. Qual. 36:135-143.<br />
2. Hunt, J.F., T. Ohno, Z. He, C.W. Honeycutt, and D.B. Dail. 2007. Biol. Fertil. Soils. In press.<br />
Available online.<br />
3. He, Z., B.J. Cade-Menun, G.S. Toor, A. Fortuna, C.W. Honeycutt, and J.T. Sims. 2007. J.<br />
Environ. Qual. 36:1086-1095.<br />
4. Mao, J., D.C. Olk, X. Fang, Z. He, J. Bass, and K. Schmidt-Rohr. 2007. Geoderma. To be<br />
submitted.<br />
5. Mao and Schmidt-Rohr. 2004. Solid state NMR 26: 36-45.<br />
Trade or manufacturers' names mentioned in the paper are for information only and do not<br />
constitute endorsement, recommendation, or exclusion by the USDA-ARS.<br />
90
Capillary Electrophoresis and Fluorescence Excitation-Emission Matrix<br />
Characterization of Soil Mobile and Calcium Humates<br />
Zhongqi He 1 , Tsu<strong>to</strong>mu Ohno 2 , Daniel C. Olk 3 , Fengchang Wu 4 , C. Wayne Honeycutt 1 ,<br />
Jingdong Mao 5<br />
1 USDA-ARS, New England Plant, Soil, and Water Labora<strong>to</strong>ry, Orono, ME 04469, USA,<br />
Zhongqi.He@ars.usda.gov.<br />
2 Dept. of Plant, Soil, and Environmental Sciences, Univ. of Maine, Orono, ME 04469, USA<br />
3 USDA-ARS, National Soil Tilth Lab, Ames, IA 50011, USA<br />
4 Institute of Geochemistry, Chinese Academy of Sciences, Guiyang, China 550002.<br />
5 Dept. of Chemistry & Biochemistry, Old Dominion University, Norfolk, VA 23529, USA.<br />
Keywords: humic, fulvic, template<br />
1. INTRODUCTION<br />
Capillary electrophoresis (CE) and Excitation-emission matrix (EEM) fluorescence<br />
spectroscopy have been used in natural organic matter (NOM) studies. The combination of<br />
CE and EEM fluorescence spectroscopy <strong>to</strong>gether provided a novel approach for<br />
characterizing humic substances. In a previous project, we characterized 13 NOM<br />
samples obtained from the International Humic Substances Society (IHSS) using CE; and<br />
analyzed these IHSS samples using EEM spectroscopy with parallel fac<strong>to</strong>r analysis<br />
(PARAFAC) modeling <strong>to</strong> gain a better understanding of the make-up of these NOM<br />
samples (1). The mutual relevance of data collected from each of the two methods<br />
provided novel insight in<strong>to</strong> the correlation of complex NOM fluorescence spectra <strong>to</strong> specific<br />
NOM fractions. We applied this approach <strong>to</strong> explore the characteristics of soil mobile<br />
humic acid (MHA) and recalcitrant calcium humate (CaHA) in relation <strong>to</strong> different cropping<br />
management practices.<br />
2. MATERIALS AND METHODS<br />
Soil samples were collected from a private farm in Hamil<strong>to</strong>n County near Phillips,<br />
Nebraska, USA on an irrigated field with a continuous corn system. Nutrient management<br />
treatments included application of beef cattle feedlot manure, inorganic N fertilizer, and an<br />
unfertilized control. The soil is classified as the Hord silt loam (fine-silty, mixed, mesic<br />
Cumulic Haplus<strong>to</strong>lls). Surface soil (0-15 cm) was sampled and air-dried in a greenhouse,<br />
hand-ground <strong>to</strong> pass through an 8-mm mesh, and analyzed for organic C and <strong>to</strong>tal N by<br />
au<strong>to</strong>mated combustion. The MHA and CaHA fractions were extracted based on an<br />
established procedure (2).<br />
91
S<strong>to</strong>ck solutions of humic fractions were made by weighing 10-20 mg of sample in a<br />
2-mL micro tube and then adding appropriate volumes of 0.05 M NaOH <strong>to</strong> make a final<br />
concentration of 10 mg dry matter mL -1 . For UV irradiation treatments, 1.0 mL of a s<strong>to</strong>ck<br />
solution was placed in a closed quartz cuvette. A Spectroline 11SC-1 short wave UV<br />
pencil lamp (254 nm, 4.5 mW cm -2 , Spectronics Corporation, Westbury, NY) was placed<br />
near the cuvette (1 cm away) and the sample was irradiated for 4 h at 22 o C (3). The<br />
untreated and irradiated samples were then subjected <strong>to</strong> CE and EEM analysis.<br />
The CE inst<strong>ru</strong>ment was an Agilent capillary electrophoresis system (Agilent<br />
Technologies, Wilming<strong>to</strong>n, DE). The <strong>ru</strong>nning buffer was 3 mM KH 2 PO 4 -6 mM Na 2 B 4 O 7 , pH<br />
8.9 (refered <strong>to</strong> as borate buffer, hereinafter). The capillary column (fused silica, 56 cm<br />
length x 75 microm internal diameter) was flushed for 3 min with the borate buffer prior <strong>to</strong><br />
sample loading (1). The samples for CE analysis were further diluted with borate buffer so<br />
that it would have an ultraviolet (UV) light absorbance at 240 nm of about 0.1.<br />
Fluorescence measurements were obtained using a Hitachi F-4500 spectrofluorometer.<br />
The excitation-emission matrix (EEM) fluorescence landscape was obtained by setting the<br />
EX range from 240 <strong>to</strong> 400 nm and EM range from 300 <strong>to</strong> 500 nm in 3 nm increments. The<br />
PARAFAC modeling was conducted with MATLAB version 7.0.4 , Release 14 (Mathworks,<br />
Natick, MA) using PLS_Toolbox version 4.0 (Eigenvec<strong>to</strong>r Research, Manson, WA) (1).<br />
3. RESULTS AND DISCUSSION<br />
The CE profiles of MHA and CaHA of the control soil were different (Fig. 1), but they<br />
were typical for soil humic and fulvic fractions (1, 4). The CE profiles of the two soil humic<br />
fractions with either synthetic fertilizer or cattle manure application were more similar <strong>to</strong><br />
those of fulvic acid (data not shown). The common feature of the humic fractions of the<br />
three soils was the absence of a “neutral peak”, which was due <strong>to</strong> non-ionic components in<br />
humic fractions. UV irradiation remarkably changed the CE profiles of these soil humic<br />
fractions (Fig. 1). UV irradiation made the CE profiles of the MHA and CaHA fractions<br />
more similar. As show in Fig 1b, extra peaks appeared in both CE profiles, and these<br />
peaks were much stronger than those of the un-irradiated samples. The CE profiles of<br />
these soil humic fractions after UV irradiation seemed <strong>to</strong> contain more features of peat<br />
humic fractions than the corresponding CE profiles of un-irradiated fractions.<br />
PARAFAC modeling analysis of EEM fluorescence spectroscopic data indicated that<br />
four fluorophore components were present in each sample. The characteristics of the four<br />
components were similar but not exactly the same as those reported previously (1). UV<br />
irradiation changed the distribution of the four components in these humic fractions (Fig.<br />
92
2). Component 1 was most sensitive <strong>to</strong> UV irradiation. For all three MHA fractions,<br />
Component 1 decreased while component 4 increased after UV irradiation. Conversely,<br />
UV irradiation increased the content of Component 1. This increase was mainly due <strong>to</strong> the<br />
decrease in Component 2 and a minor contribution from Component 3.<br />
35<br />
(A) Unirradiated<br />
35<br />
(B) UV-irradiated<br />
30<br />
30<br />
25<br />
25<br />
MHA+uv<br />
20<br />
20<br />
mAu<br />
15<br />
mAu<br />
15<br />
MHA<br />
10<br />
10<br />
5<br />
5<br />
0<br />
CaHA<br />
0<br />
CaHA+uv<br />
-5<br />
0 2 4 6 8 10<br />
Time (min)<br />
-5<br />
0 2 4 6 8 10<br />
Time (min)<br />
Figure 1. Electropherograms of MHA and CaHA of control soil. Humic fractions were<br />
unirradiated (A) or irradiated (B) by UV light for 4 h.<br />
0.05<br />
Comp 1 Comp 2 Comp 3 Comp 4<br />
0.03<br />
Relative abundance<br />
0.01<br />
-0.01<br />
-0.03<br />
-0.05<br />
Control NPK Manure Control NPK Manure<br />
MHA<br />
CaHA<br />
Figure 2. Change of the four EEM components of MHA and CaHA of soils due <strong>to</strong> UV<br />
irradiation. Soils were control, synthetic fertilizer applied (NPK), and cattle feedlot manure<br />
(Manure) applied.<br />
93
4. CONCLUSIONS<br />
The mobile and recalcitrant calcium humic fractions extracted from soils possessed<br />
characteristic capillary electrophoretic and EEM fluorescence profiles. UV irradiation<br />
caused these profiles <strong>to</strong> change,. However, no remarkable difference in profiles among<br />
soils with differentnutrient managements suggested that crop management practices<br />
under the experimental period (6 years) did not significantly alter the chemical nature of<br />
humic fractions in these soils.<br />
REFERENCES<br />
1. He, Z., T. Ohno, F. Wu, D.C. Olk, C.W. Honeycutt, and M. Olanya. 2008. Soil Sci. Soc. Am. J.<br />
submitted.<br />
2. Olk, D.C., K.G. Cassman, E.W. Randall, P. Kinchesh, L.J. Sanger, and J.M. Anderson. 1996.<br />
Eur. J. Soil Sci. 47:293-303.<br />
3. He, Z., T. Ohno, B.J. Cade-Menun, M.S. Erich, and C.W. Honeycutt. 2006. Soil Sci. Soc. Am.<br />
J. 70:1741-1751.<br />
4. Pompe, S., K.-H. Heise, and H. Nitsche. 1996. J. Chroma<strong>to</strong>gr. A. 723:215-218.<br />
Trade or manufacturers' names mentioned in the paper are for information only and do not<br />
constitute endorsement, recommendation, or exclusion by the USDA-ARS.<br />
94
Characterization of Synthetic (Core) Humic Substances Made from<br />
Dihydroxylated Phenylpropanoids<br />
Renate Kloecking 1 , Bjoern Helbig 2 , Matthias Kinne 3 , Carola Kleiner 1 , Tadeusz Gorecki 4<br />
Juergen Poerschmann 5 , David Podgorski 6 , William T. Cooper 6<br />
1 Research Institute for Peat and Natural Products, Zittau/Goerlitz University of Applied Sciences,<br />
Friedrich-Schneider-Str. 26, 02763 Zittau, Germany, RKloecking@hs-zigr.de<br />
2 Institute for Virology and Antiviral Therapy, University of Jena, Hans-Knoell-Str. 2, 07740 Jena,<br />
Germany<br />
3 Environmental Biotechnology, International Graduate School Zittau, Markt 23, 02763 Zittau,<br />
Germany<br />
4 Helmholtz Center for Environmental Research GmbH – UFZ, Permoserstr. 15, 04318 Leipzig,<br />
Germany<br />
5 Department of Chemistry, University of Waterloo, Waterloo, ON, N2L 361, Canada<br />
6 Department of Chemistry & National High Magnetic Field Labora<strong>to</strong>ry, Florida State University,<br />
Tallahassee, FL 32306-4390, U.S.A.<br />
Keywords: synthetic humic substances, dihydroxylated phenylpropanoids, HPSEC, TMAH<br />
thermochemolysis, FT-ICR mass spectrometry<br />
1. INTRODUCTION<br />
Humic substances (HS) are known <strong>to</strong> influence various chemical and biochemical<br />
processes in the environment: they protect organisms from dangerous UV radiation;<br />
interfere with vi<strong>ru</strong>s-cell interactions, stimulate or inhibit enzymatic reactions, <strong>to</strong>xify or<br />
de<strong>to</strong>xify heavy metals and catalyze the degradation of undesirable xenobiotics (1). Despite<br />
substantial progress in identifying low-molecular components of natural HS, the knowledge<br />
on the basic (core) st<strong>ru</strong>cture of HS does still not meet the requirements for quantitative<br />
st<strong>ru</strong>cture-activity relationships. Therefore, we have followed another path as we made<br />
substances of the humic acid (HA) type by oxidation of well-defined diphenolic compounds<br />
and analyzed both the chemical st<strong>ru</strong>cture and the biological activity of the synthesized HS<br />
(2-4). To gain more insight in<strong>to</strong> the st<strong>ru</strong>cture of synthetic HS and <strong>to</strong> provide a basis for<br />
future studies in st<strong>ru</strong>cture-activity relationships we synthesized a panel of simple (core) HA<br />
by oxidation of only one diphenolic compound at a time.<br />
In this study we address the molecular st<strong>ru</strong>cture of three HA-like polymers<br />
synthesized from closely related dihydroxylated phenylpropanoids (Figure 1). High<br />
performance size exclusion chroma<strong>to</strong>graphy (HPSEC), pyrolysis/thermochemolysis-<br />
95
GC/MS and ultrahigh resolution Fourier transform ion cyclotron resonance mass<br />
spectrometry (FT-ICR MS) were used for the analytical investigations.<br />
MATERIALS AND METHODS<br />
COOH<br />
COOH<br />
HO<br />
Caffeic acid<br />
OH<br />
HO<br />
HO<br />
OH<br />
NH 2<br />
COOH<br />
Hydrocaffeic acid<br />
OH<br />
DOPA<br />
Figure 1: Diphenolic starting compounds.<br />
HA-like polymers were synthesized by periodate (p) (5), air (a) (6) or tyrosinase (t)<br />
catalyzed oxidation (modified according <strong>to</strong> 7) of the following o-diphenolic starting<br />
compounds: hydrocaffeic acid = 3-(3,4-dihydroxyphenyl)propionic acid (→ HYKOP 441 p);<br />
caffeic acid = (E)-3-(3,4-dihydroxyphenyl)-2-propenoic acid (→ KOP 451 e, KOP 466 p); L-<br />
DOPA = 3,4-dihydroxy-L-phenylalanine = (S)-2-Amino-3-(3,4-dihydroxyphenyl) propanoic<br />
acid (→DOPA-OP a).<br />
HPSEC: The molecular mass distribution of HS was investigated by using a highperformance<br />
liquid chroma<strong>to</strong>graph from Hewlett Packard (HP Series 1050) equipped with<br />
the Diode Array Detec<strong>to</strong>r Agilent 1100 (Series G1315B) and fitted with a PSS Hema Bio<br />
column 8 x 300 mm (Polymer Standard Service Mainz, Germany). The stationary phase<br />
consisted of a hydrophilic copolymer network of ethylene glycol dimethacrylate and<br />
hydroxymethacrylate. As mobile phase 20% v/v ace<strong>to</strong>nitrile and 80% v/v of an aqueous<br />
solution of NaCl (0.34% w/v) and K 2 HPO 4 (0.2% w/v) adjusted with 0.2 mol/l NaOH at pH<br />
10 was used. The column was calibrated using polystyrene sodium sulfonate standards<br />
(0.24 – 145 kDa).<br />
Tetramethylammonium hydroxide (TMAH) thermochemolysis-GC/MS: The reaction<br />
was carried out in a 0.53-mm-i.d. stainless steel capillary tubing (Silcosteel) using a<br />
sample mass of 50 µg HS. Thermochemolysis was conducted by capacitive discharge at<br />
500°C according <strong>to</strong> (8). The TMAH solution (2 µl 20% v/v in methanol) was directly<br />
injected in<strong>to</strong> the pyrolysis capillary. Separation and identification of the analytes were done<br />
by GC-MS analysis in a temperature programmed working procedure as described in (2).<br />
FT-ICR Mass Spectrometry: FT-ICR mass spectra using electrospray ionization (ESI)<br />
were acquired on a home-built 9.4 T FT-ICR mass spectrometer at the National High<br />
96
Magnetic Field Labora<strong>to</strong>ry in Tallahassee, FL. The use of this inst<strong>ru</strong>ment <strong>to</strong> acquire<br />
ultrahigh resolution mass spectra of humic materials has been described previously (9).<br />
<strong>Molecular</strong> compound information for each synthetic HA sample was summarized in<br />
Kendrick and van Krevelen plots for comparative purposes.<br />
RESULTS AND DISCUSSION<br />
The molecular mass distribution of the original, non-hydrolyzed polymers HYKOP<br />
441 and KOP 466 seem <strong>to</strong> be relatively homogeneous, as they have only a single peak at<br />
1.950 and 2.636, respectively. DOPA-OP, by contrast, shows in addition <strong>to</strong> two lowmolecular<br />
peaks at 0.597 and 1.074 kDa an equal third one at 33.17 kDa. This may be due<br />
<strong>to</strong> the presence of the NH 2 group in the side chain enabling further processing via<br />
dopaquinone <strong>to</strong> eumelanin which is stabile even under the strong alkaline HPSEC<br />
conditions.<br />
Another essential question of this study was the kind and uniformity of the TMAH<br />
thermochemolysis products of the synthesized HS. Figure 2 shows, as an example, the<br />
TIC of HYKOP 441. In <strong>to</strong>tal, 22 of 24 low molecular products of KOP and 26 of 26 low<br />
molecular products of HYKOP were identified. Thereby the dimethoxymethyl esters of the<br />
starting compounds caffeic acid (about 50%) and hydrocaffeic acid (up <strong>to</strong> 95%) were found<br />
<strong>to</strong> represent the main part of KOP and HYKOP, respectively. In addition, the TMAH<br />
thermochemolysis revealed cyclization reactions (→ cyclopentenones) as well as ring<br />
openings of aromatic st<strong>ru</strong>ctures (→ aliphatic dicarbonic acids) taking place during diphenol<br />
oxidation.<br />
Abundance<br />
2600000<br />
TI C: HYKTM500.D<br />
OCH 3<br />
2200000<br />
1800000<br />
1400000<br />
1000000<br />
600000<br />
200000<br />
OCH 3<br />
6.00 8.00 10.00 12.00 14. 00 16. 00<br />
OCH3<br />
O<br />
Time →<br />
Figure 2: Total ion chroma<strong>to</strong>gram (TIC) of TMAH thermochemolysis of HYKOP.<br />
97
Figure 3. FT-ICR mass spect<strong>ru</strong>m of TMAH thermochemolysis of KOP466: (a) mass range<br />
200-1,000 Da, (b) isolated mass range 599.0-599.4.<br />
FT-ICR mass spectra of the synthesized HS were used <strong>to</strong> corroborate the molecular<br />
mass data. Mass distributions from MS data were lower than those observed by HP-SEC<br />
(Figure 3a), in agreement with previous studies. We also observed unique mass spacings<br />
in addition <strong>to</strong> the 0.0364 Da difference characteristic of substitution of CH 4 for O that is<br />
common in natural humic and fulvic acids. The exact mechanism(s) responsible for these<br />
variations is not yet known.<br />
CONCLUSIONS<br />
The synthesis of simple diphenolic-based (core) HS offers a new opportunity <strong>to</strong> study<br />
the st<strong>ru</strong>cture as well as possible st<strong>ru</strong>cture-activity relationships among substances of the<br />
HA type. In particular, the results of TMAH thermochemolysis and FT-ICR mass<br />
spectrometry analyses provide information about the preservation of starting compounds<br />
in the synthetic (core) HS and on reactions potentially taking place during humification.<br />
REFERENCES<br />
1. Kloecking, R., Helbig, B. 2001. In: Biopolymers, Vol. 1: Lignin, Humic Substances and Coal,<br />
M. Hofrichter, A. Steinbuechel (Eds.), Wiley-VCH, Weinheim, Germany, pp. 379-392.<br />
2. Poerschmann, J., Górecki, T, Helbig, B., Kloecking, R. 2005. Erfurt Academy of Useful<br />
Sciences, Proceedings of Class Sessions (Mathematics & Science) 12, 103-124.<br />
3. Helbig, B., Kloecking, R., Wutzler, P. 1997. Antiviral Chem. Chemother. 8, 265-273.<br />
4. Kloecking, R., Helbig, B., Schoetz, G., Schacke, M., Wutzler, P. 2002. Antiviral Chem.<br />
Chemother. 13, 241-249.<br />
5. Hänninen, K., Klöcking, R., Helbig, B. 1987. Sci. Total Environ. 62, 201-210.<br />
6. Kuehn, S. 2005. PhD Thesis, p. 19, http://sundoc.bibliothek.uni-halle.de/dissonline/05/06H008/index.htm<br />
7. Thiel, K.-D., Kloecking, R., Helbig, B. 1976. Zbl. Bakt. Hyg., I. Abt. Orig. A 234, 159-169.<br />
8. Górecki, T., Poerschmann, J. 2001. Anal. Chem. 73, 2012-2017.<br />
9. Stenson, A. C., Marshall, A. G., Cooper, W. T. 2003. Anal. Chem., 74, 1275-284.<br />
98
High Resolution Ultrasonic Spectroscopy as Aid in Study of<br />
Complexation of Humic Acids<br />
Martina Klučáková, Jiří Kučerík, Miloslav Pekař, Dana Válková<br />
Institute of Physical and Applied Chemistry, Faculty of Chemistry, Brno University of Technology,<br />
Purkyňova 118, 612 00 Brno, Czech Republic, klucakova@fch.vutbr.cz<br />
Keywords: humic, modelling, copper, ultrasound spectroscopy<br />
1. INTRODUCTION<br />
The high affinity of humic acids (HA) <strong>to</strong> transition metals is well known. There is a<br />
large number of various coordination sites that are able <strong>to</strong> bind transition metals by various<br />
strengths. In previous works, quantum chemical calculations of interaction enthalpies (1)<br />
and also measurement of complexation kinetic (2, 3) were carried out. On the basis of<br />
obtained results the following models have been chosen for this study: citric acid,<br />
hydroquinone, pyrocatechol, salicylic acid and EDTA. The formation of complex of model<br />
with cupric ions has been observed only for hydroquinone and pyrocatechol by UV/VIS<br />
spectrometry (new band in spectra was detected). Others were chosen mainly for their<br />
high affinity <strong>to</strong> metal ions, e.g. salicylic acid is frequently considered as the most suitable<br />
coordination site in st<strong>ru</strong>cture of humic acids, which has been confirmed also by quantum<br />
chemical calculations in our works (1, 3).<br />
2. MATERIALS AND METHODS<br />
Ultrasonic spectrometer with high resolution HR-US 102 (Ultrasonic Scientific,<br />
Ireland), was utilized for measurement of basic ultrasonic parameters. The device consists<br />
of two independent cells tempered at 25°C. Both cells were filled by the same model<br />
compound (e. g. hydroquinone) and then 1,25 M CuCl 2 (20 μl) was added in<strong>to</strong> one cell.<br />
Velocity (U) and attenuation (N) in both cells was measured, the resulting differences ΔU<br />
and ΔN we can see at graphs.<br />
UV/VIS spectra were measured by means of U-3300 Hitachi spectropho<strong>to</strong>meter.<br />
3. RESULTS AND DISCUSSION<br />
The examples of data measured for pyrocatechol are shown at Figs. 2 and 3. It was found<br />
that model compounds with new band observed in UV/VIS spectra (hydroquinone,<br />
pyrocatechol) need longer time for achievement of equilibrium than others. Changes in<br />
measured attenuation are also higher for these two models. On the other hand, significant<br />
99
increase of ΔN values was observed only immediately after addition of CuCl 2 solution for all<br />
used model.<br />
2,5<br />
2<br />
absorbance<br />
1,5<br />
1<br />
0,5<br />
0<br />
200 400 600 800 1000<br />
λ (nm)<br />
Figure 1. UV/VIS spectra of CuCl 2 solution (full line), pyrocatechol (dashed line) and<br />
formed complex (dotted line).<br />
ΔU (m/s)<br />
0,5<br />
0,4<br />
0,3<br />
0,2<br />
0,1<br />
0<br />
-0,1<br />
-0,2<br />
-0,3<br />
-0,4<br />
-0,5<br />
0 5000 10000 15000 20000 25000 30000<br />
time (s)<br />
Figure 2. The time dependence of ΔU for hydroquinone after addition of CuCl 2 .<br />
100
40<br />
35<br />
30<br />
25<br />
N (1/m)<br />
20<br />
15<br />
10<br />
5<br />
0<br />
-5<br />
0 5000 10000 15000 20000 25000 30000<br />
time (s)<br />
Figure 3. The time dependence of ΔN for hydroquinone after addition of CuCl 2 .<br />
High velocity and short time measured (Fig. 4) for salicylic acid confirmed high ability<br />
of this st<strong>ru</strong>cture <strong>to</strong> bind cupric ions in stable complexes. Quantum chemical calculations of<br />
interaction enthalpies (1) resulted in model of salicylic acid as a most attractive for<br />
complexation of metal ions. High affinity of cupric ions <strong>to</strong> this st<strong>ru</strong>cture probably causes<br />
that their interactions are faster than others.<br />
0,5<br />
0,4<br />
0,3<br />
0,2<br />
U (m/s)<br />
0,1<br />
0<br />
-0,1<br />
-0,2<br />
-0,3<br />
-0,4<br />
-0,5<br />
0 5000 10000 15000 20000 25000 30000<br />
time (s)<br />
Figure 4. The time dependence of ΔN for salicylic acid after addition of CuCl 2 .<br />
101
4. CONCLUSIONS<br />
Preliminary results of high resolution ultrasound spectroscopy are presented.<br />
Obtained data correspond with conclusions in our previous works (1-3). Salicylic acid<br />
seems <strong>to</strong> be attractive coordination site for complexation of cupric ions, but the most<br />
interesting results were obtained for hydroquinone and pyrocatechol. Even though, their<br />
computed interaction enthalpies (1) are much lower than value determined for salicylic<br />
acid, these st<strong>ru</strong>ctures contribute also <strong>to</strong> complexation capacity of humic acids. It<br />
corresponds with experimentally measured interaction enthalpy oh humic acids (3), which<br />
is approximately three times lower that that of salycilic acid, and EPR and FT-IR spectra of<br />
formed complexes discussed in our work (4).<br />
ACKNOWLEDGEMENTS<br />
This work was financially supported by Grant Agency of Czech Republic, Project No.<br />
104/08/0990.<br />
REFERENCES<br />
1. Klučáková, M., Pelikán, P., Lapčík, L., Lapčíková, B., Kučerík, J., Kaláb, M. 2000. J. Polym.<br />
Mater. 17, 337-356.<br />
2. Klučáková, M, Válková, D., Pekař, M. 2005. In: Proc. 9th International Conference on<br />
Environment and Mineral Processing, P. Fečko, V. Čablík (Eds.), VŠB-TU Ostrava, Ostrava,<br />
pp. 31-36.<br />
3. Klučáková, M, Pekař, M., Válková, D. 2006. In: Humic Substances – Linking St<strong>ru</strong>cture <strong>to</strong><br />
Functions, Proceedings of the 13th Meeting of the International Humic Substances Society,<br />
Vol. 45-II, F. H. Frimmel, G. Abbt-Braun G. (Eds.), Schriftenreihe Bereich Wasserchemie<br />
Engler-Bunte-Institut der Universität Karls<strong>ru</strong>he, Karls<strong>ru</strong>he, pp. 893-896.<br />
4. Čechová, E., Klučáková, M., Krčma, F., Majzlík, P., Vrajová, J. 2007. In: ISPC XVIII - book of<br />
abstracts. International Plasma Chemistry Society, Kjo<strong>to</strong>, pp. 745 - 745.<br />
102
Characterization of Mumijo (Shilajit) from Different Regions by FTICR<br />
Mass-Spectrometry<br />
Alexey Kononikhin 1 , Gleb Vladimirov 1 , Erast Kunenkov 2 ,Irina Perminova 2 , Igor Popov 1 ,<br />
Andrey Garmash 2 , Eugene Nikolaev 1<br />
1 The Institute for Biochemical Physics Russian Academy of Science, Moscow, Russia,<br />
nikolaev@chph.ras.<strong>ru</strong><br />
2 Department of Chemistry, Lomonosov Moscow State University, 119992, Moscow, Russia<br />
Keywords: mumijo, mumie, shilajit, FTICR mass-spectrometry<br />
1. INTRODUCTION<br />
Native Mumijo is a blackish-brown exudation, of variable consistencies, obtained<br />
from steep rocks of different formations found in the Himalayas at altitudes between<br />
1000-5000 m, from A<strong>ru</strong>nachal Pradesh in the East, <strong>to</strong> Kashmir in the West. Mumijo also is<br />
found in other mountain ranges of the world, e.g. Afganisthan (Hindukush, Badakh-Shan),<br />
Australia (Northern Pollock Ranges), and in the former USSR (Tien-Shan, Pamir,<br />
Caucasus, Ural) (1).<br />
2. MATERIALS AND METHODS<br />
Kyrgyz, Altaic, Kazakh and Indian mumijo from d<strong>ru</strong>gs<strong>to</strong>re were used for analysis<br />
without further purification. All experiments were performed on a commercial massspectrometer<br />
7 Tesla Finnigan LTQ FT (Thermo Electron, Bremen, Germany) equipped<br />
with electrospray ion source (Finnigan Ion Max Source). Mumijo samples were dissolved<br />
in 1:4 water-ace<strong>to</strong>nitrile solution and analyzed using electrospray ionization both in positive<br />
and negative modes. For accurate molecular mass measurements FTICR mass spectra<br />
were acquired using selected ion moni<strong>to</strong>ring (SIM) scanning with 100 Da mass range.<br />
For interpretation of FTICR data and comparison of different samples Kendrick and<br />
van Krevelen diagrams were used (2). All FTICR mass spectra were also processed using<br />
FIRAN software for determination of s<strong>to</strong>ichometric formulas (3).<br />
3. RESULTS AND DISCUSSION<br />
It was found that all mumijo samples could be efficiently ionized by ESI both in<br />
positive and negative modes. Data from different mumijo samples are occupying the same<br />
regions on van Krevelen diagram. Differences between Indian and kirghisian samples<br />
were found in broader variety of observable ions in Indian sample in region higher then<br />
800 Da.<br />
103
Figure 1. FTICR Mass-spectra of Indian (A), and Kyrgyz mumijo (B), (negative mode,<br />
equal concentrations of sample). Most intensive peaks in differential FTICR-MS of mumijo<br />
samples (D).<br />
S<strong>to</strong>ichiometric formulas for ions in this region shows them <strong>to</strong> be highly saturated with<br />
low-oxygen contains (fatty acids esters etc.). Total mass difference statistics (TDMS) for<br />
different mumijo samples gives the same set of characteristic functional groups with very<br />
similar abundances (Figure 1).<br />
4. CONCLUSIONS<br />
Mumijo from different regions differ significantly in mass spectra but obey similar<br />
general s<strong>to</strong>ichiometric characteristics. Mass spectrometry gives advance in understanding<br />
of its composition variety.<br />
REFERENCES<br />
1. Schepetkin I., Khlebnikov A., Shin Young Ah, Sang Woo, Choon-Soo Jeong, O. Klubachuk,<br />
Byoung Kwon 2003 J. Agric. Food Chem., 51 (18), 5245 -5254.<br />
2. Kim S., Kramer R.W., Hatcher P.G., Graphical method for analysis of ultrahigh-resolution<br />
broadband mass spectra of natural organic matter, the van Krevelen diagram, Anal Chem,<br />
2003, 75: 5336-5344.<br />
3. Kunenkov, E.V., Kononikhin, A.S., Perminova, I.V., Garmash, A.V., Nikolaev, E.N., Popov, I.A.<br />
2006. Analysis of FTICR-MS data on humic substances and synthetic polyelectrolytes using<br />
different data processing techniques. Abstracts of the First Int. Symposium on Ultrahigh<br />
Resolution Mass Spectrometry for the <strong>Molecular</strong> level Analysis of Complex (BioGeo)Systems,<br />
6-7 Nov. 2006, GSF, Oberschleissheim, Germany.<br />
104
Extraction and Characterisation of Humin Fraction from Amazonian<br />
Anthropogenic Dark Earths Soils (“Terra Preta de Índios”)<br />
Etelvino Henrique Novotny 1,2,3 , Michael Hilary B. Hayes 2 , Guixue Song 2 ,<br />
Eduardo Ribeiro de Azevedo 3 , Ti<strong>to</strong> José Bonagamba 3<br />
1 Embrapa Solos, R. Jardim Botânico 1024, CEP 22460-000, Rio de Janeiro, Brazil,<br />
etelvino@cnps.embrapa.br<br />
2 Department of Chemical and Environmental Sciences, University of Limerick, Ireland<br />
3 Institu<strong>to</strong> de Física de São Carlos-Universidade de São Paulo, São Carlos, Brazil<br />
Keywords: “Terra Preta de Índios”, humin, NMR, pyrogenic carbon, black carbon<br />
1. INTRODUCTION<br />
Humin, the humic fraction that is insoluble in water at all pH values, typically<br />
comprises more than 50% of soil organic matter (1). Because of the difficulties in isolation,<br />
humin compositions and properties have been less extensively studied than those of<br />
humic and fulvic acids (2). On the basis of the accepted definition, humin can include any<br />
humic-type substances that are not dissolved during exhaustive extractions with aqueous<br />
base.<br />
A solvent system composed of a mixture of aqueous base/urea (0.1 M NaOH + 6 M<br />
urea, base/urea) has been reported <strong>to</strong> isolate material that would be classified as humin in<br />
the classical definition (3, 4, 5). Because urea is a powerful hydrogen bond breaker, it is<br />
considered that soil organic components were released from associations with humin<br />
materials either by the breaking of hydrogen bonds, or by the dis<strong>ru</strong>ption of steric<br />
constraints by materials that had trapped the components released.<br />
Dimethylsulfoxide (DMSO), a dipolar aprotic solvent, is an excellent solvent for<br />
cations but a poor solvent for anions (6). It is a good hydrogen bond breaker and the nonpolar<br />
backbone (as distinct from the S=O face) of DMSO can be considered <strong>to</strong> have<br />
affinities for less polar humin components. A solvent mixture of DMSO with HCl (6%, v/v)<br />
was reported <strong>to</strong> have isolated less than 22% of humin material from soils (7, 8, 9).<br />
However H 2 SO 4 is a very polar liquid with a high dielectric constant (~100), and due <strong>to</strong> the<br />
process of au<strong>to</strong>pro<strong>to</strong>lysis (10), pro<strong>to</strong>ns are highly mobile in H 2 SO 4 . This enables it <strong>to</strong><br />
pro<strong>to</strong>nate the conjugate bases (carboxylates and phenolates), thereby increasing the<br />
solubility of the organic material (4, 5), since anions are weakly solvated in DMSO.<br />
105
2. MATERIALS AND METHODS<br />
The humin from three (samples 1, 2 and 3) Amazonian Dark Earths (“Terra Preta de<br />
Índios”), soils rich in pyrogenic carbon, was sequentially extracted using: 0.1 M NaOH<br />
(Humic Acids - HA); the soil residue was extracted with 0.1 M NaOH after the soil was<br />
dispersed by ultrasonication (HAD); then with base/urea (Humin - HuU); with a mixture of<br />
DMSO and H 2 SO 4 (94:6, v/v) (HuDMSO); and finally the residue was treated with 10% HF<br />
(Hu). The coarse char fraction was carefully recovered from the soils by sieving (63 μm<br />
sieve) and sedimentation. Characterisations of the organic components of the humin<br />
fractions were carried out by Variable Amplitude Cross-Polarisation with Magic Angle<br />
Spinning (VACP/MAS) 13 C Nuclear Magnetic Resonances spectroscopy, and additional<br />
experiments were carried out using the Chemical Shift Anisotropy (CSA) (spectra of C-sp 3<br />
only) and the Dipolar Dephasing (DD) (spectra of non-pro<strong>to</strong>nated and mobile C only)<br />
filters. The spectral data were analysed by Principal Component Analysis.<br />
3. RESULTS AND DISCUSSION<br />
Spectra are shown only for the HA and HAD samples (Figure 1). The HAD presents<br />
more aliphatic compounds, mainly crystalline poly-methylene st<strong>ru</strong>ctures (33 ppm) and with<br />
lesser of the amorphous st<strong>ru</strong>ctures (30 ppm). It is also richer in carbohydrates (102 and 73<br />
ppm, as evidenced in the CSA spectra) and lignin residues (~150 ppm and 56 ppm, as<br />
evidenced in the DD spectra). These features indicate that the aggregate <strong>ru</strong>pture releases<br />
relatively unaltered organic matter (cellulose and lignin derived materials) and also a<br />
HA<br />
(NaOH)<br />
Aliphatic<br />
COOR<br />
Aryl<br />
COOR<br />
VACP/MAS<br />
DD<br />
CSA<br />
HAD<br />
(NaOH + Ultrasonification)<br />
di-O-Alkyl<br />
Methoxyl<br />
240 210 180 150 120 90 60 30 0 -30<br />
13<br />
C Chemical Shift (ppm)<br />
Figure 1. Full VACP spectra (thin line) of humic acids from an Amazonian soil and the<br />
corresponding CSA (thick line) and DD spectra (short dot line).<br />
106
possible aggregating compounds, such as long-chain fatty acids (the 33 ppm signal<br />
associated with the aliphatic carboxyl groups at 172 ppm).<br />
The first Principal Component (PC1) accounted for 78% of the <strong>to</strong>tal variance and is<br />
characterised (Figure 2, right) by positive loadings for crystalline poly-methylene st<strong>ru</strong>ctures<br />
(33 ppm) and smaller positive loadings for terminal methyl (15 ppm) and aliphatic carboxyl<br />
(175 ppm). On the other hand this PC presents negative loadings for pyrogenic carbon<br />
(aryl – 129 ppm and aromatic carboxyl-168 ppm) and ligno-cellulosic residues (153, 105,<br />
73 and 55 ppm).<br />
The scores for the PC1 (Figure 2, left) were greater for the samples extracted with<br />
the H-bond breakers (Urea and DMSO), and also for the samples submitted <strong>to</strong><br />
ultrasonication. This indicates that the mechanical dispersion aided the solvent systems in<br />
cleaving H-bonds, and especially the penetrating solvent (DMSO) which facilitated the<br />
extraction of a humic material closely associated with the soil mineral matrix. The small<br />
scores for PC1 for the Hu, HA and coarse char samples indicate that the residual humin<br />
(insoluble in the solvent systems used) is similar <strong>to</strong> the coarse char (rich in pyrogenic<br />
carbon and ligno-cellulosic material). The second PC (13% of the <strong>to</strong>tal variance) only<br />
differentiated samples from the different soils (1, 2 or 3).<br />
PC2 Scores<br />
2,0<br />
1,5<br />
1,0<br />
0,5<br />
0,0<br />
-0,5<br />
-1,0<br />
Coarse Char2<br />
HA2<br />
Hu3<br />
Hu2<br />
Coarse Char3<br />
HA3<br />
HuU2 HuDMSO1<br />
HuU3<br />
HAD2<br />
HuDMSO2<br />
HAD3<br />
HuDMSO3<br />
PC1 Loadings<br />
-1,5<br />
Hu1<br />
Coarse Char1<br />
-1,0 -0,5 0,0 0,5 1,0 1,5 2,0 2,5<br />
PC1 Scores<br />
210 180 150 120 90 60 30 0 -30<br />
13<br />
C Chemical Shift (ppm)<br />
Figure 2. PCA loadings (right) and scores (left) from full VACP spectra.<br />
107
4. CONCLUSIONS<br />
The use of extraction systems that promote cleavage of H-bonds facilitated the<br />
extraction of additional humic substances that are humin in the classical definition. This<br />
material is more hydrophobic than the fractions obtained by the classical alkali solution<br />
method. The additional fractions contained significant amounts of long-chain fatty acids,<br />
mainly with crystalline poly-methylene st<strong>ru</strong>ctures, indicating that these compounds are<br />
important for the soil aggregation. The residual insoluble humin is probably colloidal<br />
charcoal and derivatives of vegetable debris (lignin and cellulose).<br />
ACKNOWLEDGEMENTS<br />
The authors are grateful for the support provided by the Irish Research Council for<br />
Science, Engineering and Technology (IRCSET) and by the Science Foundation Ireland<br />
(SFI).<br />
REFERENCES<br />
1. Stevenson, F.J. 1994. <strong>Humus</strong> Chemistry; Genesis, Composition, Reaction. 2nd ed. John Wiley<br />
and Sons., New York.<br />
2. Rice, J.A. 2001. Soil Sci., 166, 848-857.<br />
3. Song, G. & Hayes, M.H.B. 2004. In: Humic substances and Soil and Water Environment,<br />
Martin-Ne<strong>to</strong>, L., et al. (Eds.), Proc. 12th Intern. Conf. IHSS (São. Pedro), Embrapa<br />
Inst<strong>ru</strong>mentação Agropecuária, pp. 327-331.<br />
4. Hayes, M.H.B. 2006. Soil Sci. Soc. Amer. J., 70, 986-994.<br />
5. Song, G., Novotny, E.H., Simpson, A.J., Clapp, C.E. & Hayes, M.H.B. 2007. Eur. J. Soil Sci..<br />
In press.<br />
6. Martin, D. & Hauthal, H.G. 1975. Dimethyl Sulphoxide. Van Nostrand-Reinhold, New York.<br />
7. Tsutsuki, K. & Kuwatsuka, S. 1992. Soil Sci. Plant Nutr., 38, 297-306.<br />
8. Clapp, C.E. & Hayes, M.H.B. 1996. In: Humic Substances and Organic Matter in Soil and<br />
Water Environments: Characterization, Transformations and Interactions, Clapp, C.E., et al.,<br />
(Eds.), Proc. 8th Intern. Conf. IHSS, St Paul, Minnesota, USA, pp. 3-11.<br />
9. Zhu, Y., Li, A.-M., Li, C. & Dai, J.-Y. 2005. Environmental Chemistry (in Chinese), 24, 288-292.<br />
10. Greenwood, N.N. & Earnshaw, A. 1997. Chemistry of the Elements (2nd Edition). Oxford:<br />
Butterworth-Heinemann.<br />
108
Measuring Soil Amino Compounds by Anion Chroma<strong>to</strong>graphy-Pulsed<br />
Amperometry<br />
Dan C. Olk 1 , Ann-Marie Fortuna 2 , C. Wayne Honeycutt 3<br />
1 USDA-ARS, National Soil Tilth Labora<strong>to</strong>ry, 2110 University Boulevard, Ames, IA 50011-3120,<br />
USA. dan.olk@ars.usda.gov<br />
2 Washing<strong>to</strong>n State University, Dep. of Crop and Soil Sciences, Pullman, WA 99164-6420, USA<br />
3 USDA-ARS, New England Plant, Soil, and Water Labora<strong>to</strong>ry, Orono, ME 04469-5753, USA<br />
Keywords: amino acids, amino sugars, anion chroma<strong>to</strong>graphy, pulsed amperometry<br />
1. INTRODUCTION<br />
Soil amino acids and amino sugars are thought <strong>to</strong> comprise the vast bulk of soil N,<br />
and they are commonly measured by extraction with hot HCl, separation by cation<br />
exchange chroma<strong>to</strong>graphy, derivatization by ninhydrin, and detection by visible light<br />
absorption. Yet HCl destroys some amino acids before they can be measured and amino<br />
sugars in the HCl hydrolyzate must be measured separately from amino acids. A recent<br />
alternative procedure allows simultaneous measurement of amino acids with amino sugars<br />
and better preservation of the acid-sensitive amino compounds (1). Soil is extracted by<br />
methanesulfonic acid, followed by anion chroma<strong>to</strong>graphic separation and detection with<br />
pulsed amperometry. This approach enabled slightly more efficient extraction of amino-N<br />
from agricultural soils of the U.S. Midwest than has generally been reported in a wide<br />
range of studies using the conventional HCl extraction (1, 2). Here, we further evaluate the<br />
anion chroma<strong>to</strong>graphy/pulsed amperometry approach on a separate set of soils.<br />
2. MATERIALS AND METHODS<br />
Nine diverse surface soils were collected from low-input land uses (native vegetation,<br />
uncropped borders of crop production fields) in six states of the U.S. (3). For each soil, 250<br />
mg was weighed in<strong>to</strong> glass tubes with screw caps, in four labora<strong>to</strong>ry replicates. To each<br />
tube was added 2 mL of a 4 M methanesulfonic solution having 0.2% tryptamine <strong>to</strong><br />
suppress decomposition of the acid-sensitive amino acids. The soil samples and acid<br />
solutions were au<strong>to</strong>claved for either 16 h at 121 o C and 207 kPa pressure or 90 min at<br />
136 o C and 248 kPa pressure, while previous work recommended solely the highertemperature<br />
au<strong>to</strong>claving (1, 2). Following au<strong>to</strong>claving, tubes were centrifuged and their<br />
supernatants were transferred <strong>to</strong> clean glass tubes. Tubes were washed twice with water<br />
and centrifuged, and these supernatants were combined with the original supernatant,<br />
109
then neutralized with 1 M NaOH <strong>to</strong> pH 5 <strong>to</strong> 6, and diluted <strong>to</strong> 10 mL. Of this solution, 1.5 mL<br />
was diluted with clean water in a second tube <strong>to</strong> 10 mL volume, and this solution was<br />
injected in<strong>to</strong> a Dionex DX-500 anion chroma<strong>to</strong>graph that was equipped with an AminoPac<br />
PA-10 column for separation of the amino compounds. Concentrations of amino<br />
compounds were measured with a disposable gold working electrode using triple-pulsed<br />
amperometry, i.e. a waveform that uses a stepped sequence of electrical potentials in the<br />
detec<strong>to</strong>r <strong>to</strong> cyclically cleanse the electrode surface.<br />
3. RESULTS AND DISCUSSION<br />
Chroma<strong>to</strong>graphy peaks were distinct and well resolved for many of the amino<br />
compounds, including the two amino sugars galac<strong>to</strong>samine and glucosamine (Fig. 1). With<br />
continued use of the chroma<strong>to</strong>graphy column, though, peaks for serine and proline<br />
merged with each other and peaks for ornithine and phenylalanine became<br />
indistinguishable from random baseline fluctuations.<br />
Figure 1. A representative chroma<strong>to</strong>gram of extracted amino acids and amino sugars.<br />
Peaks are numbered <strong>to</strong> represent the following compounds: (1) arginine, (2) ornithine, (3)<br />
lysine, (4) galac<strong>to</strong>samine, (5) glucosamine, (6) alanine, (7) threonine, (8) glycine, (9)<br />
valine, (10) hydroxyproline, (11) serine/proline, (12) isoleucine, (13) leucine, (14)<br />
methionine, (15) histidine; (16) phenylalanine, (17) glutamate, (18) aspartate; (19) cystine,<br />
and (20) tyrosine. The detec<strong>to</strong>r response is in units of charge.<br />
On average, 1% more amino-N was extracted by au<strong>to</strong>claving for 16 h at 121 o C/ 104<br />
kPa pressure than for 90 min at 136 o C / 112 kPa pressure (range of -12% <strong>to</strong> +14%,<br />
standard deviation 6%). This similarity in <strong>to</strong>tal extractable amino-N masked modest but<br />
consistent differences between the two au<strong>to</strong>claving methods in the extracted amounts of<br />
110
individual amino compounds (Table 1). Au<strong>to</strong>claving for the shorter duration (90 min) at<br />
135 o C provided for more efficient extraction of alanine, ornithine, and those amino<br />
compounds that are unstable in acidic solutions: serine, threonine, both amino sugars<br />
(glucosamine and galac<strong>to</strong>samine), and the S-bearing amino acids (methionine and the<br />
cystine dimer). For all other amino compounds showing a significant effect of au<strong>to</strong>claving,<br />
the 16-h heating at 121 o C provided for more efficient extraction. The interaction of<br />
au<strong>to</strong>claving with soil type was highly significant (P
the slurry addition with a general enrichment of most amino acids (3). By the end of the<br />
incubation, the N content of three amino compounds that are associated with microbial<br />
activity (ornithine, glucosamine, and galac<strong>to</strong>samine) had increased by 3% for both<br />
manured and unamended soils, while the N content of all other amino compounds had<br />
decreased by 11% in the manured soils (data not shown), likely due <strong>to</strong> either<br />
mineralization or binding <strong>to</strong> soil surfaces beyond extraction by methanesulfonic acid.<br />
4. CONCLUSIONS<br />
Meaningful concentrations of soil amino acids and amino sugars were estimated by<br />
soil extraction with methanesulfonic acid followed by anion chroma<strong>to</strong>graphic separation<br />
and pulsed amperometric detection. The results of this method differed somewhat from<br />
those generally reported for the conventional HCl analysis. As with the HCl analysis, the<br />
main problem remains the modest proportions of <strong>to</strong>tal soil N that can be identified as<br />
amino N.<br />
REFERENCES<br />
1. Martens, D.A., Loeffelmann, K. 2003. J. Agric. Food Chem. 51, 6521-6529.<br />
2. Martens, D.A., Jaynes, D.B. Colvin, T.S. Kaspar, T.C., Karlen, D.L. 2006. Soil Sci. Soc. Am. J.<br />
70:382-392.<br />
3. Olk, D.C., Fortuna, A., Honeycutt, C.W. 2008. Soil Sci. Soc. Am. J.: (submitted).<br />
4. Stevenson, F.J. 1956. Soil Sci. Soc. Am. Proc. 20, 204-208.<br />
112
Membrane Processes Applied <strong>to</strong> the Study of Marine Dissolved Organic<br />
Matter<br />
Arnaud Huguet 1 , Ernest Casademont 2 , Hélène Roux-de Balmann 2 , Fabienne Ibalot 1 ,<br />
Edith Parlanti 1<br />
1 Université Bordeaux 1; CNRS; UMR 5255; ISM-LPTC, 351 cours de la Libération, 33405 Talence<br />
cedex, France, e.parlanti@ism.u-bordeaux1.fr<br />
2 Université Paul Sabatier; CNRS; UMR 5503; Labora<strong>to</strong>ire Génie Chimique,118 route de Narbonne,<br />
31602 Toulouse cedex 4, France<br />
Keywords: dissolved organic matter, seawater, fluorescence, reverse osmosis, electrodialysis<br />
1. INTRODUCTION<br />
Aquatic dissolved organic matter (DOM) represents one of the major carbon<br />
reservoirs on Earth: seawater contains approximately 700 giga<strong>to</strong>ns of dissolved organic<br />
carbon, which is comparable <strong>to</strong> the amount of inorganic C present in the atmosphere (1).<br />
Changes in marine DOM production or consumption can have a significant effect on the<br />
carbon cycle on a time scale as short as years. Therefore, the study of DOM is important,<br />
particularly in coastal waters, where substances from the terrestrial environment are<br />
transferred <strong>to</strong> the marine environment.<br />
The isolation, characterization and study of DOM properties still constitute a real<br />
challenge nowadays. In fact, one of the main obstacles in the study of DOM is <strong>to</strong> isolate<br />
sufficient amounts of this chemically complex material, which is present at low<br />
concentrations in waters and very often associated <strong>to</strong> high salinities. Over the last thirty<br />
years, several techniques such as extraction on XAD resins or tangential ultrafiltration (UF)<br />
have been used <strong>to</strong> isolate marine DOM. These techniques provide very useful information<br />
on this material but only a small fraction of marine DOM (about 10-30% of dissolved<br />
organic carbon (2, 3)) is finally recovered. As a result, the composition of a large amount of<br />
marine organic matter is still unknown<br />
The aim of this study was <strong>to</strong> develop a method of concentration of DOM from marine<br />
and brackish waters, without modifying or fractionating the organic material and while<br />
minimizing the salt content of the samples. Reverse osmosis (RO) is now a well-developed<br />
technique for the isolation of DOM from freshwaters (4). But <strong>to</strong> date only a few attempts of<br />
concentration of DOM from salty waters were achieved: RO cannot be used directly <strong>to</strong><br />
concentrate DOM from seawater, due <strong>to</strong> the fact that salts are retained exactly like organic<br />
matter during RO. Therefore, seawater has <strong>to</strong> be desalted before the concentration of<br />
marine DOM by RO.<br />
113
Electrodialysis (ED) appears as an interesting alternative <strong>to</strong> desalt seawater before<br />
the concentration step by RO. ED is a gentle electrochemical process allowing the<br />
separation of ionic species from aqueous solutions by using an applied direct current<br />
potential through anion and cation-exchange membranes. Thus, two solutions are<br />
obtained: a demineralised solution containing organic matter (diluate compartment) and a<br />
solution containing the extracted salts (concentrate compartment). Over the last ten years,<br />
ED has been used in several studies <strong>to</strong> desalt freshwater (5) or more recently seawater (6)<br />
samples before or after their concentration by reverse osmosis. The combination of ED<br />
and RO was shown <strong>to</strong> be a valuable approach <strong>to</strong> isolate and concentrate DOM from<br />
freshwaters, since the losses of DOC during the whole process were relatively low (less<br />
than 25%). But it has still <strong>to</strong> be shown that the quality of DOM is not modified during ED.<br />
During this work, DOM of fresh, brackish and marine water samples collected in<br />
coastal environments was concentrated by nanofiltration (NF) and/or RO. At the same<br />
time, the development of a desalting step of seawater by ED was achieved. Several<br />
aliquots were collected during the RO and ED experiments and they were analyzed by<br />
three-dimensional excitation-emission matrix (EEM) spectroscopy. Thanks <strong>to</strong> this<br />
technique, potential modifications or losses of DOM during the concentration and desalting<br />
steps can be detected. The DOC content of the water samples was also measured, in<br />
order <strong>to</strong> calculate the amount of organic carbon recovered at the end of the experiments.<br />
2. MATERIALS AND METHODS<br />
The freshwater sample was collected from the upstream part of the Gironde estuary<br />
(La Réole; South Western France) in Feb<strong>ru</strong>ary 2007. The brackish water sample was<br />
collected from the maximum turbidity zone (MTZ) of the Gironde estuary in Oc<strong>to</strong>ber 2006.<br />
Last, the seawater sample was collected from the Bay of Balaguier in Toulon (South<br />
Eastern France) in May 2006. Seawater was desalted by electrodialysis, with an ED stack<br />
(Eurodia Industrie SA) equipped with AMX and CMX membranes (Tokuyama Corp.,<br />
Japan) and consisting of 10 cell pairs. The <strong>to</strong>tal membrane surface area was 0.2 m 2 . As<br />
for the reverse osmosis pilot used for DOM concentration, it was const<strong>ru</strong>cted by a French<br />
company – TIA. Two membranes were used during this work: a NF membrane (Osmonics<br />
DL2540) and a RO membrane (SW30-2540; Filmtec) designed for seawater desalination.<br />
The fluorescence spectra were recorded with a Fluorolog SPEX FL3-22 Jobin Yvon<br />
Fluorometer. The fluorescence EEM spectroscopy involved scanning and recording of 17<br />
individual emission spectra (260-700 nm) at sequential 10 nm increments of excitation<br />
wavelength between 250 and 410 nm. Last, DOC measurements were achieved with a<br />
Shimadzu Total Organic Carbon analyzer (TOC-V CSN), in NPOC mode.<br />
114
3. RESULTS AND DISCUSSION<br />
The results of the concentration of the freshwater sample are summarized in table 1.<br />
The average concentration fac<strong>to</strong>r of fluorescent DOM was calculated by dividing the<br />
fluorescence intensity of the concentrated sample (expressed in cps/s) by the one of the<br />
initial sample. This calculation was carried out for the four main fluorophores characteristic<br />
of DOM.<br />
Table 1. Results of the concentration of the freshwater sample by RO<br />
Freshwater<br />
sample<br />
Before concentration After concentration Concentration fac<strong>to</strong>r<br />
Volume (L) 332 ± 2 3.0 ± 0.03 110<br />
DOC (mg/L) 1.86 ± 0.07 111.0 ± 0.6 60<br />
Fluorescence Intensity (cps/s)<br />
Ex310/Em400nm / Ex370/Em450nm<br />
1306452/ 939392 85328234 / 60338599 64<br />
Salinity / Conductivity (mS/cm) 0 / 0.335 4.0 ± 0.1 / 7.3 22<br />
About 55% of DOM was finally recovered at the end of the concentration. The quality<br />
of DOM was not significantly modified: the 3D fluorescence spectra of the initial sample<br />
and the one of the concentrated sample have a similar shape.<br />
Table 2. Results of the concentration of the brackish water sample by RO<br />
Brackish<br />
water<br />
sample<br />
Before concentration After concentration Concentration fac<strong>to</strong>r<br />
Volume (L) 342.5 ± 2.0 12.5 ± 0.1 27.4<br />
DOC (mg/L) 2.2 ± 0.1 44.4 ± 0,4 20.2<br />
Fluorescence Intensity (cps/s)<br />
Ex310/Em400nm / Ex370/Em450nm<br />
1799870 / 1398433 42092239 / 32842987 23<br />
Salinity 2.6 ± 0,1 47.5 ± 0.1 18.3<br />
In the same way, about 340L of the brackish water sample were concentrated by RO<br />
(table 2). This technique presents two advantages: the yield in DOC is high (more than<br />
75%) and fluorescent DOM is not altered during the concentration.<br />
RO cannot be used directly <strong>to</strong> concentrate marine DOM. That is why we combined<br />
nanofiltration and RO <strong>to</strong> concentrate 940L of Mediterranean seawater. The 940L were first<br />
reduced <strong>to</strong> 32L by NF and then <strong>to</strong> 10.5L by RO. Even though a large amount of organic<br />
matter was lost during the NF step, we finally obtained a significant concentrated DOM<br />
sample representative of the initial seawater organic matter.<br />
In order <strong>to</strong> improve concentration yields, ED was considered <strong>to</strong> desalt seawater<br />
before the concentration by RO. Our results show that ED is a fast and efficient technique<br />
<strong>to</strong> desalt seawater: about 6 hours were required <strong>to</strong> desalt 20 liters of Mediterranean<br />
seawater from a salinity of 37 <strong>to</strong> a salinity of 3. During the ED, the DOC content of the<br />
diluate (desalted seawater) stayed approximately constant (figure 1) and modifications of<br />
fluorescent DOM were limited.<br />
115
Salinity<br />
45<br />
40<br />
35<br />
30<br />
25<br />
20<br />
15<br />
10<br />
5<br />
Concentrate<br />
Diluate<br />
DOC diluate<br />
DOC concentrate<br />
DOC (mg/L)<br />
1,6<br />
1,4<br />
1,2<br />
1<br />
0,8<br />
0,6<br />
0,4<br />
0,2<br />
0<br />
0<br />
0 50 100 150 200 250 300 350 400<br />
Time (min)<br />
Figure 1. Variations of the salinity and of the DOC content in the diluate and concentrate<br />
compartments during the desalting of 20 liters of seawater by ED.<br />
4. CONCLUSIONS<br />
RO is a very efficient method <strong>to</strong> concentrate DOM from fresh and brackish waters. It<br />
could be combined with ED, which allows <strong>to</strong> greatly reduce the salt content of seawater<br />
while minimizing DOM modifications and losses. Thus, sufficient amounts of marine<br />
organic matter could be obtained and then analyzed by NMR, IR, or Py-GC/MS.<br />
ACKNOWLEDGEMENTS<br />
This work was supported by IFREMER (GDR MONALISA), by CNRS and by the<br />
Regional Council of Aquitaine.<br />
REFERENCES<br />
1. Hedges, J.I., Oades, J.M. 1997. Org. Geochem. 27 (7-8), 319-361.<br />
2. Benner, R. 2002. In: Biogeochemistry of marine dissolved organic matter, pp.59-90, Elsevier.<br />
3. Mopper, K., Stubbins, A., Ritchie, J.D., Bialk, H.M., Hatcher, P.G. 2007. Chem. Rev. 107, 419-<br />
442.<br />
4. Sun, L., Perdue, E.M., McCarthy, J.F. 1995. Wat. Res. 29 (6), 1471-1477.<br />
5. Koprivnjak, J.F., Perdue, E.M., Pfromm, P.H. 2006. Wat. Res. 40 (18), 3385-3392.<br />
6. Vetter, T.A., Perdue, E.M., Ingall, E., Koprivnjak, J.F., Pfromm, P.H. (2007). Sep. Purif.<br />
Technol. 56 (3), 383-387.<br />
116
Studies of the St<strong>ru</strong>cture of Extracted Humic Acid from Naharhoran<br />
Forest Gorgan’s Soil<br />
Alireza R.Sardashti 1 , M.Alidoost 2<br />
Chemistry department, Science Faculty, Sistan and Baluchistan university, Zahedan, Iran<br />
Keywords: forest soil, extraction of humic acid, IR, potentiometeric titration, CHNS , GPC, XRD,<br />
GC/MS, benzene 1,3–dietheyl, N.N dimethyl formamide<br />
1. INTRODUCTION<br />
The humic acid are organic complex organism that is derived from soils, sediments<br />
and natural waters. Its composition and st<strong>ru</strong>cture is still very complex and unknown, so<br />
that the suggested models by dragonoy, christamen, gismi, Stevenson and others are not<br />
the same (1). They contain functionalized aliphatic-aromatic backbones that may be<br />
neutral, acidic or basic and have low or high molecular weight (2).<br />
2. MATERIALS AND METHODS<br />
2-1 Procedure. The samples were derived from soil with high organic and low iron<br />
content, taken from Naharkhoran forest( Gorgan-golestan province) in the North of Iran.<br />
The separation of organic fractions is after an initial physical (sieve) removal of s<strong>to</strong>nes and<br />
leaf litter. Then washed with 0.50 mol L -1 HCl and several times with DDW. According <strong>to</strong><br />
the pro<strong>to</strong>col of the IHSS (3) . This acid has been extracted using 0.50M NaOH and 6M HCl<br />
and then was purified by 0.3M HF(Merck darmstade Germany) and 0.1M HCl. It should be<br />
powdered <strong>to</strong> 75-150 μm before using.<br />
2-2 Apparatus. Extraction of humic acid was performed agita<strong>to</strong>r (ELM 1400rpm,<br />
Germany). IR spect<strong>ru</strong>m of the preparation sample by disk IR-470, elemental analyses<br />
system GmbH vario EL, Thermal analysis 1500 STA (England), X-ray D&Advance<br />
(Germany).<br />
3. RESULTS AND DISCUSSION<br />
The IR spect<strong>ru</strong>m of this sample perfectly was match with that of Gardea (4) and the<br />
presence of benzoic-carboxylic and phenolic functional groups were confirmed in it<br />
(Fig. 1). The <strong>to</strong>tal cationic exchange capacity and capacities of each functional were<br />
determined by potentiometeric titration method in the presence of 0.20 M NaOH in<br />
aqueous media (Tab. 1, Fig. 2). By logarithmic interpretation of potentiometeric titration<br />
curve the acidic constant (pKa) of benzoic carboxyl and phenol were calculated <strong>to</strong> be<br />
117
4.60 ± 0.25 and 8.54 ± 0.35. respectively. Fractions contain larger amounts of the<br />
unsaturated groups such as aromatic moieties in the st<strong>ru</strong>cture (2). Shows obtained<br />
percentage of CHNS and C/N ratio (Tab. 2) for humic acid extracted from Gorgan’s (5).<br />
14<br />
Figure 1. IR spect<strong>ru</strong>m of humic acid.<br />
pH<br />
12<br />
10<br />
8<br />
6<br />
4<br />
2<br />
0 1 2 3 4 5 6 7 8 9 10 11<br />
ml (NaOH)<br />
Figure 2. Potentiometeric titration of 0.5 g<br />
humic acid By 0.2M NaOH in aqueous media.<br />
Table 1. Cationic exchange capacity for each functional group<br />
Functional groupe COOH OH <strong>to</strong>tal<br />
CEC (mmol/g) 3.10 ± 0.30 2.10 ± 0.25 5.20 ± 0.40<br />
Table 2.Elemental composition<br />
Weight of humic<br />
acid(mg)<br />
C% H% N% S% Ash% O% C/N<br />
10 49.400 5.100 3.300 0.269 1.500 40.430 15.000<br />
The XRD pattern of this acid has indicated the data so obtained were mainly<br />
aromatic nuclei and it has colloidic property of particles (Fig. 3). its scanning electronic<br />
microscopy image showed the particle sizes were about 0.2 μm (Fig. 4).<br />
TG thermograms showed in the 50-150°C range a weight loss representative of the<br />
dehydration reaction (Fig. 5a). the decomposition process Between 200 and 500°C<br />
occurred mainly in two steps. The DSC thermogram of this acid exhibit three peaks<br />
(Fig. 5b). The first peak centered at 80°C attributed <strong>to</strong> the removal of the water, while the<br />
second peak centered at 300°C, attributed <strong>to</strong> the combustion of the carbohydrates. The<br />
third peak centered at 400°C may be due <strong>to</strong> the evolution of CO 2 (7, 6).<br />
118
Figure 3. The XRD pattern.<br />
Figure 4. Scanning electronic microscopy<br />
image (reference:Al 2 O 3 , V = 10°C/min).<br />
The molecular weight and viscosity of humic acid in THF solvent of was determined<br />
by GPC method (8). The result confirmed the properties of HA typical for high molecular<br />
polyelectrolytes (Tab. 3, Fig. 6).<br />
Table 3. <strong>Molecular</strong> weight and viscosity of humic acid<br />
Fac<strong>to</strong>r Viscosity <strong>Molecular</strong> Wt(g/mol)<br />
Data 2327 2153<br />
Chemical composition was determined in DMF solvent by mean GC/MS technique<br />
(9) One characteristic fragment molecule was moni<strong>to</strong>red in addition <strong>to</strong> the molecular.<br />
Benzene 1,3-dietheyl, eiccosane 2-methyl, N-tridecane, pentadecane, butanamine,<br />
acetaldehy demethoxy ,N.N dimethyl formamide.<br />
Figure 5. a) Thermogram TG;<br />
b) Thermogram DSC<br />
Figure 6. Gel permeation chroma<strong>to</strong>graphy<br />
in THF solvent.<br />
119
4. CONCLUSIONS<br />
As in soil, the beneficial effects of humic acid in aquatic systems can probably be<br />
ascribed largely <strong>to</strong> its metal-binding and cation-exchange properties may be another useful<br />
function of humic acid has proposed that humic acid be employed in the disposal of<br />
radioactive wastes. In conclusion, it would seem that the humic acid of soil has great<br />
ecological and geochemical significance, but it has not been thoroughly investigated. The<br />
results of research indicate that properties of humic acid from northern Iran’s forest soil<br />
obeys Stevenson model more than other (1).<br />
REFERENCES<br />
1. Stenvenson, F. J. 1994. In: <strong>Humus</strong> chemistry, John Wiley, New York<br />
2. Davies, G. Ghabbour, E. Steelink,C.2001. J. chem. Edu. vol 78, №12, 1609-1613.<br />
3. Schnitzer, M. Kodama, H. Ripmeester, J. A. 1991. Soil. sci. soc. AM. J, vo l55, p 745-750.<br />
4. Gardea-Torresdey et al. 1996. Jof Hazardous materials. 48, 191-206.<br />
5. Gonet, S. S. Wegner, K. 1996. J. Environment international, 22(5), 485-488.<br />
6. Pietro, M. Paola, C. 2004. Thermochimica Acta. 413, 209-214.<br />
7. Francioso, O. Montecchio, D. Gioacchini, P. 2004. Applied Geochemistry, p 1-8.<br />
8. Hou, L. Lee, K. 2004. J. chroma<strong>to</strong>graphy. 1038, 37-42.<br />
9. Kappler, A. Rong, Ji. B<strong>ru</strong>ne, A. 2000. Soil Biology&Biochemistry, 32, 1270-1280.<br />
120
Application of a Novel Polarity Method for the Analysis of Natural<br />
Organic Matter during Water Treatment<br />
Fernando L. Rosario-Ortiz, Fredrick W. Gerringer and I. H. Suffet<br />
Environmental Science and Engineering Program, UCLA, School of Public Health, Room 46-081,<br />
CHS, Charles E. Young Drive S., Los Angeles, California 90095, USA msuffet@ucla.edu<br />
Keywords: NOM, PRAM, source water, water treatment<br />
1. INTRODUCTION<br />
The accurate characterization of the properties of natural organic matter (NOM) in<br />
environmental samples continues <strong>to</strong> be a challenge. Advanced analytical techniques such<br />
as resin fractionation and mass spectrometry are commonly used <strong>to</strong> characterize NOM (1).<br />
However, these methods require extensive preparative steps <strong>to</strong> obtain solid phase extracts<br />
and limit the analysis <strong>to</strong> a select number of samples. Also, sample pH is modified and this<br />
does not accurately represent the environmental conditions of NOM. An additional<br />
approach <strong>to</strong> the characterization of NOM is the development of simple methodologies<br />
which could be used <strong>to</strong> evaluate water treatment performance and reactivity at natural pHs<br />
during the treatment process. Recently, an alternative approach <strong>to</strong> the characterization of<br />
the polarity of NOM was presented (2,3). The polarity rapid assessment method (PRAM)<br />
permits NOM characterization under ambient conditions in less than one hour, allowing for<br />
the timely analysis of multiple samples. This approach enables researchers <strong>to</strong> evaluate the<br />
temporal variability of NOM characteristics and the effect of this variability on the changes<br />
of NOM polarity within the water treatment systems.<br />
The objective of this study was <strong>to</strong> present the applicability of using PRAM <strong>to</strong><br />
understand polarity changes of chromophoric NOM that occur in surface waters and during<br />
water treatment. For this, a pilot system simulating conventional treatment with preozonation<br />
and biofiltration was studied. This study emphasizes the characterization of<br />
NOM polarity under ambient using this simple methodology.<br />
2. MATERIALS AND METHODS<br />
Three water samples were collected from a dual-train conventional treatment plant<br />
(rapid mix/flocculation/sedimentation/filtration) with a flow rate of 17 L/min (4.5 gal/min) per<br />
train. The pilot plant included pre-ozonation and biological filtration. The source water for<br />
the pilot plant included a variable blend of Colorado River Water (CRW) and State Project<br />
Water (SPW) from the San Joaquin Delta in California with a TOC of approximately 3<br />
mgC/L.<br />
121
PRAM characterization was done following the procedure described previously(2,3).<br />
Briefly, solid-phase extraction (SPE) cartridges (Alltech Associates, Deerfield, IL, USA)<br />
were used <strong>to</strong> quantify the amount of NOM adsorbed on<strong>to</strong> each sorbent. The used sorbents<br />
included non-polar (C18 and C2,), polar (CN, Diol and Silica) and anionic exchangers<br />
(NH2, SAX). Water samples were <strong>ru</strong>n through each cartridge and the UVA at 254 nm was<br />
obtained versus time. Flow through each SPE cartridge was maintained at 1.2 mL/min<br />
(except for CN, with a flow of 1.67 mL/min) using a syringe pump (KD Scientific Model<br />
100, Hollis<strong>to</strong>n, MA, USA).<br />
The UVA breakthrough curves were normalized <strong>to</strong> the initial conditions. Analysis of<br />
these breakthrough curves provided a measure of the <strong>to</strong>tal material adsorbed, described<br />
as a retention coefficient (RC) and defined as one minus the maximum breakthrough level<br />
(C max /C initial ). The results are presented as RC for each SPE sorbent. These RCs have<br />
been indirectly correlated <strong>to</strong> physicochemical properties of NOM (2).<br />
3. RESULTS AND DISCUSSIONS<br />
Figure 1 presents the PRAM results describing the RCs obtained for the analysis of<br />
the raw water during the three sampling events. The observed ranges in RC were 0.50 -<br />
0.70 for the weak anion exchange (NH2), 0.86-0.89 for the strong anion exchangers<br />
(SAX), 0.00 - 0.10 for the polar sorbents (CN, Diol and Silica) and 0.05-0.25 for non-polar<br />
sorbents (C18 and C2). The high RCs for the anion exchangers were due <strong>to</strong> the negative<br />
charges associated with NOM that are caused by the de-pro<strong>to</strong>nation of carboxylic acids<br />
and phenolic groups at ambient pH (4).<br />
There was variability between all the samples analyzed. For example, the RCs for<br />
C18 were 0.24, 0.17 and 0.14 for the three samples, with a standard error
1.00<br />
0.90<br />
0.80<br />
Retention Coefficient<br />
0.70<br />
0.60<br />
0.50<br />
0.40<br />
0.30<br />
11/19/2003<br />
12/4/2003<br />
12/16/2003<br />
0.20<br />
0.10<br />
0.00<br />
C-18 C-2 CN Silica Diol NH-2 SAX<br />
SPE Sorbent<br />
Figure 1. PRAM results for three raw water samples collected from the pilot plant during<br />
six weeks of testing.<br />
As Figure 2 shows, the C18 RCs decreased for two of the three samples and<br />
practically remain unchanged for the last sample. These results indicate NOM oxidation<br />
reduced hydrophobicity, which agrees with other reports that used resin fractionation for<br />
NOM analysis through ozone treatment (5). However, a similar trend was not observed for<br />
C2 RCs. Since the capacity of C2 is less than that of C18 for the adsorption of<br />
hydrophobic compounds, the data suggest hydrophobicity changed within the core of the<br />
NOM mixture and beyond the reach of the shorter C2 chain.<br />
The RCs obtained for Diol increased during the last two samples and remain<br />
unchanged for the first one. This change corresponds <strong>to</strong> an increase of the overall<br />
proportion of polar functional groups, confirming previous research demonstrating<br />
ozonation causes an increase in the overall NOM polarity. This increase is also observed<br />
for the weak anion exchanger, NH2 RCs. On the other hand, the stronger anion<br />
exchanger, SAX does not follow the increase demonstrated by NH2. For the first sample,<br />
SAX shows a decrease in the proportion of negative charges compared <strong>to</strong> the other two<br />
samples in which no change is observed. Additional work in this area will elucidate these<br />
differences and their significance.<br />
4. CONCLUSIONS<br />
This paper presents the first time PRAM has been used for the characterization of<br />
the polarity of NOM across a treatment system. The application of PRAM offers the<br />
advantage of allowing the characterization of numerous samples, resulting in the<br />
123
evaluation of variability of NOM. This is advantageous for drinking water utilities interested<br />
in understanding the variations in NOM in their water supplies and how these variations<br />
affect treatment systems at ambient pH.<br />
0.25<br />
0.2<br />
Difference in Retention Coefficient<br />
0.15<br />
0.1<br />
0.05<br />
0<br />
-0.05<br />
11/19/03<br />
12/4/03<br />
12/16/03<br />
C-18 C-2 CN Silica Diol NH-2 SAX<br />
-0.1<br />
-0.15<br />
SPE Sorbent<br />
Figure 2. Difference in retention coefficient between raw water and ozone effluent. A<br />
positive difference indicates an increase in the specific polarity fraction. A negative<br />
difference indicates a decrease in the specific polarity fraction by removal or chemical<br />
transformation.<br />
ACKNOWLEDGEMENTS<br />
Grant funding for this project was provided by the California Department of Water<br />
Resources. The Metropolitan Water District of Southern California (MWDSC) also provided<br />
funding, pilot facilities and water quality analysis for this research in cooperation with<br />
UCLA.<br />
REFERENCES<br />
1. Leenheer, J.A. and J.P. Croué. Environ. Sci. Technol., 2003. 37(1): p. 19A-26A.<br />
2. Rosario-Ortiz, F.L., S. Snyder, and I.H. Suffet. Environ. Sci. Technol., 2007. 41(14): p. 4895-<br />
4900.<br />
3. Rosario-Ortiz, F.L., S. Snyder, and I.H. Suffet. Water Res., 2007. 41: p. 4115-4128.<br />
4. Stevenson, F.J., <strong>Humus</strong> chemistry, Genesis, composition, reaction. 2nd Edition ed. 1994, New<br />
York: John Wiley & Sons, INC.<br />
5. Westerhoff, P., J. Debroux, G. Aiken, and G. Amy. Ozone-Sci. Eng., 1999. 21(6): p. 551-570.<br />
124
Separation and Isolation of Soil Humic Acid Fluorescence Species by<br />
Tandem Ultrafiltration-PAGE<br />
Olga E. T<strong>ru</strong>betskaya 1 , Lubov A. Shaloiko 1 , Dmitrii V. Demin 2 , Claire Richard 3 ,<br />
Oleg A. T<strong>ru</strong>betskoj 2<br />
1 Branch of Shemyakin and Ovchinnikov Institute of Bioorganic Chemistry, Russian Academy of<br />
Sciences, 142290 Pushchino, Moscow region, Russia, olegi03@yahoo.com<br />
2 Institute of Basic Biological Problems, Russian Academy of Sciences, 142290 Pushchino,<br />
Moscow region, Russia<br />
3 Labora<strong>to</strong>ire de Pho<strong>to</strong>chimie Moléculaire et Macromoléculaire, UMR CNRS-Université Blaise<br />
Pascal 6505, 63177 Aubière Cedex, France<br />
Keywords: humic acid, fluorescence, PAG electrophoresis, ultrafiltration<br />
1. INTRODUCTION<br />
Soil humic acids (HAs) are fluorescence organic compounds which emission spectra<br />
generally characterized by a broad band showing a maximum that depends on the origin<br />
and nature of the HAs. It is well known that soil HA fluorescence is probably the sum of<br />
many different fluorophores presented in humic molecules (1, 2). However, the information<br />
about soil humic material with different fluorescence properties up <strong>to</strong> present day is limited.<br />
Recently the distribution of soil HAs on the fractions with different fluorescence intensity<br />
has been done (3, 4). However, due <strong>to</strong> the chemical complexity, variable chemical<br />
composition and molecular size (MS) polydispersity of soil HA, the separation of soil HA<br />
fluorescence on the different species have not been realized still. For solving of this<br />
problem the combination of modern fractionation methods with rapid detection of results of<br />
fluorescence distribution between fractions seems <strong>to</strong> be very promising.<br />
In this study ultrafiltration (UF) following by polyacrylamide gel electrophoresis<br />
(PAGE) with detection in white and UV-light was used for separation of soil HA<br />
fluorescence on the different species.<br />
2. MATERIALS AND METHODS<br />
The soil sample used in this study was taken from the A horizon (10-20cm) of typical<br />
chernozem soil (Kursk region, Russia). Isolation of HA from soil has been done according<br />
<strong>to</strong> IHSS extraction procedure. The HA has been dialyzed through the dialysis membrane<br />
5kDa during seven days against distilled water. Some characteristics of soil and soil HA<br />
were previously reported (5).<br />
125
Ultrafiltration of HA was carried out using Amicon Diaflo membrane YM5 with nominal<br />
retention size 5 kDa (pore size was calibrated for proteins by manufacturer) in nitrogen gas<br />
atmosphere at a pressure of 5psi (1p.s.i.=6894.76 Pa). The membranes used were 42 mm<br />
in diameter. The 50 mg of HA has been dissolved in 50 ml 7M urea and put in<strong>to</strong> the<br />
ultrafiltration cell. After finishing of the utrafiltrafiltration procedure 30 ml of ultrafiltrate<br />
(marked UF1, MS5 kDa) have been<br />
obtained. Further retentate R1 was dilute with 7M urea up <strong>to</strong> 50 ml and again pass through<br />
the same 5 kDa UF-membrane. This procedure has been repeated 30 times until the clear<br />
ultrafiltrate solution has been obtained. At the end of the experiment we have got 30<br />
ultrafitrates (from UF1 <strong>to</strong> UF30, the volume of each was 30 ml) and last retentate R30<br />
(volume 20 ml). The ultrafiltrates from UF1 <strong>to</strong> UF30 have been combined in<strong>to</strong> fraction<br />
named UF(1-30). Than retentate R30 and combined ultrafiltrate UF(1-30) were dialyzed<br />
through the dialysis membrane 0.5 kDa during seven days against distilled water,<br />
lyophilized and assayed by PAGE.<br />
To investigate the effect of urea treatment on HA chemical st<strong>ru</strong>ctural changes, 50 mg<br />
of unfractionated HA was dissolved in 7 M urea for two days, then dialyzed seven days<br />
against distilled water (cut-off of the dialysis membrane was 5 kDa), lyophilized, and then<br />
used for further physical-chemical analyses.<br />
The method of PAGE which used for analysis of HA samples has been reported<br />
previously (5). 9.7% acrylamide and 0.3% bisacrylamide were dissolved in 89 mM Trisborate,<br />
pH 8.3, with 1 mM EDTA and 7M urea. Electrode buffer was 89 mM Tris-borate,<br />
pH 8.3, 1 mM EDTA. For electrophoresis we have applied on the gel 0.1 mg of HA sample<br />
completely dissolved in 0.1 ml of sample buffer containing 89 mM Tris-borate, pH 8.3,<br />
7 M urea, 1% SDS and 1 mM EDTA.<br />
Immediately after electrophoresis the results of HA fractionation in polyacrylamide gel<br />
were reviewed in a dark room using a TFP UV/WL – mixed transillumina<strong>to</strong>r both in white<br />
and UV (312 nm) light. The pho<strong>to</strong>s have been done using Nikon COOLPIX L3 digital pho<strong>to</strong><br />
camera (5.1 Megapixels, 3x optical zoom).<br />
3. RESULTS AND DISCUSSION<br />
The chernozem soil HA, humic acid after urea treatment (HAU), retentate R30<br />
(MS>5kDa) and combined ultrafiltrate UF(1-30) (MS
uffer at a level 1%. Urea assists in the rapture of intra and/or intermolecular hydrogen<br />
bonds in humic matter and prevents interaction between fractionated HA and the PAG.<br />
Disaggregating effect of SDS based on displacement of polyvalent cations from HA. The<br />
proposed PAGE procedure allows separation of primary disaggregated st<strong>ru</strong>ctural humic<br />
components, thereby solving some of the key problems occurring in fractionation of HA.<br />
The result of electrophoresis has been reviewed on transillumina<strong>to</strong>r in both white and<br />
UV (312 nm) light and presented on Figure 1. It should be noted that using PAGE with<br />
coupling of the transillumina<strong>to</strong>r technique is quite routine methodology for study of proteins<br />
and DNA. However, there are no reports in literature about using of this set-up respect <strong>to</strong><br />
humic substances.<br />
HAU HA R30 UF(1-30) HAU HA R30 UF(1-30)<br />
A<br />
B<br />
C<br />
D<br />
F<br />
White light<br />
UV light (312 nm)<br />
Figure 1. Electrophoresis of 0.1 mg HA, HAU, R30 and UF(1-30). A, B, C, D – naturally<br />
colored zones, detected in white and UV light. F – fluorescence fraction,<br />
detected in UV light.<br />
In white light the original HA sample was separated in<strong>to</strong> four discrete fractions: A - or<br />
start zone, that did not move in<strong>to</strong> the gel and three intensively naturally colored zones B, C<br />
and D. Zone B differed greatly from zones C and D in EMs. The similar electrophoretic<br />
pattern has been obtained for HAU. However, in retentate R30 the fraction D was very<br />
pale and for ultrafiltrate UF(1-30) only very weak fraction D and traces of fraction C have<br />
been detected. Identically marked fractions have similar EMs. It have been shown<br />
previously, that MS of electrophoretic fractions decreased with increasing of their EM (5).<br />
Fraction A had the highest MS and fraction D - the smallest MS.<br />
In UV light the original HA sample revealed the new fraction F, which possess the<br />
highest EM and shows intense overlapping yellow and blue fluorescence. Fraction D<br />
127
evealed pale red fluorescence. Fractions A, B, and C did not show fluorescence. The<br />
similar electrophoretic pattern has been observed for HAU. On the other hand retentate<br />
R30 demonstrated only narrow red-fluorescing band associated with the fraction D.<br />
Ultrafiltrate UF(1-30) shown the yellow-blue fluorescence associated with fractions C, D, F<br />
and small part of blue fluorescence formed narrow zone in the mid part of the gel. We<br />
could visualize that humic material actually contain at least a few different fluorescence<br />
species (red, yellow and blue). Unfortunately, from the monochromatic colour of the<br />
Figure 1, it was not possible <strong>to</strong> show the natural colour of the fluorescence.<br />
In the work presented here the ultrafiltration of HA was carried out using membrane<br />
with nominal retention size 5 kDa in 7M urea solution. It should be suggested that humic<br />
material which came through the membrane (nearly 20% of the hole weight of HA) and<br />
possess yellow-blue fluorescence had nominal MS less than 5 kDa and connected with HA<br />
matrix through intra and/or intermolecular hydrogen bonds. Interestingly that urea<br />
treatment of HA with subsequent dialysis through 5kDa membrane was unsuccessful for<br />
separation of fluorescence of humic material.<br />
4. CONCLUSIONS<br />
The combination of ultrafiltration in 7M urea following by PAGE with detection in<br />
white and UV light is very promising for the rapid and visulizable investigations of the HA<br />
fluorescence and separation of fluorescence material from the not fluorescence one.<br />
ACKNOWLEDGEMENTS<br />
The work has been supported by INTAS grant 06-8055 and Russian Foundation for<br />
Basic Research (project 06-04-48266-a).<br />
REFERENCES<br />
1. Senesi, N. 1990. Anal.Chem.Acta 232, 77-106.<br />
2. Alberts, J.J., Takacš, M. 2004. Org. Geochem. 35, 243-256.<br />
3. Richard, C., T<strong>ru</strong>betskaya, O. E., T<strong>ru</strong>betskoj, O. A., Reznikova, O. I., Afanas’eva, G.<br />
4. Aguer, J.- P., Guyot G. 2004. Environ. Sci. Technol. 38, 2052-2057<br />
5. Conte, P., Spaccini, R., Šmejkalova, D., Nebbioso, A., Piccolo, A. 2007. Chemosphera., 69,<br />
1032-1039.<br />
6. T<strong>ru</strong>betskoj, O.A., T<strong>ru</strong>betskaya, O.E., Afanas'eva G.V., Reznikova, O.I.,<br />
7. Saiz-Jimenez, C. 1997. Journal of Chroma<strong>to</strong>graphy A 767, 285-292.<br />
128
NMR Approaches for Characterization of Soil HA Fractions Obtained by<br />
SEC-PAGE<br />
Oleg A. T<strong>ru</strong>betskoj 1 , Olga E. T<strong>ru</strong>betskaya 2 , Isaiah D. Ruhl 3 , Patrick G. Hatcher 3<br />
1 Institute of Basic Biological Problems, Russian Academy of Sciences, 142290 Pushchino,<br />
Moscow region, Russia, t<strong>ru</strong>b@fibkh.serpukhov.su<br />
2 Branch of Shemyakin and Ovchinnikov Institute of Bioorganic Chemistry, Russian Academy of<br />
Sciences, 142290 Pushchino, Moscow region, Russia<br />
3 Department of Chemistry and Biochemistry, Old Dominion University, Norfolk VA, 23529, USA<br />
Keywords: humic acid, PAGE, SEC, 13 C –NMR, 1 H- NMR<br />
1. INTRODUCTION<br />
The NMR spectroscopy is one of the technique that has been most successful in<br />
st<strong>ru</strong>ctural investigation of soil HAs fractionated by different approaches. The aim of this<br />
study was <strong>to</strong> examine by both solid 13 C-NMR and 1 H-NMR in D 2 O and DMSO-d 6 the<br />
chernozem soil HA and its different in molecular size (MS) and electrophoretic mobility<br />
(EM) fractions, obtained by combination of size exclusion chroma<strong>to</strong>graphy and<br />
electrophoresis (SEC-PAGE).<br />
2. MATERIALS AND METHODS<br />
The sample was taken from the A horizon of a chernozem soil (Kursk region, central<br />
European section of Russia). Methods for humic acid extraction, purification and<br />
fractionation by SEC-PAGE was previously reported (1). Three fractions A, B, and C+D<br />
with different MS and EM were obtained. To investigate the effect of urea treatment,<br />
unfractionated HA was dissolved in 7M urea for two days, then dialyzed against distilled<br />
water and lyophilized. 1 H-NMR spectra was made on a Varian UNITY plus spectrometer,<br />
solid-state 13 C-NMR spectra - on a 400 MHz B<strong>ru</strong>ker AVANCE II spectrometer.<br />
3. RESULTS AND DISCUSSION<br />
The PAGE analysis of the whole HA and each individual fraction A, B, and C+D,<br />
obtained by tandem SEC-PAGE, is shown in Figure 1. On the basis of fraction elution<br />
volumes during chroma<strong>to</strong>graphy we suggest that the MS of electrophoretic fractions are in<br />
decreasing order A > B > C+D.<br />
The 1 H-NMR spectra of the chernozem bulk HA in D 2 O and DMSO-d 6 are strongly<br />
influenced by the solvent used (Figures 2 and 3). While 1 H-NMR spectra of bulk HA and<br />
HA treated by urea (HAU) in D 2 O have no any differences (Figure 2), a major contrast is<br />
129
observed between 1 H-NMR spectra of these samples in DMSO-d 6 solvent (Figure 3). The<br />
HAU reveals a significantly higher proportion of an overlapping group of peaks between<br />
6.9-7.4 ppm, corresponded <strong>to</strong> exchangeable groups like phenolic, carboxylic and amidic.<br />
We suggest that the increased intensity for these signals is due <strong>to</strong> the <strong>ru</strong>pture of H-bonds<br />
and creation of additional exchangeable sites in HA after urea treatment. Addition of a<br />
small amount of D 2 O <strong>to</strong> any investigated samples dissolved in DMSO-d 6 induced complete<br />
lose of the signals between 6.9 and 7.4 ppm, indicating that these signals are from the<br />
exchangeable hydrogens.<br />
HA A B C+D<br />
Figure 1. Electrophoresis of the chernozem HA and fractions A, B, C+D.<br />
When comparing the 1 H-NMR spectra in D 2 O of fractions A, B and C+D, there are<br />
some noteworthy differences. There is relatively higher amounts of aromatic 1 H’s, denoted<br />
by the broad band between 6.5 and 9.0 ppm, in fraction C+D. In this fraction C+D there is<br />
proportionally less in the resonance range 3.5 <strong>to</strong> 4.5 ppm (carbohydrates, proteins) than in<br />
fractions A and B. Fraction A is more enriched in signals for polymethylenic st<strong>ru</strong>ctures (1.3<br />
ppm) than the other two fractions.<br />
The spect<strong>ru</strong>m of fraction B in DMSO-d 6 shows appearance of sharp signal at 7.4 ppm<br />
with shoulders in the region of 7.3-6.9 ppm. The spect<strong>ru</strong>m of fraction C+D in DMSO-d 6<br />
demonstrate high intensity of peaks in region 6.9-7.3, but sharp peak at 7.4 ppm is absent.<br />
We could assume that exchangeable groups in fraction B differ greatly from exchangeable<br />
groups of fraction C+D. The fraction A was not dissolved in DMSO-d 6 and did not analyze<br />
in this solvent.<br />
Solid-state 13 C-NMR spectra of the bulk HA and HAU exhibit common features for<br />
soil HAs (2), and the ratio between different peaks change dramatically from fraction A <strong>to</strong><br />
C+D (Figure 4, Table 1). This suggests that there is significant heterogeneity of molecular<br />
130
st<strong>ru</strong>cture and functionality among the various fractions, which differ in both EM and MS.<br />
The spect<strong>ru</strong>m of fraction A is dominated by H,C-alkyl and O,N-alkyl carbon. The<br />
percentage of aromatic carbon (108-165 ppm) drastically decreases in fraction A in<br />
comparison with the HA sample. In fraction B, the percentage of both H,C-alkyl and O,Nalkyl<br />
carbon essentially decrease in comparison with fraction A, but is nevertheless more<br />
than in the unfractionated HA. The aromatic character of HA becomes pronounced in<br />
fraction C+D, where the O-alkyl carbon peak at 100 ppm disappears and alkyl carbons<br />
between at 0 and 50 ppm are considerably less intense than in the unfractionated HA,<br />
HAU, and fractions A and B.<br />
HA<br />
HA<br />
HAU<br />
HAU<br />
A<br />
B<br />
B<br />
C+D<br />
C+D<br />
10 9 8 7 6 5 4 3 2 1 0 ppm 10 9 8 7 6 5 4 3 2 1 0 ppm<br />
Figure 2.<br />
1 H-NMR spect<strong>ru</strong>m in 0.1N<br />
NAOH/D 2 O of chernozem HA, HAU<br />
and electrophoretic fractions A, B<br />
and C+D (2.5 mg/ml). The peak at<br />
4.8 ppm corresponds <strong>to</strong> the traces of<br />
water.<br />
Figure 3. 1 H-NMR spect<strong>ru</strong>m in<br />
DMSO-d 6 of chernozem HA, HAU<br />
and electrophoretic fractions B and<br />
C+D (2.5 mg/ml). The peaks at 2.6,<br />
3.4, and 5.5 ppm correspond <strong>to</strong><br />
DMSO, the traces of water, and<br />
urea, respectively.<br />
131
HA<br />
HAU<br />
A<br />
B<br />
C+D<br />
300 250 200 150 100 50 0 ppm<br />
Figure 4. Solid-state 13 C-NMR spect<strong>ru</strong>m of chernozem HA, HAU and electrophoretic<br />
fractions A, B and C+D (about 80mg of each sample used for analysis). A distinct peak at<br />
161 ppm correspond <strong>to</strong> urea.<br />
Table 1. Percentage of carbon in the main st<strong>ru</strong>ctural fragments of the chernozem HA and<br />
its electrophoretic fractions A, B and C+D<br />
Sample<br />
C C=O<br />
220-187<br />
C COO,CON<br />
187-165<br />
C Ar-O,N<br />
165-145<br />
C Ar-H,C<br />
145-108<br />
C Alk-O,N<br />
108-50<br />
C Alk-H,C<br />
50-0<br />
C Alk /C Ar<br />
0-108/108-165<br />
HA 3.4 10.3 7.5 48.7 13.4 16.7 0.5<br />
HAU 3.8 12.1 8.2 48.0 12.7 15.2 0.5<br />
A 3.6 10.9 5.8 28.3 23.8 27.6 1.5<br />
B 5.6 13.1 8.0 37.6 17.8 17.9 0.8<br />
C+D 3.9 14.2 9.2 53.5 7.6 11.6 0.3<br />
4. CONCLUSIONS<br />
The 1 H-NMR spectra in D 2 O and DMSO-d 6 , and solid 13 C-NMR spectra of chernozem<br />
HA and its fractions, obtained by combined SEC-PAGE, show significant differences in<br />
chemical st<strong>ru</strong>cture of fractions with different MS and EM. Low MS fraction C+D 5 times<br />
considerably more aromatic than high MS fraction A.<br />
ACKNOWLEDGEMENTS<br />
This work has been carried out in the framework of Fulbright Visiting Senior Scholar<br />
Program. Part of the work have been supported by INTAS (project 05-8055) and Russian<br />
Foundation for Basic Research (project 06-04-48266).<br />
REFERENCES<br />
1. T<strong>ru</strong>betskoj, O.A., T<strong>ru</strong>betskaya, O.E., Reznikova, O.I., Afanasieva, G.V., Saiz-Jimenes, C.<br />
1997. J. Chromat. A 767, 285-292.<br />
2. Hatcher, P.G., Dria, K.J., Kim, S., Frazier, S.W. 2001. Soil Science 166, 770-794.<br />
132
Comparison of Humic Acid and Metal Salt Interactions in Capillary<br />
Electrophoresis<br />
Monika Übner 1 , Mihkel Kaljurand 2 , Margus Lopp 2<br />
1 Pärnu College of Tartu University, Ringi 35, 80010 Pärnu, Es<strong>to</strong>nia, monika.ubner@ut.ee<br />
2 Department of Chemistry, Faculty of Science, Tallinn University of Technology, Ehitajate tee 5,<br />
19086 Tallinn, Es<strong>to</strong>nia<br />
Keywords: capillary electrophoresis; electrophoretically mediated microanalysis; humic acid<br />
1. INTRODUCTION<br />
The complicated chemical st<strong>ru</strong>cture of humic acids (HA) depends on their source.<br />
Due <strong>to</strong> the polyfunctionality and the zwitterionic character of humic substances (HS) allows<br />
the interaction of anions with positively charged groups of humics and cations with<br />
negative charged groups of these substances (1). In addition, they tend <strong>to</strong> form<br />
aggregates. The formation of aggregates is a highly metal dependent process (2).<br />
Recently we have found that electrophoretically mediated microanalysis (EMMA)<br />
offers a chance <strong>to</strong> follow the chemical reactions of Pb 2+ and fulvic acid ions inside capillary<br />
(3). In order <strong>to</strong> minimize the HS sorption effect on the uncoated capillary, HS diluted<br />
solutions were used as background electrolyte (BGE) (3, 4). In the present study,<br />
differences in the interaction of metal salts with standard HA (sHA) and natural HA (nHA)<br />
from the Baltic Sea sediment were investigated, using those solutions as BGE, in order <strong>to</strong><br />
find possibilities <strong>to</strong> characterize the binding sites of HA.<br />
2. MATERIAL AND METHODS<br />
Standard HA from Fluka and analytical grade reagents were used. Natural HA was<br />
extracted from the sediment of the Baltic Sea (Haapsalu Bay). Separation procedures are<br />
described in a previous paper by Übner et al. (5). The concentration of HA in BGE was 0.1<br />
mg/ml and pH was adjusted <strong>to</strong> pH = 7 (Na-salt form). Metal salt solutions were prepared in<br />
the range 1 × 10 –4 M <strong>to</strong> 4 × 10 –4 M. All the CE experiments were performed with an ISCO<br />
CV 4 Capillary Electropherograph model 3850, which was thermostated with forced air by a<br />
fan. The bare fused-silica capillary 75 µm I.D (Polymicro Technologies, Phoenix, AZ, USA)<br />
had a <strong>to</strong>tal length of 80 cm (48 cm <strong>to</strong> the detec<strong>to</strong>r). Procedure is described in our previous<br />
work (3, 6).<br />
The velocity of electroosmotic flow (EOF) was estimated by the use of nitromethane<br />
as a marker compound. The calculated EOF mobility value for sHA was (1.24±0.01)×10 -3<br />
133
cm 2 /V s and for nHA was (1.36±0.05)×10 -3 cm 2 /V s. All experiments were done in triplicate<br />
and perform at room temperature.<br />
3. RESULTS AND DISCUSSIONS<br />
Natural and standard HA solutions with two metal salts solution, Pb(NO 3 ) 2 and<br />
NaNO 3 , form characteristic reproducible electropherograms (Figure 1).<br />
Figure 1. Electropherograms: A – 3·10 –4 M NaNO 3 , nHA as BGE; B – 3·10 –4 M Pb(NO 3 ) 2 ,<br />
nHA as BGE; C – 3·10 –4 M NaNO 3 , sHA as BGE; D – 3·10 –4 M Pb(NO 3 ) 2 , sHA as BGE.<br />
Separation voltage 20 kV; hydrodynamic injection, 15 s; detection at 226 nm; fused-silica<br />
capillary 80 cm × 75 μm.<br />
All electropherograms can be divided in<strong>to</strong> two main regions: 1 – broad negative peak<br />
with positive hump on that; 2 – a wide triangular-shape peak. Two humps in region 1 and 2<br />
indicate the formation of at least two different types. Areas of the regions 1 and 2 were<br />
calculated.<br />
Area of the whole hump in region 1 (Figure 2) showed good correlation with inserted<br />
Pb(NO 3 ) 2 for sHA and for nHA (R 2 = 0.9807; R 2 = 0.9580, correspondingly). Natural HA do<br />
not have linear correlation and the area value have maximum. The slope value is 8.1 times<br />
more for sHA. Whole hump of NaNO 3 with sHA and nHA showed linear correlation (R 2 =<br />
0.8246; R 2 = 0.9626, correspondingly) in region 1. The slope values are 1.6 times more for<br />
sHA.<br />
134
The negative area after the hump in region 1 should express the vacancy of charged<br />
particles, which is formed by removing HA anions from the reaction zone in both directions<br />
– <strong>to</strong>wards the hump in region 1 and in region 2. Area values of that negative area are<br />
correlated with inserted metal salt (Figure 3). Natural HA has non-linear correlation with<br />
inserted Pb(NO 3 ) 2 and NaNO 3 (R 2 = 0.8078; R 2 = 0.8771, correspondingly). Standard HA<br />
has linear correlation with inserted Pb(NO 3 ) 2 and NaNO 3 (R 2 = 0.9895; R 2 = 0.9852,<br />
correspondingly).<br />
x10 5 area<br />
70<br />
60<br />
50<br />
40<br />
30<br />
20<br />
10<br />
0<br />
1 2 3 4<br />
x10 -4 M Pb 2+ or Na + concentration<br />
nHA/Pb2+ nHA/Na+ sHA/Pb2+ sHA/Na+<br />
Figure 2. Dependence of the area of whole hump in region 1 on the concentration of<br />
inserted Pb(NO 3 ) 2 or NaNO 3 in different background electrolytes, nHA or sHA.<br />
x10 5 area<br />
0 1 2 3 4<br />
0<br />
-10<br />
-20<br />
-30<br />
-40<br />
-50<br />
x10 -4 M Pb 2+ or Na + concentration<br />
nHA/Pb2+ nHA/Na+ sHA/Pb2+ sHA/Na+<br />
Figure 3. Dependence of the negative area after the hump in region 1 on the concentration<br />
of inserted Pb(NO 3 ) 2 or NaNO 3 in different background electrolytes, nHA or sHA.<br />
135
Area of region 2 in both cases showed linear correlation with the injected metal salt.<br />
Standard HA has more functional groups that may interact with different ions than natural<br />
HA from Baltic Sea. Estimating the slope value for Pb(NO 3 ) 2 , it is 14.5 times more for sHA<br />
and for NaNO 3 it is 1.3 times more for sHA than nHA.<br />
Our previous data showed that nHA had more aliphatic st<strong>ru</strong>cture than sHA. So, the<br />
formation of inner sphere complexes turn outside long carbon chains and make the natural<br />
HA molecule with lead more hydrophobic. Standard HA has more carboxyl st<strong>ru</strong>ctures than<br />
nHA (Table 1) because the content of oxygen is 1.7 times higher.<br />
Table 1. Elementary composition of standard and natural HA (5, 7)<br />
Humic substances Ash C H N O [H]/[C] [O]/[C] [N]/[C]<br />
sHA 20% 35.7% 3.3% 0.6% 39.6% 1,11 0.83 0.01<br />
nHA 33% 33.7% 5.0% 4.8% 23.4% 1.79 0.52 0.12<br />
Slope values in region 1 and 2 in both HA and metal salts and our previous data<br />
showed that Pb 2+ prefer <strong>to</strong> form fast moving complexes with HA. It is related <strong>to</strong> the highest<br />
content of carboxyl groups in region 1. Region 2 is more complicated and affected with<br />
NO – 3 .<br />
4. CONCLUSIONS<br />
On-column complexation of natural and standard HA with two different metal salts<br />
characterize the HA fractions. Standard HA contains more carboxylic groups and binds<br />
more Pb 2+ than natural HA. Nitrate anion affects the formation of second type complexes<br />
in the region 2. This approach may use in studying the st<strong>ru</strong>cture of different HS fractions.<br />
REFERENCES<br />
1. Peña-Mendez, E.M., Havel, J., Pa<strong>to</strong>čka, J. 2005. J. Appl. Biomed. 3, 13-24.<br />
2. von Wand<strong>ru</strong>szka, R., Ragle, C., Engebretson, R. 1997. Talanta 44, 805-809.<br />
3. Übner, M., Kaljurand, M., Lopp, M. 2004. J. Chroma<strong>to</strong>gr. A 1057, 253-256.<br />
4. Übner, M., Kaljurand, M., Lopp, M. 2007. Colloids and Surfaces A: Physicochem. Eng.<br />
Aspects 302, 634-637.<br />
5. Übner, M., Treuman, M., Viitak, A., Lopp, M. 2004. J. Soils & Sediments 4, 24-29.<br />
6. Übner, M., Lepane, V., Lopp, M., Kaljurand, M. 2004. J. Chroma<strong>to</strong>gr. A 1045, 253-258.<br />
7. Gao, K., Pearce, J., Jones, J., Taylor, C. 1999. Environ. Geochem. Health 21, 13-26.<br />
136
Comparison of Mumijo (Shilajit) and Humic Acids (HA) Chemical<br />
Composition Using FTICR Mass-Spectrometry<br />
Gleb Vladimirov 1 , Alexey Kononikhin 1 , Erast Kunenkov 2 ,Irina Perminova 2 , Igor Popov 1 ,<br />
Andrey Garmash 2 , Eugene Nikolaev 1<br />
1 The Institute for Biochemical Physics Russian Academy of Science, Moscow, Russia,<br />
gggleb@mail.<strong>ru</strong><br />
2 Department of Chemistry, Lomonosov Moscow State University, 119992, Moscow, Russia<br />
Keywords: humic, mumijo, mumie, shilajit, FTICR mass-spectrometry<br />
1. INTRODUCTION<br />
Humic substances (HS) are complex mixtures formed during decay of plant and<br />
animal materials. HS are generically classified in<strong>to</strong> fulvic and humic acid fractions<br />
according <strong>to</strong> their solubility properties. The particular features of HS are polydispersity and<br />
extreme st<strong>ru</strong>ctural heterogeneity. The biological effects of humic substances can be<br />
different, depending on their chemical st<strong>ru</strong>cture and physicochemical properties. Chemical<br />
composition, st<strong>ru</strong>cture, and functional groups can vary greatly, depending on the origin<br />
and age of the humic substance and the conditions of the humification process (humidity,<br />
aeration, temperature, mineral microenvironment, etc.) (1). Mumijo has been used in<br />
traditional medicine for thousands of years, but there are only a few research devoted <strong>to</strong><br />
the investigation of humic substances from mumijo.<br />
2. MATERIALS AND METHODS<br />
We used well characterized samples of Suwannee River fulvic and humic acids of<br />
the International Humic Substances Society (IHSS). Kyrgyz mumijo from d<strong>ru</strong>gs<strong>to</strong>re were<br />
used for analysis without further purification. All experiments were performed on a<br />
commercial mass-spectrometer 7 Tesla Finnigan LTQ FT (Thermo Electron, Bremen,<br />
Germany) equipped with electrospray ion source (Finnigan Ion Max Source). Mumijo<br />
samples were dissolved in 1:4 water-ace<strong>to</strong>nitrile solution and analyzed using electrospray<br />
ionization both in positive and negative modes. For accurate molecular mass<br />
measurements FTICR mass spectra were acquired using selected ion moni<strong>to</strong>ring (SIM)<br />
scanning with 100 Da mass range.<br />
For interpretation of FTICR data Kendrick and van Krevelen diagrams were used (2).<br />
All FTICR mass spectra were also processed using FIRAN software for determination of<br />
s<strong>to</strong>ichometric formulas (2).<br />
137
3. RESULTS AND DISCUSSION<br />
2<br />
1.8<br />
1.6<br />
1.4<br />
1.2<br />
H/C<br />
1<br />
0.8<br />
0.6<br />
0.4<br />
SRFA<br />
0.2<br />
Kyrgyz Mumijo<br />
0<br />
0 0.1 0.2 0.3 0.4 0.5 0.6 0.7 0.8 0.9 1<br />
Figure 1 Van Kleveren diagram for kyrgyz mumijo and Suwannee River fulvic acid<br />
(for comparison).<br />
Comparison of kyrgyz mumijo with fulvic acid (FA) shown on figure 1. It was found<br />
both mumijo and fulvic acid contain a lot of ions tending <strong>to</strong> form groups in certain region of<br />
van Krevelen diagram. This may be interpreted like these substances were formed in<br />
s<strong>to</strong>chastic synthesis process and consists of molecules which are close one <strong>to</strong> each other<br />
in their functional composition and differ only by simple st<strong>ru</strong>ctural modifications (e.g.,<br />
carbon chain length, a number of double bonds, oxidation level). Kyrgyz mumijo seems <strong>to</strong><br />
differ from humic substances by higher H/C ratio and lower O/C ratio.<br />
4. CONCLUSIONS<br />
Comparison of mumijo composition determined by mass spectrometry with<br />
composition of humic substances gives advance in understanding of mumijo origin and its<br />
relation with humic substances. Both of these substances seems <strong>to</strong> be formed from<br />
organic remains in slightly different conditions, so, processes which take place during<br />
mumijo formation may be very similar <strong>to</strong> processes of HS formation.<br />
REFERENCES<br />
1. Schepetkin I., Khlebnikov A., Shin Young Ah, Sang Woo, Choon-Soo Jeong, O. Klubachuk,<br />
Byoung Kwon 2003 J. Agric. Food Chem., 51 (18), 5245 -5254.<br />
2. Kunenkov, E.V., Kononikhin, A.S., Perminova, I.V., Garmash, A.V., Nikolaev, E.N., Popov, I.A.<br />
2006. Abstracts of the First Int. Symposium on Ultrahigh Resolution Mass Spectrometry for the<br />
<strong>Molecular</strong> level Analysis of Complex (BioGeo)Systems, 6-7 Nov. 2006, GSF,<br />
Oberschleissheim, Germany.<br />
O/C<br />
138
Solid Phase Micro Extraction (SPME): A Powerful Tool for Complex<br />
Natural Organic Matter Investigation<br />
Serge Walter, Stephanie Freitag, Serge Neunlist, Ahmed Hadj-Mebarek, Zelimir Gabelica<br />
Labora<strong>to</strong>ire Propre Intégré, Ecole Nationale Supérieure de Chimie de Mulhouse, 3 Rue Alfred<br />
Werner, F-68093 MULHOUSE Cedex, France, serge.walter@uha.fr<br />
Keywords: SPME, chemical activity, biological availability<br />
1. INTRODUCTION<br />
Humic acid is a generic term for extremely numerous chemical species of complex<br />
organic compounds resulting from natural decomposition processes of organic matter.<br />
They are present in soils and natural waters and play an essential role in the matter<br />
transfer mechanisms between living organisms and their terrestrial environment. As a<br />
consequence of the complexity of the naturally occurring fulvic acid, humic acid and humin<br />
mixtures, individual qualitative and quantitative determination of all occurring species<br />
generally does not provide any relevant information about the actual properties with regard<br />
<strong>to</strong> their capability of s<strong>to</strong>ring or chelating either useful of harmful species. It seems much<br />
more important <strong>to</strong> get a good description of the overall properties of the actual mixture of<br />
humic acids as occurring in each case. As a consequence of the wide range of molecular<br />
weights, increasing from fulvic acids over humic acids <strong>to</strong> humins by a fac<strong>to</strong>r higher than<br />
10 3 , the variations of the proportions of these constituents in each sample will induce very<br />
different physico-chemical behaviours with regard <strong>to</strong> their interaction with living organisms.<br />
Solid Phase Micro Extraction is a technique capable of giving much information about<br />
the actual state of the species present in complex natural media. It is based on the<br />
preferential adsorption of some species on a well-chosen specific substrate. The substrate<br />
is generally a small surface coated fibre. The surface affinity of the fibre for various<br />
chemicals depends on the surface coating. Ion exchangers are more selective for mineral<br />
species while grafted surface functions render the fibre organic matter specific.<br />
Humic acids can transfer both organic matter and mineral elements <strong>to</strong> living species.<br />
Although chelating mineral elements is an interesting property of humic acids, this<br />
contribution will more focus on organic matter behaviour, although this latter will have<br />
important consequences on the behaviour of mineral species. The aim was <strong>to</strong> characterize<br />
the physico-chemical interaction of dissolved species in complex aqueous media at a solid<br />
interface, in order <strong>to</strong> enhance the understanding of the way living organisms can extract<br />
matter from natural humic substrates. The aim was not <strong>to</strong> characterize the individual<br />
139
products, but <strong>to</strong> pay attention <strong>to</strong> their relative behaviour, that is <strong>to</strong> analyse how the<br />
presence of some species can modify the behaviour of others. In order <strong>to</strong> overcome the<br />
complexity of natural humic acids, we used as models some well characterised biomarkers<br />
such as squalene, selected for their easy identification and their high stability in natural<br />
environment.<br />
2. MATERIALS AND METHODS<br />
The study was carried out by means of an SPME extraction and injection device as<br />
designed by VARIAN, coupled <strong>to</strong> capillary gas chroma<strong>to</strong>graphy fitted with a mass<br />
spectrometer. The complete experimental device as modified in order <strong>to</strong> fit with our<br />
experimental requirements has been thoroughly described in (1), with special attention <strong>to</strong><br />
the thermal desorption process in the injection head of the chroma<strong>to</strong>graph.<br />
The principle of the technique is the following: an adsorption fibre (about 1 cm long<br />
and 1 mm in diameter) is exposed <strong>to</strong> the sample solution for variable periods of time.<br />
The dissolved species present in the analyte will diffuse <strong>to</strong>wards the fibre surface<br />
resulting in adsorption processes. The adsorbed amount of each species on the fibre<br />
surface at the end of the exposure time depends on three main parameters:<br />
– the diffusion rates of the analytes from the solution <strong>to</strong>wards the fibre surface<br />
– the thermodynamic stability of the adsorbates on the fibre surface<br />
– the exposure time of the fibre surface <strong>to</strong> the analyte.<br />
These processes are the same as those occurring in natural environment between<br />
living organisms and the aqueous environment <strong>to</strong> which they are exposed in humid soils or<br />
in natural waters.<br />
The fibre is then transferred <strong>to</strong> the chroma<strong>to</strong>graph injection head, where the<br />
adsorbed species are thermally desorbed, separated by the column and characterizer by<br />
mass spectrometry.<br />
In this work, we just will depict some particular aspects of the chemical physics<br />
describing the organic species in natural environment which must be taken in<strong>to</strong> account in<br />
order <strong>to</strong> understand properly why slight changes in the composition of a fertilizer can affect<br />
on a huge manner its biological effects.<br />
Separation of the adsorbed species has been carried out by thermal desorption of<br />
the analytes, followed by GPC separation and MS characterization. In this work, squalene,<br />
a stable naturally occurring biomarker, has been used as a test molecule, and has been<br />
quantitatively introduced <strong>to</strong> water samples after being dissolved in ace<strong>to</strong>ne.<br />
140
3. RESULTS AND DISCUSSION<br />
Our first study concerns squalene, which is a hydrophobic lipidic species. In waters<br />
without other organic content, it is extremely strongly adsorbed on the SPME fibre surface.<br />
The adsorbed amount depends on the fibre exposure time, on the sample size and on the<br />
initial sample concentration. This can be related <strong>to</strong> the hydrophobic character of the test<br />
molecule, strongly rejected by pure waters such as spring waters. Thus, such hydrophobic<br />
molecules will undergo exogenous nucleation and droplet growth on interfacial surfaces.<br />
At very low concentrations, (typically below one ppm) nucleation cannot occur in<br />
homogeneous solutions as a consequence of the kinetic limiting fac<strong>to</strong>r. Since in natural<br />
environment (especially in mountain lake waters), large volumes of water can be far from<br />
any solid surface, some hydrophobic species can be present as metastable<br />
supersaturated aqueous solutions (2) due <strong>to</strong> supersaturation at low concentration levels.<br />
They will adsorb strongly but with low kinetic rates on any solid surface such as, for<br />
instance, living cell membranes. This phenomenon is clearly shown by the huge<br />
adsorption peak observed on figure 1 for water containing 1 ppm squalene.<br />
Figure 1. Influence of the presence of ace<strong>to</strong>ne in water on the adsorbed amount<br />
of squalene.<br />
The same water <strong>to</strong> which 1000 parts per million (0,1%) by weight ace<strong>to</strong>ne have been<br />
added results in an extremely weak adsorption amount for squalene on the fibre, showing<br />
clearly the lowering of the chemical potential of the squalene in water, due <strong>to</strong> the presence<br />
of a ke<strong>to</strong>ne function on an aliphatic propane substrate (amphiphilic character of ace<strong>to</strong>ne).<br />
Such an interaction is very similar <strong>to</strong> those resulting from the polar functions of humic<br />
acids on hydrocarbon-like molecular skele<strong>to</strong>ns. It clearly shows by which means humic<br />
acids can protect living organisms from cell membrane hydrophobic adsorptive coating.<br />
Thus, they enhance the cell membrane exchange capability with its aqueous environment.<br />
Further, by the variety of chemical sites (hydrophobic, hydrophilic and even polar ionic<br />
sites) humic acid molecules can provide, nearly all minor species present in humic<br />
aqueous solutions will be fixed on a reversible manner by the humic substrate. Only a<br />
141
small amount of each type of molecule will remain free in the aqueous phase. Due <strong>to</strong> the<br />
thermodynamic equilibrium involving the free species and their humic complex, the former<br />
will not predominate so as <strong>to</strong> completely block the exchange possibilities with cell<br />
membranes. Figure 2 shows (for simplicity reasons) just part of the chroma<strong>to</strong>gram of the<br />
adsorbed species of a shallow natural lake water containing humic acid, for various<br />
exposure times : the two left side lines correspond <strong>to</strong> kinetic species, with high diffusion<br />
rates but weak adsorption equilibrium constant. The three middle lines, continuously<br />
increasing with time, correspond <strong>to</strong> low concentration species, with low diffusion rates but<br />
high adsorption constants. The right hand line corresponds <strong>to</strong> an intermediate species, the<br />
surface concentration of which is nearly time independent.<br />
Figure 2. Compared adsorption amounts of organic components<br />
as a function of exposure time.<br />
4. CONCLUSIONS<br />
The SPME analysis shows how humic acids can enhance natural equilibria between<br />
the numerous species occurring in natural environment, preventing some of them <strong>to</strong><br />
become predominant during their interaction with living cells. The interactions ranging over<br />
an extremely wide range of properties due <strong>to</strong> the variability of functions that humic acids<br />
can provide (aliphatic, aromatic, alcoholic, ke<strong>to</strong>nic, acidic…), most of the existing species<br />
can be s<strong>to</strong>red by them under a form exhibiting medium range chemical potentials. In other<br />
words, humic acids behave as a s<strong>to</strong>rage tank that maintain constant the low concentration<br />
level of all species the living organisms need. They thereby prevent the cell surfaces from<br />
complete coating by a predominant species.<br />
REFERENCES<br />
1. Helle S., Neunlist S., Llopiz P., Faust A.C., Walter S., J. Therm. Anal. Calor, 56, 681-690,<br />
(1999)<br />
2. Helle S., in : Etude de la biodiversité par le biais des biomarqueurs organiques, Thesis, 1999,<br />
UHA, 2 Rue des frères Lumière F-68093 MULHOUSE Cedex.<br />
142
Section II<br />
Natural organic matter and humic substances as markers of climate<br />
change and anthropogenic repercussions
Evolution of Soil Humic Substances<br />
Serafim Chukov<br />
The St.-Petersburg State University, 199034 St.-Petersburg, Russia, S_Chukov@mail.<strong>ru</strong><br />
Keywords: humic substances, evolution, 13 C NMR, anthropogenically disturbed soils<br />
1. INTRODUCTION<br />
Humic substances (HS) is an absolutely special class of natural compounds which,<br />
as V. I. Vernadsky has <strong>to</strong>ld, are formed both under the influence of abiotic fac<strong>to</strong>rs and<br />
processes, and with direct participation of living organisms.<br />
HS are obliga<strong>to</strong>ry participants of not only terrestrial and water ecosystems in small<br />
biological circle, but also and in the big geological circle at a level biosphere and<br />
geosphere as a single whole. Although quantitatively they compose a little more than half<br />
of soil organic matter content in soils and ground waters, their role in functioning of<br />
containing them ecosystems immeasurably exceeds their quantitative participation.<br />
HS are the unique natural accumula<strong>to</strong>r of the biochemical energy created by green<br />
plants during the uptake the of Sun energy due <strong>to</strong> pho<strong>to</strong>synthesis. They are not only an<br />
universal depot of carbon and energy, but possess also a big biological potential that<br />
makes them an analogue of АТP for biosphere. HS cover a contact surface of soil<br />
minerals with the environment and thus act as a chemically active film which defines the<br />
character of interphase interactions in <strong>to</strong>p the most chemically active horizons of a soil<br />
profile. Actually HS are the original biochemical media<strong>to</strong>rs with a help of which a contact of<br />
an alive and inert material, bio- and lithosphere is realized in a soil profile. In this<br />
connection the problem of estimation of evolutionary trends of HS is important not only for<br />
soil science, but also for a lot of related subjects: biology, geology, etc.<br />
HS are presented in biosphere not only in concentrated state (soil humic horizons,<br />
peat, etc.) but also in an dissipated state (the bot<strong>to</strong>m soil horizons, surface and ground<br />
waters, etc.).<br />
For an adequate estimation of HS evolution an improvement of methodological<br />
approaches <strong>to</strong> their studying is necessary. Unfortunately, many traditional methodical<br />
approaches which have been developed in soil science connected with the extraction<br />
methods do not quite correspond <strong>to</strong> a modern level of methodology of the biochemical<br />
researches, one of which important bases is using of not destroying methods. They allow<br />
<strong>to</strong> study either completely native forms of substances in points of their localization, or <strong>to</strong><br />
investigate minimally altered extracted forms.<br />
145
Many methods of soil chemistry (such as, for example, the analysis of humic<br />
fractions) in many respects have depleted their opportunities (2, 3), whether a lot of widely<br />
used physical and chemical methods of HS st<strong>ru</strong>ctural investigations, appeared <strong>to</strong> be either<br />
difficult <strong>to</strong> use, or indirect and difficultly interpreted. Therefore in studying of HS<br />
transformation researchers often face the hardly comparable, and often also contradic<strong>to</strong>ry<br />
data.<br />
Thus, the new level of methodical maintenance of soil HS studying should be<br />
connected, firstly, with the use of direct methods of studying of HS molecular st<strong>ru</strong>cture and<br />
functional properties, and secondly, with studying of HS in native state directly in a soil<br />
sample at various levels of their st<strong>ru</strong>ctural organization – from soil horizon up <strong>to</strong> humic<br />
acids macromolecules.<br />
2. MATERIALS AND METHODS<br />
We carried out researches of soils HS st<strong>ru</strong>cturally functional parameters in soils of<br />
natural climatic belts from taiga up <strong>to</strong> a forest-steppe and steppe. Investigations have been<br />
compiled both in natural, and antropogenically altered soils - arable and buried. The data<br />
about HS molecular st<strong>ru</strong>cture obtained by 13С-NMR and ESR) and the results of studying<br />
the important functional parameters of HS (1, 3), allow <strong>to</strong> formulate the basic stages of<br />
their evolution in soils.<br />
3. RESULTS AND DISCUSSION<br />
The first stage is the formation of an original matrix which consists from rather lowmolecular<br />
organic ligands, occupying the strongest complexing positions on a surface of a<br />
mineral particles. These fractions are present not only in a soil profile, but frequently also<br />
in <strong>to</strong>p subsoil layers of parent materials, getting there with soil solutions. Very small on<br />
weight from 0,05 up <strong>to</strong> 0,3% C (from soil weight ) these compounds are rather inert.<br />
However the following strengthening and completion of high-molecular HS during humus<br />
formation take place namely on this matrix.<br />
The second stage is the formation of soil HS system. The basic backbone of their<br />
macromolecules is rather closely connected with soil mineral part, both through the matrix<br />
mentioned above, and due <strong>to</strong> new organic-mineral bonds formed during humus formation<br />
and distribution of humic film on a surface of mineral particles. The peripheral part of these<br />
biochemical active macromolecules possesses a lot of free radicals and high physiological<br />
activity.<br />
146
It is exposed <strong>to</strong> constant biotical attack and stays in dynamic balance with prehumic<br />
compounds of soil solution through the mechanism of constant fragmentary updating.<br />
There is a loss of the certain part of the open peripheral chains and heteroa<strong>to</strong>mic<br />
fragments of HS, and the tendency <strong>to</strong> increase in HS molecular weight is observed.<br />
The further development of soil HS system depends in a strong degree on volume<br />
and character fresh organic residues obtained. If the hydrothermal conditions of<br />
humification and the quantity of these residues is enough for humic-accumulative process,<br />
then a gradual escalating of spatial "skele<strong>to</strong>n" of humic acids macromolecules occur, that<br />
leads <strong>to</strong> increase in thikness of humic coating (“raincoat”) on a surface of mineral particles.<br />
The third stage of HS evolution is connected with processes of the further<br />
transformation and humification the frame st<strong>ru</strong>cture of "raincoat" in a direction of selection<br />
of biothermodynamically steady products. These processes are especially accelerated in<br />
conditions of sharp deficiency of fresh residues and lead <strong>to</strong> strong polycondensation of<br />
macromolecules, formation of polyaromatic systems, growth of interface <strong>to</strong> simultaneous<br />
increase in quantity free electrons. Formation and relative accumulation of such<br />
polycondensed st<strong>ru</strong>ctures of coal type was observed by us at studying spectra 13 С-NMR<br />
humic acids in arable and buried soils (3). For st<strong>ru</strong>ctures of such type appreciable<br />
decrease in biochemical and physiological activity is tipical.<br />
It is possible <strong>to</strong> draw a conclusion, that at this evolutionary stage properties of HS are<br />
determined not so much by functional groups, but the general features of redistribution of<br />
electronic density in molecular st<strong>ru</strong>cture of HS.<br />
4. CONCLUSIONS<br />
On the basis of the analysis of processes of evolution and definition of a level of HS<br />
biothermodynamic stability it is possible <strong>to</strong> create correct forecasts of their behavior during<br />
the change of biohydrothermal conditions of humification which can be result of change of<br />
land use or global climate change is the latter is especially important, as the contribution of<br />
a soil HS mineralization in CO 2 emission in atmosphere is great enough <strong>to</strong> influence the<br />
fate of climate of our planet.<br />
147
5. ACKNOWLEDGMENTS<br />
RFBR grant № 07-04-01459<br />
REFERENCES<br />
1. Chukov S.N. St<strong>ru</strong>ctural and functional parameters of organic matter in antropogenic disturbed<br />
soils. St. Petersburg State Univ. 2001. 216 P.<br />
2. Orlov D.S., Bi<strong>ru</strong>kova O.N., Suchanova N.I. Soil organic matter of Russian Federation. M.<br />
Nauka. 1996. 254 p.<br />
3. Orlov D.S., Chukov S.N. Humic acid: Function and components In Trans. IV Met. Of DSSU.<br />
Novosibirsk. 2004. V. 1. P 323-324.<br />
148
<strong>Humus</strong> and the Birth of Pedology : Müller, Dokuchaev and Successors<br />
Christian Feller 1 , Fernando Ortega Sastriques 2 , Yona Chen 3<br />
1 Institut de Recherche pour le Développement (IRD), UR 179 SeqBio, ENSAM/SupAgro, 2 Place<br />
Viala, 34060 Montpellier cedex 1, France, christian.feller@ird.fr<br />
2 Universidad Agraria de La Habana, San José de las Lajas, La Habana, Cuba<br />
3 Dept. of Soil and Water Sciences, Faculty of Agricultural, Food and Environmental Quality<br />
Sciences, The Hebrew University of Je<strong>ru</strong>salem, P.O. Box 12, Rehovot 76100, Israel<br />
Keywords: humus his<strong>to</strong>ry, pedology, Müller, Dokuchaev<br />
AN OVERVIEW<br />
The origin of Pedology is generally linked with Dokuchaev (1) and with his famous<br />
work on Tchernozem published in 1883. Nevertheless, the book of the Danish forester<br />
Müller, “Natural forms of humus” (2) based on two articles published in 1879 and 1884 is<br />
not widely known though translated in<strong>to</strong> German in 1887 and in<strong>to</strong> French in 1889 (3) . This<br />
book demonstrates that, as early as 1879, Müller adopted a sincere pedological approach<br />
<strong>to</strong> soil formation and soil-plant relationships. Field observations and Müller’s thinking<br />
essentially focused on soils under natural vegetation in Denmark. His book deals with<br />
important processes such as b<strong>ru</strong>nification, leaching and podzolization, using a dynamic<br />
approach (transition from a brown soil <strong>to</strong> a podzol – Fig. 14 and dating using<br />
archaeological remains). All his reasoning was based on the nature of humus, with a<br />
special focus on morphology, biological activity (fauna and fungi), and biochemistry. This<br />
book displays numerous soil profiles, with much information being synthesized in Table III,<br />
which is extraordinarily informative and comprehensive. Although published in the 1880’s,<br />
the book can be read <strong>to</strong>day as an almost modern text. We therefore suggest that Müller<br />
has been the most important scientist formulating early <strong>to</strong> modern Pedology. On the other<br />
hand the Chernozem’s classification and distribution proposed by Dokuchaev in his<br />
famous thesis is based on humus content with the famous isohumus belt. A conflicting<br />
debate about the role of climate in comparison with other pedogenesis fac<strong>to</strong>rs on the<br />
accumulation of humus in Russian soils occurred between Dokuchaev and Kostychev<br />
early in 1889 (4) and 1890 (5). The theories of Kostychev were reported in French by Feltz<br />
in 1887. But, finally, from the time of birth of pedology, humus was in the centre of<br />
concepts of pedogenesis and soil classifications. However, the humus quality is rarely<br />
taken in<strong>to</strong> consideration in the Dokuchaev’s thesis and generally in the Russian school<br />
before the First World War and the Soviet Revolution with the exception of some works<br />
149
etween 1893 and 1900 i.e. Kozlovskii, Lesnievskii and Nale<strong>to</strong>v. These three authors<br />
enhanced the great differences between Chernoziemic and Podzolic humus and<br />
established negative correlations between humus content and humus solubility.<br />
The Dokuchaev pupils, in the early 1900's, such as Sibirtsev (6), and the Russian<br />
school of Pedology will be later largely involved in <strong>Humus</strong> research. One of the earliest<br />
and his<strong>to</strong>rically important is Tyurin. In its famous 1937’s book (7) Tyurin’s tried <strong>to</strong> collect all<br />
the available present world knowledge on soil organic matter (SOM) with citations of more<br />
than 210 papers in Russian and 500 in other languages including Müller.<br />
More recently one have <strong>to</strong> pay tribute <strong>to</strong>o <strong>to</strong> Kononova (8) and Orlov (9, 10) for their<br />
important works on SOM and SOM his<strong>to</strong>ry.<br />
REFERENCES<br />
1. Dokuchaev V.V., 1883. Russian Chernozem. In Selected Works of V.V. Dokuchaev, vol. 1, pp.<br />
14-419. Moscow, 1948. Israel Program for Scientific Translations Ltd. (for USDA-NSF), S.<br />
Monson, Je<strong>ru</strong>salem, 1967. (Tanslated from Russian in<strong>to</strong> English by N. Kander).<br />
2. Feller C., Blanchart E., Jabiol B., Greve M.H., 2005. Quand l’humus est à l’origine de la<br />
pédologie. 1. Les travaux du forestier danois P.E. Müller (1840-1926). In Feller C., Legros D.<br />
(eds), N° Spécial « His<strong>to</strong>ires d'Hommes et de Concepts en Science du Sol », Étude et Gestion<br />
des Sols, 12 : pp. 101-122.<br />
3. Müller P.E., 1889 - Recherches sur les formes naturelles de l'humus et leur influence sur la<br />
végétation et le sol. Berger-Levrault et Cie ,Paris-Nancy, 351 p.<br />
4. Kostychev 1886. Soils of the chernozem region of Russia. Part I. The formation of Chernozem.<br />
(Pochvy chernozemnoi, oblasti Rossii. Ch I. Obrazovanie chernozema). Sel’khozgiz (from<br />
Kononova, 1966).<br />
5. Kostychev 1889. The formation and properties of humus. T<strong>ru</strong>dy S. Pbg Obshch. Estetvoispyt.,<br />
20, Otd. Bot. (from Kononova, 1966).<br />
6. Sibirtsev N.M., 1900-1901. Soil Science. 2. Teaching on soil as a mass. (Uchenie o pochke<br />
kak o masse). St. Petersburg. (from Kononova, 1966).<br />
7. Tyurin I.V., 1937. Soil organic matter (Organicheskoe veshchestvo pochv). Sel’khozgis (from<br />
Kononova, 1966).<br />
8. Kononova M.M., 1966. Soil organic matter, its nature, its role in soil formation and in soil<br />
fertility. 2nd English Edition. Pergamon. Oxford, London…, 544 p.<br />
9. Orlov D.S., 1985. <strong>Humus</strong> acids of soils. Russian Translations Series 35. A.A. Balkema,<br />
Rotterdam, 78 p.<br />
10. Orlov D.S., 1995. Humic substances of soils and general theory of humification. Swets &<br />
Zeitlinger publ., 266 p.<br />
150
Freshwaters: Do ‘Humics’ Always Represent 50% of NOM?<br />
Montserrat Filella 1,2 , François Quentel 3 , Vincent Chanudet 2,4<br />
1 SCHEMA, Rue Principale 92, L-6990 Rameldange, Luxembourg, filella@schema.lu<br />
2 Department of Inorganic, Analytical and Applied Chemistry, University of Geneva, Quai Ernest-<br />
Ansermet 30, CH-1211 Geneva 4, Switzerland<br />
3 Labora<strong>to</strong>ire de Chimie Analytique, UMR-CNRS 6521, Université de Bretagne Occidentale, 6<br />
avenue V. Le Gorgeu, CS 93837, F-29238 Brest Cedex 3, France<br />
4 Institut F.A. Forel, University of Geneva, Route de Suisse 10, CH-1290 Versoix, Switzerland<br />
Keywords: freshwaters, fulvic, humic, lakes, quantification, rivers<br />
1. INTRODUCTION<br />
Many articles devoted <strong>to</strong> the study of different aspects of natural organic matter<br />
(NOM) begin by matter-of-factly stating that “humic substances are the largest fraction of<br />
natural organic matter in water” or that they “represent 50% of natural organic matter”. In<br />
practice, however, the refrac<strong>to</strong>ry fraction of organic matter (ROM), usually referred <strong>to</strong> as<br />
humic and fulvic acids, has rarely been quantified since the necessary analytical methods<br />
are lacking. Spectropho<strong>to</strong>metry and fluorimetry have often been used for this purpose but<br />
it should not be forgotten that these methods measure only a fraction of ROM and that<br />
they provide results that simultaneously reflect the type of ROM and its concentration. The<br />
common practice of normalising the signals by the concentration of dissolved organic<br />
carbon (DOC) gives an indication of the type of ROM but does not measure its<br />
concentration. A few attempts have been made at quantifying ROM after isolation with the<br />
resins traditionally used <strong>to</strong> define humic and fulvic fractions but the procedure is very long<br />
and cumbersome and not free of problems (because the resin method was developed as a<br />
preparative procedure and as such does not necessarily ensure a quantitative recovery).<br />
Recently, two new methods (1, 2) have been claimed <strong>to</strong> be faster. However, these can<br />
only be applied <strong>to</strong> waters containing high concentrations of ROM (more than 5 mg.L -1 in<br />
(1) and 50 mg.L -1 in (2)) which, in practice, means they are not applicable <strong>to</strong> most surface<br />
waters. In this paper, the results have been obtained by applying a fast, simple<br />
electroanalytical procedure based on cathodic stripping preceded by the adsorptive<br />
collection of Mo(VI)-humic or fulvic acids complexes (3) <strong>to</strong> a myriad of freshwater systems.<br />
These show that the method is particularly suited <strong>to</strong> systems containing low amounts of<br />
carbon. Application of this method may prove extremely useful across a broad range of<br />
fields, including geochemical modelling, climate change-related studies, etc.<br />
151
2. MATERIALS AND METHODS<br />
Lake water samples were collected using a membrane pump, with the end of the<br />
tube directly attached <strong>to</strong> a CDD probe. River water samples were collected directly in<strong>to</strong><br />
bottles. Samples for organic carbon (OC) determination were collected in precombusted<br />
(3 h at 550°C) glass bottles. Samples for ROM analysis were collected in polyethylene<br />
bottles. All polyethylene bottles had been cleaned with nitric acid (10%) and 0.5 mol.L -1<br />
sodium hydroxide, and rinsed with Milli-Q water. Immediately after collection, all samples<br />
were filtered through precombusted (3 h at 550°C) 1.2 μm glass filters (Whatman GF/C<br />
filters) by vacuum filtration and acidified <strong>to</strong> pH 2 with HCl Suprapur.<br />
The electroanalytical procedure for ROM quantification is based on cathodic stripping<br />
preceded by adsorptive collection of Mo(VI)-humic or fulvic acids complexes (3). After the<br />
sample was pipetted in<strong>to</strong> the thermostated voltammetric cell, Mo(VI) was added <strong>to</strong> a final<br />
concentration of 10 ppb <strong>to</strong> ensure formation of the complex. Where necessary, the sample<br />
was diluted through the addition of 1x10 -2 mol.L -1 HCl. The solution was then degassed for<br />
10 minutes. The potential was set <strong>to</strong> –0.2 V while the solution was stirred. After stirring for<br />
the deposition time (usually 180 s) it was allowed <strong>to</strong> rest for 20 s. The scan was then<br />
initiated in the negative direction by using DPP or SWV. A standard addition method<br />
employing IHSS Suwannee River fulvic acid standard (1S101F) was used for calibration.<br />
DOC was determined using a high temperature combustion method employing a<br />
TOC 5000-A Shimadzu analyzer (Shimadzu Co. Ltd.). Milli-Q water was used as blank<br />
(0.00 mg.C.L -1 with a SD of less than 0.005). Calibration was performed with a<br />
1000 mg.C L -1 <strong>to</strong>tal DOC standard solution (CertiPUR, Merck). Standard solutions as well<br />
as blanks were acidified <strong>to</strong> pH 2 with HCl Suprapur.<br />
3. RESULTS AND CONCLUSIONS<br />
Table 1 shows ROM concentrations and the corresponding percentage of DOC<br />
determined in a range of freshwater bodies of contrasting trophic status at different<br />
seasons of the year. The results obtained show that there is a high variability in ROM<br />
concentrations in freshwaters, indicating that the widespread assumption that ‘humics’<br />
represent 50% of NOM may prove wrong in most surface waters.<br />
ACKNOWLEDGEMENTS<br />
We would like <strong>to</strong> thank Joseph Youssef and Dina Andriamahady for field and<br />
labora<strong>to</strong>ry assistance.<br />
152
Table 1. Concentration of ROM (expressed as mg C.L -1 ) and percentage of DOC (both<br />
after filtration at 1.2 μm) for different freshwater systems<br />
System a Depth Season Type of system ROM % DOC Ref.<br />
Lake Geneva surface early spring mesotrophic lake 0.26 34 (4)<br />
epi b spring 0.27 33<br />
hypo b spring 0.24 33<br />
epi b late spring 0.27 28<br />
hypo b late spring 0.25 35<br />
surface summer 0.26 14<br />
Lake Bret surface summer eutrophic lake 1.12 27 (3)<br />
Lake G<strong>ru</strong>ère surface summer peat lake 12.9 c 100 (3)<br />
Lake Divonne surface spring eutrophic lake 0.69 17 unp.<br />
Lake Brienz 1 m June ultra-oligotrophic lake 0.23 38 (5)<br />
18 m 0.42 70<br />
1 m September 0.10 29<br />
100 m 0.16 27<br />
1 m November 0.15 43<br />
100 m 0.13 23<br />
1 m Feb<strong>ru</strong>ary 0.14 41<br />
100 m 0.12 35<br />
1 m March 0.12 18<br />
20 m 0.09 11<br />
1 m April 0.18 26<br />
20 m 0.14 28<br />
1 m July 0.11 26<br />
15 m 0.15 32<br />
25 m 0.11 21<br />
100 m 0.11 15<br />
1 m 0.16 31<br />
5 m 0.15 36<br />
26 m 0.21 46<br />
100 m 0.15 28<br />
Lake Grimsel<br />
River Allondon<br />
(Echenevex)<br />
River Allondon<br />
(Dardagny)<br />
River Allondon (La<br />
Plaine<br />
Nant d’Asy<br />
(Corsier)<br />
Nant d’Avril<br />
(Satigny)<br />
hydroelectrical<br />
plant outlet<br />
(Innertkirchen)<br />
1 m<br />
10 April<br />
13 April<br />
16 April<br />
19 April<br />
10 April<br />
13 April<br />
16 April<br />
19 April<br />
10 April<br />
13 April<br />
16 April<br />
19 April<br />
alpine, ultra-oligotrophic<br />
reservoir<br />
karstic spring<br />
weakly anthropized<br />
karstic river<br />
0.06 31 unp.<br />
0.72<br />
0.77<br />
0.79<br />
0.86<br />
0.79<br />
0.73<br />
1.02<br />
0.73<br />
0.60<br />
0.58<br />
0.86<br />
1.05<br />
40<br />
54<br />
43<br />
52<br />
43<br />
42<br />
45<br />
34<br />
31<br />
30<br />
45<br />
50<br />
unp.<br />
unp.<br />
unp.<br />
spring urban stream 2.04 35 unp.<br />
spring semi-urban stream 0.15 18 (3)<br />
March<br />
April<br />
July<br />
water from Lake Grimsel<br />
0.26<br />
0.36<br />
0.05<br />
55<br />
68<br />
30<br />
Oc<strong>to</strong>ber 0.76 85<br />
(6)<br />
153
System a Depth Season Type of system ROM % DOC Ref.<br />
River Aare<br />
(Innertkirchen)<br />
River Aare (Brienz)<br />
River Lütschine<br />
(Gsteig)<br />
March<br />
April<br />
alpine, modified glacial<br />
river<br />
0.58<br />
0.40<br />
48<br />
46<br />
July 0.13 49<br />
Oc<strong>to</strong>ber 1.01 105<br />
June alpine, modified glacial 0.49 52<br />
September<br />
river<br />
0.11 48<br />
November 0.10 33<br />
Feb<strong>ru</strong>ary 0.08 25<br />
March 0.96 88<br />
April 0.64 70<br />
July 0.07 32<br />
Oc<strong>to</strong>ber 0.74 88<br />
June alpine, unmodified glacial 0.35 66<br />
September<br />
river<br />
0.11 37<br />
November 0.13 20<br />
Feb<strong>ru</strong>ary 0.19 25<br />
March 1.43 79<br />
April 0.62 62<br />
July 0.05 16<br />
Oc<strong>to</strong>ber 0.44 51<br />
a All systems are located in Switzerland except Lake Divonne and a part of River Allondon, both in<br />
France; b epi: epilimnion, hypo: hypolimnion; c calibration with IHSS peat humic acid (1S103H).<br />
REFERENCES<br />
1. Wu, F.C., Evans, R.D., Dillon, P.J., Cai, Y.R. 2007. Applied Geochem. 22, 1598-1605.<br />
2. Van Zomeren, A., Comans, R.N.J. 2007. Environ. Sci. Technol. 41, 6755-6761.<br />
3. Chanudet, V., Filella, M., Quentel, F. 2006. Anal. Chim. Acta 569, 244-249.<br />
4. Chanudet, V., Loizeau, J.-L., D<strong>ru</strong>art, J.-C., Dominik, J. 2007. Submitted.<br />
5. Chanudet, V., Filella, M. 2007. Org. Geochem. 38, 1146-1160.<br />
6. Filella, M., Chanudet, V. 2006. Verände<strong>ru</strong>ngen im Ökosystem Brienzersee, Phase 3.<br />
Teilprojekt G: Verminderte Beseitigung Mineralischer Partikel, University of Geneva, Geneva,<br />
Switzerland, 66 pp.<br />
(6)<br />
(3)<br />
(3)<br />
154
Atmospheric HULIS: How Humic-Like Are They?<br />
Ellen R. Graber 1 , Yinon Rudich 2<br />
1 Institute of Soil, Water and Environmental Sciences, The Volcani Center, Agricultural Research<br />
Organization, Bet Dagan 50250 Israel, ergraber@agri.gov.il<br />
2 Department of Environmental Sciences and Energy Research, The Weizmann Institute of<br />
Science, Rehovot 76100 Israel<br />
Keywords: HULIS, atmospheric aerosol, polyacidic, fulvic<br />
1. INTRODUCTION<br />
The last decade has witnessed a large increase in studies reporting the prevalence<br />
of macromolecular compounds, termed HUmic-LIke Substances (HULIS) in aerosol, fog<br />
and cloud water. Interest is fueled by the realization that HULIS may affect important<br />
aerosol properties such as their ability <strong>to</strong> nucleate cloud droplets or their light absorption.<br />
The realization that HULIS compounds are most likely formed in aerosol particles<br />
exemplifies the fact that atmospheric reactions can result in formation of new constituents<br />
of higher molecular weight, and not just result in breakdown of parent organic compounds.<br />
HULIS have been so termed because of their apparent similarity <strong>to</strong> the ubiqui<strong>to</strong>us<br />
humic substances found in terrestrial and aquatic environments. The purpose of this talk is<br />
<strong>to</strong> introduce HULIS <strong>to</strong> the humic substances community and <strong>to</strong> review some of the salient<br />
properties of HULIS that make it so interesting <strong>to</strong> atmospheric scientists, including surface<br />
activity and hygroscopic properties. The material presented here is derived mainly from a<br />
recent comprehensive review paper; references can be found therein (1).<br />
2. DISCUSSION<br />
UV-VIS spectra of HULIS are featureless, with increasing absorptivity <strong>to</strong>wards shorter<br />
wavelengths. In this regard, spectra are similar <strong>to</strong> typical UV-VIS spectra of humic<br />
substances, although commonly, spectra of HULIS display relatively more absorbance in<br />
the shorter wavelength regions, and less in the longer wavelength regions as compared<br />
with terrestrial and aquatic humic substances. Excitation-emission fluorescence spectra for<br />
HULIS have peaks at shorter excitation and emission wavelengths than freshwater or<br />
terrestrial fulvic acids, suggesting a lower content of aromatic st<strong>ru</strong>ctures and condensed<br />
unsaturated bond systems, a higher aliphatic moiety content, and a lower molecular weight<br />
(MW). FTIR spectra of HULIS exhibit a broad band at 3400 cm -1 , a shoulder in the region<br />
of 3000-2850 cm -1 , a strong band near 1720 cm -1 , a weak band in the 1600-1660 cm -1<br />
155
egion, absorption at 1384 cm −1 , a band in the 1220 cm −1 region, and C-O stretching band<br />
at 1061 cm -1 . 1 H-NMR spectra HULIS display a pronounced aromatic region and relatively<br />
low abundance of non-exchangeable organic pro<strong>to</strong>ns. Based on the 1 H-NMR features, a<br />
model st<strong>ru</strong>cture consisting of an aromatic core bearing substituted aliphatic chains with –<br />
COOH, -CH 2 OH, -COCH 3 , or –CH 3 terminals groups was suggested for HULIS. Such a<br />
st<strong>ru</strong>cture is also consistent with electrospray ionization mass spectra and IR spectroscopy.<br />
13 C-NMR spectra for HULIS showed a broad range of un-substituted saturated aliphatic<br />
components, aliphatic carbons singly bound <strong>to</strong> one oxygen or nitrogen a<strong>to</strong>m, aliphatic<br />
carbons singly bound <strong>to</strong> two oxygen a<strong>to</strong>ms, and ester and carboxyl carbons. 13 C-NMR<br />
spectra for biomass burning HULIS and urban aerosol HULIS were both found <strong>to</strong> have a<br />
substantial aliphatic component, and <strong>to</strong> be quite different in relative carbon distribution<br />
from humic acid. Weight average MW (MW W ) of HULIS was estimated by liquid<br />
chroma<strong>to</strong>graphy and electrospray ionization (ESI) tandem quad<strong>ru</strong>pole mass spectrometry<br />
in negative ionization mode <strong>to</strong> range between about 200 <strong>to</strong> 300 Da. This can be compared<br />
<strong>to</strong> an estimated average MW W of 456 Da for Suwannee River fulvic acid via the same<br />
technique.<br />
Average elemental composition (m/m%) of HULIS from <strong>ru</strong>ral fine aerosol particles<br />
was reported <strong>to</strong> be 52% C, 6.2 % H, 2.5 % N, and 39 % O, giving an average organic<br />
matter mass <strong>to</strong> organic carbon ratio of 1.93, an average O/C molar ratio of 0.58, and an<br />
average H/C molar ratio of 1.42. While reported O/C molar ratios are similar <strong>to</strong> those for<br />
fulvic acids, the H/C molar ratios are substantially higher, for example, molar ratios for<br />
Suwannee River fulvic acid (O/C 0.60; H/C 0.99) and Nordic Lake fulvic acid (O/C 0.65;<br />
H/C 0.91). The elemental analysis of HULIS indicates a predominance of oxygenated<br />
functional groups and the presence of saturated systems in excess of that for aquatic fulvic<br />
acids. This corresponds <strong>to</strong> spectral results (UV-VIS, fluorescence, 13 C-NMR, 1 H-NMR) that<br />
indicate a relatively lower aromatic content for HULIS as compared with fulvic and humic<br />
acids. Based on elemental and spectroscopic results, it was concluded that HULIS<br />
consists of poly-functional compounds bearing poly-conjugated st<strong>ru</strong>ctural elements, and<br />
carrying polar groups such as carboxyl, hydroxyl and carbonyl.<br />
The surface activity of HULIS samples has been found <strong>to</strong> exceed that of humic acid<br />
and fulvic acid. For example, HULIS derived from biomass burning smoke aerosol<br />
particles, slightly aged smoke particles, and daytime urban aerosol particles lowered the<br />
surface tension of water more than did Suwannee River fulvic acid. Therefore, HULIS<br />
could enhance cloud droplet activation by depressing surface tension and lowering the<br />
critical supersaturation for activation, or alternatively, delay droplet activation due <strong>to</strong><br />
156
hindrance of water vapor diffusion through a surface organic film. It was also found that<br />
HULIS extracts from ambient aerosol particles are more hygroscopic than fulvic acid and<br />
size-fractionated fulvic acid, and that different HULIS samples exhibit varying hygroscopic<br />
properties depending on their origin and residence time in the atmosphere.<br />
Potential origins of HULIS in the atmosphere are diverse, including primary terrestrial<br />
and marine sources, biomass burning, and secondary organic aerosol formation<br />
(condensation, reaction, oligomerization, etc.). Different suggested mechanisms for HULIS<br />
generation during biomass burning include: (i) soil-derived humic matter lofted in<strong>to</strong> the air<br />
as a result of combustion; (ii) HULIS generation via chemical transformations during<br />
combustion and thermal breakdown of plant lignin and cellulose; and (iii) recombination<br />
and condensation reactions between volatile, low molecular weight combustion products.<br />
Most studies invoke various secondary formation pathways for HULIS, including<br />
evaporation, condensation, and aerosol-phase polymerization of polar, low molecular<br />
weight organic constituents. These ideas have been supported by labora<strong>to</strong>ry studies that<br />
have focused on elucidating pho<strong>to</strong>chemical and oxidative processes that could lead <strong>to</strong><br />
HULIS formation.<br />
Considering the particularly small molecular size attributed <strong>to</strong> HULIS as compared<br />
with fulvic acids and labora<strong>to</strong>ry-generated macromolecular species, can HULIS t<strong>ru</strong>ly be<br />
considered a macromolecular species? This question may be part of a larger issue<br />
currently debated in the humic substances literature involving a new model for humic<br />
substances st<strong>ru</strong>cture, whereby they are considered <strong>to</strong> consist of supramolecular<br />
associations rather than macromolecular polymers. If the suprast<strong>ru</strong>cture model for<br />
terrestrial humic substances is correct, the high mono-and dicarboxylic organic acid<br />
content as well as the inorganic acid content of atmospheric aerosols may actually prevent<br />
formation of larger humic suprast<strong>ru</strong>ctures, explaining the observed low molecular weights<br />
for HULIS. There are alternative explanations for the relatively small size of atmospheric<br />
HULIS. Bearing in mind the reactivity of humic substances in the face of UV radiation, O 3 ,<br />
and hydroxyl radicals, it can be anticipated that conditions in the atmosphere are such that<br />
relatively larger macromolecules, even if formed, cannot be long-lived. HULIS, then, may<br />
represent some non-equilibrium phase resulting from a quasi-steady state between<br />
formation and dest<strong>ru</strong>ction of larger species. Another alternative <strong>to</strong> the small size<br />
conund<strong>ru</strong>m is that HULIS consists mainly of a complex, unresolved mixture of relatively<br />
small molecules rather than a mixture of complex macromolecular entities. The apparent<br />
similarity of HULIS <strong>to</strong> humic substances would then be a fortui<strong>to</strong>us outcome of the difficulty<br />
in comparing spectra of unresolved mixtures of compounds. The evidence for such a claim<br />
157
may lie in the ultrafiltration behavior of HULIS, which has been found <strong>to</strong> pass in its entirety<br />
through ultrafiltration membranes of 500 and 1000 Da. The very different modes of<br />
formation and the duration of formation for HULIS as compared with humic<br />
terrestrial/aquatic humic substances may also account for the relatively small size of<br />
HULIS, as well as many of the other observed differences. Taking in<strong>to</strong> account that the<br />
major portion of HULIS is believed <strong>to</strong> be of secondary atmospheric origin driven by abiotic<br />
oxidizing reactions over a short time scale, it should not perhaps come as a surprise that<br />
HULIS is smaller and less aromatic than humic substances.<br />
3. CONCLUSIONS<br />
A class of organic molecules extracted from atmospheric aerosol particles and<br />
isolated from fog and cloud water has been termed HUmic-LIke Substances (HULIS) due<br />
<strong>to</strong> a certain resemblance <strong>to</strong> terrestrial and aquatic humic and fulvic acids. While sharing<br />
some important features such as polyacidic nature, there are significant dissimilarities<br />
between HULIS and fulvic acids, including greater surface activity, greater water sorption<br />
capacity, smaller molecular size, lower aromaticity, higher H/C molar ratios, and weaker<br />
acidic nature for HULIS. Recently, ultra high resolution mass spectral studies have<br />
identified fulvic acid and sulfated and nitrated fulvic acid analogues in atmospheric aerosol<br />
(2). Such sulfated and nitrated compounds have not been identified in soil or aquatic<br />
environments, supporting a secondary organic aerosol formation mechanism for HULIS.<br />
Thus, accumulating evidence suggests that atmospheric HULIS differ substantially<br />
from terrestrial and aquatic humic substances.<br />
REFERENCES<br />
1. Graber, E. R.; Rudich, Y. Atmospheric HULIS: How Humic-Like Are They? A Comprehensive<br />
and Critical Review. Atmos. Chem. Phys. 2006. 6, 729-753.<br />
2. Reemtsma, T.; These, A.; Venkatachari, P.; Xia, X. Y.; Hopke, P. K.; Springer, A.; Linscheid,<br />
M. Identification of fulvic acids and sulfated and nitrated analogues in atmospheric aerosol by<br />
electrospray ionization Fourier transform ion cyclotron resonance mass spectrometry. Anal.<br />
Chem. 2006. 78, 8299-8304.<br />
158
Short Time Humification and Mineralisation of Different Pyrogenic<br />
Materials under Controlled Labora<strong>to</strong>ry Conditions<br />
André Hilscher 1 , Christian Siewert 2 , Heike Knicker 1<br />
1 Lehrstuhl für Bodenkunde, TU München, 85350 Freising-Weihenstephan, Germany,<br />
hilscher@wzw.tum.de<br />
2 Institut für Landschaftsarchitektur, Forschungsanstalt für Gartenbau Weihenstephan, 85350<br />
Freising-Weihenstephan, Germany<br />
Keywords: black carbon, degradation of charcoal, burning degree, NMR spectroscopy<br />
1. INTRODUCTION<br />
Wildfires yield large amounts of CO 2 and NO x <strong>to</strong> the atmosphere whereas<br />
considerable amounts of severely or partly charred necromass are incorporated in<strong>to</strong> the<br />
soil. Due <strong>to</strong> the highly refrac<strong>to</strong>ry nature of such thermally-condensed products, they are<br />
assumed <strong>to</strong> play an important carbon (C) sink in the global C cycle. At first sight, this could<br />
be considered as a benefit from the viewpoint of mitigating the effects of greenhouse<br />
gases from the atmosphere. But assuming that biomass burning occurred at the same rate<br />
than nowadays since the last glacial maximum, black carbon and its transformation<br />
products should contribute with 25 <strong>to</strong> 125% <strong>to</strong> the humic material (1).<br />
The intention of the present study was <strong>to</strong> elucidate the impact of microbiology<br />
activities on the quality and quantity of pyrogenic substances in soils.<br />
2. MATERIALS AND METHODS<br />
We used rye grass (Lolium perenne) and pine wood (Pinus sylvestris) <strong>to</strong> produce the<br />
pyrogenic organic materials (PyOM). The both plant materials were charred under oxic<br />
conditions on a ceramic tray in a muffle furnace at 350°C. Two oxidation times of one (1M)<br />
and four minutes (4M) were applied <strong>to</strong> obtain materials with a different charring degree.<br />
The soil matrix for the incubation experiment was obtained from a fire-unaffected Bw<br />
horizon of a Cambisol under sp<strong>ru</strong>ce near Leuk, Can<strong>to</strong>n Valais, Switzerland. The water<br />
content of the soil incubate was adjusted <strong>to</strong> approximately 60% of the maximum water<br />
holding capacity and the samples were incubated for 48 d at 30°C under aerobic<br />
conditions in a Respicond-apparatus (Nordgren Innovations, Sweden).<br />
3. RESULTS AND DISCUSSION<br />
The grass-derived chars show the highest C mineralisation. During the 48 days of the<br />
incubation 3.2% of the OC of Gr1M was converted in<strong>to</strong> CO 2 ; most of this (> 1 %) occurred<br />
159
during the first 3 days. As indicated by Gr4M, more severe thermal alteration resulted in a<br />
decrease of the <strong>to</strong>tal C volatilization of approximately 22% <strong>to</strong> 2.5% of OC, but <strong>to</strong> a more<br />
efficient mineralisation during the first 1.5 days. Consequently, in spite of the higher<br />
aromaticity of Gr4M compared <strong>to</strong> Gr1M, the more severely charred sample contains a<br />
higher contribution of labile constituents that are microbiologically available C in particular<br />
the beginning of the incubation.<br />
Comparable <strong>to</strong> the rye grass chars, the pine chars show degreasing mineralisation<br />
with increasing burning degree, although the overall mineralisation is much lower. Only<br />
0.66% and 0.46% of the initial C in the charcoals P1M and P4M were mineralised. As for<br />
the rye chars, during the first 9 days, a higher microbiological activity resulting in higher<br />
mineralisation rates was evidenced for P4M. This confirms that charring yields in<br />
pyrogenic substances that are more or less directly available for microbial degradation and<br />
the amount of which increases with thermal intensity.<br />
One explanation for the decline of the <strong>to</strong>tal mineralisation in the more severely<br />
charred materials may be their higher aryl C content (Table 1). However, other parameters<br />
must also be involved since Gr1M and P1M have similar aryl 13 C intensities, but the<br />
effective char mineralisation differs strongly with 3.2% and 0.7%. Even the relatively high<br />
O-alky C content of P1M (38%), which is most tentatively attributed <strong>to</strong> remaining<br />
carbohydrate moieties cannot increase the degradation efficiency. Possibly this material is<br />
not available for the MO, due <strong>to</strong> its physical protection within charred domains and/or a low<br />
content of available N forms. Note that we added no mineral nutrient solution in order <strong>to</strong><br />
simulate natural conditions.<br />
The 13 C NMR spectroscopic analysis of Gr1M indicates a modification of the<br />
chemical composition of the char during the degradation experiment. At the end of the<br />
incubation we found a decrease from 27% <strong>to</strong> 22% in the alkyl-C region (Table 1). This<br />
decline corresponds <strong>to</strong> 5.6% of the bulk char C (Table 2). Gr4M exhibits a comparable<br />
consumption of alkyl C. Here its relative contribution <strong>to</strong> the <strong>to</strong>tal 13 C intensity decreases<br />
from 20 <strong>to</strong> 16%, which corresponds <strong>to</strong> 4.5% of bulk char C.<br />
Note that with the exception of P4M the aryl C content shows no major alteration<br />
caused by the degradation, but increasing contents of carboxyl/carbonyl C is evidenced for<br />
Gr1M, Gr4M and P4M, supporting that oxidation occurred.<br />
For P4M we find a decrease of the intensity in the chemical shift region between 140<br />
<strong>to</strong> 90 ppm) from 67 <strong>to</strong> 60%, but concomitantly the intensity in the O-aryl C region increases<br />
from 16 <strong>to</strong> 19%. An explanation for this behaviour may be a modification of the aryl rings<br />
by substitution with hydroxyl or carboxyl groups. Considerating both the O-aryl C and aryl<br />
160
C regions we detected a <strong>to</strong>tal reduction of the aromaticity of 3.5%. Since the <strong>to</strong>tal C-loss<br />
during the experiment comprised only 0.4%, this indicates that some of the aryl C must<br />
have been converted in<strong>to</strong> other C groups. As revealed by the increase of<br />
carboxyl/carbonyl C by 5.7%, this conversion must include the opening and partial<br />
oxidation of aromatic ring st<strong>ru</strong>ctures.<br />
Table 1. Relative intensity distribution (%) in the solid state 13 C NMR spectra of the fresh<br />
and incubated PyOM. Values are corrected by subtraction of the contributions of organic C<br />
in the used soil material<br />
245-160 160-140 140-90 90-45 45-0<br />
fresh<br />
ppm<br />
Gr1M 10 11 39 12 27<br />
Gr4M 11 14 49 6 20<br />
P1M 6 13 34 38 8<br />
P4M 8 16 67 5 5<br />
incubated<br />
Gr1M 13 13 43 9 22<br />
Gr4M 14 16 50 4 16<br />
P1M 6 14 36 36 9<br />
P4M 14 19 60 2 4<br />
Table 2. Changes of the content (%) of the different C groups of the PyOM during the<br />
degradation experiment. They were obtained by subtraction the C contents of the<br />
degraded from the fresh char, which were calculated by multiplying the relative intensity of<br />
the respective chemical shift region with the C concentration of the sample. Thus, positive<br />
values signalize neoformation, negative values correspond <strong>to</strong> losses<br />
Carbonyl C O-aryl C Aryl C O-alkyl C Alkyl C <strong>to</strong>tal loss<br />
% of bulk C<br />
Gr1M 2.5 1.5 1.8 -3.5 -5.6 -3.2<br />
Gr4M 3.2 0.9 0.1 -2.2 -4.5 -2.5<br />
P1M 0.1 1.2 1.0 -3.0 0.1 -0.7<br />
P4M 5.7 3.6 -7.1 -2.2 -0.4 -0.4<br />
161
4. SUMMARY AND CONCLUSIONS<br />
Our study demonstrates that PyOM, as it is produced by grassland fires or<br />
accumulated after incomplete combustion of litter during forest fires, can be<br />
microbiologically attacked and mineralised at rates that are comparable <strong>to</strong> humic material.<br />
Thus, such pyrogenic sources may not be as recalcitrant as commonly assumed and their<br />
role as a highly refrac<strong>to</strong>ry constituent within the humic substance fraction may need<br />
revaluation. Our study confirms further that chars derived from different sources or<br />
subjected <strong>to</strong> different thermal treatments show strong differences in their chemical<br />
composition. Whereas char from grass material reflects lower C/N ratios than that from<br />
pine wood, it comprises higher contributions of alkyl C. This is most tentatively due <strong>to</strong> its<br />
higher peptide content, yielding in chars containing cyclized peptide remains (Knicker and<br />
Müller, 2007). On the other hand, pine wood, exposed <strong>to</strong> charring of low severity still<br />
contains residues of carbohydrates, possibly as sugar anhydrides. Increasing charring<br />
intensity, however, increases the aromaticity. As demonstrated in this study, the difference<br />
in chemistry has some implication on the degradability of the respective chars which<br />
affects not only its potential for C-sequestration but also its role during humic substance<br />
formation.<br />
REFERENCES<br />
1. Masiello, C.A. 2004. New directions in black carbon organic geochemistry. Mar. Chem. 92,<br />
201-213.<br />
2. Knicker, H., Müller, P. 2007. The chemical st<strong>ru</strong>cture of pyrogenic humic material and how does<br />
it affect its chemical stability. Abstract submitted <strong>to</strong> the IHSS Meeting 2008, Moscow, Russia.<br />
162
Sedimentary Organic Matter in the Earth System: Origin and Fate<br />
Alain-Yves Huc<br />
Institut Français du Pétrole, Rueil-Malmaison 92852 France, a-yves.huc@ifp.fr<br />
Keywords: Sedimentary organic matter, fossil fuels, carbon cycle, organic diagenesis, thermal<br />
evolution, petroleum system<br />
Carbon is the 4 th most abundant element in the universe. The Earth System contains<br />
significant quantity of carbon, in its atmosphere and ocean principally in the form of CO 2<br />
and bicarbonates, in the c<strong>ru</strong>st, as carbonate-rich and organic-rich rocks, in the mantle and<br />
probably also in the core. Abundance estimates in the shallow reservoirs are relatively well<br />
assessed, but our knowledge in the mantle and core is far less secure.<br />
As far as reservoirs of organic matter are concerned, living biomass and its detritus<br />
including soil humus and oceanic POC (Particulate Organic Carbon) and DOC (Dissolved<br />
Organic Carbon) are minute when compared <strong>to</strong> the huge reservoir of sedimentary organic<br />
matter that they have fed throughout geological times.<br />
The purpose of this paper is <strong>to</strong> review the transformation processes leading <strong>to</strong> the<br />
different forms of fossil organic materials present in the subsurface.<br />
At the geological time scale, if we except the specific case of peat forming coal, the<br />
accumulation of organic matter in soils is a transitional state whose fate is <strong>to</strong> be<br />
mineralized and rapidly returned <strong>to</strong> the atmosphere as CO 2 or transported by watersheds<br />
and incorporated in<strong>to</strong> marine or lacustrine sediments. The “fresh” sedimentary organic<br />
matter including more or less altered detritus material derived from marine or lacustrine<br />
algae, bacteria and terrestrial higher plants (the latter being associated with au<strong>to</strong>chthonous<br />
peat deposits or conveyed in<strong>to</strong> aquatic basins) can then be eventually fossilised and<br />
preserved in the rock record for tens/hundreds million years before returning <strong>to</strong> the Earth<br />
surface, been oxidized and reintroduced in<strong>to</strong> the atmosphere as CO 2 . For depositional<br />
environment and sedimen<strong>to</strong>logical reasons the geologically preserved organic matter is<br />
associated with fine grain muds<strong>to</strong>nes.<br />
In order <strong>to</strong> be accumulated in sediments the components of the organic matter<br />
should be preserved from degradation by heterotrophic organisms during their transfer<br />
from the production site <strong>to</strong> the ultimate location of sedimentation. Different types of<br />
mechanisms are involved, acting differentially on the organic components as a function of<br />
their molecular composition. To a large extent the chemical st<strong>ru</strong>cture of the organic<br />
compounds derived from a given biomass will control its preservation fate:<br />
163
• Certain biomacromolecules are originally more resistant <strong>to</strong> degradation processes than<br />
others. This is for instance the case of cell walls of algae, lignin, spores and pollens,<br />
cuticules or cell membranes which can benefit from a “selective preservation” keeping<br />
their initial st<strong>ru</strong>cture relatively unchanged.<br />
• A second type of mechanisms of preservation is the polycondensation of the products<br />
derived from the decay and transformation of alterable organic remains, forming a<br />
more stable heterogenous mixtures of transformed biomolecules (“humic substances”)<br />
• A specific phenomenon occurs in anoxic sea water, involving the reaction of sulfur with<br />
functionalized lipids and sugars (“natural sulfurization”) leading <strong>to</strong> resistant high<br />
molecular weight moities resulting from intramolecular incorporation of sulfur<br />
• A last mechanism of preservation is the protection of organics by the mineral fractions<br />
through the formation of “organic-mineral aggregates”<br />
During the first step of burial the organic matter remains subjected <strong>to</strong> bacterial<br />
activity. The latter occurs usually up <strong>to</strong> few ten’s meters below the seabed, although the<br />
recent discovery and study of the “deep biosphere” extend such bacterial activity in<br />
sediments several hundred meters below seafloor.<br />
This “Early Diagenesis” impacts both:<br />
• the properties of the fossilizing organic matter which becomes progressively nonhydrolysable<br />
and non-extractable <strong>to</strong> alkaline solutions (disappearance of the “humic<br />
acids” fraction), becoming the so-called “Kerogen” in the terminology of petroleum<br />
geologists. This transformation is associated with a loss of oxygen-bearing groups, a<br />
change which can be also observed at the molecular level with the alteration of<br />
functionalized lipids (i.e. sterols, terpenoids) in<strong>to</strong> saturated hydrocarbons.<br />
• The nature of the products released by the degradation of the organic matter including<br />
for instance the formation of “biogenic” methane which will contribute pro parte <strong>to</strong> the<br />
s<strong>to</strong>ck of Hydrate-bound Methane within the gas hydrate stability zone.<br />
At the end of the diagenesis step, the organic moieties whose assemblage is making<br />
up the “kerogen”, which can be viewed as a set of molecular networks including mainly ,<br />
but not only, carbon and hydrogen a<strong>to</strong>ms. The ratio of hydrogen and carbon a<strong>to</strong>ms of the<br />
bulk kerogen (a critical property for the quantity and composition of the hydrocarbons <strong>to</strong> be<br />
generated during the subsequent geological his<strong>to</strong>ry of the sedimentary organic matter) is<br />
inherited from the nature of the biological precursors and influenced by the type of electron<br />
accep<strong>to</strong>rs occurring in the depositional environment.<br />
Beyond this step, the subsequent burial of organic-rich sediments, which are coined<br />
as potential Source Rocks (for petroleum and gas) is accompanied by a progressive<br />
164
increase of temperature, which is the main fac<strong>to</strong>r responsible for the cracking of a part of<br />
the kerogen in<strong>to</strong> smaller chemical moieties: liquid Petroleum and Gas. The relative<br />
importance of generated oil and gas is related <strong>to</strong> the type of kerogen but evolves as a<br />
function the thermal his<strong>to</strong>ry of the source rock. Oil is the major phase during the beginning<br />
of the thermal cracking, but progressively gas contribution increases <strong>to</strong> a point where it is<br />
the only released material, up <strong>to</strong> a stage where only methane is formed. This thermal<br />
evolution can be described by a first order kinetic approach and simulated in numerical<br />
basin models. The remaining part of the kerogen which is not transformed in<strong>to</strong> oil or gas<br />
tends <strong>to</strong> evolve <strong>to</strong>wards a more and more carbon-rich material. In this respect the Humic<br />
Coal series derived from the fossilisation of organic detritus of higher plants, including the<br />
peat, lignite, brown coal, bituminous coal, anthracite…,.is a pedagogic example of this<br />
evolution pathway.<br />
In the Petroleum Systems the hydrocarbons generated in the fine grain source<br />
rocks (low porosity and low permeability) have <strong>to</strong> be expulsed in<strong>to</strong> a carrier system made<br />
of coarse grain sedimentary bodies, fractures and faults where they can migrate upward<br />
due <strong>to</strong> their buoyancy. Along the migration pathway the hydrocarbons can be trapped as a<br />
result of st<strong>ru</strong>ctural features or change in the permeability of the carrier system, associated<br />
with a sealing cap rock. They become accumulated in Oil / Gas Fields from which, when<br />
identified and economically profitable, can be produced by industrial means.<br />
The hydrocarbons which are not trapped will continue their ascending journey <strong>to</strong>ward<br />
the Earth surface where they can spring as Oil or Gas Seeps which are ultimately<br />
oxidized <strong>to</strong> be transformed in CO 2 joining the atmosphere. In the subsurface, when oil is<br />
reaching shallow depth and temperature adequate <strong>to</strong> accommodate subterraneous<br />
biological processes (~< 85°C), this oxidation, which is mainly mediated by bacterial<br />
activity, transforms the conventional oil in<strong>to</strong> viscous <strong>to</strong> highly viscous oil due <strong>to</strong> loss of light<br />
ends and formation of additional high molecular weigh compounds. The biodegradation of<br />
migrated conventional oils is the major phenomenon of the formation of the huge<br />
resources of heavy oils, extra heavy oils and bitumen. When these viscous heavy oils are<br />
mixed with non-consolidated sands (corresponding <strong>to</strong> non compacted sands, occurring for<br />
instance in the distal part of “recent” foreland basin) they are described as Oil Sands or<br />
Tar Sands (i.e. exemplified by the gigantic Alberta oil sands deposits and Orinoco tar<br />
belt).<br />
The gas escaping the petroleum system can end up in the shallow thermodynamic<br />
stability zone of the gas hydrate and contribute, with the previously mentioned biogenic<br />
gas, <strong>to</strong> the tremendous reservoir of Methane Hydrate (probably twice the resource of the<br />
165
other fossil fuels). These hydrates might be viewed as a potential source of energy,<br />
assuming our ability <strong>to</strong> overcome the very important technological challenges associated<br />
with its recovery. Moreover it is considered <strong>to</strong> have play a substantial role in the<br />
atmospheric greenhouse gas mass balance during the geological his<strong>to</strong>ry as a result of<br />
episodes of destabilisation.<br />
A source rock which did not undergo this thermal his<strong>to</strong>ry will keep its petroleum<br />
potential and is liable <strong>to</strong> be industrially mined and re<strong>to</strong>rted in order <strong>to</strong> artificially produced<br />
oil and gas. Assuming that the <strong>to</strong>tal energy required <strong>to</strong> recover the considered source rock<br />
(mainly function of mining depth) and <strong>to</strong> thermally process it, is lower than the energy<br />
associated with the generated hydrocarbons (mainly function of the quality of the source<br />
rock), this immature source rock can be qualified as an Oil Shale. Although their<br />
exploitation is still a matter of technical and environmental issues, the current resource in<br />
Shale Oil is estimated <strong>to</strong> be around half of the resource of conventional oil.<br />
The low permeability of the source rocks or the absorption capacity of the organic<br />
matter require a sufficient energy for the generated oil or gas <strong>to</strong> be expelled and <strong>to</strong> reach<br />
the carrier system. If the hydrocarbons remain trapped in the source rock, the continuous<br />
burial and temperature increase lead <strong>to</strong> a further thermal cracking and <strong>to</strong> the accumulation<br />
of gas within the source rock itself. A phenomenon accompanied by a progressive<br />
decrease of the already low permeability of the hosting rock due <strong>to</strong> mineral diagenesis.<br />
This is the origin of the Gas Shales considered as a new frontier for fossil fuels<br />
exploration.<br />
Humic Coal, which is a massive organic matter sediment, is generating oil (during the<br />
sub-bituminous and bituminous stages) and a large amount of gas during the whole<br />
thermal cracking episode. A part of the gas, Coal Bed Methane (equivalent <strong>to</strong> coal mine<br />
firedamp), remains trapped and adsorbed within the organic matrix and can be industrially<br />
produced from coal fractures by dewatering and pressure drawdown.<br />
<strong>From</strong> biological tissues <strong>to</strong> kerogen the chemical change of the organic matter is<br />
largely mediated by biological activity resulting mainly in the loss of nitrogen then oxygen<br />
during the early diagenesis. The next step of evolution is controlled by thermal cracking<br />
releasing, on one hand, different types of hydrocarbons (bringing hydrogen with them) and<br />
transforming, on the other hand, the remaining kerogen in a carbonized residue. All of<br />
these products being due <strong>to</strong> be ultimately brought back <strong>to</strong> the Earth surface and oxydized<br />
as CO 2 and H 2 O and involved again in the biological cycle.<br />
166
Biological and <strong>Molecular</strong> St<strong>ru</strong>cture Analyses of the Controls on Soil<br />
Organic Matter Dynamics<br />
Eldor A. Paul 1 K. Magrini 2 , R. Conant 3 , R.F. Follett 4 , S.J. Morris 5<br />
1 Natural Resource Ecology Labora<strong>to</strong>ry, Colorado State University, Fort Collins, CO, USA 80523-<br />
1499, eldor@nrel.colostate.edu<br />
2 National Renewable Energy Labora<strong>to</strong>ry, 1617 Cole Blvd., Golden, CO 80401<br />
3 Natural Resource Ecology Labora<strong>to</strong>ry, Colorado State University, Fort Collins, CO 80523-1499,<br />
4 USDA-ARS, 2150 Centre Avenue, Bldg D, Ste 100, Fort Collins, CO 80525<br />
5 Dept. of Biology, Bradley University, 1501 W. Bradley Ave., Peoria, IL 61625-0313<br />
Keywords: soil organic matter dynamics, 13 C, 14 C, microbial biomass, pyrolysis mass spectrometry<br />
1. INTRODUCTION<br />
The dynamics of soil organic carbon (SOC) are controlled by the interaction of<br />
biological, physical, and chemical parameters. These are best measured by a combination<br />
of techniques such as long-term field sites with a C 3 ↔C 4 plant switch. Acid hydrolysis and<br />
14 C- dating measure the mean residence time (MRT) of the resistant fraction. Long-term<br />
incubation allows the in situ biota <strong>to</strong> identify and decompose the labile SOC components.<br />
Statistical analysis (curve fitting) of the CO 2 release curves, determines the pool size and<br />
of the two labile fractions (1). The effect of chemical st<strong>ru</strong>cture is measured with pyrolysismolecular<br />
beam mass spectrometry (py-MBMS). The dynamics of charcoal, clay and silt<br />
are measured with both 13 C and 14 C.<br />
2. MATERIALS AND METHODS<br />
We determined SOC dynamics on continuous maize plots on formerly forested soils,<br />
in Ohio and Michigan and a Colorado, grassland loam site. Studies on the Colorado,<br />
grassland soils in a wheat-fallow rotation used 13 C and 14 C and acid hydrolysis <strong>to</strong><br />
characterize the non-hydrolysable C (NHC) and incubation and 13 C <strong>to</strong> investigate the<br />
contribution of the microbial biomass (2, 3). Methodology for the labora<strong>to</strong>ry incubations,<br />
fractionation procedures, and tracer analysis are reported by Follett et al. (2), Paul et al.<br />
(4), and Collins et al. (5). Methodology for Py-MBMS analyses are reported by Magrini et<br />
al. (6).<br />
3. RESULTS AND DISCUSSION<br />
The wetland forest in Ohio had an original SOC content of 75 g C kg -1 soil. Drainage<br />
and cultivation dropped this <strong>to</strong> 18 g C kg -1 with a MRT of 920 ± 53 yr in the 0-20 cm layer<br />
167
and 6607 ± 79 yr at 50-100 cm. Acid hydrolysis that removed ~ 45% of the SOC resulted<br />
in an MRT of 1770 ± 70yr at the surface and 9875 ± 75 yr at lower depths (4)). Continuous<br />
maize for 30 yr labeled 21% of the soil 13 C. The C 3 (non-maize) SOC had an MRT of 17 yr<br />
for the light fraction (LF), 38 yr for the particulate organic matter (POM), 139 yr for the silt,<br />
and 261 yr for the clay (Table 1). Incubation for 850 days and measurement of 13 C showed<br />
the C 4 -C (maize) LF <strong>to</strong> have an MRT of 3.7 yr, while the plant residues and microbial<br />
biomass C within the aggregates (POM) dated 7.8 yr. The maize C in the silt had an MRT<br />
of 12.8 yr. The SOC associated with clay was oldest at 26.8 yr.<br />
The Michigan site contained 18 g C kg -1 soil in the deciduous forest, but 10 g C kg -1 in<br />
the cultivated. The 0-20 cm depth of the cultivated soil had a 14 C MRT of 422 ± 50 yr and<br />
1712 yr at 50-100 cm. The non-hydrolyzable C (NHC) accounting for 45% of the SOC had<br />
an MRT of 977 yr at the surface, and 4406 yr at depth. The 13 C measurements show that<br />
in both soils, the LF and POM fractions contain considerable, non-maize C in spite of an<br />
extensive period of maize production at both sites. The clay fraction contained the largest<br />
portion of the SOC. Both the silt and the clay had much slower 13 C turnover rates in the<br />
OH soils than in the MI soil (7). This reflects differences for these soils also measured by<br />
14 C dating. The Colorado soil lost 33% of its SOC during an 853 day incubation (2) relative<br />
<strong>to</strong> the ~20% loss from the forest-derived sites (5). It had 13 C MRTs similar <strong>to</strong> the OH site,<br />
but its 14 C dates were much older. The microbial biomass carbon (MBC) was comprised of<br />
a labile and stable fraction. The high, initial CO 2 evolution is reflected in the low MRT of<br />
the active fraction (C a ). The NHC comprising 60% of the soil still lost 30% of its C during<br />
the 853-day incubation with an increase in MRT from 3175 yr <strong>to</strong> 4967 yr. There is<br />
microbial production and transfers of materials between pools.<br />
The availability of py-MBMS, that rapidly measures volatile pyrolysis products, allows<br />
the determination of the molecular st<strong>ru</strong>cture of the SOC (6). The NHC, although containing<br />
a significant proportion of long-chain alkanes and high molecular weight aromatics still<br />
contained proteinaceous and carbohydrate materials protected by the soil matrix during<br />
hydrolysis. Acid hydrolysis, in removing some of the interfering minerals, results in higher<br />
pyrolysis product recovery (8). Interfering materials can also be eliminated by separation of<br />
humic acids under an N 2 atmosphere.<br />
Our use of py-MBMS is shown for a cultivated, Colorado Grassland soil before and<br />
after an 853 dy incubation (Figure 1). The positive values for the ion intensity represent<br />
m/z species present in higher concentrations at day zero than after 853 days. Peaks for<br />
amino acids dropped significantly and show the source of some of the 58% of the soil N<br />
that was mineralized relative <strong>to</strong> the 33% of the soil C lost during incubation. The peaks<br />
168
epresenting carbohydrates and lignin also dropped during the incubation reflecting the<br />
drop in both C 3 and C 4 constituents of the LF and POM during incubation (Tables 1 and 2).<br />
Our work has shown microbial production and transfers of materials between pools.<br />
Table 1. Distribution of C 4 and C 3 -C and MRT of the LF, POM, silt and clay fractions<br />
of two originally forested soils now in continuous maize<br />
LF POM Silt Clay Total<br />
Ohio silty clay loam<br />
C gkg -1 MRT yr C gkg -1 MRT yr C gkg -1 MRT yr C gkg -1 MRT yr C gkg -1<br />
C 4 - C 0.6 3.7 1.2 7.8 0.9 13 1.1 27 3.8<br />
C 3-C 0.1 17 0.9 38 3.5 138 9.0 261 13.5<br />
Michigan loam<br />
C 4 - C 0.3 3.9 0.84 11 0.2 11 1.1 16 2.3<br />
C 3-C 0.2 20 1.4 33 0.9 47 4.2 40 6.7<br />
Figure 1. Py-MBMS difference spect<strong>ru</strong>m for a cultivated Colorado grassland (0 day<br />
incubation - 853 days). Negative values show species present in higher concentration after<br />
853 days of incubation, positive values show species present in higher amounts at 0 days.<br />
169
Table 2. The dynamics of analytically-determined fractions of a Colorado silt loam as<br />
determined by acid hydrolysis, incubation and 14 C and 13 C measurements<br />
Fraction Method of Analysis C, gkg -1 MRT, yr<br />
MBC labile Incubation – Fumigation 0.18 0.19<br />
MBC stable Incubation – Fumigation 0.19 4.6<br />
C a -SOC Incubation – CO 2 evolution 0.5 0.67<br />
C s -SOC Incubation – CO 2 evolution 3.2 24<br />
C r -SOC Acid hydrolysis – 14 C dating 5.4 3175<br />
Total SOC<br />
14 C dating 9.1 1072<br />
13 C from wheat Incubation – 13 C 4.9 7.5<br />
13 C from native Field – 13 C 4.2 41<br />
M cr Incubation-acid hyd- 14 C 3.7 4967<br />
MBC = microbial biomass C, Ca = active SOC, Cs = slow C, Cr = resistant C, Mcr =<br />
microbial resistant, nonhydrolyzable C<br />
4. CONCLUSIONS<br />
A combination of biological analysis, such as incubation and microbial biomass<br />
determination, 13 C and 14 C tracers, soil fractionation, and matrix analysis (LF, POM, silt,<br />
and clay) with molecular st<strong>ru</strong>cture analysis (py-MBMS) on long-term sites with a C 3 ↔ C 4<br />
crop switch provided the <strong>to</strong>ols for determining the interacting controls in SOC dynamics.<br />
Mean residence times vary from a few months <strong>to</strong> 4967 yr. Long-term incubation, in which<br />
the soil microbiota decomposed 33% of the SOC and 58% of its N, produced microbial<br />
metabolites and transferred materials between pools.<br />
REFERENCES<br />
1. Paul, E., Morris, S., Conant, R., Plante, A. 2006. Soil Sci. Soc. Amer. J. 70, 1023-1035.<br />
2. Follett, R., Paul, E., Preussner, E. 2007. Soil Science 172, 189-208.<br />
3. Follett, R., Paul, E., Leavitt, S., Halvorson, A., Lyon D., Peterson, G. 1997. Soil Sci. Soc.<br />
Amer. J. 61, 1068-1077.<br />
4. Paul, E., Collins, H., Leavitt, S. 2001. Geoderma 104, 239-256.<br />
5. Collins, H., Paul, E., Blevins, R., Bundy, L., Christenson, D., Dick, W., Huggins, D., Lyon, D.,<br />
6. Peters, S., Turco, R. 1999. Soil Sci. Soc. Amer. J. 63, 584-591.<br />
7. Magrini, K., Evans, A. Hoover, R., Elam C., Davis, M. 2002. Environ. Pollution 116, S255-<br />
S268.<br />
8. Haile-Mariam S., Collins, H., Paul, E. 2008. Soil Sci Soc. Amer. J. 72:370-378.<br />
9. Schulten, H. 1996. In: Mass Spectrometry of Soils, T. Bout<strong>to</strong>n, S. Yamasaki (Eds.), Marcel<br />
10. Dekker, New York, pp. 373-436.<br />
170
Genesis of Cambisol, Luvisol and Rendzic Lep<strong>to</strong>sol of Samara Forest-<br />
Steppe Ridges with Special Reference <strong>to</strong> Characteristic of Humic Acids<br />
Evgeniy V. Abakumov 1 , Fujitake N. 2 , and Kosaki T. 3<br />
1 Saint-Petersburg State University, 16 line V.O., 29,199178, Saint-Petersburg, Russia,<br />
E_abakumov@mail.<strong>ru</strong><br />
2 Kobe University, Nada, 657-8501, Kobe, Japan<br />
3 Kyo<strong>to</strong> University, Kitashirakawaoiwake-cho, 60568502, Kyo<strong>to</strong>, Japan<br />
Keywords: soil genesis, humic acids, 13 C NMR spectroscopy<br />
1. INTRODUCTION<br />
The Middle Volga transitional landscape region (boreal eco<strong>to</strong>ne) is characterized by<br />
very complicated conditions in terms of his<strong>to</strong>ry of relief, parent material and soil cover.<br />
Here three ecosystems (deciduous forests, forest-steppes and steppes) are closely<br />
located each other, due <strong>to</strong> inversions of climatic zonal sequences and very high spatial<br />
heterogeneity of geogenic condition. That is why the soils have maximal diversity in higher<br />
taxonomic level in Samara ridges in comparison with the same altitudes of Russian plain.<br />
For example, there is an unequal (mountain landscape, presened by Luvisols (Dark-gray<br />
soils) and Cambisols (Brown soils), which are usually typical for dry continental and wet<br />
pacific regions, respectively. In this situation morphological and chemical properties of soil<br />
thin fraction are not allowed <strong>to</strong> conduct a precise and final soil classification in the<br />
categories of soil types. Some of these indexes give the evidence of transitions of one soil<br />
type <strong>to</strong> another, i.e. Cambisols can be classified as Gray-metamorphic soils, which have<br />
the features of both – Luvisols and Cambisols. Genetic differences between Luvisols and<br />
Cambisols can be adequately unders<strong>to</strong>od only on the basis of thorough investigation of<br />
humic substances (HAs) in nature and st<strong>ru</strong>cture. Thus, the aim of this investigation is <strong>to</strong><br />
answer the question if soils of northern slopes of Samara ridges are Cambisols or<br />
Cambisols with features of Luvisols (Gray-metamorphic soils). Two catenas on slopes of<br />
different aspect of Samara ridges were investigated in terms of soil genesis, morphology<br />
and chemical features, i.e. Rendzic lep<strong>to</strong>sols – Cambisols (wet, northern slopes, exposed<br />
<strong>to</strong> Volga thermo regulation influence (1) and Rendzic leptsols – Luvisols (dry eastern<br />
slopes with contrasting continental climate). Cambisols and Luvisols are different in<br />
morphological features and chemical properties due <strong>to</strong> different climatic conditions; while<br />
Rhendzic lep<strong>to</strong>sols of both slopes seems <strong>to</strong> be the same on the basis of general<br />
morphological and chemical analyses and recognized as intrazonal soils which are known<br />
171
as minimally dependent on climatic conditions. In order <strong>to</strong> understand the differences in<br />
humification process, the soils of two catenas were investigated in terms of characteristics<br />
of humic acids (HAs).<br />
2. MATERIALS AND METHODS<br />
HAs powders were prepared by standard IHSS method for soil samples after<br />
decalcination. 13 C NMR spectra were registered on B<strong>ru</strong>cker Ultra-Shield spectrometer with<br />
TMSPNA as a standard. Also the elemental composition of HAs was determined on HP-<br />
185B C, H, N-analyzer.<br />
3. RESULTS AND DISCUSSION<br />
The humification process in two catenas with different climatic conditions, i.e. eastern<br />
and northern slopes of Samara ridges, is completely different in the formation of HAs<br />
(table 1, fig. 1). HAs of Luvisol on eastern slopes are more aromitisized, contains less<br />
aliphatic carbon and fewer part of Me-O- connected carbon. In contrast, HAs of Cambisol<br />
on northern slopes are essentially higher in the portions of carboxylic carbon and carbonyl<br />
species. The same tendencies were revealed for HAs extracted form Rendzic lep<strong>to</strong>sols<br />
genetically connected in catenas with Cambisols and Luvisols. These data show that<br />
humification process is more intensive and reached <strong>to</strong> a deeper depth in case of Luvisols<br />
which is caused by contrast climatic regime characterized with wide fluctuation of annual<br />
and day temperature and moisture. The products of humification in this condition are HAs<br />
designaged by the “dark” or “gray” type (2), which is partially dissolved in water and able <strong>to</strong><br />
move in soil profile, resulting in the formation of deeply developed dark-colored surface<br />
horizon of Luvisol. Associated with HAs migration, the formation of cutans is observed in<br />
the subsoil of the profile. In contrast, the row, wet and warm stabile climate, which is<br />
regulated by Volga river on the northern slopes of Samara ridges leads <strong>to</strong> the formation of<br />
weakly humified HAs. These humic substances are more typical for taiga or humid marine<br />
bio<strong>to</strong>pes. HAs here are rather referred <strong>to</strong> “brown–humus” (3), which is not soluble in water<br />
and, therefore accumulates in the upper part of the soil profile. The mobile fraction here is<br />
only fulvic acids, which accumulate in subsoil and lead <strong>to</strong> immobilization of iron, deep<br />
weathering, i.e typical cambisol formation. <strong>Humus</strong> type of soils investigated is also strongly<br />
dependent on soil type mainly determined by climatic conditions, i.e. Cambisols and<br />
Luvisols are characterized by predominance of fulvic acids group (CHA/CFA=0,4-0,7) and<br />
humic acids group (CHA/CFA=0,9-1,2), respectively.<br />
172
1<br />
2<br />
3<br />
4<br />
Figure 1. 13 C NMR spectras of:<br />
1 – Cambisol, 2 – Luvisol, 3 and 4 – Rendzic lep<strong>to</strong>sols related on the slopes <strong>to</strong> Cambisol<br />
and Luvisol respectively; x – chemical shifts, ppm, y – the signal intensity.<br />
173
Table 1. The carbon species content in HAs, % <strong>to</strong> <strong>to</strong>tal carbon, on the basis of 13 C NMR<br />
spectra<br />
C=O COO-C phenolic-C aromatic-C HCOH, MeO-C aliphatic-C Aromaticity<br />
230-190 190-165 165-145 145-110 110-48 48-0<br />
Cambisol on residual calcaric on slope clayely derivates<br />
5,8 20,3 6,9 29,4 19,1 18,9 0,6<br />
Rendzic lep<strong>to</strong>sols, upper part of the same slope, eluvium of limes<strong>to</strong>nes<br />
3,5 17,5 5,3 23,4 32,9 18,2 0,6<br />
Luvisol on calcaric on slope clayely derivates<br />
4,4 16,8 7,7 42,3 16,0 13,3 0,7<br />
Rendzic lep<strong>to</strong>sols, upper part of the same slope, eluvium of limes<strong>to</strong>nes<br />
3,4 18,8 7,7 34,9 17,0 18,4 0,7<br />
4. CONCLUSIONS<br />
Climatic condition in Samara ridges in boreal eco<strong>to</strong>ne causes diversity of humification<br />
processes, that is reflected in the characteristics of HAs in st<strong>ru</strong>cture and its solubility<br />
leading the ability <strong>to</strong> move with soil solutions through a soil profile. This HAs features<br />
make difference in soil morphology and horizontal organization not only in full-developed<br />
or matured soil profiles, but also in intrazonal soils such as Rednzic lep<strong>to</strong>sols.<br />
The results obtained here suggest that the increase in water s<strong>to</strong>rage (moisture<br />
condition) due <strong>to</strong> Volga River locally influences humification processes in the soils in a<br />
continental steppe ecosystem and modify morphological and chemical characteristics of<br />
soil horizons <strong>to</strong> form “brown-humus” instead of “dark-humus” which is more common in the<br />
soils of continental steppe ecosystem.<br />
REFERENCES<br />
1. Kudinov K.A. 2001. The local pecularities of climate in Jiguli State Reserve on the base of<br />
meteorological study during 25-years (1974-1988) in: Samarskaya Luka, 2001, № 11. p. 67-<br />
99.<br />
2. Orlov D.S. 2005. Soil chemistry. Moscow.<br />
3. Ponomareva V.V., Plotnikova T.A. 1980. <strong>Humus</strong> and soil formations: methods and results of<br />
investigation. Moscow-Leningrad<br />
174
Paramagnetic Activity of Humic Acids in Soil Chronosequence of<br />
Former Sandy Quarry, Leningrad Region, Russia<br />
Evgeniy Abakumov, Alexander Ryumin, Serafim Chukov, Irina Kechaikina<br />
Saint-Petersburg State University, 16 line V.O., 29,199178, Saint-Petersburg, Russia,<br />
E_abakumov@mail.<strong>ru</strong><br />
Keywords: soil genesis, humic acids, 13-C-NMR spectroscopy<br />
1. INTRODUCTION<br />
Rate of primary humus accumulation and chemical mechanisms of humification<br />
process are two main questions of modern pedology and humiomic science. These tasks<br />
require long term experiments, but in case of chrono sequences it is possible <strong>to</strong> use the<br />
natural time-models of humification process development. Different-age soils, formed in<br />
the same bioclimatic conditions on the same spoil heaps parent materials provide exact<br />
information about evolution of humic substances. This investigation was aimed <strong>to</strong> asses a<br />
HAs paramagnetic activity changes with time in organogenic horizons of forest floors of<br />
young weak-developed and mature Spodosols.<br />
2. MATERIALS AND METHODS<br />
The 10-, 15-, 60- years old and also mature Scots pine forest plots in naturallyrevegetated<br />
spoil heaps of Maluxa glacio-lacustrine sand quarry in Kirovsky district of<br />
Leningrad region (50 km East of St. Petersburg) were studied. The 10 years young soil<br />
under the solitary pine trees with spotty grass-mosses cover demonstrate only low humus<br />
accumulation and not stabile thin forest floor. Starting from 15-20 years the process of<br />
organic accumulation in soil intensifies which results in differentiation of forest floor <strong>to</strong><br />
subhorizons Oi, Oe and Oh (L, F and H in forest pedology). The HAs, extracted from these<br />
three sub horizons are quite different on elemental composition and carbon species based<br />
on NMR data. This allows us <strong>to</strong> suggest that paramagnetic properties of HAs also must<br />
show the tendencies <strong>to</strong> change with the age row and due <strong>to</strong> forest floor differentiation <strong>to</strong><br />
tree sub horizons. Previously is was shown that HAs from arable or buried soils<br />
characterized by lower portion of free radicals than HAs from natural soils under<br />
undisturbed plant cover. Thus, paramagnetic activity is expected <strong>to</strong> be in inverse<br />
proportional <strong>to</strong> HAs aromaticity and transformation degree.<br />
175
3. RESULTS AND DISCUSSION<br />
Paramagnetic activity of humic acids, estimated by concentration of free radicals (fig.<br />
1), is quite changeable parameter with the age row. Difference between HAs from 15-, 60-<br />
years old and mature Oi horizons are not significant, and, in general the level of HAs<br />
paramagnetic activity is stable for fresh organic matter, accumulated of the soil surface<br />
with the age row. It is caused by annual renewal of organic matter in forest ecosystem due<br />
<strong>to</strong> input of organic debris. The Oe horizons show the tendencies of strict decreasing of free<br />
radicals concentrations. The reason of this trend is intensive transformation of soil organic<br />
matter in this horizon of fermentation. This tendency is more expressed in humic acids of<br />
forest floor humification subhorizon – Oh.<br />
10<br />
9<br />
8<br />
7<br />
6<br />
5<br />
4<br />
3<br />
from Oi<br />
from Oe<br />
from Oh<br />
2<br />
1<br />
0<br />
15 60 mature<br />
Figure 1 The concentration of free radicals in HAs powder, spin/g.<br />
4. CONCLUSIONS<br />
Data obtained demonstrate that humification process leads <strong>to</strong> strong and statistically<br />
significant decreasing of free radicals concentrations in different-age soil soils of<br />
vegetation chronosequence. These data also provide facts the intensity of soil organic<br />
matter transformation is in inverse proportion with its paramagnetic activity. On the first<br />
stages of ecosystem development the paramagnetic activity of HAs is in maximum. This<br />
fact is not only the result of low degree of HAs condensation, but also the index of maximal<br />
physiological activity of HAs.<br />
176
Global Warming and Effects of Sea-Salts on Dissolved Natural Organic<br />
Matter (DNOM) Draining <strong>From</strong> a Sub-Catchment Upstream Lake<br />
Terjevann, Southernmost Norway<br />
Dag Olav Andersen<br />
University of Agder, Department of Natural Sciences, Service box 422, N-4604<br />
Kristiansand S, Norway, dag.o.andersen@uia.no<br />
Keywords: global warming, sea-salts, DNOM<br />
1. INTRODUCTION<br />
Negative impacts of the observed global warming include increased risk of inland<br />
flash floods in most parts of Europe due <strong>to</strong> s<strong>to</strong>rminess (1). During s<strong>to</strong>rmy weather seawater<br />
aerosols are transported in<strong>to</strong> the atmosphere and deposited inland. Observed<br />
drainage acidification and increased levels of labile aluminium after rainfall events with<br />
high sea-salt concentrations have been ascribed <strong>to</strong> ion-exchange reactions in the humusrich<br />
<strong>to</strong>p soil (2, 3). Effects of sea-salts on DNOM draining from a sub-catchment are<br />
reported here.<br />
2. MATERIALS AND METHODS<br />
Lake Terjevann is situated about 2.5 km from the coastline about 8 km west of<br />
Kristiansand in the southernmost part of Norway. The catchment consists of four subcatchments<br />
A, B, C+D of 0.50, 0.24 and 0.35 km 2 respectively. The altitude ranges from<br />
22 <strong>to</strong> 128 m above sea level. The soil cover is thin (20 – 70 cm) and frequently inter<strong>ru</strong>pted<br />
by outcrops of bedrock, mainly felsic augen-gneiss. The vegetation is dominated by<br />
conifers, mainly Scots pine, with elements of deciduous trees, mainly oak and birch.<br />
Besides, about 50 % of sub-catchment A was forested with Norway sp<strong>ru</strong>ce about 50 years<br />
ago. A maritime climate prevails in this area with monthly mean temperatures commonly<br />
just below 0 o C in December, January and Feb<strong>ru</strong>ary and just above 14 o C in June, July<br />
and August. The annual mean deposition is about 1300 mm characterised by maxima<br />
during late autumn and winter. Sea-salts as well as long-range transported acidic sulphur<br />
and nitrogen compounds in the deposition are common.<br />
Samples of drainage water from sub-catchments A and B were collected almost<br />
weekly in clean glass bottles and transported <strong>to</strong> the labora<strong>to</strong>ry where conductivity, pH,<br />
absorbance (200-700 nm) and HPSEC fractions were measured a few hours after<br />
sampling. Conductivity and pH were measured with standard Radiometer equipment<br />
177
calibrated against KCl and Radiometer buffers of 4.01 and 7.00 respectively. The UV-VIS<br />
spect<strong>ru</strong>ms were obtained on filtered (0.45 µm) samples by a Shimadzu Multispec<br />
pho<strong>to</strong>diode array spectropho<strong>to</strong>meter and a 10 mm quartz cuvette. The same inst<strong>ru</strong>ment<br />
with a 10 mm quartz flow-cell was used as a detec<strong>to</strong>r (254 nm) in the HPSEC system in<br />
combination with a Perkin Elmer Series 200 pump and a Tosoh TSK-G3000SW column<br />
(7.5 x 600 mm with a 7.5 x 75 mm guard). A sodium acetate buffer with pH 7.0 was used<br />
as mobile phase. DOC was measured on filtered (0.45 µm) and acidified (pH 2) samples<br />
by a Shimadzu TOC analyzer.<br />
3. RESULTS AND DISCUSSION<br />
Wind direction and strength control the observed fluctuations in the sea-salt (Cl - )<br />
concentration of the deposition (Figure 1). Strong south-westerly winds in January 2005<br />
combined with relatively large amounts of deposition (Figure 1) loaded the catchment with<br />
sea-salts. This was observed as an increase in conductivity of the drainage from about 8<br />
<strong>to</strong> about 12 mS/m (Figure 1). The minimal decrease in pH (Figure 1) further indicates that<br />
the sea-salts resulted in a significant decrease in DOC and besides a significant decrease<br />
in the higher molecular weight (HMW) fraction of the DNOM draining from the catchment<br />
(Figure 1).<br />
Aggregation of the HMW fraction in the soil/soil-water due <strong>to</strong> the sea-salts and<br />
precipitation could explain the loss of this fraction as labora<strong>to</strong>ry experiments have shown<br />
similar effects on adding neutral salts <strong>to</strong> solutions with humic substances (e.g. 4, 5). This<br />
conformational change of the DNOM may have implications for the binding properties and<br />
may e.g. explain the observed substantially increased inorganic aluminium concentrations<br />
in the stream waters during a similar event in January 1993 (3).<br />
178
Deposition (mm); Chloride (mg/L)<br />
100<br />
90<br />
80<br />
70<br />
60<br />
50<br />
40<br />
30<br />
20<br />
10<br />
mm<br />
Cl<br />
0<br />
7-Sep 7-Oct 6-Nov 6-Dec 5-Jan 4-Feb 6-Mar 5-Apr 5-May 4-Jun 4-Jul<br />
Conductivity (mS/m)<br />
13<br />
12<br />
11<br />
10<br />
9<br />
8<br />
7<br />
6<br />
5<br />
Cond.<br />
pH<br />
6,8<br />
6,4<br />
6,0<br />
5,6<br />
5,2<br />
4,8<br />
4,4<br />
pH<br />
4<br />
7-Sep 7-Oct 6-Nov 6-Dec 5-Jan 4-Feb 6-Mar 5-Apr 5-May 4-Jun 4-Jul<br />
4,0<br />
14<br />
12<br />
10<br />
DOC<br />
HMW<br />
80<br />
70<br />
60<br />
DOC (mg/L)<br />
8<br />
6<br />
4<br />
2<br />
50<br />
40<br />
30<br />
20<br />
HMW (%)<br />
0<br />
10<br />
7-Sep 7-Oct 6-Nov 6-Dec 5-Jan 4-Feb 6-Mar 5-Apr 5-May 4-Jun 4-Jul<br />
2004-05<br />
Figure 1. Amount of deposition and chloride concentration in deposition; conductivity, pH,<br />
DOC and higher molecular weight (HMW) DNOM in the drainage from the catchment.<br />
179
4. CONCLUSIONS<br />
Increased frequency of sea-salt events may be expected as more extreme rainfall<br />
events is predicted in e.g. the northern part of Europe due <strong>to</strong> global warming (1, 6). In<br />
areas with at least acidic soils probable conformational changes of the DNOM may have<br />
implications for its binding properties and the drainage water chemistry.<br />
ACKNOWLEDGEMENTS<br />
I thank S. Haaland for the TOC results.<br />
REFERENCES<br />
1. IPCC 2007. http://www.ipcc.ch/pdf/assessment-report/ar4/syr/ar4_syr_<strong>to</strong>pic3.pdf read<br />
December 14.<br />
2. Skartveit, A. 1981. Nordic Hydrol. 12, 65-80.<br />
3. Andersen, DO., Seip, H. 1999. J. Hydrol. 224, 64-79.<br />
4. Eckert, JM., Sholkovitz, ER. 1976. Geochim. Cosmochim. Acta 40, 847-848.<br />
5. Ghosh, K., Schnitzer, M. 1982. Geoderma 28, 53-56.<br />
6. Benestad, R. 2007. Klima 4, 30-31 (In Norwegian).<br />
180
Characterization of Soil Organic Matter from Flooded Rice Fields<br />
Contaminated by Geogenic Arsenic in Bangladesh<br />
Florian Breider 1 , Mohammad Hassouna 1 , Hans-Rudolf Pfeifer 1 , Anuji Abraham 2 , Jean-<br />
Marie Garnier 3<br />
1 University of Lausanne, IMG-Centre d’Analyse Minérale, Faculty of Geosciences and<br />
Environment, Anthropole, 1015 Lausanne, Switzerland, florian.breider@unil.ch<br />
2 Swiss Federal Institute of Technology, ISIC-LRMB, 1015 Lausanne, Switzerland<br />
3 CEREGE, UMR 6635 CNRS, University Paul Cézanne, 13545 Aix-en-Provence, France<br />
Keywords: SOM, rice field, fluorescence spectroscopy, UV-vis absorbance, FT-IR, CP-MAS<br />
1. INTRODUCTION<br />
Ground waters containing high concentrations of arsenic have been reported in many<br />
parts of the alluvial plain of Ganges-Brahmaputre-Meghna delta. Flooding of rice fields<br />
with highly contaminated groundwater may cause an accumulation of As and Fe (fig. 1) in<br />
the subsurface which is suspected <strong>to</strong> increase the severity of the straighthead disease and<br />
affect the grain yield of rice plant (Oryza sativa L.) (1, 2). The release of As from soil and<br />
its transfer <strong>to</strong> the aquifer is governed by several physico-chemical processes such as<br />
adsorption, complexation or oxydoreduction, in which soil organic matter (SOM) is thought<br />
<strong>to</strong> play a central role (3). Hence, this study aims <strong>to</strong> obtain information about st<strong>ru</strong>ctural and<br />
functional properties of SOM in the soil profile of rice fields in order <strong>to</strong> understand its effect<br />
on the fate and mobility of arsenic in flooded soils. Six different sites have been studied,<br />
however in this abstract, only the results corresponding <strong>to</strong> the most contaminated soil<br />
([As]>2000 μg/l) will be presented.<br />
2. MATERIALS AND METHODS<br />
Soil and water samples were collected before rice harvest (April 2007) in a<br />
contaminated rice field located in Araihazar Upazila (N23°47’35.7’’ E90°37’44.9’’),<br />
Bangladesh. Soil cores of 14cm in length, divided in<strong>to</strong> seven 2cm thick slices, were<br />
collected near the water inlet <strong>to</strong> the paddy field. Slices were squeezed <strong>to</strong> extract soil<br />
interstitial water containing the dissolved organic matter (DOM). Soil humic substances<br />
(HS) were extracted from the solid soil core with NaOH 0.1M (1:2 w/v) during 24h. Humic<br />
acids (HA) were separated by acid precipitation (32% HCl, pH = 1) for further analysis.<br />
Both DOM and HS were analyzed by measuring UV-Vis absorbance and<br />
three-dimensional fluorescence spectroscopy. Furthermore, HA were studied with FT-IR<br />
181
and solid state 13 C-CPMAS-NMR using the two pulse phase modulation method. In order<br />
<strong>to</strong> enhance the resolution of the FT-IR absorption bands of the polysaccharide fraction<br />
(1300-800cm -1 ), the 2 nd derivative multiplied by a positive fac<strong>to</strong>r was subtracted from the<br />
raw spectra (4).<br />
3. RESULTS AND DISCUSSION<br />
Total organic carbon (TOC), HS and DOM concentrations within the entire soil profile<br />
are presented in figure 1. Contrarily <strong>to</strong> DOM, which showed a maximum between 6 and<br />
10 cm, HS tended <strong>to</strong> decrease steadily with increasing depth and exhibited a closely<br />
comparable spatial profile <strong>to</strong> that of <strong>to</strong>tal dissolved As and Fe (fig. 1).<br />
depth (cm)<br />
0<br />
2<br />
4<br />
6<br />
8<br />
10<br />
[TOC] g C kg -1<br />
0 3 6<br />
[HSNaOH] g C kg -1<br />
0 1 2<br />
0<br />
2<br />
4<br />
6<br />
8<br />
10<br />
0<br />
2<br />
4<br />
6<br />
8<br />
10<br />
[DOM] mg C L -1<br />
0 20 40<br />
0<br />
2<br />
4<br />
6<br />
8<br />
10<br />
[As] μg L -1<br />
0 1500 3000<br />
[Fe] μg L -1<br />
0 2000 4000<br />
0<br />
2<br />
4<br />
6<br />
8<br />
10<br />
12<br />
12<br />
12<br />
12<br />
12<br />
14<br />
14<br />
14<br />
14<br />
14<br />
Figure 1. Profile of concentration of TOC, HS, DOM, and dissolved As and Fe.<br />
UV-Vis absorbance spectral analysis of DOM and HS showed an increase of their<br />
absorbance ratios A 250 /A 365 (E2/E3) and a decrease of their humification index A 465 /A 665<br />
(E4/E6) with soil depth, indicating their enrichment in simpler and less humified st<strong>ru</strong>ctures.<br />
Typical excitation emission matrix (EEM) fluorescence spectra of DOM (fig. 2.1) revealed<br />
the presence of peaks A (λ ex 270nm/λ em 425nm) and C (λ ex 325nm/λ em 400nm), respectively<br />
related <strong>to</strong> fulvic acids and protein-degradation derived materials, and <strong>to</strong> more humified<br />
humic acids. At depth ranging from 0 <strong>to</strong> 4cm, an additional peak, B (λ ex 280nm/λ em 360nm)<br />
most likely related <strong>to</strong> protein-like moieties (5), was also detectable. Furthermore, traces of<br />
a shoulder-like peak, H (λ ex 390nm/λ em 480nm), corresponding <strong>to</strong> aromatic compounds<br />
derived from lignin degradation was perceptible along the soil profile. On the other hand,<br />
the EEM fluorescence of HS (fig. 2.2) were particularly dominated by peaks C and H, and<br />
characterized by the complete absence of peak B. In addition, a hardly distinguishable<br />
blue-shifted peak A was also noticed.<br />
182
Excitation<br />
λ (nm)<br />
465<br />
440<br />
420<br />
400<br />
380<br />
360<br />
340<br />
320<br />
300<br />
280<br />
1. 2.<br />
H<br />
C<br />
A<br />
B<br />
λ (nm)<br />
465<br />
440<br />
420<br />
400<br />
380<br />
360<br />
340<br />
320<br />
300<br />
280<br />
2.<br />
260<br />
260<br />
240<br />
240<br />
220<br />
250<br />
300 350 400<br />
Emission<br />
λ (nm)<br />
450 500 550<br />
220<br />
250<br />
300 350 400<br />
λ (nm)<br />
450 500 550<br />
Figure 2. EEM of NOM between 0-2 cm. 1) DOM, 2) HS.<br />
FT-IR spectroscopy was used <strong>to</strong> characterize the functional groups present in the soil<br />
HA fraction. In the FT-IR spectra hydroxyl (3400 cm -1 ), alkyl (2920 cm -1 ), carboxyl<br />
(1720 cm -1 ), aromatic (1510 cm -1 ), alcohol (1150-1050 cm -1 ) and ester (1250-1220 cm -1 )<br />
bands were observed. The optical density relative <strong>to</strong> the aromatic band at 1510 cm -1 was<br />
determined for each functional group. The relative optical density (ROD) of hydroxyl and<br />
carboxyl bands showed significant differences along the soil profile. Indeed, the decrease<br />
of ROD of carboxyl and hydroxyl groups reflects aromatization, decarboxylation and<br />
dehydroxylation processes due <strong>to</strong> the natural degradation of HA (4). Furthermore, the<br />
absorbance bands at 1330cm -1 and 1270cm -1 , which are characteristic of the lignin<br />
components syringyl and guaiacyl, suggested that HA originate of vegetal<br />
biomacromolecules. This finding was further confirmed by the iso<strong>to</strong>pic value of<br />
δ 13 C=-26.7‰ which indicate an essential contribution of C3-plants, such as Oryza sativa L,<br />
in the formation of these st<strong>ru</strong>ctures in soil.<br />
240 220 200 180 160 140 120 100 80 60 40 20 0 -20 ppm<br />
Figure 3. 13 C-CPMAS-NMR spect<strong>ru</strong>m of HA fraction of HS.<br />
On the basis of the 13 C-CPMAS-NMR, determined for the HA fraction extracted from<br />
the entire soil profile, several st<strong>ru</strong>ctural groups were detected and quantified. Indeed,<br />
13 C-CPMAS-NMR showed the presence of peaks in the chemical shift regions<br />
representative of alkyl (0-50 ppm), O-alkyl (50-70 ppm), carbohydrate (70-95 ppm),<br />
aromatic (100-160 ppm), and carbonyl (160-190 ppm) st<strong>ru</strong>ctural groups. The quantification<br />
183
of these groups revealed the dominance of alkyl (40.6%) and aromatic (30.2%) carbon<br />
compounds, compared <strong>to</strong> carbon associated <strong>to</strong> O-alkyl, carbohydrate and carbonyl groups<br />
which represented respectively only 16.9%, 5.3% and 7.0%.<br />
4. CONCLUSIONS<br />
Some striking qualitative and quantitative differences between DOM and HS<br />
extracted from the same sampling site have been highlighted by several analytical<br />
methods. These differences suggest that these two fractions have different origins and<br />
reactivity. However, results show a decrease of the amount of organic carbon, complexity<br />
and molecular weight in both fractions with soil depth. This is confirmed by the presence of<br />
low ROD values for hydroxyl and carboxyl FT-IR bands and by higher fluorescence<br />
intensity of low molecular weight humic-like and fulvic-like compounds in deeper soil<br />
layers. Furthermore the chemical characterization of the rice field SOM has confirmed that<br />
HS are essentially derived from C3-plants residues.<br />
This research has opened up new prospects in the study of rice field soils. Indeed,<br />
the combination of different spectroscopic methods has helped <strong>to</strong> elucidate in part the<br />
nature of SOM in flooded soils. However, in order <strong>to</strong> advance in our knowledge of the rice<br />
field SOM, TOCSY, 13 C-CPMAS and other NMR experiments should be used in the future<br />
<strong>to</strong> characterize the complex st<strong>ru</strong>cture of SOM.<br />
ACKNOWLEDGEMENTS<br />
We thank Prof. G. Bodenhausen, direc<strong>to</strong>r of the Labora<strong>to</strong>ry of Biomolecular Magnetic<br />
Resonance of the Swiss Federal Institute of Technology – Lausanne and the team of<br />
Prof. K.M. Ahmed of the University of Dhaka, Bangladesh for their support.<br />
REFERENCES<br />
1. Rahman, M.A., Hasegawa, H., Rahman, M.M., Miah, M.A.M., Tasmin, A., 2008. Environ. Exp.<br />
Botany 62, 54-59<br />
2. van Geen, A., Zheng, Y., Cheng, Z., He, Y., Dhar, R.K., Garnier, J.M., Rose. J., Seddique, A.,<br />
Hoque, M.A., Ahmed, K.M., 2006. Sci. Total Environ. 367, 769-777<br />
3. Wang, S., Mulligan, C.N., 2006. Environ. Geochem. Health 28, 197-214<br />
4. Tinoco, P., Almendros, G., Sanz J., González-Vázquez, R., González-Vila, F.J., 2006. Org.<br />
Geochem. 37, 1995-2018<br />
5. Mayer, L.M., Schick, L.L., Loder, T.C., 1999. Mar. Chem. 64, 171-179<br />
184
Soil Organic Matter Chemical and Physical Fractionation: a Comparison<br />
on a Developing Soil<br />
Luisella Celi 1 , Chiara Cerli 1 , Georg Guggenberger 2 , Klaus Kaiser 2<br />
1 Di.Va.P.R.A., University of Torino, G<strong>ru</strong>gliasco (TO), Italy Luisella.Celi@uni<strong>to</strong>.it<br />
2 Soil Sciences, Halle-Wittenberg University, Halle/S., Germany.<br />
Keywords: humic acid, fulvic acid, free particulate organic matter (POM), occluded POM, MOM<br />
1. INTRODUCTION<br />
Humification processes can be related <strong>to</strong> biological, microbial, or chemical<br />
transformation of plant residues <strong>to</strong> humic substances which have been defined as the<br />
fraction of soil organic matter (OM) most resistant <strong>to</strong> biodegradation (1). However, if this<br />
concept is restricted <strong>to</strong> the products of OM transformation, it does not explain why it is<br />
possible <strong>to</strong> find in soil old OM rich in easily degradable residues. Different authors<br />
proposed that, besides the selective preservation of the products more recalcitrant <strong>to</strong><br />
degradation, two major mechanisms can contribute <strong>to</strong> stabilisation of OM (reviewed by 2).<br />
The occlusion of OM in<strong>to</strong> aggregates may reduce its accessibility for micro-organisms,<br />
while the interaction with minerals and metal cations can limit enzymatic activity.<br />
The chemical separation in<strong>to</strong> humic acids (HA), fulvic acids (FA) and humin (Hu) has<br />
been used for long time <strong>to</strong> evaluate the processes governing humification in soil.<br />
Additional information can derive from physical fractionation which takes advantage of a<br />
non-dest<strong>ru</strong>ctive technique <strong>to</strong> evaluate other mechanisms contributing <strong>to</strong> OM stabilisation in<br />
soil. Density fractionation physically separates OM in<strong>to</strong> light fractions representing<br />
particulate OM, mainly fresh biomass debris, and heavier fractions comprising OM<br />
occluded in<strong>to</strong> aggregates and/or intimately associated <strong>to</strong> minerals.<br />
This work is aimed <strong>to</strong> compare the chemical and density fractionation methods and<br />
highlight the different information obtained by each approach. For this aim young soils<br />
exposed <strong>to</strong> a natural succession of pure pine for different periods seem a good <strong>to</strong>ol <strong>to</strong><br />
evaluate the time course of the processes of humification and stabilization of OM.<br />
2. MATERIALS AND METHODS<br />
The studied area is located in Russia, 40 km South Est of St. Petersburg, in a former<br />
sand quarry where dumps are under natural revegetation for different years. The<br />
chronosequence is composed of a “time zero” plot with no vegetation cover and of four<br />
plots covered with Pinus sylvestris L. of different ages (10, 20, 40 and 65 years). <strong>From</strong><br />
185
each plot soil was sampled from the three organic horizons (Oi, Oe, and Oa) if present,<br />
and from the mineral horizons down <strong>to</strong> the parent material.<br />
In addition <strong>to</strong> the physical-chemical characterization of the soils, <strong>to</strong>tal extractable C<br />
(TEC), humic (HA) and fulvic acids (FA) were extracted and purified (1).<br />
On the mineral horizons the density fractionation was carried out with Na<br />
polytungstate at a density of 1.6 g cm -3 (3) applying a sonication intensity of 175 J cm -3 .<br />
Three different fractions were obtained: free particulate organic matter (FPOM), occluded<br />
particulate organic matter (OPOM), and mineral-associated organic matter (MOM).<br />
Bulk soils and both chemical and physical fractions were analysed for their organic C<br />
and <strong>to</strong>tal N contents.<br />
3. RESULTS AND DISCUSSION<br />
The parent material was a weakly buffered substrate with a coarse sandy texture,<br />
neutral pH, and little OM, probably due <strong>to</strong> deposition of dust. The Scots pine colonization<br />
resulted in the build-up and transformation of surface humus, followed by the incorporation<br />
of OM in the mineral horizons, visible already in the 20 year old-site. The result is a<br />
continuous increase of the s<strong>to</strong>red C.<br />
<strong>From</strong> the chemical extraction findings it appeared that the organic material<br />
accumulating in soil with time was at a low level of humification without important changes<br />
for the first 40 years. Major modifications were observed thereafter in the 40 and 60 yearold<br />
plots with increase of the humic fractions and HA/FA ratios. The density fractionation<br />
confirmed the presence of a poorly degraded material in the FPOM fraction of the younger<br />
plots. With time, following mineral weathering, a larger proportion of OM was associated <strong>to</strong><br />
the OPOM and MOM fractions, highlighting that besides humification, the formation of<br />
organic-mineral association, which became progressively more pronounced, contributed at<br />
a large extent <strong>to</strong> the stabilisation and consequent accumulation of C in soil.<br />
ACKNOWLEDGEMENTS<br />
This work was funded by the EU-INCO project n°013388.<br />
REFERENCES<br />
1. Stevenson, F.J. 1994. In: <strong>Humus</strong> Chemistry: Genesis, Composition, Reactions. John Wiley &<br />
Sons, New York.<br />
2. von Lützow, M., Kögel-Knabner, I., Ekschmitt, K., Matzner, E., Guggenberger, G., Marschner,<br />
B., Flessa, H. 2006. Eur. J. Soil Sci. 57, 426–445.<br />
3. Golchin, A., Oades, J.M., Skjemstad, J.O., Clarke P. 1994. Austr. J. Soil Res. 33, 59-76.<br />
186
Study on the Role of Microorganism in the St<strong>ru</strong>cture of Soil Humic Acid<br />
Jun-Tao Cui 1 , Sen Dou 1 , Wei Zhang 2 , Liang-Wei Feng 1<br />
1 Jilin Agricultural University , XinCheng Street, 130118, Changchun, Jilin Province, China,<br />
Cuijuntao2005@163.com<br />
2 Changchun Agricultural school, Xinglongshan, 130000, Changchun, Jilin Province, China<br />
Keywords: microorganism, humic substances, fungi, bacteria, humic acid<br />
1. INTRODUCTION<br />
Microorganisms are the driving force behind the formation, transformation,<br />
degradation and mineralization of humic substances (1). Although bacteria dominate the<br />
environment and participate in turnover of humic substances, their ability <strong>to</strong> degrade stable<br />
macromolecules such as HA and lignin is limited (2-5, 10, 11). Fungi are the most efficient<br />
HS degraders which carried out mainly via secondary or cometabolic processes.<br />
Approximately 8,500 described species of basidiomycetes are lignocellulose-degrading<br />
saprotrophs, and about half of these occur in soil and on fallen plant litter (7). Until<br />
recently, basidiomycetes were considered less common in agricultural soils. A recent<br />
study (6) linked <strong>to</strong> global warming revealed that over a 6-y period under elevated CO 2 , soil<br />
carbon was reduced by half, with this decline driven by the activity of the soil microbial<br />
community. Soils exposed <strong>to</strong> elevated CO 2 had higher relative abundances of fungi and<br />
higher activities of soil carbon degrading enzymes, emphasizing the role of fungi in humic<br />
substance turnover. Fungi active in the decomposition process include mainly<br />
ascomycetes and basidiomycetes which are common in the upper layer of forest and<br />
grassland soils. However, their relative abundance and role during turnover of humic<br />
substances are still unclear (8, 9), there is still a gap in our knowledge of their actual<br />
diversity and function in OM decomposition. This work was therefore undertaken with the<br />
aim of investigating the role of soil microbial communities in changing the st<strong>ru</strong>cture of soil<br />
humic acid and <strong>to</strong> highlight problems, unsolved questions and hypotheses.<br />
2. MATERIALS AND METHODS<br />
Materials: Sampling site locates in Liujia village, Nong An county, Jilin province,<br />
China (N: 44°11’39.7”, E: 125°07’58.8”). Samples for this study were collected from 0-40<br />
cm depth, uncultivated soil.<br />
187
Microbial species for test were indigenous fungi (Aspergillus sp., Penicillium sp.,<br />
Fusarium sp., Phoma sp., Trichoderma sp.) and indigenous bacteria (Arthrobacter sp.,<br />
Agrobacterium sp., Pseudomonas sp., Bacillus sp., Cellulomonas sp., Strep<strong>to</strong>myces sp.)<br />
isolated from the soil samples.<br />
Methods: Soil samples were fully mixed <strong>to</strong>gether, and then put it (50 g) in<strong>to</strong> each<br />
glass bottle with cot<strong>to</strong>n plug, respectively. Sterilized at 121°C, 2 hours, then inoculated<br />
fungi or bacteria pure cultures <strong>to</strong> each glass bottle, respectively. Water content: 30%,<br />
culture temperature: 25°C, 360 days, 3 times.<br />
Humic acids were isolated from the soil samples, mild purification by successive HClsolution<br />
(pH 7.0) and centrifuge (8000 rpm., 20 min.) steps, and final freeze-drying.<br />
FT-IR spectra of HAs were recorded using a Nicolet 5 PC FT-IR spectrometer on KBr<br />
pellets obtained by pressing under vacuum uniformly prepared mixtures of 1 mg sample<br />
and 400 mg KBr, spectrometry grade, with precaution taken <strong>to</strong> avoid moisture uptake.<br />
3. RESULTS AND DISCUSSIONS<br />
The FT-IR spectra of soil HAs are substantially similar <strong>to</strong> each other, whereas the FT-<br />
IR spectra of the Fungi-HA (Fig. 1) differs markedly from the bacteria spectra in the<br />
relative intensity of several absorption peaks. The main features of these spectra are: (a) a<br />
band between 3400 and 3300 cm -1 , generally attributed <strong>to</strong> O-H and, secondarily, N-H<br />
stretching of various functional groups, which appears broader but relatively less intense<br />
for the Fungi-HAs than Bacteria-HA; (b) two peaks at about 2920 and 2850 cm -1 and a<br />
peak at about 1450 cm -1 , ascribed <strong>to</strong> aliphatic C-H groups, which are relatively more<br />
intense in fungi-HA than bacteria-HA; (c) a peak at 1720-1715 cm -1 and a broad<br />
absorption at about 1220 cm -1 , generally ascribed, the former <strong>to</strong> C=O stretching of COOH<br />
and other carbonyl groups, (d) a peak at about 1618.16 cm -1 , ascribed <strong>to</strong> aromaticity C=C<br />
stretching with bacteria-HA (Fig. 2). The results of FT-IR analysis confirm the existence of<br />
important st<strong>ru</strong>ctural and functional differences between fungi-HA and bacteria-HA, which<br />
mainly consist of a relatively greater aliphatic character, lower aromaticity, higher content<br />
of polysaccharide groups with fungi-HA. On the other hand, we can drown the same<br />
conclusion from the 2920/1720 rates of Relative intensity of main absorb peak of IR<br />
spect<strong>ru</strong>m (Table 1).<br />
188
Figure 1. IR spect<strong>ru</strong>m of HA at different time of fungi.<br />
Figure 2. IR spect<strong>ru</strong>m of HA at different time of bacteria.<br />
Table 1. Relative intensity of main absorb peak of IR spect<strong>ru</strong>m in HA.<br />
Microbe<br />
Bacteria<br />
Fungi<br />
Wave numbers, cm -1<br />
2920 2850 1720 1620 2920/1720<br />
41.651 17.908 22.534 17.907 2.643<br />
32.394 13.249 32.148 22.209 1.420<br />
33.625 11.410 34.652 20.313 1.300<br />
28.393 11.145 38.807 21.655 1.019<br />
35.951 11.708 34.986 17.356 1.362<br />
21.879 6.331 5.042 66.748 5.595<br />
189
4. CONCLUSIONS<br />
The results of FT-IR analysis confirm the existence of important st<strong>ru</strong>ctural and<br />
functional differences between fungi-HA and bacteria-HA. fungi-HA mainly consist of a<br />
relatively greater aliphatic character, bacteria-HA consist of a relatively higher aromaticity<br />
groups .<br />
ACKNOWLEDGEMENTS<br />
National Natural Science Foundation of China (NSFC) 40471076, and Foundation of<br />
University Doc<strong>to</strong>r’s Degree of China 20040193002.<br />
REFERENCES<br />
1. Tzafrir G., Yitzhak H., Yona C., 2007.fungal biology reviews, 21,179-189.<br />
2. Dehorter B, Blondeau R., 1992.FEMS Microbiology Letters.94,209-215.<br />
3. Gramss G., Ziegenhagen C., Sorge S., 1999. Microbial Ecology 37,140-151.<br />
4. Esham EC, Ye WY, Moran MA., 2000. FEMS Microbiology Ecology 34,103-111.<br />
5. Filip Z,Tesarova M., 2004.International Biodeterioration & Biodegradation 54,225-231.<br />
6. Carney KM, Hungate BA, Drake BG, Megonigal P, 2007.Proceedings of the National Academy<br />
of Sciences of the United States of America 104, 4990-4995.<br />
7. Lynch MDJ, Thorn RG., 2006. Applied and Environmental Microbiology 72,7050-7056.<br />
8. Deacon LJ, Pryce-Miller EJ, Frankland JC, Bainbridge BW, Moore PD, Robinson CH., 2006.<br />
Soil Biology and Biochemistry 38, 7-20.<br />
9. O’Brien HE, Parrent JL, Jackson JA, Moncalvo JM, Vilgalys R., 2005. Applied and<br />
Environmental Microbiology. 71, 5544-5550.<br />
10. Tuomela M, Vikman M, Hatakka A, Itavaara M., 2000.Biores. Technol. 72, 169-183.<br />
11. Machnikowska H, Pawelec K, Podgorska A., 2002. Fuel Processing Technology 77, 17-23.<br />
190
Impact on SOM of an Oxisol after Application of Sewer Effluent Treated<br />
by Brazilian Septic Cesspool Biodigester<br />
Wilson Tadeu Lopes da Silva 1 , Adriana Soares Faustino 1,2 , Ana Rita de Araújo Nogueira 3 ,<br />
Marcelo Luiz Simões 1 , Ladislau Martin-Ne<strong>to</strong> 1<br />
1 Brazilian Agricultural Research Corporation – Embrapa Agricultural Inst<strong>ru</strong>mentation. R. XV de<br />
Novembro, 1452, 13560-970, São Carlos / SP, Brazil, wilson@cnpdia.embrapa.br<br />
2 Federal University of São Carlos. Rod. Washing<strong>to</strong>n Luiz, km235, 13565-905, São Carlos/SP<br />
3 Brazilian Agricultural Research Corporation – Embrapa Cattle-Southeast. Rod. Washing<strong>to</strong>n Luiz,<br />
km 234, 13560-970, São Carlos / SP<br />
Keywords: sewer effluent, soil organic matter, humic acids<br />
1. INTRODUCTION<br />
The generation of effluent from the sewage treatment is increasing nowadays and so,<br />
its final disposition represents a manda<strong>to</strong>ry question <strong>to</strong> be answered. An alternative for this<br />
residue is its agricultural application as a substitute for mineral fertilizer. This practice,<br />
beyond inherent benefits due <strong>to</strong> nutrient recycling, promotes agricultural water reuse,<br />
which is responsible for around 70% of the <strong>to</strong>tal water consumption in Brazil.<br />
Embrapa Agricultural Inst<strong>ru</strong>mentation was developed a simple and inexpensive<br />
continuous system, based on anaerobic process, called “Septic Cesspool Biodigester”, <strong>to</strong><br />
treat the “black water” sewer (faeces and urine, only) generated by a residence with up <strong>to</strong><br />
5 persons (1). Fresh bovine manure is used as an inoculant <strong>to</strong> optimize the system<br />
efficiency. This system is intended <strong>to</strong> meet demands in <strong>ru</strong>ral areas which, in general, do<br />
not have sanitation installations.<br />
The effluent generated by Septic Cesspool Biodigester has alkaline character and<br />
significant salt concentrations with a high quantity of N-NH 4+ and low content of N-NO 3- ,<br />
characteristic of anaerobic systems (2). The effluent has a substantial quantity of plant<br />
macro and micro nutrients.<br />
The use of sewer effluent in agriculture is not recent, however, the impact of the use<br />
of this residue is not well unders<strong>to</strong>od regarding <strong>to</strong> clay stability (mainly due <strong>to</strong> sodium ion<br />
presence which can decreases the aggregate stability of the colloids) and on soil organic<br />
matter (SOM) content. The correct use of the effluent improves soil quality due <strong>to</strong> the<br />
incorporation of nutrients and fresh organic matter. However, excess of sewer effluent can<br />
change the SOM characteristics, due <strong>to</strong> the high availability of nutrients (mainly nitrogen<br />
and phospho<strong>ru</strong>s) <strong>to</strong> the soil microorganisms, favoring the increase in population of<br />
191
degraders using the natural organic matter present in the soil as carbon source. The result<br />
could be a decrease of SOM content, leaving only the most recalcitrant carbon.<br />
The objective of this work is <strong>to</strong> present some results about the impact of the use of<br />
treated sewer generated by Septic Cesspool Biodigesters on SOM and humic acids (HA),<br />
in a Brazilian tropical Oxisol, using chemical and spectroscopical methods.<br />
2. MATERIALS AND METHODS<br />
The soil, classified as Yellow-red La<strong>to</strong>sol, sandy phase, was submitted <strong>to</strong> the effluent<br />
application during three years and was used for a guava orchard. The effect of effluent<br />
application was analyzed in comparison <strong>to</strong> NPK mineral fertilization as well as <strong>to</strong> soil under<br />
a native forest nearby the orchard. The three treatments were: soil with addition of the<br />
treated effluent (about 50 L/tree each 3 month, during three consecutive years) (Sample<br />
“E”); addition of NPK mineral fertilizer as per agronomic recommendation during the same<br />
period (Sample “NPK”); and soil in native forest close <strong>to</strong> the experimental field (Sample<br />
“NF”).<br />
Soil samples were analyzed for pH, conductivity, macro and micro nutrient content,<br />
<strong>to</strong>tal organic carbon and humification by Laser Induced Fluorescence (LIF) (4). Soil HA<br />
were extracted according <strong>to</strong> IHSS method (5) and characterized by 13 C NMR spectroscopy<br />
(VA-CPMAS) (6).<br />
3. RESULTS AND DISCUSSION<br />
After three years of effluent application, the quantity of SOM increases slightly in<br />
comparison <strong>to</strong> the NPK fertilized soil (Figure 1A). This result shows that part of organic<br />
matter present in the effluent has becomes part of the SOM. Other soil parameters like<br />
electrical conductivity and pH were changed by effluent application. Them most significant<br />
change was in increase in pH. (data not shown). The nutrients status of the effluent treated<br />
soil was also greater than in the NPK fertilized soil (data not shown).<br />
Laser Induced Fluorescence (LIF) can be used <strong>to</strong> determine the humification degree<br />
of the whole SOM, with no extraction necessary (4). The results in Figure 1B show that the<br />
SOM in NPK treated soil has higher values of humification degree (HFIL), in comparison <strong>to</strong><br />
E and NF samples. HFIL increases with increase the depth for all samples and the NF-<br />
SOM had lower values at all depths. E-SOM has intermediate HFIL values between NPK<br />
and NF samples, due <strong>to</strong> incorporation of fresh carbon in the soil, from either the organic<br />
matter present in the effluent or the forests litter.<br />
192
Figure 2 shows relative percentage of aromatic and aliphatic groups present in the<br />
HA from different samples, by NMR spectroscopy. In soil E, there was a decrease of<br />
aliphatic content in the HA with depth, similar <strong>to</strong> the observed <strong>to</strong> the NF soil. The effluent<br />
releases organic matter <strong>to</strong> the soil that is high in simple st<strong>ru</strong>ctures like protein and<br />
polysaccharide derivatives from the biodigestion process, which is incorporated <strong>to</strong> the soil.<br />
The E soil had HA with distribution of different chemical groups more similar <strong>to</strong> the NF soil<br />
than the NPK soil, showing an improvement of the organic matter quality due <strong>to</strong> the<br />
effluent. HA from NPK soil presented higher aromatic content (mainly C aromatic , C-O aromatic<br />
and C carboxilic ) when compared <strong>to</strong> the E and NF humic acids. This result is expected since<br />
the use of mineral fertilizers can promotes the degradation of the most labile natural<br />
organic matter present in the soil, favoring the aromatic moieties in the remaining SOM.<br />
% C<br />
2,5<br />
2,0<br />
1,5<br />
1,0<br />
0-10 cm<br />
10-20 cm<br />
20-40 cm<br />
A<br />
H LIF<br />
800<br />
700<br />
600<br />
500<br />
400<br />
300<br />
B<br />
0-10 cm<br />
10-20 cm<br />
20-40 cm<br />
0,5<br />
200<br />
100<br />
0,0<br />
E NPK NF<br />
0<br />
E NPK NF<br />
Figure 1. Percentage of <strong>to</strong>tal carbon in the soil samples (A) and humification degree of<br />
SOM obtained by Laser Induced Fluorescence (LIF) (B). E: Soil fertilized with effluent;<br />
NPK: soil fertilized with mineral NPK and NF: soil from native forest.<br />
35<br />
30<br />
A<br />
E 0 - 10 cm<br />
E 10-20 cm<br />
30<br />
25<br />
B<br />
NPK 0 - 10 cm<br />
NPK 10-20 cm<br />
35<br />
30<br />
C<br />
NF 0 - 10 cm<br />
NF 10-20 cm<br />
25<br />
E 20-40 cm<br />
20<br />
NPK 20-40 cm<br />
25<br />
NF 20-40 cm<br />
Percentage<br />
20<br />
15<br />
10<br />
Percentage<br />
15<br />
10<br />
Percentage<br />
20<br />
15<br />
10<br />
5<br />
5<br />
5<br />
0<br />
C-aliph.<br />
N-aliph./methox.<br />
C-O-aliph.<br />
C-arom.<br />
C-O-arom.<br />
C-carbox.<br />
C-carbon.<br />
0<br />
C-aliph.<br />
N-aliph./methox.<br />
C-O-aliph.<br />
C-arom.<br />
C-O-arom.<br />
C-carbox.<br />
C-carbon.<br />
0<br />
C-aliph.<br />
N-aliph./methox.<br />
C-O-aliph.<br />
C-arom.<br />
C-O-arom.<br />
C-carbox.<br />
C-carbon.<br />
Figure 2. Relative areas from VA-CPMAS 13 C NMR spectra of HA extracted from soil<br />
fertilized with effluent (A); soil fertilized with NPK (B) and soil obtained from a native forest<br />
close <strong>to</strong> the experimental area (C).<br />
193
4. CONCLUSIONS<br />
The results showed a tendency for increase of carbon content in the soil after<br />
successive application of effluent. Data from FIL showed incorporation of fresh carbon in<br />
the soil from effluent or the forest decreased the index of humification, compared <strong>to</strong> NPK<br />
treatment. The use of 13 C NMR spectroscopy provides observations on the relative<br />
proportion of several functional groups present in the HA from different treatments. The HA<br />
in the E soil is more similar <strong>to</strong> the NF than the NPK treatment.<br />
ACKNOWLEDGEMENTS<br />
Authors thanks <strong>to</strong> Embrapa, CNPq and FAPESP. Authors thanks also <strong>to</strong> Santa<br />
Cândida Farm (Sobloco Group) for experimental area.<br />
REFERENCES<br />
1. Novaes, A.P.; Simões, M.L.; Martin-Ne<strong>to</strong>, L.; C<strong>ru</strong>vinel, P.E.; Santana, A.; Novotny, E.H.;<br />
Santiago, G.; Nogueira, A.R.A. Utilização de uma fossa séptica biodiges<strong>to</strong>ra para melhoria do<br />
Saneamen<strong>to</strong> Rural e desenvolvimen<strong>to</strong> da Agricultura Orgânica.<br />
http://www.cnpdia.embrapa.br/produ<strong>to</strong>s/img/fossa.pdf. Accessed at Feb<strong>ru</strong>ary 11, 2008.<br />
2. Novaes, A.P.; Simões, M.L.; Inamasu, R.Y.; Jesus, E.A.P.; Martin-Ne<strong>to</strong>, L.; Santiago, G.; da<br />
Silva, W.T.L. 2006. In: Gestão de Resíduos na Agricultura e na Agroindústria, Spadot<strong>to</strong>, C. &<br />
Ribeiro, W. (Eds.), FEPAF, Botucatu, pp. 262-275.<br />
3. Martin-Ne<strong>to</strong>, L.; Milori, D.M.B.P.; da Silva, W.T.L. (Eds.). 2004. Humic Substances and Soil<br />
and Water Environment. Embrapa/Rima, São Carlos, 763 p.<br />
4. Milori, D. M. B. P.; Galeti, H. V. A.; Martin-Ne<strong>to</strong>, L.; Diekow, J.; González-Pérez, M.; Bayer, C.;<br />
Sal<strong>to</strong>n, J. 2006. Soil Sci. Soc. Am. J. 70, 57-63.<br />
5. Swift, R.S. 1996. In: Methods of soil analysis. Part 3. Chemical methods, Sparks, et al. (Eds.)<br />
Soil Sci. Soc. Am. J. Book Series: 5 Madison, p.p. 1018-1020.<br />
6. Gonzalez-Perez, M.; Milori, D.M.B.P.; Colnago, L.A.; Martin-Ne<strong>to</strong>, L.; Melo, W.J. 2007.<br />
Geoderma. 138, 20-24.<br />
194
Organic Matter in Oxisol Profiles under Pasture Submitted <strong>to</strong> Periodic<br />
Burning in the Past<br />
Deborah Pinheiro Dick 1 , Rosane Martinazzo 2 , An<strong>to</strong>nio S. Mangrich 3 , Betania F. Pereira 3 ,<br />
Ricardo S.D. Dalmolin 4 , Heike Knicker 5<br />
1 Institute of Chemistry, UFRGS, Av. Ben<strong>to</strong> Gonçalves, 9500, Por<strong>to</strong> Alegre, 91340-440, Brazil;<br />
dpdick@iq.ufrgs.br<br />
2 Soil Science Department, Agronomy Faculty, UFRGS; Av. Ben<strong>to</strong> Gonçalves, Por<strong>to</strong> Alegre, Brazil<br />
3 Chemistry Department, UFPR, Curitiba, Brazil<br />
4 Soil Science Department, Centro de Ciências Rurais, UFSM, Santa Maria, Brazil<br />
5 Institute of Soil Science, T.U. Muenchen, Weihenstephan, Freising, Germany<br />
Keywords: subtropical highlands, organo-mineral interaction, black carbon<br />
1. INTRODUCTION<br />
The northeastern part of Rio Grande do Sul State (800 <strong>to</strong> 1300 m above sea level) is<br />
one of the coldest regions of Brazil, and the temperature in winter usually drops <strong>to</strong> below<br />
zero. The landscape is covered by native pasture and native forest of Araucaria<br />
angustifoli, and the fields have traditionally been used for cattle raising, which is the main<br />
economic activity of the region. The burning of the vegetation at the end of the winter<br />
season is a common and ancient practice, which aims <strong>to</strong> promote the pasture regrowth in<br />
a shorter time than compared with an unburned field. Beside the impact on the biodiversity<br />
and the contribution <strong>to</strong> the greenhouse effect, this agronomic practice may affect the<br />
chemical composition of the soil organic matter (SOM). Therefore, the present study aimed<br />
<strong>to</strong> evaluate the effect of periodic burnings on the composition of the SOM at different<br />
depths in a high altitude Oxisol (810 m, 28 0 38’ S / 51 0 34’ W) under pasture. The SOM of<br />
the same soil under native forest was also analyzed for comparison purposes.<br />
2. MATERIALS AND METHODS<br />
Soil samples from three representative locations in the sampling site were collected<br />
in four layers (0-5 cm, 0-20 cm, 20-40 cm, 40-60 cm) of a Red Oxisol (heavy clayey soil)<br />
from the following treatments: native pasture under biennial burning for more than 100<br />
years (BP), native pasture without burning in the last 41 years (NP) and native Araucaria<br />
forest (NF). The soil samples were treated with 10% (v/v) HF solution <strong>to</strong> remove the<br />
inorganic fraction(1). Previously <strong>to</strong> the HF treatment the samples were treated with 0,1 mol<br />
L -1 HCl and the C content in the supernatant was determined (Shimadzu TOC 500). The<br />
195
whole soil and the HF treated samples were analyzed (two replicates) by elemental<br />
analyses (Perkin Elmer 2400) and by Fourier Transformed Infrared spectroscopy (FTIR)<br />
(Shimadzu 8300). Based on the FTIR spectra an aromaticity index was calculated by<br />
dividing the intensity at around 1630 cm -1 by the intensity at 2920 cm -1 (I C=C /I C-H ). <strong>From</strong> the<br />
elemental composition the following indexes were calculated: C/N ratio before and after<br />
HF treatment, R fac<strong>to</strong>r (CN soil /C/N HF ), recovery of mass (M R ), of carbon (C R ) and of<br />
nitrogen (N R ) after HF treatment(1).<br />
The electron spin resonance spectroscopy (ESR) measurements of the HF treated<br />
samples were performed in a B<strong>ru</strong>ker ESP 300E spectrometer (9.5 GHz at 300 K and 77 K,<br />
quartz tubes with 3 mm I.D) (2). The relative concentration for semiquinone free radical<br />
(SFR), corrected for the sample carbon content (spin g -1 C), was calculated using a B<strong>ru</strong>ker<br />
strong pitch reference of known spin concentration. The solid state 13 C nuclear magnetic<br />
resonance spectroscopy (NMR CPMAS) spectra were recorded in a B<strong>ru</strong>ker DSX 200 (50.3<br />
MHz) using zirconium ro<strong>to</strong>rs of 7 mm OD with Kel-F caps that were spun at 6.8 kHz. The<br />
experiments were performed with a contact time of 1 ms, a 90 o 1 H-pulse width of 6.6 μs<br />
and a pulse delay of 300 ms. Between 4500 and 13000 scans were accumulated and a<br />
line broadening between 50 and 100 Hz was used. The 13 C chemical shifts are reported<br />
relative <strong>to</strong> tetramethylsilane scale (=0 ppm) and their assignments were as follows(3): 0–<br />
45 ppm, alkyl C; 45–110 ppm, methoxyl and N-alkyl C + O-alkyl C; 110–160 ppm, aromatic<br />
C + phenol C; 160–220 ppm, carbonyl C. The <strong>to</strong>tal signal intensity and the relative<br />
intensity (proportion) of each functional group were obtained by integrating the spectral<br />
regions with the integration routine of the spectrometer.<br />
3. RESULTS AND DISCUSSION<br />
In respect <strong>to</strong> the SOM content, the treatments differed mainly in the superficial layer<br />
(0-5 cm), where C and N contents in BP were lower than in NP (Table 1). The greater<br />
values in NF are probably related <strong>to</strong> higher residue input generally observed in forests.<br />
The C R varied from 33 <strong>to</strong> 82% and decreased with depth in all three soil uses (Table 1).<br />
The HCl pre-treatment removed at most 3.5% of the <strong>to</strong>tal C, indicating that great part of<br />
the SOM, lost during the HF treatment, was associated <strong>to</strong> iron oxides through organomineral<br />
complexes. By the dissolution of these minerals, hydrophilic and low molecular<br />
weight compounds dissolved in the acid solution and were removed by sample washing<br />
out. In the samples under pasture, the lowest values for C R were observed for BP,<br />
suggesting that in this site the SOM contained higher proportions of mineral associated<br />
organic compounds. The line width for Fe +3 in the room temperature ESR spectra (around<br />
g ≈ 2) varied between 730 and 1400 G and decreased from NF <strong>to</strong> BP <strong>to</strong> NP, showing that<br />
196
the degree of oxidation decreases in the same order (data not shown). Within each<br />
treatment, the same behavior was observed along the profile. The values of the line width<br />
(G) for the SFR were lowest in the 0-5 cm and highest in the 40-60 cm layer. This behavior<br />
was similar in the three soil uses and was attributed <strong>to</strong> an increase of the interaction<br />
between SFR and Fe +3 with depth. Concerning the ESR parameters for the organic free<br />
radicals, the three samples presented similar values both for the g fac<strong>to</strong>r and the spin<br />
concentration. The spin concentration varied between 7.5x10 16 and 1.2x10 17 spins g C -1<br />
and is comparable <strong>to</strong> those reported in the literature for SOM from other Brazilian Oxisols<br />
(1). The values of spin concentration tend <strong>to</strong> decrease with depth, with a parallel increase<br />
of the aromaticity degree, inferred from the FTIR index, and of the content of aromatic C<br />
determined by 13 C NMR (Table 2). In all sites the content of carboxylic C (NMR) also<br />
increased with depth. The 13 C NMR spectra of the SOM from the burned and from the notburned<br />
pasture were relatively similar and no major differences in the chemical<br />
composition were identified. In all samples the C O-alkyl group was the most abundant<br />
and no significant black carbon contribution was detected.<br />
4. CONCLUSIONS<br />
The biennial burning of the native pasture in a subtropical Red Oxisol reduces the<br />
content of SOM, mainly in the superficial layer. This effect may be related <strong>to</strong> the lower<br />
residue input in the burned pasture as compared <strong>to</strong> the not burned one. Major differences<br />
in the chemical composition of the SOM due <strong>to</strong> the burning or due <strong>to</strong> the soil use were not<br />
detected in the present study. Possibly, the fire at the end of winter, when the environment<br />
is relatively humid and cold, does not affect significantly the SOM quality. Nevertheless,<br />
the burning seems <strong>to</strong> favor the formation of smaller and more oxidized organic st<strong>ru</strong>ctures,<br />
which are more affected by the stabilizing effect of the organo-mineral complexes with iron<br />
oxides. The SOM from the native forest showed a higher content of both aryl and alkyl C in<br />
comparison <strong>to</strong> the pasture sites. This higher SOM hydrophobicity in the samples under<br />
Araucaria forest is possibly a consequence of the vegetation type.<br />
ACKNOWLEDGEMENTS<br />
The authors thank CAPES and CNPq (Brazil) and DAAD (Germany).<br />
REFERENCES<br />
1. Dick, D. P. et al. 2005. Geoderma, 124:319-333.<br />
2. Lombardi, K. C. et al. 2002. Journal of the Brazilian Chemical Society, 13:270-275.<br />
3. Knicker, H. & Lüdemann, H.D., 1995 Org. Geochem., 23: 329-341.<br />
197
Table 1. Sample depth, C and N values before and after HF treatment, FTIR aromaticity<br />
Sample<br />
Depth<br />
(cm)<br />
index and g fac<strong>to</strong>r for the Fe +3 of the ESR spectra<br />
C<br />
(%)<br />
N<br />
(%)<br />
C/N C/N HF<br />
M R<br />
(%)<br />
C R<br />
(%)<br />
I C=C /<br />
I C-H<br />
C HCl /C soil<br />
(%)<br />
g fac<strong>to</strong>r<br />
for Fe +3<br />
300K<br />
NF 0 – 5 6.3 0.54 12 14 13.0 70.6 1.3 2.4 2.171 2.308<br />
77K<br />
0 – 20 4.2 0.34 13 14 9.7 64.0 1.5 2.6 2.244 2.581<br />
20 – 40 2.5 0.17 15 17 6.8 45.4 2.7 2.5 2.115 2.356<br />
40 – 60 1.9 0.12 16 17 4.8 36.3 2.5 3.5 2.044 2.057<br />
NP 0 – 5 4.4 0.35 13 13 9.0 63.6 1.5 2.5 2.031 2.057<br />
0 – 20 3.5 0.28 13 15 7.9 81.7 1.3 2.8 2.035 2.053<br />
20 – 40 2.6 0.18 14 15 5.7 57.6 1.9 2.3 2.013 2.024<br />
40 – 60 1.9 0.12 16 15 3.9 49.8 2.9 2.2 2.016 2.024<br />
BP 0 – 5 4.1 0.29 14 16 7.7 47.3 1.2 2.2 2.063 2.066<br />
0 – 20 3.2 0.22 15 15 7.3 54.5 1.4 2.9 2.066 2.060<br />
20 – 40 2.5 0.16 16 14 4.8 47.2 1.8 2.9 2.047 2.050<br />
40 – 60 2.0 0.14 15 14 3.0 32.8 2.3 2.9 2.040 2.024<br />
Table 2. Proportions of C-functional groups determined by 13 C NMR<br />
Sample<br />
Proportion of C groups (%) / chemical shift (ppm)<br />
Depth (cm) Alkyl C O-alkyl C Aromatic C Carbonyl C O-Alkyl/Alkyl<br />
NF 0-5 30.0 38.7 19 12.3 1<br />
0-20 25.6 35.9 22.8 15.8 1.1<br />
20-40 21.1 33.7 28.8 16.5 1.2<br />
40-60 19.6 32.6 29.2 18.6 1.3<br />
NP 0-5 22.8 47.7 16.4 13.2 1.7<br />
0-20 23.1 47.8 16.8 12.3 1.6<br />
20-40 19.4 41.9 22.6 16.2 1.7<br />
40-60 20.1 38.6 24.6 16.7 1.5<br />
BP 0-5 21 47.2 17.8 14 1.8<br />
0-20 21.5 46.8 17.7 13.8 1.8<br />
20-40 16.8 42.5 23 17.7 2.1<br />
40-60 20.2 37.9 22 20 1.4<br />
198
Chemical and Spectroscopic Characterization of Humic Acids Isolated<br />
from Urban Soils<br />
Valeria D’Orazio, Andreina Traversa, Nicola Senesi<br />
Dipartimen<strong>to</strong> di Biologia e Chimica Agroforestale e Ambientale, Università di Bari, Italy,<br />
dorazio@agr.uniba.it<br />
Keywords: forest litter, humic acids, fluorescence spectroscopy<br />
1. INTRODUCTION<br />
Urban soils can be defined as all soils influenced extensively by human activities in<br />
the urban landscape (1). Thus, soils in urban areas may contain a mixture of natural humic<br />
substances and anthropogenic organic particles, such as carbonaceous material like<br />
debris, ash, waste of various origin, as well as airborne particles. Compared <strong>to</strong> their<br />
natural counterparts, such soils may show substantially different behaviour <strong>to</strong>wards<br />
environmentally hazardous compounds, and altered microbial activity (2). It is well known<br />
that organic matter (OM) plays an essential and dominant role in preserving the soil from<br />
pollution of agricultural and anthropic origin, therefore in an urban environment OM is of<br />
considerable ecological significance.<br />
The aim of this work was <strong>to</strong> study the chemical and spectroscopic properties of humic<br />
acids (HAs) isolated from urban soils in order <strong>to</strong> identify their role as potential markers for<br />
the environmental risk management and prevention of organic chemical pollution in<br />
selected areas.<br />
2. MATERIALS AND METHODS<br />
Soil <strong>to</strong>p surface layers (0-5 cm) were sampled from four sites of the city of Ancona<br />
(center Italy) with the following use: a) Palombella (P, an area in the outskirts, disused<br />
after the landslide of 1982 and close <strong>to</strong> a main road); b) Duomo (D, a flower bed on the<br />
hill<strong>to</strong>p overbearing the city, very ventilated area); c) Porta Pia (PP, a flower bed in the<br />
urban core area, with intense vehicular traffic); and d) Por<strong>to</strong> Dogana (PD, a flower bed on<br />
the harbour ingress, with very intense vehicular traffic).<br />
HAs were isolated from soil samples according <strong>to</strong> the procedure suggested by IHSS,<br />
and characterized by elemental analysis, ratio of absorbances at 465 and 665 nm (E 4 /E 6 ),<br />
functional group content, Fourier transform infrared (FT IR) and <strong>to</strong>tal luminescence<br />
spectroscopies.<br />
199
3. RESULTS AND DISCUSSION<br />
Chemical and spectroscopic data shown on Table 1 evidence important differences<br />
in the elemental composition of HAs from flower bed with respect <strong>to</strong> HA from disused soil,<br />
which shows the highest C, H and S contents and C/N ratio, and the lowest O content, and<br />
O/C and E 4 /E 6 ratios. These results suggest a larger amount of C-containing st<strong>ru</strong>ctures<br />
with a character prevalently aromatic of the P-HA sample with respect <strong>to</strong> the other HAs.<br />
The highest and the lowest, respectively, COOH and N contents measured in the D-HA<br />
sample can be likely correlated <strong>to</strong> a greater oxidation. This is supported also by the high O<br />
content.<br />
Table 1. Elemental composition (mg kg -1 ) moisture and ash free, a<strong>to</strong>mic ratios, carboxylic<br />
group contents (meq COOH g -1 HA) and E 4 /E 6 ratio of the HAs examined<br />
HA C H N S O C/N C/H O/C COOH E 4 /E 6<br />
P 635.8 68.4 52.6 16.8 226.4 14.1 0.8 03 3.24 5.2<br />
D 544.6 56.4 51.1 5.8 342.1 12.4 0.8 0.5 3.88 7.4<br />
PP 579.8 64.5 62.2 7.4 286.1 10.9 0.7 0.4 3.29 7.3<br />
PD 571.8 60.6 59.4 8.4 299.9 11.2 0.8 0.4 3.32 5.7<br />
FT IR spectra of the four HAs (Fig. 1) feature some common IR absorptions having<br />
similar or different relative intensities, and some relevant differences in the “fingerprint”<br />
region. In particular, P-HA and D-HA samples are characterized, with respect <strong>to</strong> the other<br />
two HAs, by slightly more intense absorption bands of aromatic st<strong>ru</strong>ctural moieties (3070<br />
and 1654 cm -1 ), and COOH groups (1715 and 1227 cm -1 ) respectively. No distinctive<br />
feature are evident in the FT IR spectra of PP- and PD HA samples.<br />
P<br />
D<br />
Transmittance %<br />
PP<br />
PD<br />
145<br />
122<br />
285<br />
103<br />
292<br />
171 138<br />
154<br />
307<br />
165<br />
400 Wavenumbers (cm -1 )<br />
400<br />
Figure. 1. FT IR spectra of the four HAs examined.<br />
200
P-HA<br />
E x /E m 340/404<br />
FI 482<br />
E x /E m 260/396<br />
FI 682<br />
D-HA<br />
E x /E m 435/513<br />
FI 66<br />
E x /E m 395/507<br />
FI 67<br />
PP-HA<br />
E x /E m 440/509<br />
FI 115<br />
E x /E m 395/474<br />
FI 108<br />
500<br />
PD-HA<br />
E x /E m 440/519<br />
FI 70<br />
E x /E m 395/486<br />
FI 68<br />
Ex<br />
250<br />
300 Em 600<br />
Figure 2. Total luminescence spectra of the four Has examined.<br />
Total luminescence spectra (TLS) of HAs in the form of excitation-emission matrices<br />
(EEMs, con<strong>to</strong>ur maps) are shown in Figure 2. The maps reported in Fig. 2 indicate the<br />
occurrence presence of two major fluorophores in the HA macromolecules, each of them<br />
characterized by an own excitation/emission wavelength pair (EEWP). As it is well known,<br />
a number of different st<strong>ru</strong>ctures can act as potential contribu<strong>to</strong>rs <strong>to</strong> the fluorescence<br />
behaviour of HAs, and their identification is intrinsically difficult. In general, the TLS of HAs<br />
from the flower beds are characterized by the occurrence of two common fluorophores,<br />
localized by EEWPs at about 435-440/509-519 nm and 395-405/486-507 nm, likely<br />
attributed <strong>to</strong> highly conjugated phenols and quinoids (3). Different fluorophores are evident<br />
201
in TL spect<strong>ru</strong>m of P-HA sample, which is characterized by the presence of two main<br />
fluorophores in the medium and short wavelenght regions. In particular, the two peak are<br />
indentified by the EEWPs at 340/404 nm and 260/396 nm, attributable, respectively, <strong>to</strong><br />
st<strong>ru</strong>ctural units like <strong>to</strong> hydroxyquinolines and/or coumarins, and <strong>to</strong> very simple st<strong>ru</strong>ctures,<br />
like components of proteinaceous origin such as tryp<strong>to</strong>phan and tyrosine (4). The<br />
fluorescence intensity (FI) values of both peaks result strongly higher in the P-HA as<br />
compared <strong>to</strong> those of the HAs from flower beds, between which the greater values are<br />
shown by PP-HA sample, and similar values are measured for D- and PD-HAs.<br />
As reported on literature (5), fluorescence pattern and intensity are strictly depending<br />
on the st<strong>ru</strong>ctural and molecular properties of the humic substances, that is on their origin.<br />
The shorter EEWPs and higher FI values found in the P-HA sample indicate the<br />
occurrence of simple st<strong>ru</strong>ctural components and a low degree of aromatic<br />
polycondensation. In addition, the FI values could be ascribed also <strong>to</strong> the occurrence of<br />
electron-donating substituents, such as hydroxyl, methoxyl, and amino groups on low<br />
molecular weight molecules. On the contrary, the longer EEWPs and lower FI values<br />
measured in the HAs from flower beds suggest the presence of large molecular weight<br />
components possessing linearly-condensed aromatic ring systems bearing electronwithdrawing<br />
substituents, such as carbonyl and carboxyl groups, and/or <strong>to</strong> other<br />
unsaturated bond systems capable of a great degree of conjugation.<br />
4. CONCLUSIONS<br />
The chemical and spectroscopic data shows important differences between the HA<br />
samples examined, and the results obtained are in good agreement with the related soil<br />
use. In particular, the HA from the Palombella site is poorly condensed and extremely rich<br />
in S content, probably because of the landslide which completely covered all the area. On<br />
the other hand, the HAs from the flower beds show similar features, with some differences,<br />
especially in the D-HA, which exhibits a greater oxidation compared <strong>to</strong> PP- and PD-HAs,<br />
likely due <strong>to</strong> less intense disturbance and maintenance.<br />
ACKNOWLEDGEMENTS<br />
This work was supported partially by the Ministry of University and Research,<br />
Research Project of National Relevance – 2005.<br />
REFERENCES<br />
1. De Kimpe, C.R., Morel, J.-L., 2000. Soil Sci. 165, 31– 40.<br />
2. Beyer, L., Kahle, P., Kretschmer, H., WU, Q., 2001. J. Plant Nutr. Soil Sci. 164, 359– 364.<br />
3. Wolfbeis O. S. 1985. In: <strong>Molecular</strong> Luminescence Spectroscopy Part I: Methods and<br />
Applications. Schulman, S.G. (Ed.), Wiley, New York, pp. 167-370.<br />
4. Chen, J., LeBoeuf, E.J., Dai, S., Gu, B. 2003. Chemosphere 50, 639-647.<br />
5. Senesi, N., Miano, T.M., Provenzano, M.R., B<strong>ru</strong>netti, G. 1991. Soil Science 152, 259-271.<br />
202
Effect of Different F<strong>ru</strong>it Tree Cultivation on Humic Substances<br />
and Soil Properties<br />
Michal Licznar, Stanislawa E. Licznar, Jerzy Drozd, Jerzy Weber<br />
Wroclaw University of Environmental and Life Sciences, Institute of Soil Science and<br />
Environmental Protection, G<strong>ru</strong>nwaldzka 53, 50-357 Wroclaw, Poland, drozd@ozi.ar.wroc.pl<br />
Keywords: soil humic substances, herbicide fallow, orchard, tree species<br />
1. INTRODUCTION<br />
Long-term herbicide fallow management of orchard leads <strong>to</strong> soil enrichment with<br />
organic matter originated only from cultivated plant, what may influence biological activity<br />
(3) and decide on the direction of humification processes. Although input of plant remnants<br />
play a c<strong>ru</strong>cial role in humification processes, there are very few papers dealing with<br />
influence of different plant species on soil humus (2). The objective of the study was <strong>to</strong><br />
determine the effect of different f<strong>ru</strong>it trees monocultures treated with herbicide fallow on<br />
the physicochemical properties of the soil and the composition of humus compounds.<br />
2. MATERIALS AND METHODS<br />
The study was conducted in the Lower Silesia region (Poland), at the Orchard<br />
Experimental Station in Samotwor, belonging <strong>to</strong> the Wroclaw University of Environmental<br />
and Life Sciences. Five orchard quarters were established on Haplic Luvisol developed<br />
from silt loam (USDA), as follows: cherry tree (P<strong>ru</strong>nus cerasus L.) - object 1, natural<br />
crossing cherry x sweet cherry tree (P<strong>ru</strong>nus cerasus L. x P<strong>ru</strong>nus avium L.) - object 2,<br />
peach tree (P<strong>ru</strong>nus persica L.) - object 3, sweet cherry tree (P<strong>ru</strong>nus avium L.) - object 4,<br />
and apple tree (Malus sp.) - object 5. The number of trees per hectare were 833 (for<br />
objects 1 , 4 and 5), 626 (for object 3), and 333 (for object 2). Trees were maintained in<br />
rows on 1.4 m wide strips of herbicide fallow.<br />
Soil samples were taken 15 years after the orchard had been established, from the<br />
depth of 5-15 cm. Samples were taken between trees in 5 replications, and the following<br />
soil properties were determined: organic carbon (C org ), pH KCl , hydrolytic acidity (H + h ),<br />
exchangeable cations (K + , Na + , Ca 2+ , Mg 2+ ) extracted with 1 M NH 4 Cl. Cation exchange<br />
capacity (CEC), the sum of base cations (BC), and base saturation (BS) were calculated<br />
on the basis (H + h ) and exchangeable cations. Results were statistically verified at the<br />
confidence level of P = 0.05.<br />
203
Humic and fulvic acids were separated from the following fractions (except F1),<br />
extracted according <strong>to</strong> a modified method of Tiurin:<br />
(F1): low molecular fraction, extracted with 0.05 M H 2 SO 4 (so called decalcification),<br />
(F2): free, as well as Ca- and non-silicate R 2 O 3 bound humic substances, extracted<br />
with 0.1 M NaOH (extracted from residuum after F1),<br />
(F3): silicate R 2 O 3 bound humic substances, extracted by alternately treatment with<br />
0.1 M H 2 SO 4 and 0.1 M NaOH (extraction from residuum after F2),<br />
(F4): free, as well as non-silicate R 2 O 3 bound humic substances, extracted with 0.1 M<br />
NaOH (extraction from non-treated sample - no F1 extraction),<br />
Ca- bound humic acids (CHA ca ) were calculated from difference between humic acids<br />
in F2 and F4.<br />
3. RESULTS AND DISCUSSION<br />
The results of the study indicate that the 15-year cultivation of f<strong>ru</strong>it trees affected the<br />
properties of the soil with different intensity. Soil under natural crossing cherry tree x sweet<br />
cherry tree (object 2) and peach tree (object 3) indicated significant increase of hydrolytic<br />
acidity, and decrease of base saturation (Table 1). Acidification process observed in these<br />
objects (2 and 3) did not affect the sum of base cations (BC), however significantly higher<br />
amounts of Ca +2 was found in soil under apple trees (object 5).<br />
Table 1. Some physical-chemical properties of soils<br />
+<br />
Exchangeable cations<br />
H h BC CEC<br />
Object pH Ca 2+ Mg 2+ K + Na + KCl BS, %<br />
cmol (+) ⋅ kg -1<br />
1 5.8-6.4 1.54 4.47 1.48 0.54 0.21 6.70 8.24 81<br />
2 5.1-6.2 2.26 3.64 1.51 0.55 0.20 5.85 8.11 72<br />
3 4.3-5.9 2.53 3.97 1.34 0.57 0.15 6.03 8.56 70<br />
4 5.9-6.3 1.51 4.79 1.75 0.52 0.18 7.24 8.75 83<br />
5 5.9-6.3 1.53 5.16 1.39 0.48 0.16 7.19 8.72 82<br />
LSD 0.05 0.58 0.99 0.41 0.26 0.08 1.40 1.30 7<br />
The planted tree species affect the level of organic matter influx <strong>to</strong> the soil, as well as<br />
conditions of organic matter mineralization and humification. In result, the content of C org in<br />
soil under cherry tree (object 1) and natural crossing cherry tree x sweet cherry tree<br />
(object 2) was significantly higher than in other objects (Table 2). Humic substances in<br />
these objects (1 and 2) indicated significantly bigger amounts of non-extracted carbon,<br />
corresponding <strong>to</strong> humin fraction. The lowest amounts of this fraction, representing the<br />
most stable humus complexes, was found in object 5 (apple trees). On the contrary, the<br />
204
content of so called “fulvic fraction”, representing low molecular fraction (F1), did not differ<br />
in particular objects, with an exception of object 5 (apple tree), where it reached 7.0 % of<br />
C org. Furthermore, the biggest share of fulvic acids found in object 5, particularly in F3,<br />
pointed out that organic matter in soils under apple trees is clearly slower transformed in<strong>to</strong><br />
high molecular humics.<br />
In all orchard quarters, as usually in other soils, dominated F2 fraction extracted from<br />
the soil after decalcification. Contents of free, as well as Ca- and non-silicate R 2 O 3 bound<br />
humic substances (F2) were significantly lower in objects 1 and 2 (cherry tree and natural<br />
crossing cherry x sweet cherry tree) while objects 5 and 3 (apple and peach trees,<br />
respectively) differ markedly form the other by bigger values. Amounts of humic and fulvic<br />
acids (CHA 2 and CFA 2 ) varied proportionally <strong>to</strong> the content of F2 fraction, and the<br />
CHA 2 /CFA 2 ratio ranged around 1.5 in all objects.<br />
Table 2. Fractional composition of humic substances<br />
C extracted (% of <strong>to</strong>tal C)<br />
C<br />
F1 F2 F3<br />
g . kg -1 non-<br />
CHA 2 CFA 2 CHA 3 CFA 3 extr. CHA 4 CFA 4 CHA Ca<br />
Object<br />
C org<br />
F4<br />
F2 - F4<br />
1 10.73 4.1 21.4 13.0 6.1 1.9 53.5 10.9 10.6 10.5<br />
2 10.90 3.7 19.3 13.5 4.8 2.5 56.2 11.1 11.7 8.2<br />
3 9.04 4.2 27.7 16.6 6.9 1.3 43.3 19.9 14.3 7.8<br />
4 8.95 4.4 25.8 17.9 8.4 2.1 41.4 12.3 13.1 13.5<br />
5 8.20 7.0 28.2 18.1 6.6 3.5 36.6 11.6 15.2 16.6<br />
LSD 1.05 1.7 4.5 3.3 1.4 0.8 6.5 3.6 2.5 6.3<br />
Accumulation of specific organic substances in soils under particular orchard<br />
quarters affects the content of humus compounds bound with mineral components of the<br />
soil. In objects 4 and 5 (sweet cherry and apple trees) the content of F3 fraction was<br />
significantly higher than in other objects. Notably, humic acids extracted in F3 fraction<br />
(CHA 3 ) clearly predominated over fulvic acids (CFA 3 ). Particularly high values of the<br />
CHA 3 /CFA 3 ratio were found in objects 3 and 4 (peach and sweet cherry trees).<br />
As it was mentioned earlier, soils of objects 3 and 2 (peach and natural crossing<br />
cherry x sweet cherry trees) indicated significantly lower base saturation (BS), while soil of<br />
object 5 (apple tree) indicated significantly higher share of exchangeable Ca +2 and BS.<br />
These soil properties turned up in humics composition. The share of Ca- bound humic<br />
acids (CHA Ca ) of object 2 and 3 were significantly lower then those of object 5.<br />
205
An important role in determining soil properties, apart from those extracted in F2,<br />
plays free humus complexes and those bonded with non-silicate forms of R 2 O 3 (F4).<br />
However, the content of fraction F4 depends on soil physicochemical properties, as well.<br />
Those relationships are supported by statistic data, indicating significant correlation<br />
coefficients between F4 and values of pH (r = -0.513), as well as Hh (r = 0.518). These<br />
relations were especially marked for Ca- bound humic acids (CHA ca ), indicating a<br />
significant correlation with pH (r = 0.478), Hh (r = 0.500), the content of exchangeable Ca 2+<br />
(r = 0.44), and BS (r = 0.60).<br />
Presented data confirm that monoculture orchard cultivation with herbicide fallow<br />
may result in differentiation of soil physicochemical properties (1), and consequently<br />
humus composition. Differences in soil organic matter inputs and turnover, as well as<br />
variation in plant residues accumulated under particular monoculture plantations, lead <strong>to</strong><br />
their different susceptibility <strong>to</strong> transformation processes. Apart of that, orchard floor<br />
management practice affect soil microbial community abundance, activity, and<br />
composition (3), that play c<strong>ru</strong>cial role in humification processes. The specific chemical<br />
composition of organic residue in cherry tree and the natural crossing cherry trees x sweet<br />
cherry trees probably slows down their transformations, which may result in a higher<br />
content of organic carbon in soil and a lower degree of organic matter humification.<br />
4. CONCLUSIONS<br />
1. Effect of monoculture orchard plantation on soil properties and humic substances<br />
composition may be noticed as early as after 15 years, depending on plant species.<br />
2. Plantations of cherry tree and the natural crossing cherry tree x sweet cherry tree<br />
contribute <strong>to</strong> significant increase of soil organic matter, which is dominated by the most<br />
stable humic compounds.<br />
3. Character of organic remnants under apple and peach trees stimulate humification<br />
processes, which result in bigger amounts of humic acids.<br />
4. Peach and natural crossing cherry x sweet cherry monocultures caused significant<br />
decrease of base saturation, and consequently lower amount of Ca bound humic acids.<br />
REFERENCES<br />
1. Bielinśka, E.J., Pranagal, J. 2007. Polish Journal of Environmental Studies, 16, (2), 295-300.<br />
2. Nascimen<strong>to</strong>, V.M., Almendros, G., Fernandes, F.M. 2007. Geoderma, 137-150.<br />
3. Yao, S., Merwin, I.A., Bird, G.W., Abawi, G.S.,Thies, J.E. 2005. Plant and Soil, 271, 1-2, 377-<br />
389.<br />
206
Long-Term Effects of Wildfires in the Characteristics of Soil Organic<br />
Matter: a Study in Mediterranean Sh<strong>ru</strong>blands<br />
Beatriz Duguy 1,3 , Pere Rovira 2 , V. Ramón Vallejo 1,3<br />
1 CEAM, Ch Darwin 14, 46980 Paterna, València, Spain, beatriz.duguy@gmail.com<br />
2 CTFC, Pujada del Seminari s/n, 25280 Solsona, Spain<br />
3 Facultat de Biologia, Universitat de Barcelona, Diagonal 645, 08028 Barcelona, Spain<br />
Keywords: wildfires, C availability, labile and recalcitrant C, thermal properties<br />
1. INTRODUCTION<br />
Fire is a major ecological fac<strong>to</strong>r in Mediterranean terrestrial ecosystems, and it has<br />
been repeatedly demonstrated <strong>to</strong> have an immediate effect on the chemical characteristics<br />
of soil organic matter (1, 2). Nevertheless, Mediterranean ecosystems (and in particular<br />
sh<strong>ru</strong>blands), which are often affected by recurrent fires, are usually very resilient <strong>to</strong> fire. If<br />
the inputs of fresh organic matter <strong>to</strong> the soil (or, at least, part of these inputs) are quickly<br />
res<strong>to</strong>red, the short-term effects of fire on the soil may be difficult <strong>to</strong> detect when the study<br />
is carried out beyond the first years after the perturbation.<br />
The aim of this communication is <strong>to</strong> gain insight on this matter. Here we present data<br />
about SOM characteristics in a set of sh<strong>ru</strong>bland plots characterized by different land-use<br />
and fire his<strong>to</strong>ries.<br />
We focused on the detection of possible increases in the recalcitrance of SOM,<br />
and/or decreases in C availability for the soil microflora due <strong>to</strong> recurrent fires.<br />
2. MATERIALS AND METHODS<br />
The study was carried out in La Vall de Gallinera, in Alacant province (eastern<br />
Spain). The mean temperature is 17.4ºC and the mean annual precipitation is 825 mm.<br />
Soils are mostly Lep<strong>to</strong>sols over limes<strong>to</strong>ne, and calcaric Cambisols over marls. Most<br />
agricultural fields were cultivated until the 1960s. After abandonment, the vegetation<br />
reverted <strong>to</strong> secondary sh<strong>ru</strong>bland communities of the Rosmarino-Ericion alliance Br.-Bl.<br />
1931. The region has suffered frequent fires since the 1970s.<br />
In the experimental, we selected a set of plots according <strong>to</strong> two fac<strong>to</strong>rs:<br />
(a) Land use: never cropped (henceforth, NC), early abandoned (EA: set-aside<br />
before 1978), recently abandoned (RA: set-aside after 1978).<br />
(b) Number of wildfires since 1976: either 0, 1 or 2.<br />
207
The number of plots found for each combination was not the same, and for one of the<br />
combinations (RA, 2 fires) no plots were found. On each plot, 4 randomly chosen points<br />
(first 5 cm of mineral soil) were sampled. Litter was not included in the sampling. Soil<br />
samples were air-dried, sieved <strong>to</strong> 2 mm, and a subsample was ground in an agatha mortar<br />
for chemical analysis. Total organic carbon was analyzed by dichromate oxidation in an<br />
aluminium heating block at 155ºC.<br />
Extraction with hot water has been used <strong>to</strong> obtain the most available fraction of SOM.<br />
Hot-water extract was obtained from ungrounded samples, in sealed Pyrex tubes, in a<br />
heating block at 105ºC for 1 h, and was recovered by centrifugation and filtration through a<br />
Whatman GF/A glass fiber filter. The extract was analyzed for organic carbon by<br />
dichromate oxidation (hot-water OC: HWOC), for aromaticity by absorption at 280 nm of a<br />
solution previously adjusted <strong>to</strong> 10 mg l -1 of OC, by carbohydrates by the phenol-sulphuric<br />
method, and polyphenolics by the Folin-Denis method.<br />
The thermal properties of SOM were obtained in samples previously demineralized<br />
by a repeated treatment with HF 10%. Thermal properties are taken as indica<strong>to</strong>rs of<br />
recalcitrance; recalcitrant forms of C (polyphenolics, lignin, the resistant core of humic<br />
substances, and in particular charcoal and other black carbon forms) are highly<br />
thermoresistant. Differential thermogravimetry curves (DTG) were obtained in a Mettler-<br />
Toledo TGA-851e thermobalance, and differential scanning calorimetry curves (DSC) in a<br />
Mettler-Toledo DSC-822e calorimeter. In both cases, the temperature was raised at a rate<br />
of 3ºC min -1 , up <strong>to</strong> 600ºC.<br />
3. RESULTS AND DISCUSSION<br />
Data about <strong>to</strong>tal C and N accumulation in the studied plots have been published<br />
previously (3). Here we give a summarized advance of some of our results concerning<br />
SOM quality. As shown in Fig. 1, the changes in organic matter availability (HWOC) due <strong>to</strong><br />
repeated wildfires seem <strong>to</strong> depend on previous land use: no detectable changes in never<br />
cropped plots, a trend <strong>to</strong> decrease in early abandoned plots, and an increase in recently<br />
abandoned plots (Fig. 1, A). The carbon in the extract becomes more aromatic as fire<br />
recurrence increases, even though the increase in aromaticity reaches the significance<br />
only in early abandoned plots (Fig. 1, B). As for other indica<strong>to</strong>rs of the quality of the<br />
HWOC, no significant changes were detected in the proportion of carbohydrate C relative<br />
<strong>to</strong> <strong>to</strong>tal HWOC (Fig. 1, C), whereas the abundance of polyphenolics in it seems <strong>to</strong> increase<br />
(Fig. 1, D), in agreement with the results obtained for aromaticity.<br />
208
HWOC (% of <strong>to</strong>tal OC)<br />
4 0 fires<br />
1 fire<br />
2 fires<br />
3<br />
2<br />
1<br />
ns<br />
*<br />
*<br />
A<br />
ns<br />
*<br />
ns<br />
B<br />
0.4<br />
0.3<br />
0.2<br />
0.1<br />
Absorption at 280 nm<br />
0<br />
0.0<br />
Carbohydrate C (% of <strong>to</strong>tal HWOC)<br />
40<br />
30<br />
20<br />
10<br />
0<br />
ns<br />
ns<br />
ns<br />
NC EA RA<br />
C<br />
* * *<br />
NC EA RA<br />
D<br />
10<br />
8<br />
6<br />
4<br />
2<br />
0<br />
Polyphenolic C (% of HWOC)<br />
Figure. 1. Hot-water extract. A: relative amount of HWOC. B: aromaticity of HWOC, as<br />
measured by absorption at 280 nm. C: carbohydrate C. D: Polyphenolic C. (*) differences<br />
are significant at P = 0.05. ns: non-significant.<br />
Table 1 summarizes the results of DTG analysis. T50 is the temperature at which<br />
50% of SOM is lost by volatilization. It represents an indica<strong>to</strong>r of the overall recalcitrance<br />
of SOM4. Neither the effect of the number of fires (P = 0.870) nor that of previous land use<br />
(P = 0.144), nor the interaction of both fac<strong>to</strong>rs (P = 0.827) significantly affect T50 values. If<br />
the <strong>to</strong>tal C is introduced as a covariate in the model, the land use fac<strong>to</strong>r becomes highly<br />
significant (P = 0.004***), but the number of fires does not (P = 0.257).<br />
The energetic value of SOM (Table 2) is highly affected by the previous land use<br />
(P = 0.010**), but not by the number of fires (P = 0.866), nor by the interaction of both<br />
fac<strong>to</strong>rs (P = 0.973). For all land uses the energetic value of SOM increases with the<br />
number of fires, even though not enough <strong>to</strong> reach significance.<br />
209
Table 1. T50 for DTG. Data are means ± standard deviations. N.D.: no data.<br />
0 fires 1 fire 2 fires All<br />
NC 346.6 ± 11.4 348.7 ± 9.3 349.1 ± 12.6 348.1 ± 10.7<br />
EA 355.0 ± 8.2 350.7 ± 7.4 354.7 ± 10.6 353.7 ± 8.7<br />
RA 352.4 ± 10.2 353.2 ± 4.0 N.D. 352.7 ± 7.9<br />
All 351.3 ± 10.2 350.7 ± 7.2 351.9 ± 11.6 351.3 ± 9.5<br />
Table 2. Energetic value of SOM (Joules per mg OM). Data are means ± standard<br />
deviations. N.D.: no data.<br />
0 fires 1 fire 2 fires All<br />
NC 10.85 ± 1.04 11.43 ± 1.02 11.93 ± 3.36 11.38 ± 2.02<br />
EA 10.55 ± 1.17 10.67 ± 1.24 11.16 ± 2.48 10.79 ± 1.67<br />
RA 8.97 ± 2.14 9.19 ± 3.62 N.D. 9.06 ± 2.74<br />
All 10.12 ± 1.69 10.48 ± 2.31 11.54 ± 2.86 10.59 ± 2.26<br />
4. CONCLUSIONS<br />
Our results suggest that the changes in SOM quality are difficult <strong>to</strong> detect several<br />
years after the fire event. Some indica<strong>to</strong>rs of recalcitrance show a slight increase with<br />
recurrent fires, but the overall abundance of refrac<strong>to</strong>ry SOM st<strong>ru</strong>ctures (as measured by<br />
their thermal properties) does not suffer clear changes. Our dataset suggests that if the<br />
inputs of fresh OM recover quickly enough, the overall SOM quality will behave in the<br />
same way, even though the presence of signals of past wildfires can be expected.<br />
REFERENCES<br />
1. Castro, A., González-Prie<strong>to</strong>, S.J., Carballas, T. 2006. Geoderma 130, 97-107.<br />
2. Guin<strong>to</strong>, D.F., Saffigna, P.G., Xu, Z.H., House, A.P.N., Perera M.C.S. 1999. Aust. J. Soil Res.<br />
37: 123-135.<br />
3. Duguy B., Rovira, P., Vallejo, V.R. 2007. Eur. J. Soil Sci. 58, 83-91.<br />
4. Rovira, P., Kurz-Besson, C., Coûteaux, M.M., Vallejo, V.R. 2008. Soil Biol. Biochem. 40, 172-<br />
185.<br />
210
Organic Carbon S<strong>to</strong>cks in Bulgarian Soils<br />
Ekaterina Filcheva 1 , Aleksandar Koulikov 2 , Svetla Rousseva 1<br />
1 Institute of Soil Science “N. Poushkarov”, 7, Shosse Bankya, 1080 Sofia, Bulgaria,<br />
filcheva@itp.bg<br />
2 Soil Resources Agency, 7, Shosse Bankya, Sofia, Bulgaria<br />
Keywords: soil organic carbon, carbon pool, humus substances<br />
1. INTRODUCTION<br />
Soils play an important role in the earth’s carbon cycle because they contain most of<br />
the earth’s carbon pool. One of the important reasons for the assessing of the Soil Organic<br />
Carbon S<strong>to</strong>cks (SOCS) is its role as headline indica<strong>to</strong>r of soil quality and health. Soil<br />
organic matter improves the soil physical properties, increases the cation exchange<br />
capacity (CEC) and water-holding capacity. <strong>Humus</strong> substances hold a great proportion of<br />
nutrients, cations, and trace elements that are of importance <strong>to</strong> plant growth. Soil organic<br />
matter prevents nutrient leaching; it also buffers soil and increases the ability of the soil <strong>to</strong><br />
bind chemicals. Globally the upper meter of mineral soils contains 1300-1600 Gt carbon<br />
(3, 13). The organic carbon reserve has been estimated in Bulgaria (1, 2, 6, 8, 11). The<br />
aim of this paper is <strong>to</strong> present the organic carbon s<strong>to</strong>cks of Bulgarian soils and GIS maps<br />
for organic carbon reserves in Bulgarian soils for the layers 0-25 cm and 0-100 cm.<br />
2. MATERIALS AND METHODS<br />
The presented results are based mainly on the available data of organic carbon and<br />
bulk density measurements along the profile depths of different soils grouped according<br />
the revised legend <strong>to</strong> the soil map of the world (4, 5), extrapolation, and interpolation of<br />
average data on humus content from the large-scale soil survey and available data on bulk<br />
density. Soil organic carbon was determined by modified Turin’s method (7; 12) and soil<br />
bulk density was determined at field capacity (14). Relevant information was organized in<br />
a database. Development of GIS maps of distribution of organic carbon reserves of<br />
Bulgarian soils was based on: proper localization of 274 profiles on soil map at a scale M<br />
1:400 000; data interpolation from profiles <strong>to</strong> soil polygons; data extrapolation for soil<br />
con<strong>to</strong>urs (polygons) using respective data on organic carbon reserves for other soil<br />
con<strong>to</strong>urs (3 000 soil polygons); using average data on humus content from the large-scale<br />
soil survey and available data on bulk density and land use; removing areas without soil<br />
cover.<br />
3. RESULTS AND DISCUSSION<br />
The average carbon density and <strong>to</strong>tal organic carbon was calculated for each of the<br />
group. These data demonstrate that the greatest carbon density occurs in Gleysols &<br />
211
His<strong>to</strong>sols for both layers 0-25 and 0-100 cm. Average organic carbon density ranges from<br />
3.1 kg m -2 (Li<strong>to</strong>sols) <strong>to</strong> 18.6 kg m -2 (Gleysols & His<strong>to</strong>sols) for the surface soil and from<br />
6.7 kg m -2 (Li<strong>to</strong>sols) <strong>to</strong> 33.0 kg m -2 (Gleysols & His<strong>to</strong>sols) for the entire soil.<br />
The <strong>to</strong>tal organic carbon s<strong>to</strong>ck of the soils in Bulgaria is estimated at 1.3 Gt, which is<br />
about 1/1000 of the world reserve estimate of 1576 Gt (3). Percentage distribution of<br />
organic carbon s<strong>to</strong>cks among soil groups for 0-25 cm is presented in Figure 1. Cambisols,<br />
which occupy about 18.4% of the terri<strong>to</strong>ry, contribute about 27.6% of the <strong>to</strong>tal national<br />
carbon s<strong>to</strong>cks (Figure 2). Chernozems, Phaeozems, Luvisols and Vertisols, which cover<br />
respectively 7.6, 13.0, 20.2 and 5.8 % of the terri<strong>to</strong>ry, contribute about 9.4, 14.2, 18.4 and<br />
7.2% of the national carbon s<strong>to</strong>cks. Gleysols &His<strong>to</strong>sols occupy about 0.6% of the <strong>to</strong>tal<br />
area but contribute 1,6 % of the national carbon s<strong>to</strong>ck (Figure 2). GIS maps of distribution<br />
of organic carbon reserves for the layers 0-25 and 0-100 cm are presented in Figures 3<br />
and 4.<br />
4. CONCLUSIONS<br />
The <strong>to</strong>tal carbon s<strong>to</strong>cks of Bulgarian soils are calculated <strong>to</strong> 1.3 Gt. Three groups of<br />
soils can be recognized:<br />
(i) First group includes Chernozems, Phaeozems and Kastanozems. These soils<br />
have comparatively high SOCS, <strong>to</strong> a certain extent inherited from the past. The main<br />
reasons <strong>to</strong> SOC decrease: wind and water erosion, tillage, removals of the organic matter<br />
by harvest.<br />
(ii) The second group includes Fluvisols, Planosols and Vertisols. In general, these<br />
soils are least damaged from erosion. However, the rest SLM options for preservation of<br />
SOC are recommended. For Planosols a special attention has the balance of nitrogen<br />
amendments.<br />
(iii) Third group unify Luvisols, Cambisols, Regosols and Lep<strong>to</strong>sols. The SOCS in<br />
these soils are not high. Cambisols, Regosols and Lep<strong>to</strong>sols are comparatively young<br />
soils. All of them damaged from erosion. The balance of SOC removals and nitrogen<br />
amendments are especially important.<br />
REFERENCES<br />
1. Artinova, N., E. Filcheva, G. Gurov, and L. Petrova. 2007. Soil organic matter of Bulgarian<br />
soils. Soil Resources of Bulgaria, v.1. (in press).<br />
2. Boyadgiev, T., E. Filcheva, and L. Petrova. 1994. The organic carbon reserve of Bulgarian<br />
soils. In: Soil Processes and Greenhouse Effect, p.19-23.<br />
3. Eswaran, H., E. Van Denberg, and P. Reich. 1993. Organic carbon in soils of the World. Soil<br />
Sci. Soc. Am. J. vol. 57, 192-194.<br />
4. FAO-UNESCO. 1990. Soil Map of the World. Revised Legend. FAO, Rome.<br />
5. FAO–UNESCO. 1997. Soil Map of the World. Revised Legend, ISRIC, Wageningen.<br />
212
6. Filcheva, E., Rousseva, S., Kulikov, A., Nedyalkov, S., Chernogorova, Tz. 2002. Organic<br />
carbon s<strong>to</strong>cks in soils of Bulgaria. In: J.M.Kimble, R. Lal, R.F. Follett (eds.) Agricultural<br />
Practices and Policies for Carbon Sequestration in Soil, Lewis Publ., CRC Press, Boca Ra<strong>to</strong>n,<br />
FL, USA: 471-476.<br />
7. Filcheva E., Tsadilas. 2002. Influence of Cliniptilolite and Compost on Soil Properties.<br />
Commun. of Soil Sci. and Plant Analysis, 33, 3&4, 595-607.<br />
8. Filcheva, E. 2004. Comparative characteristics of Bulgarian soils on organic carbon content,<br />
composition and s<strong>to</strong>cks. Professor Habilitation Thesis. 263 pp. (Bul).<br />
9. Filcheva E., S. Rousseva. 2004.Organic carbon s<strong>to</strong>cks in Bulgarian soils groupped accrding <strong>to</strong><br />
the revised legend of the FAO-Unesco soil map of the world. Modern physical and<br />
physicochemical methods and their applications in agroecological research, (Andrzej<br />
Bieganowski, Grzegorz Józefaciuk, Ryszard T. Walczak, Edi<strong>to</strong>rs). Centre of Exellence for<br />
Applied Physics in Sustainable Agriculture AGROPHYSICS, N. Poushkarov Institute of Soil<br />
Science, Institute of Agrophysics, PAS, Lublin-Sofia, 36-42.<br />
10. Filcheva, E., A. Kouilikov. 2007. Defining the Possible SLM Options Based on The Organic<br />
Carbon Reserves in the Bulgarian Soils. Assessment report on contract between UNDP and<br />
Bulgarian Humic Substances society. 19 pp.<br />
11. Gerasimov I. P., I. N. Antipov-Karataev, V. Galeva, E. Tanov. 1960. Soils in Bulgaria,<br />
Zemizdat, 531 p.<br />
12. Kononova, M. M. 1966. Soil Organic Matter. 2nd ed. Pergammon press, Inc., M. V. 544p<br />
13. Neill, C., C. C. Cerri, J. M. Mellilo, B. J. Feigl, P. A. Steudler, J. L. Moraes, and M. C.<br />
14. Revut, I.V., and A.A. Rode, eds. 1969. Methodological handbook for soil st<strong>ru</strong>cture studies.<br />
Kolos Publ., Leningrad.<br />
Cambisols<br />
38,5%<br />
Acrisols<br />
0,2%<br />
Chernozems<br />
8,1%<br />
Phaeozems<br />
13,2%<br />
Li<strong>to</strong>sols<br />
11,2% Solonchak &<br />
Solonetz<br />
Fluvisols<br />
4,5%<br />
Vertisols<br />
5,7%<br />
0,1% Gleysols & His<strong>to</strong>sols Planosols<br />
1,4%<br />
2,0%<br />
Luvisols<br />
15,2%<br />
Figure 1. Percentage distribution of organic carbon s<strong>to</strong>cks among soil groups, 0-25 cm.<br />
213
Cambisols<br />
27,6%<br />
Acrisols<br />
0,1%<br />
Chernozems<br />
9,4%<br />
Phaeozems<br />
14,2%<br />
Li<strong>to</strong>sols<br />
13,7%<br />
Fluvisols<br />
Solonchak & 5,4%<br />
Solonetz<br />
Gleysols & His<strong>to</strong>sols<br />
0,1%<br />
1,6%<br />
Planosols<br />
2,1%<br />
Luvisols<br />
18,4%<br />
Vertisols<br />
7,2%<br />
Figure 2. Percentage distribution of organic carbon s<strong>to</strong>cks among soil groups, 0-100 cm.<br />
Figure 3. Soil Organic Carbon S<strong>to</strong>cks in 0-25 cm layer.<br />
Figure 4. Soil Organic Carbon S<strong>to</strong>cks in 0-100 cm layer.<br />
214
Use of Lipid Biomarkers in Sediment and Aquatic Systems<br />
Samuel Fouchard, Stéphanie Freitag, Fabienne Zeller, Pierre Llopiz, Serge Walter,<br />
Serge Neunlist<br />
Labora<strong>to</strong>ire de Chimie Organique, Bioorganique et Macromoléculaire UMR 7015, Ecole Nationale<br />
Supérieure de Chimie de Mulhouse, 3 Rue Alfred Werner, F-68093 MULHOUSE Cedex, France,<br />
Serge.Neunlist@uha.fr<br />
Keywords: lipid, biomarkers<br />
1. INTRODUCTION<br />
Measuring the diversity of a living community is not an easy task, due <strong>to</strong> the<br />
multitude of organisms and processes involved. In that game, the organic matter present<br />
in sediments provides a complex picture of the organisms living in the surrounding<br />
ecosystem. Over the centuries, the sediments act as an archive of past events affecting<br />
the composition of living communities as well as of biological (reworking of the primary<br />
inputs) and abiotic degradation processes. Detailed analyses of the organic matter<br />
composition of lacustrine sediments are therefore a powerful <strong>to</strong>ol <strong>to</strong> assess environmental<br />
variations. Within the complex mixture of organic compounds contained in the sediments,<br />
lipids are widely distributed and commonly used as 'biomarkers’. Our research project<br />
consisted of the study of lipids in aquatic systems in order <strong>to</strong> evaluate their diversity in<br />
terms of space and the impact of environmental change on biodiversity. The method<br />
employed <strong>to</strong> analyse the lipid composition of sediments will be mainly explained in this<br />
paper.<br />
2. MATERIALS AND METHODS<br />
2.1. Extraction<br />
In a typical procedure, 10 g of dry sediment were extracted with Chloroform /<br />
Methanol (2:1, v/v, 100 ml, 45 min. under reflux, 3 times). After filtration, combined extracts<br />
were dispatched in<strong>to</strong> 3 equal parts <strong>to</strong> be treated by one of the following procedures, one<br />
part being s<strong>to</strong>red at 4°C as standard.<br />
2.2. Chemical treatments of extracts<br />
2.2.1. Procedure 1<br />
C<strong>ru</strong>de extracts (100 mg) were methylated with an excess of fresh distilled<br />
diazomethane during 3 hours at room temperature. The mixture was evaporated <strong>to</strong><br />
dryness and consecutively acetylated with a mixture of acetic acid and pyridine (1:1, v/v,<br />
215
2 ml) at room temperature for 16 hours. This procedure allowed the analysis of n-alkanes<br />
as well as lipids bearing an acetylated alcohol or a methylated carboxylic acid group.<br />
2.2.2. Procedure 2<br />
C<strong>ru</strong>de extracts (100 mg) was treated at room temperature for 1 hour with a solution<br />
of sodium periodate (NaIO 4 , 500 mg) in THF / water (9:1, v/v; 10 ml) <strong>to</strong> yield aldehydes<br />
from 1,2-diols. Water (10 ml) was added <strong>to</strong> the medium and the mixture was extracted with<br />
petroleum ether (40 ml, 3 times). The residue was reduced at room temperature during<br />
1 hour with an excess of sodium borohydride (NaBH 4 , 500 mg) in ethanol (10 ml) <strong>to</strong> yield<br />
primary alcohols. After addition of aqueous potassium hydrogenophosphate (KH 2 PO 4 ,<br />
500 mM, 3 ml), the mixture was extracted with petroleum ether (40 ml, 3 times). Dried<br />
organic phase was evaporated <strong>to</strong> dryness and consecutively acetylated as in procedure 1.<br />
This procedure allowed the analysis of n-alkanes as well as lipids bearing alcohol or 1,2-<br />
diol groups yielding simple alcohols after the periodate / borohydride degradation<br />
procedure (complex hopanoids for example).<br />
2.3. Inst<strong>ru</strong>mentation<br />
Gas liquid chroma<strong>to</strong>graphy was performed on a Fisons Gas Chroma<strong>to</strong>graph 8000<br />
fitted with a DB-5 (30m × 0.32 mm id) fused silica capillary column, an on-column injec<strong>to</strong>r<br />
and an FID detec<strong>to</strong>r. Hydrogen was used as carrier gas. The temperature of the oven was<br />
programmed from 50°C <strong>to</strong> 310°C at 6°C / min. In a typical analysis, 1 µl of a chloroformic<br />
solution of the analysed mixture was injected.<br />
2.4. Identification and quantification of biomarkers<br />
After adequate treatment of <strong>to</strong>tal sediment extracts, two representative samples for<br />
each series and for the procedures detailed above were analysed by GC / MS for<br />
identification purposes, the other samples being quantified by GC. Compounds were<br />
identified by mass spectrometry and by comparison (mass spectra, retention index of<br />
compounds in GC) with authentic samples. A kit of n-alkanes injected twice in each series<br />
of chroma<strong>to</strong>grams furnished retention times allowing us, thanked <strong>to</strong> an au<strong>to</strong>matisized<br />
informatic programme developed by our means, <strong>to</strong> attribute indexes, analogous <strong>to</strong> Kowats<br />
indexes, <strong>to</strong> all compounds contained in analysed mixtures.<br />
For quantitative analyses, n-tetracontane (n-C 40 H 82 ) was used as internal standard.<br />
Accuracy of quantitative analyses is of 20% in the studied concentration range (from<br />
10 ppb <strong>to</strong> 10 ppm). The minimal amount of lipid recognizable in a given sample is around<br />
0.2 µg, what means a detection limit of 10 ng lipid / g dry sediment (10 ppb) for 20 g<br />
samples.<br />
216
3. RESULTS AND DISCUSSION<br />
Lipid extracts from sediments were complex mixtures of various classes of lipids. For<br />
sediment core interpretation we chose lipids having biomarker value, meaning that:<br />
• they were fairly abundant in the organic matter of the sediments (around 1 ppm)<br />
• they were specific of the organisms synthesizing them or they can lead, through<br />
calculations, <strong>to</strong> conclusions about the composition of living communities<br />
• they were fairly stable so that biotic or abiotic degradation could be neglected<br />
• they could be successfully resolved and identified by GC/MS analysis<br />
In order <strong>to</strong> achieve a relevant fingerprint of the lipid composition of each studied<br />
sediment sample, we analysed more than 100 lipids belonging <strong>to</strong> 8 st<strong>ru</strong>ctural groups<br />
• An: long chain n-alkanes (from C27 <strong>to</strong> C36)<br />
• Ao: long chain n-alcohols (from C23 <strong>to</strong> C34)<br />
• Ai: long chain fatty acids (from C24 <strong>to</strong> C36)<br />
• S: C27 steroids (like cholesterol I)<br />
• MS: C28 steroids bearing an additional methyl or methylene group at C-24<br />
• ES: C29 steroids, with an additional ethyl or ethylene group at C-24<br />
• H: Hopanoids<br />
• O: Other pentacyclic triterpenoids (amyrines, gammacerane, tetrahymanol<br />
(THM)…)<br />
3.1. Surface layers of all aquatic systems<br />
A wide range of lipid concentrations between the <strong>to</strong>p sediment surface samples<br />
studied from near <strong>to</strong> 2 mg/g of dry sediment down <strong>to</strong> less than 200 µg/g of dry sediment.<br />
Whatever, an overall classification in “lipid rich” (more than 1 mg analysed lipids /<br />
g sediment), “intermediated lipid richness” (between 400 µg and 1mg/g) and “lipid poor”<br />
(less than 400 µg/g) sediments could be done and suggested <strong>to</strong> use such lipid<br />
compositions as fingerprints <strong>to</strong> characterise the sediments.<br />
Considering the sediment samples and the distribution of the analysed lipids over the<br />
8 defined st<strong>ru</strong>ctural groups, 3 major groups could be distinguished:<br />
• Sediments where linear compounds dominates: long chain fatty acids (>30% of<br />
lipids)<br />
• Sediments with high sterol contents (>30% of the analysed lipids)<br />
• Sediments with high hopanoid content (>25% of the analysed lipids)<br />
It was remarkable <strong>to</strong> observe that sediments belonging <strong>to</strong> the first group were<br />
remarkably stable downcore over the studied period, meaning that no major shifts in the<br />
217
lipid composition occured. On the other hand, sediments where the dominants lipids were<br />
sterols or hopanoids showed drastic changes in their composition downcore.<br />
3.2. Establishing specific indica<strong>to</strong>r calculated from the lipid concentrations<br />
The lipid composition and mainly its evolution through time, which could be<br />
moni<strong>to</strong>red by analysing the sediments downcore, could be used, by calculating several<br />
ratios and bioindica<strong>to</strong>rs, <strong>to</strong> describe the evolution of the compositions of living communities<br />
and the various processes happening during the early diagenesis. Following indica<strong>to</strong>rs<br />
were developed and used <strong>to</strong> study the sediment downcore:<br />
Contribution of living organisms<br />
Bacteria BA = H/F<br />
Pro<strong>to</strong>zoa PR = THM/F<br />
Higher Plants PL = (ES + O)/F<br />
Algae AL = (MS + (S + ES)/3)/F<br />
Zooplank<strong>to</strong>n ZO = S/F<br />
“F = (4(S+ES)/3 + MS + H +O + THM )”<br />
Odd/Event<br />
Index<br />
Origin of organic matter<br />
OEI = 3/2((C29+C31)/(C28+C30+C32))<br />
EUT = OEI / Saa<br />
Eutrophication<br />
“Saa = (An+Ao+Ai+ES+O)(S+MS+H)”<br />
The lipid concentrations and compositions of the sediments were analysed and all<br />
the indic<strong>to</strong>rs were calculated as detailed above. The results showed clearly the complexity<br />
of the aquatic systems biogeochemistry in relation <strong>to</strong> the environmental fac<strong>to</strong>rs.<br />
Nevertheless some highly interesting pattern could be recognised and the value of lipid<br />
biomarkers as “summary of all events, including biodiversity of organisms and diagenetic<br />
processes was obvious. Furthermore, the eutrophication indica<strong>to</strong>r was a promising <strong>to</strong>ol for<br />
approaching aquatic systems productivity not only in function of <strong>to</strong>tal phosphorous but also<br />
depending on organic matter inputs.<br />
4. CONCLUSION<br />
As conclusions, clear links of lipid compositions of the sediments <strong>to</strong> environmental<br />
events were obvious even if the statistical <strong>to</strong>ols used so far are unable <strong>to</strong> demonstrate it<br />
clearly. Similarities between aquatic systems, which appeared at all analysed levels,<br />
reflected a similar response of the biological communities <strong>to</strong> a common physico-chemical<br />
environment. Undoubtedly, lipid biomarkers were the right <strong>to</strong>ol <strong>to</strong> quantify such similarities.<br />
218
Thermal Properties in Soil Particle-Size Fractions of Andosols, with<br />
Different Land-Use, in the Trans-Mexican Volcanic Range<br />
Sara Covaleda 1 , Juan F. Gallardo 1 , Felipe García-Oliva 3 , Christian Prat 2 , Miguel Bravo 4 ,<br />
Holger Kirchmann 5 , M. Isabel González 6 ,<br />
1 C. S. I. C., Aptado. 257, Salamanca 37071 (Spain), jgallard@usal.es<br />
2 I.R.D., Morelia (Michoacán, Mexico)<br />
3 Centro de Investigaciones en Ecosistemas, U.N.A.M., Morelia 58090 (Michoacán, Mexico)<br />
4 INIFAP, Morelia (Michoacán, Mexico)<br />
5 Swedish University of Agricultural Sciences, Uppsala (Sweden)<br />
6 Area de Edafología y Química Agrícola, University of Salamanca 37080 (Spain)<br />
Keywords: physical fractionation, thermal analysis, forest degradation<br />
1. INTRODUCTION<br />
In the Cuitzeo Basin (Michoacán, Mexico), land degradation has reduced soil fertility<br />
and productivity. The necessity of <strong>ru</strong>ral communities of searching resources for improving<br />
the local economy has lead <strong>to</strong> an increase in timber extraction activities during the last<br />
years. This practice has been associated <strong>to</strong> a decrease in the vegetation cover and an<br />
increase in the soil surfaces affected by degradation processes. As a consequence, the<br />
SOM s<strong>to</strong>red in the soils of this area is in high risk of being lost, especially in the upper soil<br />
horizons. Thermal stability of soil organic matter (SOM) refers <strong>to</strong> its resistance <strong>to</strong> thermal<br />
oxidation during heating treatments and relationships between thermal properties and<br />
biological stability have been found (1). Thus, thermal techniques allowing <strong>to</strong> detect gross<br />
changes in SOM as a consequence of land-use changes has also been referred.<br />
The objective of this work was <strong>to</strong> determine how land use and forest degradation<br />
affected the SOM of volcanic soils located at the Mexican Volcanic Belt, using as a <strong>to</strong>ol the<br />
thermal responses of the C associated <strong>to</strong> the silt- and clay- sized fractions.<br />
2. MATERIALS AND METHODS<br />
The study site is located in the Atécuaro catchment, within the Cuitzeo basin<br />
(Mexico), 12 km away from the city of Morelia (State of Michoacán, 19º 34' N; 101º 10' W).<br />
The dominant soils in the catchment are Andosols in the <strong>to</strong>p and slopes and Acrisols in the<br />
piedmont and valley. The forest succession is pine-oak at the summit, with increasing<br />
degradation on the hillside and, finally, maize cultivations on foothills. Six representative<br />
plots were selected in the area: a grasslands (P1) previously used as agriculture land and<br />
219
abandoned about 30 years ago; 4 pine-oak forest plots with increasing degradation down<br />
slope (P2, P3, P4, and P6); additionally a fuel-wood area (P4) that suffered a forest fire in<br />
2000; and a recently abandoned agricultural land (P5) that followed a fallow management.<br />
Soil samples (0-10 cm) were taken in each site and soil organic C (SOC) was<br />
determined. A particle-sized fractionation using ultrasonic energy allowed for the<br />
separation of the silt- and clay-sized fractions. Differential thermal (DTA) and thermicgravimetry<br />
(TGA) analysis were performed on the clay- and silt-sized fractions of soil<br />
samples. Total weight loss by thermal combustion of samples between 200 and 600ºC<br />
was determined; in addition, relationships between the areas of the two main exothermic<br />
peaks (EP2/EP1) based on the first derivative of the TGA were calculated according the<br />
methodology proposed by López et al. (1).<br />
3. RESULTS AND DISCUSSION<br />
- a) Clay-sized fraction: The first exothermic peak (EP1) detected for the clay-sized<br />
fraction was very similar for all sites (about 333 ºC; Fig.1); the second exothermic peak<br />
(EP2) only appears in P1 (455 ºC); samples of the other sites showed a shoulder more<br />
than a real peak. In general, the EP1 accounted for a higher area (i. e., weight loss) than<br />
the EP2, excepting the site P4. The best preserved forest area (P2) presented the highest<br />
EP1, followed by samples from the P3 and the other forest sites (P4 and P6); these last<br />
sites did not show significant differences between them. On the other hand, the weight<br />
loss associated <strong>to</strong> the EP2 was similar for all forest sites. Then, land-use affected the<br />
quality of organic C associated <strong>to</strong> the clay-sized fraction. The soil sample of the P1<br />
(grassland) had a higher EP1, but the EP2 of the P5 (agricultural-land) was higher.<br />
-b) Silt-sized fraction: Samples of the silt fraction showed two well-defined peaks. The<br />
EP1 was close <strong>to</strong> 345 ºC, and the EP2 ranged from 425 <strong>to</strong> 453 ºC. In this case, the P1 and<br />
the P5 presented significantly higher temperatures (>440 ºC) than the forest sites. The<br />
EP2 was, in general, wider, indicating that the silt-sized fraction contained more thermalstable<br />
organic C. The height of the EP1 decreased in the order: P2 > P3 > P4 = P6; and<br />
that of the EP2: P2 > P3 = P4 > P6. Then, land-use affected more intensely the quality of<br />
the C included in the silt-fraction.<br />
EP2/EP1 ratios (relation between the areas of the two exothermic peaks) are<br />
exposed on Table 1 and used as a measure of the aromaticity of the organic C<br />
(humification index; 2). C linked <strong>to</strong> the clay-sized fraction seems less aromatic and C<br />
associated <strong>to</strong> the silt-sized fraction was, in general, more aromatic (ratio >1.0). Then, the<br />
organic C associated <strong>to</strong> the silt fraction forms more stable and humified organic-mineral<br />
220
complexes. EP2/EP1 ratios of both particle-size fractions increased moving down slope,<br />
which means that the humification intensity of the SOM increases with the forest<br />
degradation. That means that labile C is lost when the human activities increase and only<br />
the more recalcitrant SOC remains.<br />
a) Clay-sized fraction<br />
Temp. difference (ºC)<br />
2,5<br />
P1<br />
2<br />
P2<br />
1,5<br />
P3<br />
1<br />
P4<br />
0,5<br />
P5<br />
0<br />
P6<br />
-0,5<br />
-1<br />
-1,5<br />
-2<br />
0 100 200 300 400 500 600 700 800<br />
Temperature (ºC)<br />
b) Silt-sized fraction<br />
Temp. difference (ºC)<br />
2,5<br />
2<br />
P1<br />
1,5<br />
P2<br />
1<br />
P3<br />
P4<br />
0,5<br />
P5<br />
0<br />
P6<br />
-0,5<br />
-1<br />
-1,5<br />
-2<br />
0 100 200 300 400 500 600 700 800<br />
Temperature (ºC)<br />
Figure 1. DTA lines of the clay-sized fraction (a) and of the silt-sized fraction (b).<br />
Table 1. Ratios between peaks for the clay- and silt-sized fractions<br />
Sites<br />
Ratios<br />
Fractions Clay-size fraction Silt-size fraction<br />
P1 0.39 0.61<br />
P2 0.36 1.12<br />
P3 0.52 1.36<br />
P4 1.09 1.99<br />
P5 0.70 1.43<br />
P6 0.83 1.48<br />
221
4. CONCLUSIONS<br />
C associated <strong>to</strong> the silt fraction is more aromatic (more humified) than the C<br />
associated <strong>to</strong> the clay fraction. Thermal analyses showed that the labile C associated <strong>to</strong><br />
both fractions is significantly affected by forest degradation. As a consequence of this, only<br />
the more stable SOC is s<strong>to</strong>red in the more degraded forest soils. Land-use changes from<br />
forest <strong>to</strong> pasture affected both the amount and quality of C associated <strong>to</strong> the two<br />
considered fractions, but the agricultural use produced even a higher loss of the more<br />
thermally stable C associated <strong>to</strong> the silt fraction. As a consequence of this, a faster<br />
decrease of C is promoted by agriculture, remaining only the more recalcitrant SOC.<br />
ACKNOWLEDGEMENTS<br />
The authors gratefully thank the European Union for supporting the REVOLSO<br />
Project (INCO Program) and the Spanish S.E.U.I. and Mexican UNAM, which partially<br />
financed also the Project. The technical aids of R. Velázquez (UNAM) and L.F. Lorenzo<br />
(Spanish CSIC) are appreciated.<br />
REFERENCES<br />
1. López-Capel, E., Sohi, S.P., Gaunt, J.L., Manning, D.A. 2005. Use of therm-gravimetrydifferential<br />
scanning calorimetry <strong>to</strong> characterize modelable soil organic matter fractions. Soil<br />
Sci. Soc. Am. J., 69: 136-140.<br />
2. Barros, N., Salgado J., Feijóo S. 2007. Calorimetry and soil. Thermochim. Acta, 458: 11-17.<br />
222
Soil Organic Carbon S<strong>to</strong>cks and Humic Substances in Extremely Acid<br />
Soils, Sierra Norte de Oaxaca, México<br />
Norma E. García-Calderón 1 , Galicia-Palacios, M.S. 1 , Álvarez, A.G. 1 , Lasso, T.A. 1 ,<br />
Krasilnikov, P. 1,2<br />
1 Lab. Edafología, Fac. de Ciencias, Universidad Nacional Autónoma de México, México,<br />
normaeu@fata.unam.mx<br />
2 Biology Institute, Russian Academy of Sciences, Petrozavodsk, Rusia<br />
Keywords: mountain cloud forest, carbon sequestration<br />
1. INTRODUCTION<br />
The accumulation of organic matter (OM) in the decomposition is a characteristic<br />
feature of terrestrial ecosystems, and studies of OM will enable us <strong>to</strong> develop further<br />
management systems that sustain soil productivity. One of the more complex regions of<br />
Oaxaca is the Sierra Norte region that is situated at the northeast of the state, with an<br />
extension of 9,400 km 2 . This study was conducted in the surroundings of Santa C<strong>ru</strong>z<br />
Tepe<strong>to</strong>tutla, located in the catchment of Perfume river in the northern range of Oaxaca<br />
state (17°38’ - 17°40’ N, and 96°32’ - 96°33’ W). The lithology of the study area is<br />
represented mainly by mica-chlorite schists. This zone is characterized by ab<strong>ru</strong>pt<br />
<strong>to</strong>pography with slopes ranging between 10 and 50º. The climate has been classified as<br />
hyper-humid, transitional temperate one, mean annual precipitation is 5800 mm and mean<br />
annual temperature (MAT) is 16.5°C. Vegetation along the gradient consists of a mosaic of<br />
undisturbed forest communities displaying an overall elevational arrangement, generally<br />
arranged by altitude, of premontane and montane forests. In this paper we present the<br />
characterization of the pools of organic carbon reserves, forest floor properties and the<br />
humic substances of the soils situated in an altitude gradient.<br />
2. MATERIALS AND METHODS<br />
Two stands at the elevations of 1520 and 2550 m asl. were studied, on each stand<br />
five plots were stablished of 25 × 4 m (500 m 2 ), measuring diameter breast high (DBH),<br />
basal area of the trees and s<strong>to</strong>cks of biomass and edaphic carbon. One profile was<br />
collected on each stand. In the O layers from 5 plots, pH (H 2 O and KCl solutions ratio 1:5)<br />
was measured, ash and loss-on-ignition (LOI); Na + and K + were determined in solution<br />
with H 2 O and HCl. Previously soils were classified according <strong>to</strong> WRB1998 (1) as Histic<br />
Stagnic Cambisols (stand at 2550 m) and Histic Hyperdystric Cambisols (stand of 1520<br />
223
m). In each soil sample pH (H 2 O and 1M KCl with a soil:solution ratio 1:2.5), organic C<br />
(TOC) were determined by wet combustion. TOC reserves were calculated for every soil<br />
horizon by multiplying horizon depth <strong>to</strong> bulk density then the results were recalculated <strong>to</strong><br />
kg.ha -1 , and summed for <strong>to</strong>tal soil and separately for mineral and organic horizons.<br />
Samples for fractionation of SOM according <strong>to</strong> the Ponomareva & Plotnikova method were<br />
selected from some soil horizons.<br />
3. RESULTS AND DISCUSSION<br />
The first site situated at the altitude of 2550 m asl. with a MAT of 11.5ºC, ranging<br />
from –2.0 <strong>to</strong> + 34.4ºC and tree vegetation represented by 22 species; the most important<br />
ones were Quercus ocoteifolia Liebm., Clethra galeottiana Briq., Persea chanissonis Vel.<br />
Alt. In this stand, 3 soil profiles were studied. All soils are extremely acid both in organic<br />
and mineral horizons. TOC content is high in organic layers of the forest floor, and<br />
relatively low in the mineral horizons. C:N ratio is > 10 in O horizon, and < 10 in mineral<br />
horizons. The content of exchangeable bases in all the horizons is surprisingly low, except<br />
in the forest litter. The site situated at the altitude of 1520 m, has a MAT of 15.4ºC, ranging<br />
from 4.1 <strong>to</strong> 34.4ºC. The stand had 52 tree species, among them the most important were<br />
Cyrilla racemiflora L., Ticodendron incognitum Gómez-Lauri<strong>to</strong> & L.D. Gómez, Pinus<br />
chiapensis (Martínez) Andresen, with a high TOC content.<br />
Conditions of the canopy of each studied stand (Table 1), indicate in general that<br />
stands differ in number and species distribution. At the stand 1 (2250 m) basal area<br />
without >60 cm BHD is 8.08 m 2 .ha -1 and 30.65 m 2 .ha -1 for stand 2.<br />
Soil C s<strong>to</strong>cks (Table 2) are distributed as ± 50% in the first 15 cm deep for the 2550<br />
m stand. At 1520 m, 60% of the C s<strong>to</strong>cks are at 30 cm deep. It emphasizes that DOC<br />
could be important on C distribution along the profile and also may be related with the<br />
increase in clay and silt contents with deep in this site.<br />
Table 1. Canopy composition and density of the stands<br />
DBH, cm<br />
Stand 1 Stand 2<br />
trees No. % trees No. %<br />
0 – 10 40 43.0 103 70.5<br />
11 – 20 22 23.7 24 16.4<br />
21 – 40 20 21.5 16 11.0<br />
41 – 60 6 6.5 2 1.4<br />
> 60 5 5.4 1 0.7<br />
Total 93 146<br />
Trees.ha -1 1860 2920<br />
224
Forest<br />
stand<br />
Table 2. S<strong>to</strong>cks of Carbon in the study sites on the montane cloud forest<br />
Tree<br />
biomass 4,5<br />
Sh<strong>ru</strong>bs &<br />
herbs 5 Litter 5 Necromass 5 soil Total<br />
Mg C. Ha -1<br />
187.97 1.74 9.81 11.12 143.62<br />
2550<br />
113.31 1.41 6.23 9.97 36.71 354.27<br />
masl<br />
60% 81% 63% 89.70% 26%<br />
109.67 0.55 14.17 54.48 227.09<br />
1520<br />
49.79 0.20 7.25 46.77 38.59 405.96<br />
masl<br />
45% 37% 51% 85.9% 17%<br />
(1) mean, (2) standard deviation, (3) coefficient of variation, (4)
main fraction in E and EB horizons, also in Profile 1.2, FA fraction represents more than a<br />
half of the TOC. Humins represents an important portion in their TOC of E and Bsg<br />
horizons. The main changes observed downward along the <strong>to</strong>posequence are: an<br />
increase in visible humus content with altitude. However, most of the properties<br />
considered <strong>to</strong> be important for vegetation, - acidity and exchangeable bases<br />
concentration-, show almost no difference with the altitude. We should conclude that acid,<br />
base-poor soils are characteristic for the entire ecosystem, and do not have any altitudinal<br />
gradient. We consider that complex distribution of C reserves along the <strong>to</strong>posequence<br />
reflects two competing tendencies. On one hand, the litter production should decrease with<br />
altitude (according with decreasing temperatures and, consequently, decreasing biological<br />
productivity), thus decreasing C densities. On the other hand, decreasing temperature and<br />
increasing soil moisture contents should limit microbial decomposition and mineralization<br />
of OM, thus favoring higher amounts of s<strong>to</strong>cked OC. We can tentatively consider that a<br />
linear component of a square trend reflects the decrease in biological productivity with<br />
altitude, while square component reflects a consequent decrease in organic residues<br />
mineralization rate. Forest <strong>to</strong>psoils tend <strong>to</strong> produce more DOC and their leaches contains<br />
bomb carbon in different turnover times (3). Water transport carries DOM from the <strong>to</strong>p soil<br />
in<strong>to</strong> the deeper soil, and where this comprises mineral horizons, sorption of DOM generally<br />
occurs, although water by-pass processes can transfer some DOM directly <strong>to</strong><br />
streamwater.<br />
4. CONCLUSIONS<br />
The studied montane cloud forest is one of the richest in organic C reserves in soil<br />
ecosystems. Acid, base-poor soils are characteristic for the entire ecosystem, and do not<br />
have any altitudinal gradient. C-s<strong>to</strong>cks as humic substances are mainly FA and humin<br />
fractions in these soil ecosystems.<br />
ACKNOWLEDGEMENTS<br />
This research was funded by PAPIIT IN216906-3 and CONACYT-SEMARNAT-<br />
UNAM 23489 Projects. We are grateful for technical assistance from Elizabeth Fuentes<br />
and Rosalía Ramos.<br />
REFERENCES<br />
1. Krasilnikov, P. et al. 2007. // In press.<br />
2. Berg, B. and Laskowski, R. 2006. // Academic Press, UK. 421p.<br />
3. Tipping, E., Berggren, D., Mulder, J. & Woof, C. 1995. // Eur J of Soil Sci 46, 77-94.<br />
226
Mechanisms of Soil Carbon S<strong>to</strong>rage in Experimental Grasslands<br />
S. Steinbeiss 1 , V.M. Temper<strong>to</strong>n 1,2 , G. Gleixner 1<br />
1 Max Planck Institute for Biogeochemistry, POB 100164, 07701 Jena, Germany,<br />
gerd.gleixner@bgc-jena.mpg.de<br />
2 Phy<strong>to</strong>sphere Institute ICG-3, Juelich Research Centre GmbH, 52425 Juelich, Germany<br />
Keywords: carbon iso<strong>to</strong>pes, dissolved organic carbon, soil organic matter, biodiversity<br />
1. INTRODUCTION<br />
It has been hypothesized and confirmed by recent experiments that plant biodiversity<br />
positively affects carbon s<strong>to</strong>rage in soils (1). Higher root biomass production in more<br />
diverse plots, however, has not been able <strong>to</strong> sufficiently explain these observations. It still<br />
remains unclear, what additional mechanisms driven by plant biodiversity are responsible<br />
for the increased carbon s<strong>to</strong>rage. Therefore, a time series of soil and soil solution samples<br />
was investigated at the field site of The Jena Experiment, a large-scale biodiversity<br />
ecosystem functioning experiment (2).<br />
2. MATERIALS AND METHODS<br />
In addition <strong>to</strong> the main experiment with C3 plants, a C4 species (Amaranthus<br />
retroflexus L.) naturally labeled with 13 C was grown on an extra plot. Changes in organic<br />
carbon concentration in soil and soil solution were combined with stable iso<strong>to</strong>pe<br />
measurements <strong>to</strong> follow the fate of plant-derived carbon in<strong>to</strong> the soil and soil solution. A<br />
split plot design with plant litter removal versus double litter input simulated differences in<br />
biomass input, i.e. constant root biomass and varying litter.<br />
3. RESULTS AND DISCUSSION<br />
After 2 years the no litter and double litter treatment, respectively, showed that<br />
381 g C m -2 and 263 g C m -2 were s<strong>to</strong>red <strong>to</strong> a depth of 20 cm, while 71 g C m -2 and<br />
393 g C m -2 were lost between 20 and 30 cm depth. The iso<strong>to</strong>pic label in the <strong>to</strong>p 5 cm<br />
indicated that 11 and 15 % of soil organic carbon were derived from plant material on the<br />
no litter and on the double litter treatment, respectively (Fig. 1).<br />
227
0<br />
5<br />
depth in cm<br />
10<br />
15<br />
20<br />
average C3 plots<br />
C4 no litter<br />
C4 double litter<br />
25<br />
30<br />
0.0 0.5 1.0 1.5 2.0<br />
Δ δ 13 C in ‰ (2004 - 2002)<br />
Figure 1. Shift of carbon iso<strong>to</strong>pe values in soil organic carbon between 2002 and 2004<br />
averaged for C3 plots (stars) and in C4 treatments no litter and double litter (circles); data<br />
are calculated by δ13Csoil 2004 - δ13Csoil 2002. Error bars represent standard deviations<br />
between C3 plots and within the C4 plot, respectively. The dashed lines mark zero change<br />
(vertical line) and the border for observed carbon s<strong>to</strong>rage<br />
in the C4 treatments (horizontal line).<br />
In the no litter treatment, this equals the <strong>to</strong>tal amount of carbon newly s<strong>to</strong>red in soil,<br />
whereas in the double litter treatment this corresponds <strong>to</strong> twice the amount of s<strong>to</strong>red<br />
carbon. Our results showed that higher litter input resulted in lower carbon s<strong>to</strong>rage and<br />
larger carbon losses and consequently accelerated turnover of already present soil organic<br />
carbon. Iso<strong>to</strong>pic evidence indicated that present soil organic carbon was replaced by fresh<br />
plant-derived carbon near the input location, i.e. soil surface. Our results suggest that<br />
primarily carbon released from soil organic matter but not the newly introduced plantderived<br />
organic matter was transported in the soil solution <strong>to</strong> deeper horizons and there<br />
contributed <strong>to</strong> the observed carbon s<strong>to</strong>rage (Fig. 2).<br />
228
-26<br />
-27<br />
(a)<br />
C3 plots average<br />
δ 13 C value in ‰<br />
-28<br />
-29<br />
-30<br />
04.03 06.03 08.03 10.03 12.03 02.04 04.04<br />
sampling date (month.year)<br />
10 cm<br />
20 cm<br />
30 cm<br />
-21<br />
-22<br />
(b)<br />
no litter<br />
-21<br />
-22<br />
(c)<br />
double litter<br />
-23<br />
-23<br />
δ 13 C value in ‰<br />
-24<br />
-25<br />
-26<br />
δ 13 C value in ‰<br />
-24<br />
-25<br />
-26<br />
-27<br />
-27<br />
-28<br />
04.03 06.03 08.03 10.03 12.03 02.04 04.04<br />
sampling date (month.year)<br />
-28<br />
04.03 06.03 08.03 10.03 12.03 02.04 04.04<br />
sampling date (month.year)<br />
Figure 2. Seasonal variation in δ 13 C values of DOC in different depths averaged for plots<br />
with C3 vegetation (a), in the C4 no litter treatment (b)<br />
and in the C4 double litter treatment (c).<br />
4. CONCLUSIONS<br />
Iso<strong>to</strong>pic evidence on dissolved organic carbon proved that dissolved organic carbon<br />
collected deeper in the profile is originating from this depth and is not related <strong>to</strong> DOC<br />
collected near the surface. Consequently know changes in the chemical st<strong>ru</strong>cture of DOV<br />
in depth profiles are caused by selective preservation or adsorption of compounds but by<br />
different sources of these molecules.<br />
ACKNOWLEDGEMENTS<br />
This work was funded by the Deutsche Forschungsgemeinschaft within the scope of<br />
the biodiversity research group with support from the Friedrich Schiller University Jena and<br />
the Max Planck Society. We gratefully acknowledge all the people that were involved in<br />
planning set up and maintaining of the experiment, especially E.-D. Schulze, W. W.<br />
Weisser, B. Schmid, J. Schumacher, C. Middelhoff and C. Roscher.<br />
229
REFERENCES<br />
1. Steinbeiss, S., Beßler, H., Engels, C., Temper<strong>to</strong>n, V., Roscher, C., Kreutziger, Y., Baade, J.,<br />
Habekost, M., Gleixner, G., 2008. Plant biodiversity positively affects short-term soil carbon<br />
s<strong>to</strong>rage in experimental grasslands. Global Change Biology, accepted.<br />
2. Roscher, C., Schumacher, J., Baade, J., Wilcke, W., Gleixner, G., Weisser, W.W., Schmid, B.,<br />
Schulze, E.D., 2004. Basic and Applied Ecology 5, 107-121.<br />
230
The Content of Humic Substances in Ground Water from Agricultural<br />
Area in Opole Region, Poland<br />
Mariusz Glowacki, Izabella Pisarek<br />
Department of Land Protection, University of Opole, Oleska 48, 45-052 Opole, Poland,<br />
marglo@uni.opole.pl, izapis@uni.opole.pl<br />
Keywords: humic substances, organic matter, agricultural area, ground water quality<br />
1. INTRODUCTION<br />
The composition of surface and underground waters depends on geochemical<br />
properties of soils, the biological circulation of matter, the degree of mobility of chemical<br />
elements and compounds, velocity of biological sorption and the quantity of waters in a<br />
given area. These natural processes are modified by human activities, which result in<br />
introduction of certain components in<strong>to</strong> the environment in excessive amounts. Changes in<br />
the natural proportions of ions and <strong>to</strong>tal quantity of elements in waters and bot<strong>to</strong>m<br />
sediments very frequently are caused by inappropriate agricultural (2, 7, 8). Both<br />
components of fertilizers and compounds eluted from sorption complex of soils from <strong>ru</strong>ral<br />
areas are introduced in<strong>to</strong> waters. Particularly dangerous are nutrients leading <strong>to</strong><br />
eutrofization of surface waters and increased content of <strong>to</strong>xic substances (7). Biogenic<br />
substances coming from farms may be introduced in<strong>to</strong> the environment from various<br />
sources: out flow of nutrients from excessively fertilized and watered fields, erosion washoffs,<br />
where organic fertilizers where inappropriately s<strong>to</strong>red, pollutants and sewage from<br />
farm households, etc.<br />
The goal of these investigations was the determination of the influence of agriculture<br />
on the quality of surface and underground waters in the area called Opole Triassic region.<br />
2. MATERIALS AND METHODS<br />
Studies of water quality of ground waters in the Opole region were carried out taking<br />
samples from 20 wells (situated nearby households) in the period between 2002 and 2007<br />
(3). Some of these wells are being used <strong>to</strong> water gardens, animals and so on. None of<br />
them is being used as a source of drinking water for humans.<br />
The following parameters were determined in water samples: pH, conductivity, color,<br />
orthophospho<strong>ru</strong>s dissolved, <strong>to</strong>tal phospho<strong>ru</strong>s, COD-Cr, humic substances.<br />
231
Conductivity and pH was determined with the use of electronic inst<strong>ru</strong>ments: pH-meter<br />
and conductivity-meter. A spectropho<strong>to</strong>meter was used <strong>to</strong> analyze the color without<br />
prepreparation of water (wave length – 455 nm).<br />
Total phospho<strong>ru</strong>s was determined methods with acid mineralization and ammonium<br />
molibdate and zinc chloride as reductant. Orthophospho<strong>ru</strong>s dissolved was determined<br />
spectrometric methods with ammonium molibdate and zinc chloride as reductant. COD-Cr<br />
was determined with ferroine as the indica<strong>to</strong>r and Mohr salt as titrate. The aquatic humic<br />
substances were isolated with the XAD (XAD-8 resin) by the Aiken method (1, 6).<br />
Composition of humic substances was determined by IR spectroscopy taking the spectra<br />
in the 4000-400 cm -1 absorption region were taken.<br />
In 2007 additional research was carried out <strong>to</strong> characterize the properties of humic<br />
substances dissolved in water. The proportion between humic and fulvic acids present the<br />
direction of transformation and stability level of organic pollutants put in<strong>to</strong> the ground<br />
waters. These studies were conducted with the use of the method elaborated by Górniak<br />
(5). The ratio of absorption A 260 /A 330 gives a numerical value determining the quality of<br />
dissolved organic substances.<br />
3. RESULTS AND DISCUSSIONS<br />
In the analyzed terri<strong>to</strong>ry ground water appearing near ground surface displays<br />
greater differences of temperature than deeper located water (Table 1). Despite<br />
differences in properties of water in various depths it presented pH neutral or slightly<br />
alkaline. Conductivity of this water was on average level and indicated the medium value<br />
of <strong>to</strong>tal dissolved solids.<br />
Table 1.Some properties of investigated objects<br />
Deep wells <strong>to</strong> 3 m Deep wells 3-12,5 m Artesian well<br />
Index Unit<br />
up <strong>to</strong> average up <strong>to</strong> average up <strong>to</strong> average<br />
Temperature<br />
0 C 12.9 19.0 15.0 11.0 13.2 11.5 9.2 11.0 9.8<br />
pH pH 6.96 8.11 -- 7.36 8.14 -- 7.12 7.38 --<br />
Conductivity µS 415 951 699 490 884 654 720 736 730<br />
Color mgPt/L 7.2 169 36.3 17.0 43.3 32.3 36.0 44.0 40.0<br />
TOC mgC/L 0.96 22.2 5.71 2.82 5,28 3.76 1.56 1,8 1.71<br />
A 260 /A 330 -- 2.14 4.25 2.77 3.16 3.60 3.44 2.60 2.67 2.65<br />
P disol. mgPO +3 4 /L 0.08 19.2 2.31 1.17 3.70 2.52 0.06 0.07 0.07<br />
Total P mgPO +3 4 /L 0.24 19,6 2.92 0.40 1.52 2.10 0.70 0.74 0.73<br />
232
The correlation between the value of water color and value of TOC is very high. The<br />
correlation indexes both for water from wells <strong>to</strong> 3m deep and water from wells above 3 m<br />
deep were 0.990 and 0.974 respectively. This permits working out a method for quick<br />
measurement of the content of TOC in ground water by the measuring color of water<br />
without complicated analytical procedures. To recalculate the color of water (presented in<br />
mgPt/L) in<strong>to</strong> TOC (presented in mgC/L) the fac<strong>to</strong>r 7.39 must be used.<br />
The obtained values A 260 /A 330 are within the range of 2.14-3.60. It means that this<br />
water lacks polymer particles and it does not include big amounts of carboxylic groups.<br />
Low values of this index indicate the low content of aromatic particles included in humic<br />
substances in this water.<br />
The content of phospho<strong>ru</strong>s in analyzed water is high. Acceptable value of<br />
phospho<strong>ru</strong>s in ground waters which are being used for human activities should not exceed<br />
5 mgPO -3 4 /L and it was higher only in one of the investigated water wells. In other wells the<br />
quality of water was better, the content of phospho<strong>ru</strong>s was lower than 2.1 mgPO -3 4 /L. In<br />
Poland it is a typical content of phospho<strong>ru</strong>s in ground waters in agricultural areas.<br />
However, in surface water there should not be more than 1 mgPO -3 4 /L (4).<br />
4. CONCLUSIONS<br />
1. The main threat for the quality of waters in this region are daily human activities<br />
and s<strong>to</strong>ck animals breeding. In the wells located on the farms the water was of lower<br />
quality.<br />
2. Groundwater located nearby buildings not associated with farming shows more<br />
diversity in quality than water this found in farming grounds.<br />
3. There is a high correlation between the depth of water surface and the amount of<br />
pollutants. The water in wells which have water surface less than 3m deep is more<br />
polluted than water in deeper wells.<br />
4. The waters highly polluted by humic substances (with high value of color index)<br />
displayed the greater content of fulvic acids than humic acids.<br />
5. The complicated analysis of TOC in groundwater can be simplified by using only<br />
the analysis of the color of water. The content of TOC is highly correlated with color of<br />
water.<br />
ACKNOWLEDGEMENTS<br />
This investigation was partly financed as a research project from the science<br />
supporting funds in years 2007-2010 – grant 2592/P01/2007/32.<br />
233
REFERENCES<br />
1. Aiken G.R. 1985. Isolation and concentration techniques for aquatic humic substances, In:<br />
Aiken G.R., McKnight D.M., Wershaw R.L., Mac Carthy P., eds.Humic Substances in soil,<br />
sediment and water, Geochemistry, isolation and characterization, New York, NY: John<br />
Wiley&Sons, pp. 363-385, (ENG)<br />
2. Baranska B., Chalupniak E., Pawlikowski R., Segen-Cieply A., Stemplewski S. 2001. Stan<br />
srodowiska w wojewodztwie opolskim w roku 2000, eds. Biblioteka Moni<strong>to</strong>ringu Srodowiska,<br />
Opole. (Polish)<br />
3. Dubel K., Glowacki M., et al. 2003. Threats <strong>to</strong> water quality on the area of Main Reservoir of<br />
Groundwater No 333 caused agricultural activities, eds. Opolskie Cent<strong>ru</strong>m Edukacji<br />
Ekologicznej, Opole, Poland (Polish)<br />
4. Dojlido J. 1999. Chemistry of surface water. eds. Arkady. (Polish)<br />
5. Gorniak A. 1995. Spectrometric method of analysis of concentration and quality of organic<br />
carbon in water, In: Water Management 2, pp. 31-33 (Polish)<br />
6. Kukkonen J., McCarthy J.F., Oikari A. 1990. Effects of XAD-8 fractions of dissolved organic<br />
carbon on the sorption and bioavailability of organic micropollutants In: Arch.Environ. Contam.<br />
Toxic Qf. 1990, p.19 (Polish)<br />
7. Pracz J.1988. Chemical component of surface waters on the Warsaw area, In: Rocz. Glebozn.<br />
49,3/4, pp.5-18. (Polish)<br />
8. Saleh A., Ai<strong>ru</strong>wiah F.M., Shehata M. 2001. Ground-water quality of the Nile west bank related<br />
<strong>to</strong> soil characteristics and geological setting, In: Journal of Arid Environments. 49, Iss 4, pp.<br />
761-784. (ENG)<br />
234
Espectroscopic Features of Humic Substances in Diagnostic Horizons<br />
from Andosols as Seen by FT-IR and 13 C CPMAS NMR<br />
José An<strong>to</strong>nio González-Pérez 1 , Heike Knicker 2 , An<strong>to</strong>nio Rodríguez Rodríguez 3 ,<br />
Carmen D. Arbelo 3 , Rocío González-Vázquez 1 , Francisco J. González-Vila 1<br />
1 Institu<strong>to</strong> de Recursos Naturales de Sevilla, CSIC, Seville – Spain, jag@irnase.csic.es<br />
2 Lehrstuhl für Bodenkunde, Technische Universität München, Freising-Weihenstephan, Germany<br />
3 Universidad de La Laguna, Tenerife, Spain<br />
Keywords: Andosols, melanic epipedons, humic acids, fulvic acids, FT-IR and 13 C CPMAS NMR<br />
1. INTRODUCTION<br />
Andosols, usually formed on a volcanic substrate, accumulates high quantities of<br />
organic carbon (5-20% weight), mainly in the form of stable humic acids. This organic<br />
matter stabilization is derived from the existence of short-range ordered minerals or<br />
noncrystalline components (allophane, imogolite and ferrihydrite) with large surface and<br />
considerable potential <strong>to</strong> form stable complexes with organic molecules (1). Therefore,<br />
andosols have large potential <strong>to</strong> sequester carbon. In order <strong>to</strong> obtain a better<br />
understanding of the processes responsible for such accumulation of organic matter, our<br />
objective was <strong>to</strong> compare the molecular features of the organic materials s<strong>to</strong>red in humic<br />
acids extracted from a sequence of soils with andic properties (allophanic and<br />
nonallophanic) from the island of Tenerife (Canary Islands, Spain).<br />
2. MATERIALS AND METODS<br />
Three representative soils with more or less pronounced andic properties (“Ravelo”,<br />
“Siete Lomas” & “Frailes”) and a non-Andic Cambisol (“Tabaibal de Rasca”) were selected<br />
from Tenerife Island, Canary Islands. All samples were collected from the upper 10 cm of<br />
the soil A horizon. A complete description of the soils can be found in (2). Humic fractions<br />
isolation was done after Soxhlet extraction of the soil lipid fraction with petroleum ether.<br />
The soil residue was washed with water and then with 0.1 M Na 4 P 2 O 7 and 0.1 M NaOH.<br />
Total humic extract was precipitated with 6 M HCl <strong>to</strong> separate the acid-soluble FA from the<br />
acid-insoluble HA. The latter fraction was then dissolved in<strong>to</strong> 0.5 M NaOH and centrifuged<br />
at 43,500 g, precipitated with HCl, dialysed in cellophane bags, and desiccated at 40°C.<br />
FT-IR spectra were obtained in a B<strong>ru</strong>ker IFS28 using KBr pellets (0,003 g in<br />
0,20 g KBr). In order <strong>to</strong> facilitate the recognition of band patterns a mathematical<br />
conversion was applied (3). Solid-state Cross Polarization Magic Angle Spinning (CP-<br />
235
MAS) 13 C NMR spectra were obtained on a B<strong>ru</strong>ker DSX 200 using standard ramp-CP<br />
pulse program. Relative proportion of C functional groups was estimated by integration of<br />
the signal intensity of each spect<strong>ru</strong>m over given chemical shift regions.<br />
3. RESULTS AND DISCUSSION<br />
Humic and fulvic acid improved resolution FT-IR and solid state 13 CNMR spectra are<br />
shown in Figure 1. The infrared spectra of the HA fraction show strong peaks at 1720 cm -1<br />
(carboxyl band) and at 1610 cm -1 generally attributed <strong>to</strong> aromatic C=C stretching and<br />
COO¯ symmetric stretching. After resolution enhancement the spectra showed a fairly<br />
well-defined band pattern with diagnostic peaks centred at 1510, 1420, 1340 and<br />
1210 cm -1 , which is interpreted as the presence of a substantial domain of selectively<br />
preserved lignin (4). No substantial differences were found between soils but in the nonandic<br />
Cambisol (“Tabaibal”) that showed a higher intensity in the alkyl stretching band<br />
(2920 cm -1 ) and in the band attributed <strong>to</strong> O—H deformation and C—O stretching of<br />
phenolic OH (1340 cm -1 ). The infrared spectra of the FAs show more variability between<br />
soils that that from Has. Soils with andic properties (Ravelo, Siete Lomas & Frailes) share<br />
the first section of the “fingerprint” region below 1800 cm -1 up <strong>to</strong> 1100 cm -1 ; intense bands<br />
are found at about 1710 cm -1 (C=O stretching of COOH and other carbonyl groups), at<br />
1610 cm -1 (aromatic C=C stretching and COO¯ symmetric stretching), about 1390 cm -1<br />
(O—H deformation and C—O stretching of phenolic OH and at about 1210 cm -1 (C—O<br />
stretching and OH deformation in acids or C—O stretching of aryl ethers). Below<br />
1100 cm -1 difference in the relative intensity in the region 1080-1030 cm -1 are found<br />
indicating enrichment in polysaccharids or polysaccharide-like substances in the most<br />
evolutioned andic soil (“Ravelo”). The FA isolated from the non-andic Cambisol<br />
(“Tabaibal”) show intense signals at 1210, 1150 and 1060 cm -1 indicating enrichment in<br />
aliphatic molecules, fatty acids and sugars that is in agreement with previous data<br />
obtained by thermal desorption and pyrolysis (2).<br />
The main differences found when analyzing the soild state 13 C NMR spectra between<br />
HAs and FAs consists of a reduction in aromaticity (110-160 ppm) in the latter at expenses<br />
of the O-alkyl signal (46-110 ppm). When comparing between soils, humic and fulvic<br />
chemical composition varies with soil type. In accordance with FT-IR and Py-GC/MS<br />
results, a decrease in the alkyl region (0–46 ppm) of HA with the andic character of the<br />
soils is observed from 28.5% for the “Ravelo” soil <strong>to</strong> 39.2% for the non-andic “Tabaibal”<br />
soil. An increase in the carbonyl region (carbons in carboxylic and amide groups,<br />
160-220 ppm) with soil andic character is observed for both AHs and AFs, with the signal<br />
236
for “Ravelo” showing 18.8% (AH) and 25.3% (AF) whereas that for the non-andic Cambisol<br />
(“Tabaibal”) 15.6% (AH) and 12.5% (AF).<br />
Figure 1: Improved resolution FT-IR and 13 CNMR spectra of humic and fulvic acids.<br />
Spectroscopic differences observed between HAs and FAs from the studied soils<br />
may be related with the way SOM is stabilized through organo-mineral interactions (5 and<br />
references therein); the relative enrichment in carboxyl functions observed is possibly<br />
involved in stable complexes with the aluminium of allophane materials as previously<br />
suggested (6). Also electrostatic bonds can be established between reactive mineral sites<br />
and organic amide (7).<br />
237
REFERENCES<br />
1. Shoji, S., Nanzyo, M., Dahlgren, R.A. (Eds.). 1993. Volcanic Ash Soils: Genesis, Properties<br />
and Utilization, Elsevier Science Publishers, Amsterdam, The Netherlands.<br />
2. González-Pérez, J.A., Arbelo, C.D., González-Vila, F.J., Rodríguez-Rodríguez, A., Almendros,<br />
G., Armas, C.M., Polvillo, P. 2007. J. Anal. Appl. Pyrolysis 80:369–382.<br />
3. Rosenfield, A., Kak, A.C. 1982. Digital Picture Processing. 2nd Ed., New York: Academic<br />
Press.<br />
4. Fengel, D., Wegner, G. 1983. Wood-Chemistry Ultrast<strong>ru</strong>cture Reactions Walter de G<strong>ru</strong>yter &<br />
Co, Berlin, New York.<br />
5. Kleber, M., Sollins, P., Sut<strong>to</strong>n, R., 2007. Biogeochemistry 85: 9-24<br />
6. Conte, P., Spaccini, R., Chiarella, M., Piccolo, A. 2003. Geoderma 117: 243–250.<br />
7. Brash, J.L. and Horbett, T.A., (Eds.). 1995. Proteins at interfaces. II Fundamentals and<br />
applications. American Chemical Society, Washing<strong>to</strong>n, DC.<br />
238
Characterization of Humic and Fulvic Acids in Tropical Spodosols by<br />
FTIR and Fluorescence Spectroscopy<br />
Martha González-Pérez 1,2 , Pablo Vidal-Torrado 1 , Ladislau Martin-Ne<strong>to</strong> 2 ,<br />
Débora M.P.B. Milori 2 , Luiz A. Colnago 1<br />
1 Escola Superior de Agricultura “Luiz de Queiroz”. Dep<strong>to</strong> de Ciência do Solo. CP: 09, CEP: 13418-<br />
900. Piracicaba-SP, Brazil.<br />
2 Embrapa Inst<strong>ru</strong>mentação Agropecuária. CP: 741, CEP: 13560-970. São Carlos-SP, Brazil<br />
Keywords: podzols, humic substances, fluorescence, FTIR<br />
1. INTRODUCTION<br />
There is a special interest among soil science researchers on studying Podzols, also<br />
called Spodosols. These are formed from quartz sandy parent materials and are<br />
characterized by a peculiar horizon sequence: an organic surface horizon O, a weathered<br />
grey eluvial E horizon, and a dark brownish–reddish illuvial B horizon, which is enriched by<br />
organic matter (OM), Al and/or Fe (can be Bh, Bhs or Bs). The OM plays an essential role<br />
in the formation of Spodosols. It has been generally accepted that the migration of humus<br />
particles from the surface and their accumulation in deeper layers are the main processes<br />
of podzolization. The transport of Al and/or Fe through the profile as organic complexes is<br />
the dominant mechanism of eluviation and podzolization. However, the genesis of the<br />
podzolization process is still being researched.<br />
The aim of the present work is <strong>to</strong> characterize the humic (HA) and fulvic acids (FA)<br />
composition of Brazilian podzols by FTIR and fluorescence spectroscopy and their<br />
correlation with organic matter translocation in the podzolization process.<br />
2. MATERIALS AND METHODS<br />
Two Brazilian podzols were selected from sandy coastal soils (Restinga forests) in<br />
Cardoso Island, State of Sao Paulo, Southeast - Brazil. The profiles are part of a<br />
<strong>to</strong>posequence and are located 260 and 280 m near at the shoreline, respectively. The<br />
profile C14 has an E horizon 30 cm width and profile H13 has 8 cm. Table 1 shows some<br />
properties from those soils.<br />
239
Table 1. Distribution of size fractions separated from soil samples and some of their<br />
chemical properties<br />
Soil/ Depth Sand Silt Clay pH C/Me 1 C N<br />
Horizon cm -------------g kg -1 ---------- H 2 O ------g kg -1 ------<br />
Profile H13 - Histic Alaquod<br />
Ho 0-10 n. d. n. d. n. d. 3.8 14.9 319.0 15.3<br />
Hd 10-20 n. d. n. d. n. d. 4.0 40.5 241.0 5.4<br />
A1 20-30 n. d. n. d. n. d. 4.2 40.5 68.9 1.0<br />
E 30-38 970 0 30 4.3 0.0 4.7 0.5<br />
Bhs1 38-55 970 0 30 3.3 13.5 30.3 0.9<br />
Bhs2 55-75 960 0 40 3.2 11.1 15.5 0.4<br />
Bhs3 75-130 950 10 40 3.3 6.1 8.8 0.5<br />
Profile C14 - Typic Alorthod<br />
A 0-15 960 0 40 4.3 12.4 35.8 1.9<br />
AE 15-20 980 0 20 4.3 16.0 2.2 0.3<br />
E 20-50 980 10 10 5.0 0.0 0.3 0.3<br />
Bhs1 50-58 920 0 80 4.0 14.8 37.4 1.4<br />
Bhs2 58-75 900 0 100 4.0 10.4 64.2 1.9<br />
Bhs3 75-100 920 10 70 4.8 2.5 17.5 0.8<br />
Bs1 100-120 910 30 60 4.8 1.4 9.8 0.8<br />
n.d: not determine<br />
1 Me=Fe p +Al p<br />
Humic and fulvic acids were extracted using the IHSS method.<br />
FTIR spectra were recorded on a Perkin Elmer, Paragon 1000 PC<br />
spectropho<strong>to</strong>meter using KBr pellets (1 mg HA: 100 mg KBr).<br />
Fluorescence experiments were recorded on a Perkin Elmer LS 50B Luminescence<br />
spectrometer using NaHCO 3 (0.05 mg. L -1 ) solutions of HA (20 mg. L -1 ). Emission spectra<br />
were measured using λ ex = 240 nm. The synchronous spectra were recorded using Δλ=<br />
55mn. The scan speed was selected 200 nm min -1 .<br />
3. RESULTS AND DISCUSSION<br />
The soil particle size distribution of both profiles was similar. In all horizons, sand was<br />
the dominant fraction (> 90%), followed by clay and silt, corresponding with a sandy<br />
texture (Table 1). The soil pH was always very acidic, ranging from 3.2 <strong>to</strong> 4.8 in both<br />
profiles.<br />
The FTIR spectra of the HAs are very similar along and across profiles (Fig. 1). In the<br />
FTIR spectra of HA from profiles H13 (Fig. 1a) the reduction of non-dissociated carboxylic<br />
240
groups and the increment of dissociated ones with depth can be observed analyzing the<br />
intensity at 1715 cm -1 and at 1627 cm -1 . The FTIR spectra of the FAs (Fig. 1b) show an<br />
increase in dissociated carboxylic groups with depth. This may be associated with an<br />
increase in metal complexation with Al +3 , as indicated by the C/Me ratio. This represents<br />
strong evidence of vertical drainage of OM throughout the profile, and below the E horizon<br />
that the OM therefore was formed by illuviation.<br />
Absorbance<br />
Humic acids<br />
Profile H13<br />
Fulvic acids<br />
Profile H13<br />
Ho<br />
Ho<br />
Hd<br />
Hd<br />
A1<br />
A1<br />
Bhs1<br />
Bhs1<br />
Bhs2<br />
Bhs2<br />
Bhs3<br />
Bhs3<br />
4000 3500 3000 2500 2000 1500 1000 500<br />
4000 3500 3000 2500 2000 1500 1000 500<br />
Wavenumber (cm -1 )<br />
Wavenumber (cm -1 )<br />
a)<br />
b)<br />
Figure 1. FTIR spectra of HA (a) and FA (b) from Histic Alaquod (profile H13).<br />
Absorbance<br />
The content of COOH decreases with depth as observed by NMR results (1)<br />
suggesting a decrease of humification degree of OM downwards the soil profile.<br />
Fluorescence emission spectra (λ em = 240 nm) of HA from both profiles show a broad<br />
band, indicating a wider molecular heterogeneity and the presence of low and high<br />
condensated aromatic compounds. In contrast, the FA spectra show a narrow band.<br />
Figure 2 illustrates Fluorescence syncronous spectra (Δλ= 55 nm) of HA and FA from<br />
profile C14. The band of HA, which shows higher intensity is centered at 480 nm, in the<br />
region of more complex and humificated st<strong>ru</strong>ctures. On the other hand, FA spectra show<br />
the strongest band at 372 nm in the regions of less humificated compound. Thus, the HA<br />
show higher degree of condensation, conjugation and also humification than FA, and it<br />
decreases along the profile. The degree of humification of FAs increases with depth as<br />
can be seen by the increase of band at 475 nm. The humification degrees calculated by<br />
Kalbitz et al (2) and Zsolnay et al. (3) also support these results.<br />
241
Relative fluorescence intensity<br />
Humic acids<br />
Profile C14<br />
A<br />
Bhs1<br />
Bhs2<br />
Bhs3<br />
Bs1<br />
Fulvic acids<br />
Profile C14<br />
A<br />
Bhs1<br />
Bhs2<br />
200 300 400 500 600 700<br />
Bs1<br />
λ (nm)<br />
200 300 400 500 600 700<br />
λ (nm)<br />
a)<br />
b)<br />
Figure 2. Fluorescence syncronous spectra (Δλ= 55 nm) of humic (a) and fulvic acids (b)<br />
Relative fluorescence intensity<br />
from Typic Alorthod (profile C14).<br />
4. CONCLUSIONS<br />
The HA and FA composition in both profiles were similar indicating similar OM<br />
dynamics. This is an evidence of vertical translocation throughout the profiles, with no<br />
incorporation of OM components from other sources. FTIR and fluorescence spectra<br />
showed HAs are more humificated than FAs and indicated a reduction of aromaticity<br />
degree of HA with depth. The increase in dissociated carboxylic groups with depth may be<br />
associated with an increase in metal complexation with Al +3 , as indicated by the C/Me<br />
ratio. This is strong evidence of vertical drainage of OM throughout the profile and below<br />
the E horizon indicating that the OM was therefore formed by illuviation.<br />
ACKNOWLEDGEMENTS<br />
To FAPESP (projects: 04/03477-3 and 06/52408-0).<br />
REFERENCES<br />
1. González-Pérez, M., Vidal Torrado, P., Colnago, L.A., Martin-Ne<strong>to</strong>, L., Otero, X.L., Milori<br />
D.M.P.B., Gomes, F.H. 2007. Geoderma (submitted).<br />
2. Kalbitz, K., Geyer, S., Geyer, W. 2000. Chemosphere. 40, 1305-1312.<br />
3. Zsolnay, A., Baigar E., Jimenez, M., Steinweg, B., Saccomandi, F. 1999. Chemosphere. 38:1,<br />
45-50.<br />
242
Distribution of Water Soluble Organic Nitrogen (WSON) in Acidic Forest<br />
Soils, Southwestern China<br />
Jingheng Guo 1 , Yi Zhang 2 , Xiaoshan Zhang 2<br />
1 Colleage of Resources and Environmental Sciences, China Agricultural University, No. 2<br />
Yuanmingyuan West, Haidian District, 100094 Beijing, China, guojingheng@cau.edu.cn<br />
2 Reserch Center for Eco-Environmental Sciences, Chinese Academy of Sciences, No. 18<br />
Shuangqing Road, Haidian District, 100085 Beijing, China<br />
Keywords: water soluble organic nitrogen (WSON), acidic forest soils, N deposition<br />
1. INTRODUCTION<br />
Atmospheric nitrogen deposition has been a world wide environmental problem.<br />
Accelerated N deposition could significantly alter internal soil N cycling and lead <strong>to</strong><br />
nitrogen leaching (1). Water soluble organic nitrogen (WSON) was an important nitrogen<br />
fraction leached from forest soils (2). Though its percentage in <strong>to</strong>tal dissolve nitrogen<br />
(TDN) decreased with N deposition, the leaching flux of WSON seemed increase with<br />
nitrogen deposition in forest areas (2, 3). So far little is known on the geochemical<br />
processes of WSON in soils, because most focuses were put on the dynamics of inorganic<br />
nitrogen compounds in the previous studies.<br />
In some areas southern and southwestern China, N deposition was even higher than<br />
the values reported in Europe and North America (i.e. 25–38 kg ha -1 yr -1 ) (4). N deposition<br />
may have already brought some influences on the soil N processes in this subtropical<br />
region. However, we have little information about WSON in these acidic soils. In current<br />
study we presented the distribution of WSON in acidic forest soils, based on both field<br />
moni<strong>to</strong>ring and labora<strong>to</strong>ry soil extraction.<br />
2. MATERIALS AND METHODS<br />
Soil and water samples used in this study were collected from LuChongGuan (LCG),<br />
LeiGongShan (LGS) and TieShanPing (TSP) forest catchment, respectively. At these<br />
three catchments, located in southwestern China, long term moni<strong>to</strong>ring on the chemistry of<br />
precipitation, soil water and stream water was <strong>ru</strong>n by Sino-Norwegian IMPACTS<br />
(Integrated Moni<strong>to</strong>ring Program on Acidification of Chinese Terrestrial Systems) project<br />
since 1999. Detailed catchment information and moni<strong>to</strong>ring procedures of each catchment<br />
can be found in IMPACTS annual report (5) and manuals (available on:<br />
http://folk.uio.no/rvogt/Impacts). There were two kinds of soil solution (i.e. soil water and<br />
243
water extract) used in this study. Equipments for soil water sampling were located in 5 - 8<br />
soil water plots in each catchment. In each of these plots, 3 - 4 ceramic tension lysimeters<br />
(Ceramtec, Germany) were located at different soil depths according <strong>to</strong> genetic horizon<br />
(i.e. A, AB, B and BC horizon). Soil waters from all lysimeters were sampled weekly. The<br />
water extracts were obtained by adding 100 mL deionzied water <strong>to</strong> 20 g fresh soil, and<br />
then the slurries were shaken for 5 h. Water extracts were frozen after pass 0.45 μm filter<br />
until chemical analysis. For soil water and stream water samples, NO - 3 and NH + 4 were<br />
determined by Ion Chroma<strong>to</strong>graphy (Dionex, DX 120) in the IMPACTS qualified local<br />
labora<strong>to</strong>ries. For water extracts, nitrate (NO - 3 +NO - 2 ) and NH +<br />
4 were analyzed using<br />
international commonly used colorimetric methods after de-freezing. For all the water<br />
samples, <strong>to</strong>tal dissolved nitrogen (TDN) was determined by ultraviolet colorimetric method,<br />
after digestion using alkaline K 2 S 2 O 8 . The difference between TDN and inorganic nitrogen<br />
was calculated as WSON.<br />
3. RESULTS AND DISCUSSION<br />
The distribution of nitrogen species in soil water is shown in figure 1a. Total dissolved<br />
nitrogen (TDN) at TSP site ranged from 370 μmol/L in AB horizon <strong>to</strong> 710 μmol/L in A<br />
horizon, and was significantly higher than that at LCG and LGS site receiving lower N<br />
deposition (Table 1). Percentage of WSON varied with different sites and soil horizons. At<br />
LCG and LGS sites with lower nitrogen deposition, WSON was very important with<br />
percentage higher than 30%. In the B horizon of LGS sites, WSON even reached 59% of<br />
TDN. At TSP site with higher nitrogen deposition, WSON was not so important with<br />
percentage of about 5%. In addition, percentage of WSON generally increased with soil<br />
depth, except TSP site.<br />
Figure 1b shows the nitrogen distribution in water extracts. Compared with soil water,<br />
there were three significant differences in the nitrogen distribution. Firstly, the site variation<br />
in TDN of water extracts was not as large as soil water. TDN at LGS site was little bit<br />
higher than that at LCG and TSP sites, which may be due <strong>to</strong> higher soil nitrogen content in<br />
LGS site (Table 1). Secondly, in all horizons NH 4 -N reached <strong>to</strong> about 15% of TDN. This<br />
was likely due <strong>to</strong> the dissolution of weakly bound NH + 4 during shaking and extraction.<br />
Thirdly, WSON in water extracts increased significantly in all four TSP horizons with<br />
percentage of about 30%, compared with soil water. At LGS and LCG site, percentage of<br />
WSON did not changed so much.<br />
WSON was also important N species in stream water (Table 1). Its percentage,<br />
decreasing with N deposition, was 67%, 37% and 13% at LCG, LGS, and TSP,<br />
244
espectively. Such distribution was similar with that in soil water, but different from that in<br />
water extract. Leaching mobility of WSON is usually related with its locality in soil. WSON<br />
in soil water was transported through macro-pores, whiles most WSON in water extracts<br />
was located in micro-pores or precipitated on soil surface, with lower mobility. The lower<br />
WSON percentage in soil water may be one of the reasons for lower stream water WSON<br />
at TSP site. However, WSON in water extracts may be soluble and leached in certain<br />
hydrological and physiochemical conditions. Leaching of these water extractable WSON<br />
compounds may result in significant seasonal variations in stream WSON.<br />
TDN (μmol/L)<br />
800<br />
600<br />
400<br />
200<br />
0<br />
(a)<br />
LCG LGS TSP<br />
Percentage (%)<br />
20<br />
40<br />
60<br />
80<br />
100<br />
A AB B BC A AB B A AB B BC<br />
Soil horizon<br />
TDN NH + 4<br />
-N NO - 3<br />
-N WSON<br />
TDN (mg N/kg)<br />
Percentage (%)<br />
150<br />
120<br />
90<br />
60<br />
30<br />
0<br />
20<br />
40<br />
60<br />
80<br />
100<br />
(b)<br />
LCG LGS TSP<br />
A AB B BC A AB B A AB B BC<br />
Soil horizon<br />
TDN NH + 4<br />
-N NO - 3<br />
-N WSON<br />
Figure 1. Distribution of water soluble nitrogen species in different soil horizons.<br />
a): soil water; b): water extract.<br />
245
Table 1. Some related information about three catchments<br />
Site<br />
Soil<br />
Stream water<br />
N deposition<br />
g N/m 2 Org. C TN Inorg. N Org. N<br />
/yr pH<br />
% % μmol/L μmol/L<br />
LCG 0.70 4.27±0.24 4.40±6.17 0.25±0.33 16.87±13.07 33.73±12.51<br />
LGS 0.93 4.81±0.49 7.07±4.95 0.54±0.25 26.60±8.31 15.88±8.41<br />
TSP 1.93 4.22±0.23 5.30±12.92 0.20±0.43 65.18±18.52 9.73±13.82<br />
4. CONCLUSIONS<br />
Besides well known inorganic nitrogen, water soluble organic nitrogen (WSON) was<br />
an important nitrogen fraction in Chinese acidic forest soils. In lysimeter soil water and<br />
stream water, WSON percentage in TDN decreased with N deposition flux. In water<br />
extracts, percentage of WSON was less dependent on N deposition. WSON compounds<br />
obtained by different ways may have different roles in the WSON leaching from these<br />
acidic forest soils.<br />
ACKNOWLEDGEMENTS<br />
The study presented here was financially supported by Chinese Natural Science<br />
Foundation (No. 40773049; 40503013) and National Basic Research Program of China<br />
(No.2005CB422206).<br />
REFERENCES<br />
1. Aber, J.D., Goodale, C.L., Ollinger, S.V., et al. 2003. BioScience, 53, 375-389.<br />
2. Perakis S.S., Hedin L.O. 2002. Nature, 415, 416-419.<br />
3. Pellerin B.A., Kaushal, S.S., McDowell, W.H. 2006. Ecosystems, 9, 852-864.<br />
4. Chen, X.Y., Mulder, J., Wang, Y.H., et al. 2004. Environ. Geochem. Health, 26,179-186.<br />
5. IMPACTS, 2004. Integrated moni<strong>to</strong>ring program on acidification of Chinese terrestrial systems,<br />
Annual Report, Results 2003. NIVA report no 4905-2004, ISBN 2-577-4594-4.<br />
246
Evolution and NOM<br />
Kari Hänninen<br />
University of Jyväskylä, Department of Biological and Environmental Science, P.O.Box 35,<br />
FIN40014 University of Jyväskylä, kahannin@bytl.jyu.fi<br />
Keywords: natural organic matter, humic acids, functional recalcitrance, lignin-free environment<br />
1. INTRODUCTION<br />
The earliest forms of life on Earth were aquatic, non-vascular plants which did<br />
contain carbohydrates but not lignin. These lignin-free, non-vascular plants have formed<br />
natural organic matter (NOM) in soils already in the Late Ordovician and Early Silurian<br />
ages.<br />
Formation of lignin was an essential evolutionary step <strong>to</strong> support the vascular plant<br />
st<strong>ru</strong>cture for terrestrial life. Vascular, lignin containing plants were present in the Early<br />
Devonian time but only during Carboniferous time they started dominated the landscape.<br />
In the time scale of the evolution of pho<strong>to</strong>synthetic organisms lignification is a relatively<br />
recent process.<br />
2. MATERIALS AND METHODS<br />
This is a deductive study of the humification from the evolutionary point of view:<br />
evaluate the importances of lignin and carbohydrates as contribu<strong>to</strong>rs <strong>to</strong> the NOM and HA<br />
while keeping in mind that carbohydrates are evolutionary older than lignin, and that<br />
humification is practically as old as carbohydrates.<br />
3. RESULTS AND DISCUSSION<br />
An important feature associated <strong>to</strong> HA is their recalcitrance. This is thought <strong>to</strong> be<br />
derived from lignin constituents in HA, and taken as a proof about the aromatic nature of<br />
HA. On the other hand, carbohydrate st<strong>ru</strong>ctures are thought <strong>to</strong> be non-recalcitrance, and<br />
rapidly consumed by microbes during humification.<br />
At present, aquatic plant forms still do not contain lignin. So in lignin-free<br />
environments, humification, one of the major pedogenic fac<strong>to</strong>r, has been <strong>ru</strong>nning through<br />
the eons with the same original mechanism from the very beginning. This suggests that<br />
carbohydrates have recalcitrance in humification.<br />
Some microbes start the humification process, others continue it. These microbial<br />
populations have a succession, and new microbes are not only utilizing the original<br />
247
iomass, they utilize remnants of the previous populations/generations as well. This<br />
recycling through the microbial metabolism provides a kind of functional recalcitrance <strong>to</strong><br />
the carbohydrate st<strong>ru</strong>ctures.<br />
Actually, the carbohydrate st<strong>ru</strong>ctures have chemical resistance as well. In alkaline<br />
pulping wood polysaccharides are attacked by strong alkali solutions at elevated<br />
temperatures, and several peeling and hydrolytic reactions are taken place. Peeling<br />
reaction, which is leading <strong>to</strong> the loss of terminal polysaccharides, is actually protecting the<br />
rest of the cellulose molecule. Further reactions are s<strong>to</strong>pped and so cellulose can be<br />
extracted as long fibers. Lignin, on the other hand is soluble under these conditions.<br />
Many researches have already proved that aerobic microbes are degrading lignin.<br />
However, it is still thought that aromatic constituents are not degraded by microbes in<br />
anaerobic environments.<br />
Recent biotechnology studies, however, have shown beyond doubt that aromatic<br />
st<strong>ru</strong>ctures are degrading in anaerobic conditions (Roman, 2004). Lignin, actually, does not<br />
have such recalcitrance in dead material that it is supposed <strong>to</strong> have. Additionally we need<br />
<strong>to</strong> observe that in humification lignin has a non-returnable, disposable nature: no microbial<br />
mechanism is producing new lignin in the system. Particularly in this aspect lignin is more<br />
fragile than carbohydrates, its only fate in humification is <strong>to</strong> be consumed.<br />
4. CONCLUSIONS<br />
It is relevant <strong>to</strong> suppose that when lignin was emerged, the humification process<br />
accepted is as one additional material <strong>to</strong> consume rather that lignin fundamentally would<br />
have changed the process. It seems that 1) the recalcitrance, and importance of lignin in<br />
humification has been overestimated, and 2) those of carbohydrates has been<br />
underestimated.<br />
REFERENCES<br />
1. Henry James Roman: The degradation of lignocellulose in a biologically-generated sulphidic<br />
environment. PhD-Thesis, Rhodes University, South Africa, 2004<br />
248
Long Term Trends of DOC and Colour in Raw Water from a Forest Lake<br />
Caused by Increased Precipitation and Changed Precipitation<br />
Chemistry<br />
Dag Hongve 1 , Ståle Haaland 2, Gunnhild Riise 2 , Svanhild L. Fausk<strong>ru</strong>d 3<br />
1 Norwegian Institute of Public Health, dag.hongve@fhi.no<br />
2 Norwegian University of Life Sciences<br />
3 Oslo Water and Sewerage Works<br />
Keywords; humic, colour, climate, acid rain<br />
1. INTRODUCTION<br />
The forested area Østmarka near the city of Oslo is the catchments area for one of<br />
the major water utilities serving the capital. A study of raw water from the reservoir and<br />
selected minor lakes in the area shows that the water quality has changed significantly<br />
from 1983 <strong>to</strong> 2007.. We will here propose and discuss mechanisms of how precipitation<br />
quantity and quality influences coloured dissolved organic matter (DOM) species<br />
2. MATERIALS AND METHODS<br />
Lake Elvåga is a drinking water reservoir situated within Østmarka, a forest area<br />
neighbouring Oslo city. The lake has a surface area of 1 km 2 and theoretical retention time<br />
about two years. The waterwork’s data series for raw water extracted from 40 m depth<br />
dates back <strong>to</strong> 1983.T<strong>ru</strong>e colour and DOC have been measured with up <strong>to</strong> daily resolution .<br />
We have also sampled a selection of other lakes in Østmarka with variable hydrological<br />
characteristics Size separation of samples from the autumnal turnover are performed with<br />
Amicon Ultra Centriprep YM-10 filters. DOC in filtrates is determined with a Shimadzu<br />
TOC-V analyzer T<strong>ru</strong>e colour of filtered samples is determined according <strong>to</strong> (4)<br />
3. RESULTS AND DISCUSSION<br />
Our study shows that the water quality in the reservoir an the other lakes has<br />
changed significantly with decreased concentrations of sulphate and increased<br />
consentrations of DOC and t<strong>ru</strong>e colour (Fig. 1) <strong>From</strong> correlations of these trends with<br />
fluctuations in precipitation and long time trends in deposition of strong acid anions in<br />
precipitation (especially acid rain related sulphate) we propose mechanisms of how<br />
precipitation quantity and quality influences coloured dissolved organic matter (DOM)<br />
species.<br />
249
mg l -1 CU<br />
4<br />
3<br />
2<br />
1<br />
0<br />
4<br />
2<br />
Colour<br />
DOC<br />
0<br />
1975<br />
1980<br />
1985<br />
1990<br />
1995<br />
2000<br />
Figure 1. Temporal changes in colour and DOC concentrations in raw water at the<br />
Skulle<strong>ru</strong>d treatment plant (3).<br />
First: Inter annual changes in concentration of DOC and the specific colour of DOM<br />
in the studied surface waters are basically driven and explained by variations in amount of<br />
precipitation.(3) DOM in the lakes are generally more coloured in wet than in dryer years.<br />
Size separation analyses demonstrate that the DOM with high nominal molecular weight<br />
(>10 000 Dal<strong>to</strong>n) have higher specific colour (Colour/DOC) than low molecular weight<br />
compounds (Figs 2 and 3).<br />
Figure 2. Specific absorption (SA 410 ) for the nominal high molecular weight fraction of DOC<br />
(> 10 kDa) and low molecular weight fraction of DOC (< 10 kDa) in lake samples from<br />
2005. The results are arranged according <strong>to</strong> increasing specific absorption for the high<br />
molecular weight fraction.<br />
250
Climatic change <strong>to</strong>wards more frequent episodes with heavy rain and higher<br />
concentrations of high molecular weight DOM species leached from the upper forest floor<br />
during high precipitation episodes can, therefore, explain a development <strong>to</strong>wards more<br />
coloured lake waters (2)<br />
10<br />
8<br />
% HMW<br />
60<br />
40<br />
20<br />
6<br />
4<br />
2<br />
Specific colour<br />
0<br />
0<br />
%HMw >10 kDa<br />
Ratio CU/DOC<br />
Linear regression (r 2 = 0.36)<br />
Figure 3. Percentage of nominal high molecular weight NOM (>10000 Da) and<br />
Colour/DOC ratio for in lake water samples from autumn turnover 2004 (2).<br />
Secondly: The recent decline in acid deposition, and reduction in sulphur<br />
concentration and ionic strength in precipitation, influence important mechanisms for<br />
leaching and precipitation of DOM. This appears as a co working reason for the long term<br />
increased DOC and water colour in Østmarka.We have also studied an expanded dataset<br />
for the years 1986-2005 for 77 lakes all over Norway which were sampled and analysed<br />
annually for major ionic constituents, aluminium fractions and TOC (5). In this study we<br />
see that the lakes with a high sulphate/chloride ratio had the most substantial increase in<br />
TOC over the 20 year period. These lakes are in general the ones with the lowest ionic<br />
strength that also had a marked reduction in sulphate concentrations due <strong>to</strong> the acid rain<br />
decline. Furthermore, we see substantial yearly variations in several of the lakes, mainly in<br />
those with large natural fluctuations in chloride (seasalt) concentrations (1, 2, 4).<br />
251
ACKNOWLEDGEMENT<br />
We thank the research council of Norway for funding the project: “Effect of climate<br />
change on flux of N and C: air-land-freshwater-marine links (CLUE), no 155826”<br />
(www.climatechange.no/clue). We appreciate technical support at the labora<strong>to</strong>ries of<br />
Department of Plant- and Environmental Sciences, Norwegian University of Life Sciences,<br />
Oslo Water and Sewage Works,and the Norwegian institute of Public Healt. Per Kristian<br />
Lunde and Ingvild Riise Lunde are acknowledged for pleasant assistance during fieldwork.<br />
REFERENCES<br />
1. Haaland, S. Blakar, I., Grøte<strong>ru</strong>d, O., Hongve, D. and Riise, G. (in press) TOC concentrationsin<br />
Norwegian lakes – governed by natural variations and climate change. Verh Int. Ver. Limnol.<br />
30.<br />
2. Haaland, S., Hongve, D, Riise,G.,.and Vogt, R.D. Lake water colour governed by the quantity<br />
and quality of precipitation – impact of sulphate, chloride and hydrological flow<br />
patterns(manuscript)<br />
3. Hongve, D., Riise, G.,and Kristiansen, J.F. 2004 Increased colour and organic concentrations<br />
in Norwegian forest lakesand drinking water – a result of increased precipitation.Aquat. Sci<br />
66:1-8.<br />
4. Hongve,D and Åkesson, G. 1996. Spectropho<strong>to</strong>metric determination of water colour in Hazen<br />
units. Water Res.02771-2775.<br />
5. Monteith, D.T., S<strong>to</strong>ddard,J.L., Evans, C.D., de Wit, H. A., Forsius, M.,Høgåsen, T., Wilander,<br />
A., Skjelkvåle, B. L., Jeffries,D.S., Vuorenmaa, J., Keller, B, Kopácek,J. & Vesely, J. 2007.<br />
Dissolved organic carbon trends resulting from changes in atmospheric deposition chemistry.<br />
Nature 450, 537-540<br />
6. Skjelkvåle, B.L. 2006. Moni<strong>to</strong>ring long-range transboundary air pollution 2005 - Summary<br />
report (in Norwegian). SFT-report:2183-2006<br />
252
Role of Aromaticity Degree in the Stability of Humic Substances<br />
Jiří Kislinger 1 , František Novák 2 , Jiří Kučerík 1<br />
1 Institute of Applied and Physical Chemistry, Faculty of Chemistry, Brno University of Technology,<br />
Purkyňova 118, 61200 Brno, Czech Republic, kucerik@fch.vutbr.cz<br />
2 Biology Centre of the Academy of Sciences of the Czech Republic, Branišovská 31, 37005, České<br />
Budějovice, Czech Republic<br />
Keywords: humic substances, aromaticity, thermogravimetry, isoconversional methods<br />
1. INTRODUCTION<br />
Because of global warming and other environmental problems, the reduction of<br />
greenhouse gases is of worldwide interest. Such process demands fundamental<br />
understanding of carbon (C) stabilization in soils because the amount of organic matter<br />
s<strong>to</strong>red in soils represents one of the largest reservoirs of organic carbon on the global<br />
scale. The mechanisms for carbon stabilization in soils are still not well unders<strong>to</strong>od and<br />
thus the ultimate potential for C stabilization in soils is unknown (1).<br />
Both soil fertility and stability are related <strong>to</strong> its organic matter presence. Many<br />
functions of soil organic matter (SOM) are due <strong>to</strong> its stable fraction, the humified materials,<br />
and <strong>to</strong> its balance with the labile fractions. Changes in SOM content are related <strong>to</strong><br />
changes in microbial biomass turnover, because they reflect the balance between rates of<br />
microbial organic matter accumulation and degradation. However, SOM as a whole<br />
responds less quickly <strong>to</strong> changing soil conditions than microbial biomass. Therefore, the<br />
nature of the organic matter itself, rather than its concentration, may be more sensitive<br />
indica<strong>to</strong>r of the changes in soil quality. Chemical and st<strong>ru</strong>ctural characteristics of humic<br />
substances (HS) are known <strong>to</strong> be better predic<strong>to</strong>rs of the rate of SOM turnover than SOM<br />
content itself. (2)<br />
The main fraction of organic matter contained in soils, peats, sediments, low-rank<br />
coals (leonardites, lignites) and natural waters consists of humic substances, which<br />
comprise a complex mixture of both aromatic and aliphatic moieties, having a large<br />
number of functional groups (3).<br />
Processes in condensed phase are extensively studied by thermoanalytical methods.<br />
Mechanisms of these processes are very often unknown or <strong>to</strong>o complicated <strong>to</strong> be<br />
characterized by simple kinetic model. To describe their kinetics, the methods based on<br />
the single-step approximation are often used, either the model-free or model-fitting ones. It<br />
is generally recognized that the rate of the processes in condensed phase is a function of<br />
253
temperature (T) and conversion (α). The rate of the complex multi-step condensed-state<br />
process can be formally described as<br />
dα<br />
k( T ) f ( α)<br />
dt = , (1)<br />
where k(T) is temperature function and f(α) conversion function. Basic assumption is<br />
that these two functions are separable, independent of each other. The temperature<br />
function in Eq. (1) is mostly considered <strong>to</strong> be the rate constant (depending solely on<br />
temperature T) and the conversion function is considered <strong>to</strong> reflect the mechanism of the<br />
process (depending solely on conversion α). (4, 5)<br />
With only for few exceptions, the temperature function is expressed by the Arrhenius<br />
equation<br />
k<br />
E<br />
= exp<br />
⎢<br />
, (2)<br />
⎣ RT<br />
⎡ ⎤<br />
( T ) A −<br />
⎥ ⎦<br />
where A and E are considered the pre-exponential fac<strong>to</strong>r and the activation energy,<br />
respectively, T is the absolute temperature and R stands for the gas constant.<br />
The evaluation is carried out at fixed conversion. The use of isoconversional<br />
predictive procedure is huge; it has already been successfully employed also in studying<br />
humic substances. (6)<br />
2. MATERIALS AND METHODS<br />
The samples of humic substances extracted according <strong>to</strong> IHSS procedures included<br />
3 fulvic and 9 humic acids. Their origin varied from lignites and leonardites <strong>to</strong> soil HS<br />
(cambisols, podzols). The aromaticity of samples was determined by 13 C LS NMR analysis<br />
and varied from 25 <strong>to</strong> 70 %.<br />
Thermogravimetric analyses of all samples in the dynamic air atmosphere were<br />
performed. For this purpose TA Inst<strong>ru</strong>ments TGA Q 5000 IR was used. Samples were<br />
measured in an open c<strong>ru</strong>cible at 7 different heating rates up <strong>to</strong> 600 °C.<br />
3. RESULTS AND DISCUSSION<br />
The thermogravimetric records showed two or more steps of weight losses, the first<br />
one attributable <strong>to</strong> loss of water, whereas others <strong>to</strong> degradation of organic matter. The<br />
latter steps were used <strong>to</strong> assess the stability of examined samples. The mass losses<br />
obtained at different heating rates were recalculated <strong>to</strong> conversion intervals (0–100 %).<br />
<strong>From</strong> this interval, several conversions were selected and for those the stability for 100 °C<br />
was calculated using Arrhenius temperature function. This temperature was adopted<br />
254
ecause some problems may appear when data obtained at higher temperatures are<br />
approximated <strong>to</strong> the lower ones. The reason can be seen, among others, in morphological<br />
differences in the sample at high and low temperatures or simply in introduction of different<br />
reactions occurring exceptionally at elevated temperatures (6). Values of stabilities served<br />
for comparison between samples and helped in elucidation of role of aromaticity during the<br />
humic substances degradation.<br />
Figure 1. Degradation patterns of 4 different humic types at heating rate 10 K/min.<br />
Figure 1 displays degradation patterns of four distinct humic substances (2 humic<br />
and 2 fulvic acids) with different degrees of aromaticity. The differences indicate that<br />
changing content of aromatic carbon profoundly affects the rate of degradation (i.e.<br />
kinetics and thus stability) in degradation progress. It is generally accepted that<br />
degradation proceeds from labile parts of humified matter <strong>to</strong> stable constituents<br />
represented by aromatic and heterocyclic cores.<br />
Values obtained from the recalculation of temperatures from Fig. 1 imply that high<br />
degree of aromaticity plays a role mainly at the beginning of degradation. As suggested<br />
elsewhere (7), humic molecules tend <strong>to</strong> recombine and therefore the introduction of new,<br />
more stable molecules is probable. Moreover, samples with higher aromaticity degree<br />
255
showed a sudden increase in kinetics of degradation at higher conversions. Sample with<br />
the highest aromatic content (HA 1) shows initially slow degradation, which later<br />
accelerates. The explanation is as stated above, first the low amount of aliphatic parts and<br />
after that the aromatic st<strong>ru</strong>ctures degrade. HA 2 and FA 1 have almost the same aromatic<br />
C content and also their degradation kinetics profiles are practically similar. On the<br />
contrary, FA 2 is the least aromatic sample and its degradation in the beginning is fast but<br />
than significantly slows down and gradually continues up <strong>to</strong> high temperatures. In this case<br />
the recombination processes and thus formation of stable, originally absent molecules is<br />
most probable.<br />
4. CONCLUSIONS<br />
Summarizing all the results, it can be seen that the aromaticity itself is not the<br />
absolute indica<strong>to</strong>r of stability of humic materials but can be helpful in assessment of soil<br />
organic matter erosion and help in development of remediation and soil res<strong>to</strong>ration<br />
techniques.<br />
ACKNOWLEDGEMENTS<br />
The financial support of Ministry of Education of the Czech Republic, project<br />
MSM 0021630501 is acknowledged.<br />
REFERENCES<br />
1. v. Lützow, M., Kögel-Knaber, I., Ekschmitt, K., Matzner, E., Guggenberger, G., Marschner, B.,<br />
Flessa, H. 2006. Eur. J. Soil Sci. 57, 426-445.<br />
2. Dell’Abate, M. T., Benedetti, A., Brookes, P. C. 2003. J. Sep. Sci. 26, 433-440.<br />
3. Hayes, M.H.B., MacCarthy, P., Malcolm, R.C., Swift, R.S. 1989 In: Humic Substances II. In<br />
Search of St<strong>ru</strong>cture, Wiley, New York.<br />
4. Šimon, P. 2007. J. Therm. Anal. Cal. 88, 709-715.<br />
5. Šimon, P. 2005. J. Therm. Anal. Cal. 82, 651-657.<br />
6. Válková, D., Kislinger, J., Pekař, M., Kučerík, J. 2007. J. Therm. Anal. Cal. 89, 957-964.<br />
7. Kučerík, J., Kamenářová, D., Válková, D., Pekař, M., Kislinger, J. 2006. J. Therm. Anal. Cal.<br />
84, 715-720.<br />
256
Humic Acids St<strong>ru</strong>cture as a Reflection of Bioclimatic Fac<strong>to</strong>r of Soil<br />
Formation in Boreal Ecosystems<br />
Boris Klenov 1 , Gonzalo Almendros 2<br />
1 Institute of Soil Science and Agrochemistry of SB RAS, Sovietskaya St 18, 630099 Novosibirsk,<br />
Russia, klenov@issa.nsc.<strong>ru</strong><br />
2 Center of Environmental Sciences of CSIC, Serrano 115B, 28006, Madrid, Spain,<br />
humus@ccma.csic.es<br />
Keywords: climatic belts, humic acids, elemental composition, optical density<br />
1. INTRODUCTION<br />
The given paper is a part of joint work conducted in the frame of bilateral scientific<br />
exchange between CCMA CSIC and ISSA SB RAS.<br />
At present the fact is beyond of any doubt that fac<strong>to</strong>rs involved on humus formation<br />
and soil formation are absolutely the same. As a product of soil formation soil humus is<br />
known <strong>to</strong> be as a system of macromolecular, polydisperse heterogeneous and<br />
heterochronous substances. Its accumulation in soils, its nature and properties and the<br />
st<strong>ru</strong>cture of its specific constituents such as humic acids (HA) and fulvic acids (FA) which<br />
are closely related <strong>to</strong> the type of soil formation, in particular <strong>to</strong> bioclimatic conditions (1).<br />
Thus, the changes in climate and humus-forming material should be reflected in humus<br />
accumulation and its nature. Such a regularity is especially clearly pronounced by the<br />
example of au<strong>to</strong>morphic soils of the northern hemisphere where in the direction from the<br />
north <strong>to</strong> the south the increase in aridization degree is rather sharply revealed.<br />
2. MATERIALS AND METHODS<br />
The experimental design was based on sampling from soil sequence ranging within<br />
the limits of various bioclimatic belts of the Western Siberia. The soils under study (Table)<br />
develop under contrasting bioclimatic conditions of the 8-th belt of continentality (2). While<br />
determining humus reserve in 1-m soil layer the soils of semiarid area of Central Spain<br />
(Vertic Luvisols) have been also taken in<strong>to</strong> consideration as a typical object of an extreme<br />
arid link of the same 8-th belt of continentality (2). The isolation and qualitative analysis of<br />
humus fraction such as carbon ratio of HA and FA, elemental analysis of HA were carried<br />
out in ISSA SB RAS by generally accepted procedures described elsewhere (3). The<br />
values of spectroscopic characteristics of HA in the visible range (E4 and E6)/E6) were<br />
determined in labora<strong>to</strong>ries of CCMA CSIC and ISSA SB RAS from solutions of 200 mg<br />
257
CL -1 in 0,02 M NaHCO 3. Degree of aromaticity (DA) was calculated based on data of<br />
elemental analysis of HA by modified graphical statistical Van-Krevelen method (4). The<br />
moistening coefficient (C m ) was taken from the literature (5, 6). It is generally agreed that<br />
this coefficient being as a ratio of precipitation and evaporation is a convenient and<br />
representative one in comparative geographical studies of humus formation although, as it<br />
was shown later (6), it is presumably of theoretical significance.<br />
3. RESULTS AND DISCUSSION<br />
Figure. Distribution of humus reserve in 1-m soil layer of the Northern Hemisphere. 1-<br />
Tundra, 2 - Boreal forests (taiga), 3 - Forest steppe, 4 – Steppe, 5 – Dry steppes and<br />
semideserts.<br />
As it is evidenced by Figure, humus accumulation is definitely dependent on<br />
bioclimatic conditions. As for the Western Siberia, the maximum values are typical for the<br />
belt with optimal bioclimatic situation (Cm around 1), i.e. for forest steppe. High humus<br />
accumulation is here favored by concentration of grass phy<strong>to</strong>mass in soil layer (up <strong>to</strong> 90%<br />
of <strong>to</strong>tal), over-ground part is of subordinate significance. It is significant <strong>to</strong> note that<br />
excessive moisture and deficiency of heat (tundra, taiga) as well as excessive heat and<br />
deficiency of moisture (steppe, semideserts) produce practically the same effect.<br />
As it is evidenced by the data of the Table, the increase in aridity within the limits of<br />
the same belt of continentality is a main reason of the change of humus nature as a whole<br />
and its constituents, HA in particular. Qualitative composition of humus, as a <strong>ru</strong>le, does not<br />
depend greatly on the magnitude of humus accumulation. Specifically, one of the main<br />
characteristics of humus quality, for example carbon ratio of HA and FA (HA/FA) increases<br />
with increase in aridity that is quite natural. It is well known that nonpercolative water<br />
regime and calcium deficiency in biological cycle are an important fac<strong>to</strong>r <strong>to</strong> favor HA<br />
formation. Other indices of HA st<strong>ru</strong>cture proved <strong>to</strong> be rather informative as well as <strong>to</strong> show<br />
its dependence on bioclimatic situation.<br />
258
Table. HA/FA and basic st<strong>ru</strong>ctural indices of HA of A soil horizon<br />
Soil, location HA/FA A<strong>to</strong>mic H/C E4/E6 DA,% Cm<br />
Epigenic Albeluvisols, taiga<br />
(soils of Podzol type)<br />
Albic Luvisols, forest steppe<br />
(soils of Grey forest type)<br />
Luvic Сhernozem, forest steppe<br />
(soils of Chernozem type)<br />
Kastanozems/Calcisols<br />
(steppe Chestnut soils)<br />
0,4-0,6 1,2-1,4 4,3-5,0 ≤20 ≥2,0<br />
0,8-1,5 1,0-1,1 3,6-4,0 20-25<br />
1,8-2,5 0,8-0,9 3,3-3,5 25-30<br />
1,5-1,8 0,6-0,8 3,3-3,5 30-35<br />
For example, the decrease of the H/C values in the direction from the north <strong>to</strong> the<br />
south indicates the decrease of the role of H in the st<strong>ru</strong>cture of HA and respectively <strong>to</strong><br />
increase in degree of HA polymerization (polycondensation). This fact is in accordance<br />
with the increase in climate aridity in soil sequence under study. Such a regularity<br />
conforms <strong>to</strong> other st<strong>ru</strong>ctural indices of HA such as values of E4/E6 and degree of<br />
aromaticity (DA HA).<br />
According <strong>to</strong> universal scientific experience, the lowering of E4/E6 can formally<br />
witness <strong>to</strong> the fact that on increasing aridization the concentration of aromatic nuclei,<br />
molecule size and molecular mass also increase <strong>to</strong> some extent.<br />
DA HA is a representative index on soil type level in natural virgin soils where the<br />
processes of decomposition and new formation of organic matter are practically in<br />
equilibrium (4). It is also representative index for HA of agricultural soils affected by human<br />
impact, for example as a result of prolonged practical activity (4). Corresponding data<br />
given in the Table testify that increase in the role of thermal fac<strong>to</strong>r favors <strong>to</strong> increase in DA<br />
HA.<br />
In environmental respect the increase in DA can not be considered as being<br />
favorable phenomenon. It has been shown by labora<strong>to</strong>ry and field (fire effect) experiments<br />
that heating leads <strong>to</strong> an increase in aromaticity of humus acids and removal of oxygencontaining<br />
groups (7-9). In fact, even FA are transformed in<strong>to</strong> acid insoluble organic matter<br />
similar <strong>to</strong> HA, and HA undergo further dehydratation and decarboxylation, becoming as<br />
humin-like fraction resembling kerogen or the so-called black carbon material.<br />
4. CONCLUSIONS<br />
<strong>Humus</strong> is known <strong>to</strong> be for the most part a product of soil-forming process, therefore<br />
the bioclimatic conditions of especially contrasting belts leave a mark on its accumulation<br />
as a whole and on the nature of its principal constituents, HA in particular. Some st<strong>ru</strong>ctural<br />
1,0-<br />
1,2<br />
8,8-<br />
1,1<br />
0,4-<br />
0,6<br />
259
indices of HA are greatly influenced by thermal fac<strong>to</strong>r as it was shown by our example with<br />
increase in aridity. The data obtained permit us <strong>to</strong> arrive <strong>to</strong> an idea that under condition of<br />
increasing global warming HA because of increase in DA can lose bioprotective function<br />
and can be converted in<strong>to</strong> inert material.<br />
ACKNOWLEDGEMENTS<br />
We wish <strong>to</strong> thank the staff of Labora<strong>to</strong>ry of Soil Geography and Genesis of ISSA SB<br />
and Soil Chemistry Labora<strong>to</strong>ry of CCMA-CSIC for scientific and technical assistance.<br />
REFERENCES<br />
1. Tishenko V.V., Rydalevskaya M.D. The experience of chemical research of humic acids of<br />
different soil types. 1936. Reports of AS USSR, 4/3, 137-140. (In Russian).<br />
2. Ivanov N.N. Continentality belts of the Earth. 1959. Proceedings of All-Union geographical<br />
society 5, 410-423 (In Russian).<br />
3. Orlov D.S., Grishina L.A. Practical work on humus chemistry. 1981. Moscow: Moscow State<br />
University, 272 p. (In Russian).<br />
4. Orlov D.S. 1990. Soil <strong>Humus</strong> acids and general theory of humification. Moscow: Moscow State<br />
University. 326 p. (In Russian).<br />
5. Klenov B.M. <strong>Humus</strong> of West-Siberian soils. 1981. Moscow: Nauka, 144 p. (In Russian).<br />
6. Cañizo J., Mateo-Sagasta E., Lopez de Sagredo F., Roquero de Labu<strong>ru</strong> C. 1960. Geografía<br />
agrícola de España, 319 p., Madrid.<br />
7. Tinoco P., Almendros G., Sanz J., Gonzáles-Vázquez R., González-Vila F.J. 2006. <strong>Molecular</strong><br />
descrip<strong>to</strong>rs of the effect of fire on soils under pine forest in two continental Mediterranean<br />
soils. Organic Biochemistry 37, 1995-2018.<br />
8. Almendros G., González-Vila F.J., Martin F. 1990. Fire-induced transformation of soil organic<br />
matter from an oak forest: an experimental approach <strong>to</strong> the effect of fire on humic substances.<br />
Soil Science 42, No. 3, 158-168.<br />
9. Almendros G., Martin F., Gonzalez-Vila F.J. Effect of fire on humic and lipid fraction in a<br />
District Xerocrept in Spain. 1988. Geoderma, 42. No.3, 115-127.<br />
260
Bioluminescent Moni<strong>to</strong>ring of De<strong>to</strong>xification Processes<br />
N. Kudryasheva 1,2 , E. Fedorova 1,2 , T. Rozhko 1,2 , M. Alexandrova, O. Mogil’naya 1 ,<br />
G. Vydryakova 1,2 , L. Bondareva 1 , A. Bolsunovsky 1 , D. S<strong>to</strong>m 3<br />
1 Institute of Biophysics SB RAS, Krasnoyarsk, Russia, kudr@ibp.<strong>ru</strong><br />
2 Siberian Federal University, Krasnoyarsk, Russia<br />
3 Irkutsk State University, Irkutsk, Russia<br />
Keywords: de<strong>to</strong>xification, bioluminescent assay, quinones, radionuclides<br />
1. INTRODUCTION<br />
It is known that bioluminescent bacteria and enzymes isolated from these bacteria<br />
are used as ecological assay systems. They are convenient objects <strong>to</strong> study remediation<br />
processes. Luminous bacteria and their bioluminescent enzymatic reactions are<br />
considered as the simplest models of living organisms. This is a reason of their application<br />
as bioassay, mainly in ecological investigations. Advantages of this assay are simplicity,<br />
fast response, and no requirement for highly organized organisms.<br />
Generally, the main feature of all bioassays is integral response, hence, they could<br />
be applied as alarm tests, indicating habitat unfavourable for life. The results of bioassay<br />
reveal the necessity of a detailed chemical assay, which is more expensive and timeconsuming<br />
than the biological one (1).<br />
Microorganisms, luminous bacteria included, are currently preferable in ecological<br />
moni<strong>to</strong>ring as bioassays (1-2). The main principle of the bioluminescent assay is <strong>to</strong><br />
correlate <strong>to</strong>xicity of samples and the changes in bioluminescent intensity.<br />
Advantages of bioluminescent assays are simplicity fast response (1-3 min),<br />
sensitivity; bioluminescent assays are not expensive; they do not use highly-organized<br />
organisms. There exists a possibility <strong>to</strong> use bioluminescent assay systems of different<br />
organization level, i.e. in vivo or in vitro. The last position is very important because it<br />
provides possibility <strong>to</strong> compare <strong>to</strong>xic effects on the levels of whole cells and enzymatic<br />
reaction. This means that we can discuss mechanism of a <strong>to</strong>xic effect.<br />
One more important point deals with the fact that bioluminescent assay systems are<br />
a basis of bioluminescent biosensors which appeared <strong>to</strong> be very promising now.<br />
In paper (3) the bioluminescent assay in vivo was applied <strong>to</strong> evaluate de<strong>to</strong>xification<br />
efficiency under combination of the de<strong>to</strong>xification fac<strong>to</strong>rs – UV and VIS irradiation, humic<br />
substances’ and microorganism’ treatment. Proper de<strong>to</strong>xification fac<strong>to</strong>rs and conditions<br />
were found. In (4) the bioluminescent assay systems were shown <strong>to</strong> be sensitive <strong>to</strong> the<br />
261
solutions of alpha-radioactive elements (with Americium-241 taken as an example) of low<br />
and mean activity.<br />
The aim of the paper is <strong>to</strong> demonstrate a potential of bioluminescent assay systems<br />
in study of de<strong>to</strong>xification processes. Organic oxidizers (quinones) and alpha-radioactive<br />
compounds were taken as examples of <strong>to</strong>xic compounds.<br />
2. MATERIALS AND METHODS<br />
A series of quinones with different redox characteristics: 1,4-benzoquinone,<br />
tetrafluoro-1,4-benzoquinone, methyl-1,4-benzoquinone, tetramethyl-1,4-benzoquinone,<br />
and 1,4-naph<strong>to</strong>quinone, was used.<br />
The <strong>to</strong>xicity of quinone solutions was assessed using the bioluminescent assay in<br />
vivo - Microbiosensor 677F, based on the lyophilized luminous bacterium Pho<strong>to</strong>bacterium<br />
phosphoreum (Krasnoyarsk, Russia). The influence of 50µl of the quinones on the bacteria<br />
was studied in 0.5 ml of 3% NaCl solution.<br />
Solutions of 241 Am(NO 3 ) 3 and (UO 2 )(NO 3 ) 2 were used as sources of α-radiation.<br />
Cell suspension of 16-h P.phosphoreum 1883 IBSO culture from the Collection of<br />
Luminous Bacteria CCIBSO was applied as a bioassay system <strong>to</strong> study <strong>to</strong>xicity of the<br />
radioactive solutions. Additionally, the intact bacterial cells were used for electronic<br />
microscopy studies.<br />
The Gumat-80 preparation (“Gumat”, Irkutsk) was used as a source of humic<br />
substances (HS). It was produced by non-extracting treatment of coal. Concentrations of<br />
HS that inhibit bioluminescence by less than 20% were 5·10 -4 ÷0.3 g/L.<br />
The measurements were carried out with a BLM-8802 bioluminometer (Nauka<br />
Special Design Bureau, Krasnoyarsk, Russia).<br />
3. RESULTS AND DISCUSSION<br />
The bioluminescent assay in vivo were used <strong>to</strong> moni<strong>to</strong>r de<strong>to</strong>xification of solutions of<br />
quinones, phenols, and radionuclides of low activity by humic HS.<br />
Correlation between redox-potentials of 1,4-quinones and de<strong>to</strong>xification efficiency of<br />
HS in their solutions was found. Conclusion was made on reduction activity of HS in these<br />
solutions. Electron microscopy images revealed the bioluminescent bacteria <strong>to</strong> intensify<br />
synthesis of extracellular slime layers under de<strong>to</strong>xifying action of HS as a response <strong>to</strong><br />
unfavorable influence of the quinones (5).<br />
De<strong>to</strong>xification of the radioactive solutions of 241 Am(NO 3 ) 3 and (UO 2 )(NO 3 ) 2 by HS was<br />
under study. It was shown that HS change bioluminescence kinetics in 241 Аm solutions<br />
262
approaching it <strong>to</strong> control, thus, decreasing radio<strong>to</strong>xicity of the solutions. (Figure 1).<br />
Probably, humic acids form complexes with americium, and hence, protect bacterial cells<br />
from alpha-irradiation.<br />
I/Io<br />
1<br />
control<br />
0.5<br />
2<br />
1<br />
0<br />
3.25 3.5 3.75 4 4.25<br />
Log(t, min)<br />
Figure 1. Bioluminescent intensity vs time of exposure (t, min) in solutions 241 Am(N0 3 ) 3 (10 -<br />
10<br />
М, 3000 Bq/l) in the absence (1) and in the presence (2) of HS (С=0,25 mg/ml). Control<br />
– bioluminescent intensity in the absence of 241 Am(N0 3 ) 3 .<br />
Electron-microscopy study confirmed that HS decrease damage of the bacterial cells<br />
in Am-241 solutions, and do not affect the cells in Uranium solutions.<br />
4. CONCLUSIONS<br />
The study demonstrated a high potential of bioluminescent assay systems <strong>to</strong> moni<strong>to</strong>r<br />
de<strong>to</strong>xification efficiency of HS in solutions of organic oxidizers and radioactive compounds.<br />
De<strong>to</strong>xification of quinones and radioactive salts was found in the solutions.<br />
Conclusion was made on reduction activity of HS in solutions of 1,4-quinones.<br />
Electron microscopy study showed that bioluminescent bacteria could intensify synthesis<br />
of extracellular slime layers under de<strong>to</strong>xifying action of HS as a response <strong>to</strong> unfavorable<br />
influence of the quinones<br />
Humic substances (С = 0.25 mg/ml) de<strong>to</strong>xified solutions of Americium and did not<br />
de<strong>to</strong>xify solutions of Uranium.<br />
ACKNOWLEDGEMENTS<br />
The work was supported by: the joint grant of Krasnoyarsk Regional Scientific<br />
Foundation and Russian Foundation for Basic Research N05-03-97701-R_Yenisei; Award<br />
No. RUX0-002-KR-06 of the U.S. Civilian Research & Development Foundation (CRDF)<br />
263
and RF Ministry of Education and Science, BRHE Program; Grant of “<strong>Molecular</strong> and<br />
Cellular Biology”, program of Russian Academy of Sciences, Grant of Siberian Federal<br />
University for young scientists.<br />
REFERENCES<br />
1. Gitelson, I., Kratasyuk, V.A. et al,. Ecological Biophysics.1. Pho<strong>to</strong>biophysics of ecosystems,<br />
Logos, Moscow, 2002.<br />
2. Roda, A., Pasini, P., Mirasoni, M., Michchelini, E., Guardigli, M. 2004. TRENDS in<br />
Biotechnology. 22 , 295-303.<br />
3. Tchaikovskaya, O., Sokolova, I., Svetlichniy, V., Karetnikova, E., Fedorova, E.,<br />
Kudryasheva N., 2007. Luminescence 22, 29-34.<br />
4. Rozhko, T., Kudryasheva, N., Kuznetsov, A., Vydryakova, G., Bondareva, L., Bolsunovsky, A.<br />
2007. Pho<strong>to</strong>chem. Pho<strong>to</strong>biol. Sci. 6, 67-70.<br />
5. Fedorova E.S., Kudryasheva N.S., Kuznetsov A.M., Mogil’naya O.A., S<strong>to</strong>m D.I. J. 2007,<br />
Pho<strong>to</strong>chem. Pho<strong>to</strong>biol. B. 88, 131-136.<br />
264
<strong>Humus</strong> Substances in Natural and Technogenic Polluted Waters in<br />
Priamurje<br />
Svetlana Levshina<br />
Institute of Water and Ecology Problems Far Eastern Branch, Russian Academy of Sciences, Kim<br />
Yu Chen 65, 680000, Khabarovsk, Russia, levshina@ivep.as.khb.<strong>ru</strong><br />
Keywords: humic, fulvic, pollution, Amur, Songhua<br />
1. INTRODUCTION<br />
Humic substances (HS) are complex poly-functional organic substances that form a<br />
link in the evolution of living and nonliving matter (1). Soil is the most important source of<br />
HS in natural waters depending on their water migration capacity. Humic and fulvic acids<br />
are present in all the areas, where biotransformation of organic matter takes place (in soil,<br />
water, bot<strong>to</strong>m sediments) and participate in processes of migration and concentration of<br />
elements in natural waters. (2, 3)<br />
Data on genesis and distribution regulations of humic and fulvic acids in water are<br />
important for assessing many hydrochemical, landscape and geochemical aspects, as well<br />
as water treatment purposes. This is a very important task for drinking water treatment<br />
facilities in Khabarovsk and other Amur River cities, as the river highly colored water is rich<br />
in organic matter (ОM) in general and humic (HA) and fulvic (FA) acids in particular (42).<br />
They sediment during water treatment. Meanwhile colorless organic substances (noncoagulated<br />
low-molecular fractions) most often form chlorine organic compounds which<br />
worsen organoleptic qualities of water, but have a cancerous active character (4).<br />
The paper presents the results of research of HAs and FAs and their distribution<br />
regularities in the Amur and Songhua Rivers after the accident in the Jilin city (China),<br />
where over 100 <strong>to</strong>ns of benzene, <strong>to</strong>luol and other pollutants were discharged in<strong>to</strong> the river.<br />
2. MATERIALS AND METHODS<br />
Sampling was carried out from the surface and bot<strong>to</strong>m layers at hydrological cross<br />
sections in the following period: 2006 – in the Songhua River upper Harbin, Tsyamusi and<br />
Tuntsyan, in 2006-2007 in the Amur River near Amurzet (a control station upper the<br />
Songhua juncture), Leninskoe (lower the Songhua juncture), Khabarovsk, Komsomolsk,<br />
Bogorodskoe and Nickolaevsk.<br />
<strong>Humus</strong> acids (HFA), i.e. humic (HA) and fulvic (FA) acids were determined with<br />
concentration and extraction of humic substances with DEAE–method. For organic matter<br />
265
analysis standard methods were used and <strong>to</strong>tal (TOC) and dissolved organic carbons<br />
(DOC), color index (CI) and suspended matter (SM) were calculated.<br />
3. RESULTS AND DISCUSSION<br />
In March 2006, it was revealed that water in the Amur upper the Songhua (Amurzet)<br />
was highly colored (up <strong>to</strong> 130 degrees) with high a concentration of humic acids<br />
(4 mg C L -1 or 55% of DOC). Mountain taiga soil formation specifics had a high impact on<br />
the composition and content of humus acids in the river <strong>ru</strong>n off. One of the specifics in the<br />
Lower and Middle Amur Basin is the formation of acid humus rich in migration-capable HA<br />
and FA fractions (5, 6). It is also important that in brown taiga soils most of them,<br />
especially FA, are not attached <strong>to</strong> the mineral base and freely migrate in the soil profile<br />
and out of it, as the soil layer is not thick and highly rocky. Maximal content of HFA was<br />
registered in the Bureya River water (~ 6.5 mg С L -1 ) and its upper tributaries Urgal,<br />
Chegdomyn and Dublican (7, 8). In Zeya, the other tributary, HFA content equaled ~ 5.0<br />
mg С L -1 a little lower due <strong>to</strong> cryogenic processes in the drainage area. Soils specifics in<br />
these areas include Al-Fe-humus migration of mobile humus formation products including<br />
water-soluble products. FA content in Zeya and Bureya was a degree lower than the FA<br />
content.<br />
Songhua water compared <strong>to</strong> Amur water was observed <strong>to</strong> be less colored (70<br />
degrees), but revealed high concentrations of OM and SM (up <strong>to</strong> 200 mg L -1 ). Organic<br />
matter values here constantly exceeded the permissible level. HFA concentration was not<br />
high (~ 1.5 mg С L -1 or ~ 20% DOC) and reduced <strong>to</strong>wards the river mouth. Such low<br />
concentrations seem <strong>to</strong> be associated with soil specifics in the North-East China plains<br />
and humus transformations.<br />
Lower the Songhua near Leninskoe OM concentration was much higher (Figure 1).<br />
At the left (Russian) bank OM values were close <strong>to</strong> background normal with a high humus<br />
content, but at the right (Chinese) bank the share of HA and FA did not exceed 25% DOC<br />
and the values were 2 times lower than at the control station at Amurzet. Total increase of<br />
OM values in water along the right bank of the river and <strong>to</strong>wards its middle resulted from<br />
Songhua discharge of technogenic organic compounds. Songhua water comes up <strong>to</strong><br />
Khabarovsk following the right bank whereas water with a high content of natural HA and<br />
FA form Zeya and Bureya tends <strong>to</strong> the left bank. It is evident from hydrochemical data and<br />
satellite images.<br />
266
mg C L -1<br />
16<br />
12<br />
surface<br />
bot<strong>to</strong>m<br />
DOC<br />
FA<br />
НA<br />
8<br />
4<br />
0<br />
left centre right left centre right<br />
Figure 1. Сoncentrations of dissolved organic carbon, humic and fulvic acids in the waters<br />
of the Amur near Leninskoe (lower the Songhua juncture) in March 2006.<br />
In June 2007 OM dynamics and content as well as OM values in the Amur water<br />
(lower the Songhua) were the same as in 2006 but in August 2007 they sharply increased.<br />
Both TOC (16 mg L -1 ) and suspended matter (250 mg L -1 ) increased. HFA concentration<br />
was not high (1.6 mg L -1 , i.e. 20% DOC). FA values exceeded HA values 7 times at the<br />
middle of the river and at its right bank, whereas at the left river bank (lower the Songhua)<br />
there was 8 times difference. Upper the Songhua the difference in FA and HA values was<br />
12 times.<br />
4. CONCLUSIONS<br />
Thus, irrespective of the measures undertaken by China <strong>to</strong> improve the<br />
environmental situation in the Songhua Basin, significantly high concentrations of OM in<br />
the water, mostly of technogenic origin and low content of humus acids indicate that those<br />
measures are not effective enough. Soils, which provide humic substances, constantly<br />
degrade under intensive pressure in cities and agricultural areas. The Amur Basin<br />
267
environment can be improved only with measures preventing soil OM degradation, with<br />
conts<strong>ru</strong>ction of sewage complete-treatment facilities and industrial buffer zones in the<br />
Songhua Basin.<br />
ACKNOWLEDGEMENTS<br />
The author gratefully acknowledges IWEP FEB RAS staff for their assistance in field<br />
research and the staff of Environmental Moni<strong>to</strong>ring Center in Khabarovsk for sharing the<br />
water samples.<br />
REFERENCES<br />
1. Orlov D.S. Humic substances in the biosphere. 1997. Soros Educational Journal. 2, pp. 56-63.<br />
(in Russian)<br />
2. Schnitzer M. 1978. Humic substance: chemistry and reactions. In: Schnitzer M., Khan S.U.<br />
(Eds.), Soil Organic Matter, Elsevier, Amsterdam, pp. 1–64.<br />
3. Perminova I.V. 2000. Abstract of Dr. Sc. Thesis. Analysis, classification and predictive<br />
modeling of properties of humic substances. Moscow: MSU Publ. 50 р. (in Russian)<br />
4. Levshina, S.I., Zhukov, A.G. 2004. Organic Matter Content in the Amur Water // Regions of<br />
New Development Strategy. Int. Conf. 15-17 Sept. 2004. Khabarovsk. IWEP FEB RAS.<br />
p. 130-132. (in Russian)<br />
5. Ivanov, G.I. 1976. Soil Formation in the Far East South. Nauka, Moscow, 200 p. (in Russian)<br />
6. Matushkina, L.A. Levshina, S.I. 2005. On impact of Geochemical Mobility of Soil Organic<br />
Matter on Composition of River Waters in Watershed of Middle and Lower Amur // Biochemical<br />
and Geoecological Processes in Ecosystems. Vladivos<strong>to</strong>k. Dalnauka. 15, pp. 209-218. (in<br />
Russian)<br />
7. Levshina, S.I. 2005. In: Biogeochemical and Geoecological Processes in Ecosystems: Organic<br />
Substance in Surface Waters of the Amur Basin. Dalnauka, Vladivos<strong>to</strong>k. 15, pp. 218–225. (in<br />
Russian)<br />
8. Levshina, S.I. 2006. Humic and Fulvic Acids in River Waters in Middle and Lower Priamurje.<br />
Geography and Natural Resources. 2, pp. 101–105. (in Russian)<br />
268
Analysis of Pore Water Dissolved Organic Matter by UV-spectroscopy<br />
and Spectral Fluorescence Signatures Technology<br />
Natalja Makarõtševa 1 , Viia Lepane 1 , Tiiu Alliksaar 2 , Ilmar Tõnno 3<br />
1 Institute of Chemistry, Tallinn University of Technology, Akadeemia tee 15, 12618 Tallinn,<br />
Es<strong>to</strong>nia, natalja_mak@yahoo.com<br />
2 Institute of Geology, Tallinn University of Technology, Ehitajate tee 5, 19086 Tallinn, Es<strong>to</strong>nia<br />
3 Centre for Limnology, Institute of Agricultural and Environmental Sciences, Es<strong>to</strong>nian University of<br />
Life Sciences, Rannu, Tartu County 61101, Es<strong>to</strong>nia<br />
Keywords: dissolved organic matter, sediments, pore water, UV-spectroscopy, spectral fluorescent<br />
signature<br />
1. INTRODUCTION<br />
UV and fluorescence spectroscopy can be used <strong>to</strong> analyse unaltered samples, which<br />
is important in DOM studies. Only carbon that is in aromatic st<strong>ru</strong>ctures has been shown <strong>to</strong><br />
have an effect on the UV absorbance spect<strong>ru</strong>m of DOM. Compared <strong>to</strong> absorption spectra,<br />
the fluorescence spectra contain more detailed information and they can be used for DOM<br />
composition and source investigations.<br />
The technique of Spectral Fluorescent Signatures (SFS) is based on a direct<br />
measurement of a 3-dimensional fluorescent pattern of the sample. Three dimensions are<br />
excitation wavelength, emission wavelength and the fluorescence intensity. By comparing<br />
SFS image <strong>to</strong> the fingerprints of known compounds, qualitative and quantitative analysis is<br />
possible. SFS method can distinguish between carbon fractions and differentiate<br />
environmental organic pollutants. Technique is considered rapid, requiring small amount of<br />
samples and enabling low concentrations <strong>to</strong> be measured.<br />
2. MATERIALS AND METHODS<br />
The Lake Võrtsjärv sediment samples were taken in 2003. The frozen sediment core<br />
(120-cm long, dated from year 500 <strong>to</strong> present) was sliced in<strong>to</strong> 1-cm thick sub-samples and<br />
packed in<strong>to</strong> plastic bags. Pore water was extracted from thawed sediments by<br />
centrifugation at 3500 rpm for 30 minutes, filtered through 0.45 μm filter (Millex® GP,<br />
Millipore) and s<strong>to</strong>red at 4 o C in the dark.<br />
269
Table 1. Characteristics of Lake Võrtsjärv, South-Es<strong>to</strong>nia<br />
Location 58 o 17´N 26 o 02´E<br />
Area, km 2 270<br />
Average depth, m 2.7<br />
Maximum depth 6<br />
Catchment area, km 2 3100<br />
Trophic status<br />
eutrophic<br />
Absorbance spectra of the samples were recorded with the Jasco V-530 UV/VIS<br />
Spectropho<strong>to</strong>meter (Japan), with 1-cm-pathlength fused silica cells and MilliQ water as the<br />
blank. Spectra were measured over the range of 200-500 nm with 2.0 nm bandwidth.<br />
Absorption coefficients were calculated using formula a CDOM (λ) = 2.303 A(λ)/L, where<br />
A(λ) was the absorbance at selected wavelength and L the pathlength of the cell in<br />
meters.<br />
Fluorescence spectra were measured with spectrofluorimeter Fluo-Imager M53<br />
(Skalar, Netherlands) in excitation range of 240-360 nm and corresponding emission<br />
range of 250-570 nm. Fluorescence effectivity (F eff ) was calculated as ratio between<br />
fluorescence emission maximum intensity and absorbance at 254 nm and is considered<br />
proportional <strong>to</strong> fluorophores quantum efficiency (1).<br />
3. RESULTS AND DISCUSSION<br />
The fluorescent DOM components have been identified in Fig.1. Protein-like<br />
compounds have been separated in<strong>to</strong> tyrosine- and tryp<strong>to</strong>phan-like, having excitation –<br />
emission maxima in wavelength regions 280-290/305-320 nm and 285-290/340-350 nm,<br />
respectively. Tyrosine-like fluorescence was detected in all studied sediment pore water<br />
samples while tryp<strong>to</strong>phan-like was detected in older samples and only in some samples<br />
from 20 th century. Both originate from proteins and thus may indicate au<strong>to</strong>chthonous<br />
material leached in<strong>to</strong> pore water after protein denaturation or by biological production<br />
(bacterial activity). Humic-like fluorophores had characteristic excitation at 315-350 nm and<br />
emission at 400-440 nm. Additionally, in recent sediments from depths 5-13, 26-28 and<br />
32-36 cm (dated <strong>to</strong> 1997-2000, 1983, 1963-72) a group of fluorescing compounds was<br />
detected with excitation – emission maxima in range 325-335/365-380 nm and was<br />
identified as PAHs, possibly pyrene and phenanthrene with characteristic emission at 350-<br />
380 nm at excitation of 340 nm (2).<br />
270
450<br />
HUMIC-LIKE<br />
Emission, nm<br />
400<br />
350<br />
300<br />
tryp<strong>to</strong>phan-like<br />
PROTEIN- tyrosine-like<br />
LIKE<br />
250<br />
250 300 350 400<br />
Excitation, nm<br />
PAH<br />
(pyrene,<br />
phenanthrene)<br />
Figure 1. Positions of the fluorescence maxima of Lake Võrtsjärv pore water<br />
detected by SFS method.<br />
10000<br />
40000<br />
7500<br />
30000<br />
F(H)<br />
5000<br />
Feff<br />
20000<br />
2500<br />
20th<br />
century<br />
10000<br />
0<br />
5000 10000 15000 20000<br />
0<br />
F(tyr)<br />
0 20 40 60 80<br />
DOC, mg/L<br />
Figure 2. Relations between humic F(H) and tyrosine F(tyr) fluorescence intensity and<br />
fluorescence effectivity F eff and dissolved organic matter (DOC).<br />
Differentiation of pore water by fluorescence characteristics was possible as shown<br />
in Fig.2. Samples from 20th century had lower humic-like fluorescence intensity than older<br />
samples (up <strong>to</strong> year 500). Fluorophores quantum efficiency was without temporal<br />
differences decreasing exponentially with increasing DOC concentration in pore waters.<br />
Studied UV- and fluorescence characteristics varied mostly in 20th century samples<br />
as shown in Fig.3. DOC and absorbance were slightly decreasing in older pore waters.<br />
Fluorescence ratio as indica<strong>to</strong>r of biological activity was unusually low (below 1).<br />
271
DOC, mg/L<br />
a CDOM (254)<br />
A250/A360<br />
F(H)<br />
F(H)/F(P)<br />
0 50 100<br />
0 500<br />
2 7 12<br />
0 5000 10000 0 0,5 1<br />
2000<br />
1980<br />
1960<br />
1940<br />
1920<br />
1900<br />
1900<br />
1700<br />
1500<br />
1300<br />
1100<br />
900<br />
700<br />
500<br />
0 50 100<br />
0 500<br />
2 7 12<br />
0 5000 10000 0 0,5 1<br />
Figure 3. Temporal changes in DOC, absorption coefficient a, absorbance<br />
ratio A250/A360, humic-like fluorescence intensity F(H) and humicand<br />
protein-like fluorescence intensity ratio F(H)/F(P);<br />
upper panel 20 th century, lower panel years 500 <strong>to</strong> 1900.<br />
ACKNOWLEDGEMENTS<br />
Support by the Es<strong>to</strong>nian Science Foundation Grant (project no 6720) was gratefully<br />
acknowledged.<br />
REFERENCES<br />
1. Corvasce, M., Zsolnay, A., D´Orazio, V., Lopez, R., Miano, T.M. 2006. Chemosphere 62,<br />
1583-1590.<br />
2. Babichenko, S. 2001. Spectral Fluorescent Signatures in Diagnostics of Water Environment,<br />
Institute of Ecology. Publications 7, Tallinn Pedagogical University,193 pp.<br />
272
Risk Assessment of Soil Degradation and Possible Soil Recultivation in<br />
Mining in Priokhotje Region<br />
Alexandra F. Makhinova, Alexei N. Makhinov<br />
Institute of Water and Ecology Problems FEB RAS, Kim Yu Chen st., 65, Khabarovsk, Russia,<br />
mahinova@ivep.as.khb.<strong>ru</strong><br />
Keywords: soil cover, degradation, recultivation, mining<br />
1. INTRODUCTION<br />
An increasing attention is given in Priokhotje region <strong>to</strong> studies of big mining<br />
developments with a high technogenic impact on soil cover, as they cause both direct and<br />
indirect damage of environment. Degradation and decomposition of soil cover as a uniform<br />
system due <strong>to</strong> soil mechanical removal and marked chemical contamination create a<br />
situation, when most of fertile forest soils cannot be rehabilitated <strong>to</strong> generate forest<br />
vegetation. Thus developing technologies of soil recultivation and conservation <strong>to</strong> mitigate<br />
a negative impact of mining operations on soils seems most urgent.<br />
Ecological damage (ED) of soils is determined as a reverse value of soil cover<br />
st<strong>ru</strong>cture sustainability (SCSS): ED = 1/SCSS. The more sustainable is the system the<br />
less is the damage of soils. That is why it is important <strong>to</strong> make quantitative and probability<br />
assessment of soil cover sustainability within the river valleys and on the mountain slopes<br />
where the mechanical disturbance of soil cover is coupled with intensive melting of<br />
permafrost and sliding of mellow mass down the slopes. The situation is even more<br />
complicated on the steep slopes, where soil cover degradation rate is higher and causes<br />
rapid plant extinction, changes of mechanical composition of soils, intensive physical<br />
weathering and other negative phenomena, which disturb natural development of<br />
environment complexes as a whole (1).<br />
The main tasks for the analysis of natural and technogenic degradation of soils and<br />
the selection of recultivation technologies are the following: 1) assessing soil degradation<br />
risks and possible recultivation conditions; 2) examining ecological state of degraded soil<br />
cover st<strong>ru</strong>ctures and estimating time for reaching a set-up value of the determining<br />
parameter of soil cover degradation; 3) defining irreversibility points of soil functioning<br />
mechanisms and rehabilitation limits.<br />
273
2. MATERIALS AND METHODS<br />
The research was conducted in the basins of the rivers Ariavkan, Tukchi, Muktana<br />
and Taryng-Lata (Ayano-Maisky District of Khabarovsky Krai).<br />
1. The main characteristics of the terri<strong>to</strong>ry and mining specifics (intensity and area of<br />
uncovering, down gradient, temperature parameters, shape and steepness of slopes,<br />
thickness of mellow cover, rate and thickness of soil profile melting on the open surface,<br />
speed of mellow cover sliding down the mountain slope, etc.) have been investigated.<br />
2. Soil horizon thickness and deformations have been measured every 20 meters<br />
within a radius of 200 meters down the slope from the uncovering. For control and<br />
experiment purity purposes soil samples were also taken in areas free from the impact of<br />
mining. Previously collected results of chemical composition and specifics of soils were<br />
also analyzed.<br />
R.P.C. Morgan (2) methods were used in field works. Soil degradation in a moment<br />
of time (t) was characterized as intensity of processes, contributing <strong>to</strong> soil cover<br />
degradation under anthropogenic impact (through changeability index – C t ) at probable<br />
condition of a soil ecosystem dS (t)<br />
.<br />
3. RESULTS AND DISCUSSION<br />
If we consider the formation of technogenic soils as a scenario of a sequence of<br />
possible events that take place at mining, than the prospected outcomes at a particular<br />
moment (t) may be characterized as the extreme values of the permissible interval.<br />
Mathematical prediction of the possible condition of soil ecosystems at any time moment<br />
(t) can be described with the equation<br />
dS ( t)<br />
= k ⋅1/<br />
dZ ( S<br />
r<br />
) ⋅C0 ( t)<br />
⋅ dt , where Z = 1/<br />
H<br />
k – an observed correction fac<strong>to</strong>r for physical and chemical properties of soil<br />
(sorption, resistance);<br />
r, t – space and time coordinates; Z – estimated resistance<br />
reserve (soils), which determine the probability of soil system functioning within the limits<br />
of its sustainability;<br />
C ( t)<br />
⋅ dt<br />
0 – a changing technogenic load on the area unit.<br />
Possible scenarios for the development of the particular soil ecosystem and its<br />
transition from state S i in<strong>to</strong> state S j at the moment of time (t ) is determined with<br />
λ ( t)<br />
= lim<br />
ij<br />
Δt→0+<br />
0<br />
Pij<br />
( t,<br />
Δt)<br />
Δt<br />
, where<br />
274
P<br />
ij – density of possible events during t ,<br />
system <strong>to</strong> transmit from one state <strong>to</strong> the other.<br />
Δ t interval, Dt – the time needed for the<br />
The interaction of natural and technogenic soil systems within ecological and<br />
geographic regularities is determined with tension ( H ).<br />
H = G / J ⋅ E ⋅Y<br />
i<br />
i=1<br />
pi<br />
H – an integral parameter of the main soil cover specifics that reflect the tension of<br />
the soil cover state. In physical sense the soil ecosystem tension is the density of system<br />
resistance <strong>to</strong> external fac<strong>to</strong>rs;<br />
and anthropogenic soil ecosystems;<br />
G / Ji<br />
– correlation of similarities and differences in natural<br />
Y<br />
pi – soil and ecological index of a relative natural<br />
soil stability (or an elementary soil areal). Coefficient (G ) reflects the rate of disturbance<br />
of elementary soil areals. Localization index ( J ) determines the concentration of the<br />
disturbed soils within the limits of the sustainable st<strong>ru</strong>cture of soil cover.<br />
Our studies showed that a) uncovering operations in existing conditions without<br />
recultivation create unfavorable prerequisites, sharpen other risk fac<strong>to</strong>rs and intensify<br />
natural and technogenic degradation processes of soil cover transformations; b)<br />
mechanical disturbance of 1/5 of soil area on the slopes of 25 о steepness during<br />
uncovering dis<strong>ru</strong>pts soil functioning mechanisms (Table 1) (3).<br />
Table 1. Risk Assessment of Soil Degradation and Possible Soil Recultivation<br />
Soils,<br />
recultivation<br />
and<br />
predictions for<br />
soil cover<br />
rehabilitation<br />
Soil degradation assessment and Recultivation results<br />
Mechanical disturbance<br />
(% /100 ha)<br />
Removal<br />
of SC<br />
Degradation of<br />
horizons<br />
Pollution with<br />
trace metals<br />
(g/m 3 )<br />
Cu<br />
i<br />
Zn<br />
Trace metal<br />
impact on<br />
biomass<br />
growth<br />
Forming<br />
technogenic<br />
st<strong>ru</strong>cture<br />
of soil<br />
cover<br />
Class of<br />
ecological<br />
damage<br />
Brown soils >30 25<br />
humus soils<br />
compression<br />
>5 5-6<br />
2. degraded<br />
weak<br />
П-Ш<br />
regeneration<br />
Types of<br />
recultivation<br />
Predictions for<br />
soil cover<br />
rehabilitation<br />
Surface<br />
smoothing Phy<strong>to</strong>melioration<br />
Impossible<br />
Degradation<br />
decrease<br />
Chemical<br />
melioration,<br />
liming<br />
Larch<br />
planting<br />
Decreasing negative after<br />
effects by more than 50%<br />
- I<br />
Tolerant<br />
I<br />
275
A soil system passes the irreversibility point and transfers <strong>to</strong> a new-quality level of<br />
adapted functioning. As the results degraded natural and technogenic or industrial<br />
landscapes are formed and many of them cannot be rehabilitated as fertile forest soils<br />
suitable for vegetation (4). Industrial landscapes need surface smoothing. Slag heaps and<br />
tailing pits are rich in copper and zinc and also contaminated with trace metals (5).<br />
Water and air easily penetrate through the loose st<strong>ru</strong>cture of uncovered ground<br />
masses and intensify mineral oxidation, formation of acid solution and their geochemical<br />
mobility (5). Chemical contamination of soil exceeding 5 g/m 3 decreases coniferous<br />
biomass growth, needles yellowing and larch expansion (Table 1). Liming is most effective<br />
recultivation method in case of <strong>to</strong>xic contamination of soils.<br />
4. CONCLUSIONS<br />
Soil cover degradation in Priokhotje causes irreversible physical and chemical<br />
changes in soils. Mining impact on the soil cover, when exceeding the permissible level,<br />
disturbs soil formation processes. Accumulating transformations misbalance soil st<strong>ru</strong>cture<br />
sustainability and may lead <strong>to</strong> the complete degradation and losses of fertile forest soils.<br />
Existing norms for permissible soil losses at mining are derived from average observation<br />
data at some mining developments. The real situation is more complicated. The method <strong>to</strong><br />
calculate the permissible soil degradation rate (annual per area unit) or quantitative<br />
assessment of soil self-regulation processes have not been worked out yet.<br />
The results revealed that a disturbed soil localization index is of the chief importance<br />
for soil degradation assessment. Soil degradation rate in the investigated terri<strong>to</strong>ry<br />
appeared <strong>to</strong> be different. Chemically contaminated soils degrade slower due <strong>to</strong> selfregulation<br />
processes, whereas mechanically disturbed soils have higher rate risks and<br />
need ecological and engineering measures (different types of recultivation and melioration,<br />
decreasing areas of uncovering, etc.).<br />
REFERENCES<br />
1. T<strong>ru</strong>betskoy, K. 1995. Mining Journal. pp. 3-8.<br />
2. Morgan R.P.C., Hann M.J. Shah Deniz Gas Export: Erosion risk assessment. Interim Repot <strong>to</strong><br />
PB Kvaerner. Granfield University. UK, Silsoe, 2001, 25 p<br />
3. Makhinov, A., Makhinova A., Shevtsov A. 2006. Mining Journal. pp. 83-86.<br />
4. Makhinov, A., Makhinova A., Shevtsov A. 2005. Mining Bulletin. Regional Suppl. Far East, pp.<br />
514-522.<br />
5. Shevtsov, M., Mkhinov А., Karavanov К., Lopatuk V., Dudnik V. 1997. In: Seminar Proceeding<br />
“Gold Mining. Problems and Perspectives”. Khabarovsk, pp. 251-257.<br />
276
Variation in Lipid Relative Abundance and Composition among Different<br />
Peat Bog Profiles<br />
Małgorzata Malawska, Monika Mętrak, Boguslaw Wiłkomirski<br />
Institute of Botany, Warsaw University, Al. Ujazdowskie 4, 00-478 Warsaw, Poland,<br />
malma@biol.uw.edu.pl<br />
Keywords: c<strong>ru</strong>de lipid fraction (CLF), peat humic substances<br />
1. INTRODUCTION<br />
Humic substances are comprised of three operationally defined fractions, water<br />
soluble fulvic acids, acid precipitated humic acids and water insoluble humin. Soil humic<br />
acids are mainly derived from the biochemical degradation of plant residues and from<br />
microbial synthetic activity and constitute a significant fraction of the soil organic matter<br />
(2). Lipids in humic acids originate from aliphatic components of macromolecules and are<br />
important for conformational flexibility (3). Free and bound lipids, carbohydrates and amino<br />
acids form the major fractions of analytically recognizable compounds in many organic<br />
matters of various origin. The st<strong>ru</strong>ctural diversity of the lipid moieties encountered can offer<br />
valuable information an organic matter sources and diagenetic processes. Deposits of<br />
peat in mires (especially of ombrotrophic peat bogs) provide special archives of climate<br />
changes (1). A record of plant remains living in the bog can be inferred from the<br />
geochemical paleoclimate proxies available in the organic matter constituents of peat<br />
layers.<br />
In the present study, peat humic substances (humic and fulvic acids) of different<br />
origin were examined with respect <strong>to</strong> their bound lipid compositions.<br />
2. MATERIALS AND METHODS<br />
Peat samples were collected in six peat-bog complexes: which are situated in the<br />
north-east, south and south-west of Poland, in areas created by the Baltic glaciations. The<br />
selected wetlands varied in terms of plant communities, as well as the type of peat deposit<br />
(fen, transitional and ombrothrophic bogs). Before lipid analysis the species of peat was<br />
determined.<br />
Air-dried peat samples were extracted with the mixture chloroform – methanol (2:1)<br />
yielding after evaporation the c<strong>ru</strong>de lipid fraction (CLF). The CLF from each sample was<br />
saponified yielding the unsaponifiable fraction (USF). Also plant sterols as the important<br />
secondary metabolites were determined. CLF and USF were determined by weight<br />
277
method, whereas sterols were purified by TLC as usual and GLC determination was<br />
carried out in typical condition.<br />
3. RESULTS AND DISCUSSION<br />
The CLF content in different peat species was between 32.17 and 163.34 mg/g<br />
whereas the USF content was lower varying from 2,12 <strong>to</strong> 59.66 mg/g. Some peat species<br />
are reach in CLF (more than 100 mg/g). There is no simple correlation between CLF and<br />
USF content. The content of main plant sterols (campesterol, stigmasterol and si<strong>to</strong>sterol)<br />
was much lower, varying within broad limits from 0.55 <strong>to</strong> 59.66 μg/g. The is a good<br />
correlation between USF content and sterol content.<br />
4. CONCLUSIONS<br />
The lipid content, both CLF and USF, can be used as a good marker of peat species<br />
differentiation, although some variations in CLF and USF content occurring in the same<br />
peat species located in different depth were established. Variations in the composition of<br />
lipids indicated that the participation of lipids in the formation of humic acids is markedly<br />
different. Diterpenoid and unsaturated fatty acids appear <strong>to</strong> be more readily incorporated<br />
in<strong>to</strong> humic acid st<strong>ru</strong>cture than triterpenoids, saturated fatty acids or sterols. Si<strong>to</strong>sterol is<br />
the dominant sterol in all investigated peat samples. It is concluded that peat lipids are<br />
potential st<strong>ru</strong>ctural units of peat humic acids.<br />
ACKNOWLEDGEMENTS<br />
The work was performed within proposal No N 305 023 31/0930 financed by State<br />
Committee for Scientific Research.<br />
REFERENCES<br />
1. Barber K.,E. 1994. A sensitive high resolution record of late Holocene climatic change from a<br />
raised bog in northern England. Holocene 4, pp.198-205.<br />
2. Schulten H., R., Schnitzer M., 1997. Chemical model st<strong>ru</strong>ctures for soil organic matter and<br />
soils. Soil Sci. 162, pp.115-130<br />
3. Steinberg C., Muenster U. 1985. Geochemistry and ecological role of humic substances in<br />
lake water. In: Humic Substances in Soil, Sediment and Water. Aiken (ed.). Wiley, New York,<br />
pp.105-145.<br />
278
Characterization of Humic Substances Isolated from Various Peat Bog<br />
Profiles<br />
Monika Mętrak, Nadija Brechowskych-Jaworska, Małgorzata Malawska<br />
Institute of Botany, Warsaw University, Al. Ujazdowskie 4, 00-478 Warsaw, Poland,<br />
mmetrak@biol.uw.edu.pl<br />
Keywords: humic substances, peat profiles, Poland<br />
1. INTRODUCTION<br />
Humic substances are present in all natural waters, soils, sediments and peats. In<br />
wetlands, due <strong>to</strong> lack of oxygen, the decomposition process is very slow and hence<br />
contributes <strong>to</strong> the accumulation of huge amounts of organic matter. The elemental<br />
composition and chemical features of peat humic substances are believed <strong>to</strong> be similar <strong>to</strong><br />
those of humic acids in mineral soils. Though it has been reported that humic matter in<br />
peat is composed mostly of fulvic acids, most information indicates that peats contain large<br />
amounts of humic acids (3). At the present stage of knowledge, it is not known if the<br />
properties of the humic substances are different in different genus of peat. The properties<br />
and the st<strong>ru</strong>cture of the humic substances depend on their origin (5).<br />
In the present study, we characterized humic and fulvic acids fractions isolated from<br />
various peat cores from 6 peatlands with the aims of (i) comparing the chemical properties<br />
of peat humic substances formed in different geological origin, hydrology and botanical<br />
composition (ii) furthering knowledge of the humic substances in peatlands.<br />
2. MATERIALS AND METHODS<br />
The peat cores were collected from 5 areas in Poland - the Sudeten Mountains, the<br />
Orava Basin, the Silesia and the Masurien District. Investigated peatlands represent<br />
ombrotrophic and transitionall bogs and fens. The peat cores differ in their degree of<br />
decomposition, botanical composition and age. The peat samples were collected from<br />
each horizon of the stratigraphical profile of peat deposits. Horizonts were determined<br />
according <strong>to</strong> their subfossil communities and assigned <strong>to</strong> genetic types of peat according<br />
<strong>to</strong> Polish Standard PN-85/G-02500.<br />
Before analyses, the samples were air dried, and the fraction > 2 mm was removed<br />
by dry sievieng. The following features were determined: (i) peat genus; (ii) ash content<br />
and acidity (pH H 2 O; KCl); (iii) percentage of soil organic carbon (C org ,) humic acid and<br />
fulvic acid content (by Kononova method).<br />
279
3. RESULTS AND DISCUSSION<br />
For the majority of peatlands studied here a general tendency occurres – fen peats<br />
contain more humic substances than raised bog peats. Moreover, it was noticed that the<br />
increase in the rate of decomposition usually raises humic substances content. Therefore<br />
the highest percentage humic substances content was observed in one of the fen profiles,<br />
while the lowest in the bog peat profile (Mechacz). The degree of decomposi<strong>to</strong>n itself<br />
increases with the depth of the profile. These results correspond with Duan and Ma, who<br />
stated that the concentration of humic acids increases with age, depth and decomposition<br />
rate of peat (2). Furthermore, large amounts of humic and fulvic acids can be found in<br />
highly decomposed peat that formed in an oxygen-rich habitats (1).<br />
In the studied samples content of humic acids was higher than content of fulvic acids<br />
and Ch/Cf ratio was mostly above 1. Such correlation was observed before by Kononova<br />
(4). However, other authors reported that humic matter in peat is composed mostly of<br />
fulvic acids (6).<br />
4. CONCLUSIONS<br />
Humic substances content is higher in the fen peat than in the raised bog peat.<br />
Humic acids constitute a bigger part of peat humic substances than fulvic acids, for both<br />
fen and raised bog peats. Additionally, it was observed that the chemical features of peats<br />
differ distinctly, among the peats belonging <strong>to</strong> the same botanical class. Thus, indicating<br />
limited usage of purely botanical classifications.<br />
ACKNOWLEDGEMENTS<br />
The work was performed within proposal No N 305 023 31/0930 financed by the<br />
State Committee for Scientific Research.<br />
REFERENCES<br />
1. Dehmer, J. 1995. International Journal of Coal Geology 28, 111-138.<br />
2. Duan, Y., Ma, L. 2001. Organic Geochemistry 32, 1429-1442.<br />
3. Gondar, D., Lopez, R., Fiol, S., Antelo, J.M., Arce, F. 2005. Geoderma 126, 367-374.<br />
4. Kononova, M.M. 1966. Soil Organic Matter. Pergamon Press. London.<br />
5. Ritchie, J.D., Perdue, E.N. 2003. Geochim. Cosmochim. Acta 67, 85-96.<br />
6. Schnitzer, M. 1977. Soil organic matter studies. Internat. A<strong>to</strong>mic Energy Agency, IAEA,<br />
Vienna, 2, 117-132.<br />
280
Characterization of Soil and Humic Acids Extracted from Native Forest<br />
and Oil Shale Industrialization Rehabilitated Areas<br />
Betânia F. Pereira 2 , Jeniffer V. dos San<strong>to</strong>s 1 , An<strong>to</strong>nio S. Mangrich 1 , Clenio N. Pillon 2<br />
1 Universidade Federal do Paraná, C. P. 19081, 81531-990, Centro Politécnico, Jardim das<br />
Américas, Curitiba, PR, Brazil, betaniapereira@yahoo.com.br<br />
2 FAPEG/EMBRAPA Clima Temperado, BR 392, km 78, 96001-970, Pelotas, RS, Brazil<br />
Keywords: rehabilitated area, humic acid, FTIR, DRUV-VIS and EPR spectroscopies<br />
1. INTRODUCTION<br />
Reserves of oil shale occur in several Brazilian locations. An expressive emerging of<br />
the Irati Formation occurs in the region of São Mateus do Sul (PR), where the oil shale<br />
Industrialization unit from Petrobras, the Brazilian Government Oil Company, is installed<br />
(PETROBRAS/SIX). The oil shale mining happen in open skies with plowing, in parallel<br />
strips and after the mined recovering process is made. There is a systematic way<br />
recovering proceed in the plowing, using the disposal of the mining process byproducts <strong>to</strong><br />
res<strong>to</strong>re the relief followed by the recuperating with clay and soil (1). The recovery of the<br />
degraded area is considered effective when the physical, chemical and mineralogical<br />
properties of the soil present conditions adjusted for the plants development (2). The goal<br />
of this work is <strong>to</strong> characterize by the elemental composition and FTIR, DRUV-VIS and<br />
EPR spectroscopy, and <strong>to</strong> compare the native forest soil (NFS) and oil shale<br />
industrialization rehabilitated forest soil (RFS), and the humic acid (HA) sequentially<br />
extracted with Na 4 P 2 O 7 + NaOH and urea + NaOH from these soils.<br />
2. MATERIALS AND METHODS<br />
Samples from NFS and RFS were taken at 0 – 5 cm depth from PETROBRAS/SIX<br />
area, São Mateus do Sul, PR, Brazil. Humic acids (HA) were sequentially extracted with<br />
[Na 4 P 2 O 7 (1 mol L -1 ) + NaOH (0.25 mol L -1 ) (HAP)] and [Urea (6 mol L -1 ) + NaOH<br />
(0.1 mol L -1 ) (HAU)] solutions, adapted from references 3, 4 and 5. The first extract was<br />
done in 200 g of soil, adding 500 mL of NaOH solution and 500 mL of Na 4 P 2 O 7 solution.<br />
For the following extraction, it was used the humin (HU) resulting from the first extraction<br />
were added 500 mL of NaOH solution and 500 mL of urea solution (4). The samples were<br />
dried in the oven (50°C), finely grounded, and analyzed by FTIR, DRUV-VIS and EPR<br />
espectroscopy in the solid state.<br />
281
3. RESULTS AND DISCUSSION<br />
In a general way, the NFS and RFS soils presented similar FTIR spectra with bands<br />
in 3700, 3620 and 3530 cm -1 , attributed <strong>to</strong> stretching absorption of internal O-H groups (ν)<br />
from clays (Figure 1). The HA samples from both soils, extracted with the same extrac<strong>to</strong>r<br />
type (pyrophosphate or urea), also presented similar FTIR spectra. The samples NFHAP<br />
and RFHAP showed band at 1250, 1720 and 2500 cm -1 due <strong>to</strong> COOH groups. There are<br />
bands in the region of 1100 and 1030 cm -1 due <strong>to</strong> ν of Si-O and C-O (carbohydrate),<br />
respectively. These bands are less intense in NFHAP and RFHAP showing the greater<br />
capacity of this extrac<strong>to</strong>r in eliminating those kinds of groups in both soil samples. All<br />
samples, except for NFHAP and RFHAP, presented bands below <strong>to</strong> 910 cm -1 due <strong>to</strong><br />
inorganic st<strong>ru</strong>ctures (5, 6). As a result of the FTIR analysis it was concluded that there are<br />
few differences between the studied soils and the extracted HA.<br />
NFS<br />
RFS<br />
% Transmitance<br />
NFHAP<br />
RFHAP<br />
NFHAU<br />
RFHAU<br />
3620<br />
3530<br />
1720<br />
1280<br />
1250<br />
690<br />
3700<br />
3440<br />
2920<br />
2850<br />
1630<br />
1400<br />
1450<br />
1100<br />
1030<br />
798<br />
915 740<br />
540<br />
470<br />
4000 3500 3000 2500 2000 1500 1000 500<br />
Wavenumber (cm -1 )<br />
Figure 1. FTIR spectra of the NFS and RFS soils and NFHAP, RFHAP, NFHAU and<br />
RFHAU extracted samples.<br />
DRUV-VIS spectra of the NFS and RFS soils, as well as NFHAU and RFHAU<br />
presented similar features with a no<strong>to</strong>rious absorption band around 500 nm attributed <strong>to</strong><br />
the 6 A 1 + 6 A 1 → 4 T 1 ( 4 G) + 4 T 1 ( 4 G) electronic d-d transition due <strong>to</strong> Fe-Fe pair of hematite<br />
282
st<strong>ru</strong>cture (Figure 2) (7). The HA samples from both soils, extracted with pyrophosphate,<br />
presented typical spectra of organic aromatic st<strong>ru</strong>cture with the E 4 /E 6 ratio relation quite<br />
similar, NFHAP = 1.70, RFHAP = 1.76 (6). Once again also the DRUV-VIS technique<br />
showed the similarity between the two soil samples.<br />
NFS<br />
RFS<br />
NFHAP<br />
log 1/R<br />
RFHAP<br />
NFHAU<br />
RFHAU<br />
200 300 400 500 600 700 800 900<br />
Wavelength (nm)<br />
Figure 2. DRUV-VIS spectra of the NFS and RFS soils and NFHAP, RFHAP, NFHAU and<br />
RFHAU extracted samples.<br />
In the EPR spectra at room (~300 K) and liquid nitrogen temperatures (77 K) it was<br />
observed a broad absorption line in g ~ 2 .0 attributed <strong>to</strong> Fe 3+ ions in concentrated domain<br />
in all the samples. All the spectra at 77 K showed an absorption line of low intensity in g ~<br />
4.3 indicating the presence of Fe 3+ ions complexed in<strong>to</strong> the organic and inorganic matter,<br />
in diluted domains. This absorption line is more intense in the NFAHP and RFAHP than<br />
the others. The absorption line due <strong>to</strong> the organic free radical (OFR) in g ≈ 2.0 is observed<br />
just in the NFHAP and RFHAP where the g values are typical of semiquinone free radicals<br />
(NFHAP = 2.0032 and RFHAP = 2.0034) and the number of OFR are quite similar for<br />
NFHAP (4.67 x 10 17 spin g -1 ) than for RFHAP (2.03 x 10 17 spin g -1 ) and typical of soil HA<br />
(8). Again, by EPR spectroscopy the studied soil samples are comparable.<br />
283
4. CONCLUSIONS<br />
All the FTIR, DRUV-VIS and EPR analyses showed that the soil and HA from the<br />
rehabilitated area are reasonably humificated and presented slightly higher aromatic<br />
st<strong>ru</strong>ctures than the native soil and their respective HA.<br />
On the base of the analytical techniques applied in this work, both soils were quite<br />
similar showing that the soil rehabilitation process utilized by the PETROBRAS/SIX is<br />
effective in terms of the agroforest proposal when compared with the native forest.<br />
ACKNOWLEDGEMENTS<br />
The authors are thankful <strong>to</strong> CNPq and FAPEG by financial support. We also thank<br />
DQ/UFPR and Termo de Cooperação Tecnológica FAPEG/PETROBRAS/EMBRAPA.<br />
REFERENCES<br />
1. PETROBRAS/SIX. 2005. Relatório Técnico.<br />
2. Moreira, P. R. 2004. PhD thesis in Biolog. Institu<strong>to</strong> de Biociências da Universidade Estadual<br />
Paulista “Júlio de Mesquita Filho” - Rio Claro – SP - Brazil.<br />
3. Piccolo, A., Celano, G., Conte, P. 2000. INRA. 103-116.<br />
4. Hayes, M. H. B., Clapp, C. E. 2001. Soil Science. 166, 723-737.<br />
5. Pereira, B. F. 2004. PhD thesis in Chemistry. UFPR. Curitiba – PR – Brazil.<br />
6. Olendzki, R. N. 2006. PhD thesis in Chemistry. UFPR. Curitiba – PR – Brazil.<br />
7. Fukamachi, C. R. B., Wypych, F., Mangrich, A. S. 2007. J. Coll. Inter. Sci. 313, 537-541.<br />
8. Mangrich, A. S. 1993. Thesis in Chemistry for Professor. Curitiba – Paraná – Brazil.<br />
284
Diversity of Fractional Composition of Humic Substances and the<br />
Content of Total and Availability Forms of Some Metals in Selected<br />
Soils of the Opole Region, Poland<br />
Izabella Pisarek, Mariusz Głowacki<br />
Opole University, Department of Land Protection, 22 Oleska St., 45-052 Opole, Poland<br />
izapis@uni.opole.pl, marglo@uni.opole.pl<br />
Keywords: humic substances, heavy metals, organo-mineral complexes<br />
1. INTRODUCTION<br />
In Opole region there is high diversity of parent material of soils characterized by<br />
varied chemical properties, which are modified by agriculture and other human activity.<br />
Chemical properties developed under this impact can influence the formation of humic<br />
complexes with mineral substances (2, 4, 5). Among inorganic contaminants heavy metals<br />
require special attention because of they create potential environmental hazard (1-3). The<br />
solubility and the bioaccumulation of metals depends on physico-chemical properties of<br />
soil solution (mainly pH) and the concentration of inorganic ligands and soil’s organic<br />
matter. At the same time their accumulation at the smallest fractions is one of the<br />
contamination indeces of the soil environment (3). The aim of this investigation was <strong>to</strong><br />
determine various humic substances created at various soils and their potential for making<br />
complexes with some metals, especially with their availability forms.<br />
2. TREATMENTS AND METHODS<br />
The objects of these investigations were five soil profiles localized in the Opole<br />
region. Analyzed soils represent the following systematic units: Eutric Cambisols (profiles<br />
1 and 5), Stagnic Humic Gleysols (profile 2), Cambic Rendzinas (profile 3) and Haplic<br />
Podzol (profile 4). The granulometric composition was determined in each soil horizon by<br />
the PN-R-04033 method. The following parameters were determined in soil samples (in<br />
particles
3. RESULTS AND DISCUSSION<br />
Variability of the parent rocks and intensive farming influenced the development of<br />
the physic-chemical and chemical properties of studied soils (pH, salinity, content of<br />
analysed forms of heavy metals – Table 1.).<br />
Table 1. Some properties of investigated soils<br />
Systematic units Genetic horizon pH KCl<br />
Salinity<br />
gKCl⋅kg -1<br />
1. Eutric<br />
Cambisols<br />
2. Stagnic -<br />
Humic Gleysols<br />
3. Cambic<br />
Rendzinas<br />
4. Haplic Podzol<br />
5. Eutric<br />
Cambisols<br />
A p<br />
B br<br />
B br C Ca<br />
A d<br />
A<br />
C<br />
C gg 1<br />
C gg 2<br />
CG<br />
A p<br />
B br<br />
B br C Ca<br />
A h E es<br />
E es<br />
B hfe<br />
C<br />
A p<br />
AB br<br />
B br<br />
C<br />
5.2<br />
7.2<br />
7.4<br />
5.9<br />
6.0<br />
6.3<br />
6.5<br />
6.2<br />
6.3<br />
6.0<br />
6.7<br />
7.6<br />
2.7<br />
3.5<br />
3.8<br />
4.8<br />
6.4<br />
6.2<br />
6.0<br />
6.1<br />
1.560<br />
3.150<br />
1.950<br />
1.360<br />
1.320<br />
0.870<br />
0.690<br />
0.750<br />
0.720<br />
2.520<br />
1.350<br />
2.220<br />
0.326<br />
0.190<br />
0.247<br />
0.185<br />
0.415<br />
0.326<br />
0.247<br />
0.159<br />
C<br />
g⋅kg -1<br />
7.99<br />
1.30<br />
0.47<br />
12.47<br />
7.07<br />
2.15<br />
0.90<br />
0.40<br />
0.20<br />
12.01<br />
1.96<br />
1.00<br />
8.10<br />
1.91<br />
4.61<br />
---<br />
14.50<br />
8.70<br />
2.15<br />
0.9<br />
Formation of the soil humic substances depends on the basic physico-chemical and<br />
chemical properties of the soil and of the undergoing soil processes (1, 3). In studied soils<br />
we observed varying accumulation of <strong>to</strong>tal organic carbon (Table1), and quantitative<br />
differences in humic fractions (Figure 1).<br />
286
60<br />
C %<br />
50<br />
40<br />
30<br />
20<br />
10<br />
0<br />
1/Ap 1/ABbr 2/Ad 2/A 3Ap 4 Ap<br />
number of soil horizons<br />
Fraction 1 (F1) Fraction 2 (F2) Fraction 3 (F3)<br />
Figure 1. Fractional composition of humus in investigated soils.<br />
Organo-mineral complexes take part in many soil processes and can influence the<br />
properties of the soil environment. With high content of organic matter and in the presence<br />
of mineral colloids the metals can associate with mineral-humus complexes. Such a<br />
possibility is indicated by the correlation between the carbon content, floating and colloidal<br />
particles and heavy metals and their available forms (Table 3).<br />
Table 3. Correlation coefficients between some parameters of the investigated soils.<br />
Feature (X) Feature (Y) r<br />
Zn <strong>to</strong>tal<br />
0.5782*<br />
Cu <strong>to</strong>tal<br />
0.7281*<br />
Cu<br />
Particle
4. CONCLUSIONS<br />
1. The diverse granulometric composition and the use of the investigated lands<br />
influence the development of their physic-chemical and chemical properties, which was<br />
shown in salinity, carbon accumulation and the content of analysed metals.<br />
2. Qualitative and quantitative differences in formed of humic substances were<br />
demonstrated in analysed soils.<br />
3. Significant influence of inorganic ligands and organic matter in the studied soils on<br />
the immobilization of analysed metal forms was noticed, which was demonstrated by<br />
correlation coefficients.<br />
ACKNOWLEDGEMENTS<br />
This investigation was financed as a research project – Grant No 2592/P01/2007/32<br />
from the science supporting funds in years 2007-2010.<br />
REFERENCES<br />
1. Baran S., Turski R. 1996: Degradacja, ochrona i rekultywacja gleb. Wyd.AR Lublin, pp.223.<br />
2. Horn A.L., During R.A., Gath S., 2003: Comparison of decision support systems for an<br />
optimised application of compost and sewage sludge on agricultural land based on heavy<br />
metal accumulation in soil, In: Science of the Total Environment, vol. 311, Iss. 1-3: 35-48.<br />
3. Kabata-Pendias A., Pendias H. 1999: Biogeochemia pierwiastków śladowych, PWN,<br />
Warszawa, pp.398.<br />
4. Kononova M.M., 1966: Soil Organic Matter, Pergamon Press, Oxford, pp.383.<br />
5. Pisarek I., 2003: Characterization of humic substances formed in soil fertilized with sewage<br />
sludge and cattle manure, In: Humic Substances and Ecosystems, 5, 93-99.<br />
288
Characterization of Microbiological Effects on the Composition and<br />
Pho<strong>to</strong>chemical Properties of DOM in Coastal Sands Using Ultrahigh<br />
Resolution Mass Spectrometry and 3-D Excitation/Emission<br />
Fluorescence Spectroscopy<br />
David Podgorski 1 , William T. Cooper 1 , Thorsten Dittmar 2 , Markus Huettel 2 , Joel Kostka 2<br />
1 Department of Chemistry and Biochemistry, Florida State University, Tallahassee, FL 32306-<br />
4390, USA, cooper@chem.fsu.edu<br />
2 Department of Oceanography, Florida State University, Tallahassee, FL 32306-4320, USA<br />
Keywords: dissolved organic matter, FT-ICR mass spectrometry, fluorescence spectroscopy,<br />
estuaries, coastal sands<br />
1. INTRODUCTION<br />
The combination of electrospray ionization and ultrahigh resolution Fourier transform<br />
ion cyclotron resonance mass spectrometry (ESI FT-ICR MS) has revolutionized the<br />
characterization of humic substances. High-field (9.4 Tesla) FT-ICR MS can now fully<br />
resolve individual compounds in complex humic mixtures (1), providing a level of<br />
molecular detail thought impossible just a decade ago. In this presentation we will highlight<br />
the molecular information that ultrahigh resolution ESI-MS can provide about terrestriallyderived<br />
humic materials as they move through estuaries and permeable coastal sands<br />
along the Gulf coast of Florida. Permeable sands filter large volumes of water along the<br />
Northern Gulf of Mexico coastline, but there is very limited data on the biogeochemical and<br />
microbial processes affecting DOM turnover during sand filtration. We also evaluated the<br />
impacts microbes had on the pho<strong>to</strong>chemical properties of DOM using excitation-emission<br />
matrix spectroscopy (EEMS).<br />
2. MATERIALS AND METHODS<br />
Sand cores were obtained from the Apalachicola Bay near the mouth of the<br />
Apalachicola River in Northern Florida. These sand cores have microbial densities several<br />
orders of magnitude higher than in the overlying water column and thus act as mini bioreac<strong>to</strong>rs.<br />
Humic-rich river water and water spiked with “fresh” DOM was then passed<br />
through sand columns at flow rates comparable <strong>to</strong> those in the sandy sediments. DOM<br />
was extracted from these water samples before and after passage through the columns<br />
using polymer C-18 solid phase extraction (SPE) cartridges. DOM was eluted from the<br />
SPE cartridges with methanol and then freeze-dried.<br />
289
ESI FT-ICR mass spectra were acquired on a home-built 9.4 T FT-ICR mass<br />
spectrometer at the National High Magnetic Field Labora<strong>to</strong>ry in Tallahassee, FL. The use<br />
of this inst<strong>ru</strong>ment <strong>to</strong> acquire ultrahigh resolution mass spectra of humic materials has been<br />
described previously (1). Excitation-emission matrix (EEM) fluorescence spectra were<br />
obtained with a Jobin Yvon SPEX FluoroMax-4 scanning fluorometer. For details of the<br />
procedures used <strong>to</strong> acquire 3-D spectra, see Kowalczuk et al. (2).<br />
3. RESULTS AND DISCUSSION<br />
High resolution negative-ion ESI FT-ICR mass spectra of DOM before and after<br />
passage through the microbially-dense sand columns revealed that “fresh” DOM isolated<br />
from algal growth chambers was much more reactive than older DOM flowing in<strong>to</strong> the bay.<br />
<strong>Molecular</strong> analysis using three-dimensional van Krevelen diagrams and Kendrick plots,<br />
and double bond equivalency (DBE) frequencies, reveal much about the molecular<br />
changes that occur <strong>to</strong> DOM in coastal sands. The microbial changes had little impact on<br />
the pho<strong>to</strong>chemical properties of “old” DOM, since it appeared <strong>to</strong> be reasonably<br />
pho<strong>to</strong>bleached by the time it reached the estuary. The pho<strong>to</strong>chemical properties of “fresh”<br />
DOM were substantially altered, however.<br />
4. CONCLUSIONS<br />
High resolution FT-ICR mass spectrometry of DOM before and after filtration through<br />
microbially-dense sand columns reveals much about the molecular changes that<br />
accompany biological utilization of humic materials. “Old” riverine DOM appears largely<br />
refrac<strong>to</strong>ry, although some non-specific loss of certain compounds was observed. “Fresh”<br />
algal-derived DOM was much more reactive, with substantial changes in pho<strong>to</strong>chemical<br />
properties that can be explained based on the changes in molecular composition.<br />
REFERENCES<br />
1. Stenson, A. C., Marshall, A. G., Cooper, W. T. 2003. Anal. Chem., 75, 1275-284.<br />
2. Kowalczuk P., Cooper W.J., Whitehead R.F., Durako M.J., Sheldon W. 2003. Aq. Sci. 65, 384-<br />
401.<br />
290
Reactive Polyphenols and Dissolved Nutrients in a Nitrogen-Limited<br />
Headwater Catchment in Western Oregon, USA<br />
Janet Rasmussen 1 , Kate Lajtha 2 , B<strong>ru</strong>ce Caldwell 3<br />
1 Water Resource Science, Oregon State University, Corvallis, Oregon 97331,<br />
rasmussj@science.oregonstate.edu<br />
2 Botany and Plant Pathology, Oregon State University<br />
3 Forest Science, Oregon State University<br />
Keywords: DOC, DON, reactive polyphenol, SUVA<br />
1. INTRODUCTION<br />
Both the quantity and quality of dissolved organic matter (DOM) change dramatically<br />
as it moves from the soil <strong>to</strong> the stream. In N limited systems, inorganic N losses are very<br />
low, but dissolved organic nitrogen (DON) losses may still be substantial (1, 2). The<br />
relationship between DON and polyphenols in soil solutions has been established (3, 4),<br />
but little work has been done linking the reactive polyphenolic and nutrient chemistry of soil<br />
water <strong>to</strong> stream water. Reactive polyphenols (RPP), which include but are not limited <strong>to</strong><br />
tannins, sequester nitrogenous compounds in<strong>to</strong> resistant protein-polyphenol complexes<br />
(5). DOM in N limited systems may contain a high proportion RPP which bind <strong>to</strong> DON, thus<br />
perpetuating the N limitation of the system. In this preliminary study conducted in an N-<br />
limited headwater catchment in the Western Cascades, an approach is presented <strong>to</strong><br />
quantify and compare reactive polyphenols and nutrient dynamics over the first s<strong>to</strong>rm<br />
event in autumn 2007.<br />
2. MATERIALS AND METHODS<br />
The study site is in the H. J. Andrews Experimental Forest in the Western Cascades<br />
of Oregon, USA. Watershed 10 (WS10) is a 10.2 ha catchment with elevation ranging from<br />
425 – 700 m. The climate is Mediterranean, with average annual rainfall of 2220 mm.<br />
Atmospheric N deposition is low, averaging 1.6-2 kg ha -1 yr -1 .(1) Vegetation is mixed<br />
conifer (Douglas fir, western hemlock), with an unders<strong>to</strong>ry including rhododendron and<br />
salal; all known <strong>to</strong> produce tannins.<br />
A 10 m. long impervious barrier installed <strong>to</strong> bedrock at the base of the hillslope on<br />
one side of WS10 collects subsurface flow in<strong>to</strong> a calibrated weir. The stream is gauged 91<br />
m. below the hillslope weir.The drainage area above the barrier contains 25 Prenart<br />
lysimeters at depths of 20 cm, 30-40 cm, and 70-110 cm.<br />
291
The first autumn s<strong>to</strong>rm, beginning 15 Oc<strong>to</strong>ber 2007, deposited over 190 mm of<br />
rainfall in 6 days. During and after the s<strong>to</strong>rm, stream and hillslope water was collected at 2<br />
<strong>to</strong> 4 hour intervals. Lysimeter samples were collected twice daily for 3 days, and then<br />
intermittently. Samples were bulked according <strong>to</strong> depth. All water was filtered with GFF<br />
filters.<br />
Samples from lysimeters, hillslope, and stream were analyzed for DOC, <strong>to</strong>tal<br />
nitrogen, nitrate, ammonium, and DON. Specific UV absorbance (SUVA) is UV 254<br />
normalized by DOC (mg/L), and is a measure of aromaticity. The percent of reactive<br />
polyphenols in each sample was determined by performing Folin Ciocalteu assay on<br />
samples before and after passing them through a polyamide solid phase extraction tube<br />
(Supelco DPA-6S) <strong>to</strong> remove any polyphenols that would bind <strong>to</strong> the substrate. The <strong>to</strong>tal<br />
(TPP) and reactive polyphenols (RPP) were measured in mg/L water-soluble tannin<br />
equivalents (wsTE).<br />
Tannins standards were made from purified salal tannins and balsam fir tannins<br />
contributed by Dr. Caroline Pres<strong>to</strong>n, Pacific Forestry Centre, Vancouver, BC. The salal<br />
and balsam fir tannins were 97.6% and 70.3% water soluble by weight, respectively, and<br />
the plot of absorbance versus concentration for both tannins were essentially the same.<br />
3. RESULTS AND DISCUSSION<br />
The plot of DOC over the hydrograph of the s<strong>to</strong>rm (Figure 1) demonstrates the<br />
flushing response, with similar pattern in DON, SUVA, and TPP values. Changes in DOC,<br />
DON, SUVA, and TPP from baseflow values <strong>to</strong> the average value over the rising limb of<br />
the hydrograph are summarized in Table 1. The changes in DOC and SUVA are similar <strong>to</strong><br />
those found in WS 1, 2, and 10 streamwater by Hood et al over a 6 day s<strong>to</strong>rm in 2003 (6).<br />
During the s<strong>to</strong>rm event, nitrate and ammonium values were below detetection limits in<br />
76% and 93%, respectively, of samples, and DON accounted for 98% of all N in the<br />
stream.<br />
When levels of TPP in samples were above 0.5 mg/L wsTE, the reactive polyphenols<br />
averaged 78% of the <strong>to</strong>tal; otherwise, the results were <strong>to</strong>o close <strong>to</strong> detection limits <strong>to</strong> be<br />
meaningful. In contrast, the tannin standards were 98% reactive. There was no significant<br />
change in the proportion of RPP over the s<strong>to</strong>rm event, regardless of water source.<br />
The tannin standards contained 64% DOC. On average, 16% of the DOC of samples<br />
was polyphenolic. Assuming the proportion of RPP:TPP in the watershed is constant, and<br />
the DOC concentration of TPP in the watershed is similar <strong>to</strong> that of the standards,<br />
approximately 12% of the DOC in WS10 may be composed of RPP.<br />
292
DOC (mg/L)<br />
9<br />
8<br />
7<br />
6<br />
5<br />
4<br />
3<br />
Stream<br />
Hillslope<br />
Shallow lysimeters<br />
Deep Lysimeters<br />
Hydrograph<br />
0.1000<br />
0.0100<br />
0.0010<br />
Log Streamflow (cms)<br />
2<br />
1<br />
0<br />
0.0001<br />
288 290 292 294 296 298<br />
Day of Year<br />
Figure 1. Dissolved organic carbon from different water sources over hydrograph<br />
of s<strong>to</strong>rm event Oc<strong>to</strong>ber 15-25, 2007.<br />
Table 1. Change in DOC, DON, SUVA and TPP from average pre-s<strong>to</strong>rm values <strong>to</strong> average<br />
values over rising limb of hydrograph<br />
Source DOC(mg/L) DON(mg/L)<br />
Baseflow Rising limb % Change Baseflow Rising limb % Change<br />
Lys shal. 3.673 6.427 75 0.183 0.207 13<br />
Lys deep 1.153 1.078 -6 0.063 0.081 29<br />
Hillslope 0.839 2.113 152 0.068 0.086 26<br />
Stream 1.071 3.878 262 0.050 0.122 144<br />
SUVA (Abs/mg/L)<br />
TPP (mg/L wsTE)<br />
Baseflow Rising limb Baseflow Rising limb Baseflow Rising limb<br />
Lys shal. 0.025 0.035 29 0.81 1.05 29<br />
Lys deep 0.017 0.024 41 0.03 0.11 266<br />
Hillslope 0.014 0.022 57 0.068 0.68 900<br />
Stream 0.025 0.036 31 0.26 1.35 419<br />
293
4. CONCLUSIONS<br />
DOC, DON, SUVA and TPP values consistently followed the pattern: shallow<br />
lysimeters > stream > hillslope > deep lysimeters; suggesting that the source of<br />
streamwater during the s<strong>to</strong>rm derives from shallow subsurface flow. The increase in<br />
polyphenols with the rising limb of the hydrograph was quite pronounced. The proportion<br />
of RPP:TPP was constant over time and sources at approximately 0.78. Reactive<br />
polyphenols may account for about 12% of the <strong>to</strong>tal DOC in the system. DON accounted<br />
for 98% of the <strong>to</strong>tal N in the stream during the s<strong>to</strong>rm.<br />
Future work would explore other methods of partitioning reactive water soluble<br />
polyphenolics, including protein precipitation assays. The study will examine seasonal<br />
changes as well as at least one other s<strong>to</strong>rm sequence in spring 2008. Comparison of<br />
systems with varying degrees of N-limitation would be helpful in future studies.<br />
ACKNOWLEDGEMENTS<br />
This study was made possible by NSF LTER funds <strong>to</strong> H.J. Andrews Experimental<br />
Forest and an Oregon Laurels scholarship. Purified tannin standards were generously<br />
contributed by Caroline Pres<strong>to</strong>n. Field and labora<strong>to</strong>ry assistance was provided by Jason<br />
Frentress, Douglas Rasmussen, Yasuyuki Kagotani, Forrest Logsdon, and Lea Wilson.<br />
REFERENCES<br />
1. Perakis, S. and Hedin, L. 2002. Nature. 415, 416-420.<br />
2. Vanderbilt, K., Lajtha, K. and Swanson, F. 2003. Biogeochemistry 62, 87-117.<br />
3. Northup, R., Yu, Z., Dahlgren, R. and Vogt, K. 1995. Nature 377, 227-229.<br />
4. Qualls, R., Haines, B. and Swank, w. 1991. Ecology 72, 254-266.<br />
5. Kraus, T., Zasoski, R., Dahlgren, R., Horwath, W., and Pres<strong>to</strong>n, C. 2004. Soil Biology &<br />
Biochemistry 36, 309.<br />
6. Hood, E., Gooseff, M. and Johnson, S. 2006. Journal of Geophysical Research-<br />
Biogeosciences 111, G1<br />
294
Density Fractions of SOM in Mediterranean Forest Soils:<br />
Characterization by TMAH-Thermochemolysis-GC-MS<br />
Pere Rovira 1 , Laurent Grasset 2 , André Amblès 2<br />
1 CTFC, Pujada del Seminari s/n, 25280 Solsona, Spain, provira21@yahoo.es<br />
2 SRSN, UMR CNRS 6514, Faculté des Sciences, Université de Poitiers, 40 avenue du Recteur<br />
Pineau, 86022 Poitiers, France<br />
Keywords: Density fractionation, TMAH-GC-MS, Lipids, Lignin<br />
1. INTRODUCTION<br />
Physical fractionation methods are used <strong>to</strong> isolate soil organic matter (SOM) fractions<br />
of contrasting dynamics: i.e., <strong>to</strong> separate fresh versus stabilized SOM, free versus<br />
protected SOM (1). These methods are applied <strong>to</strong> obtain a ‘light’ fraction, little or not<br />
associated <strong>to</strong> mineral matter, apparently responsible for the most of microbial activity in<br />
soils. The fractions extracted with dense liquids are heterogeneous mixtures, but a<br />
relationship has been observed between SOM density and resistance <strong>to</strong> decomposition (2,<br />
3). This suggests that density is related <strong>to</strong> the biochemical composition of the fractions (4).<br />
The molecular identification of these differences is the aim of this study. We focus on<br />
the study of biomarkers in density fractions obtained from forest soils. To this end, we<br />
apply thermochemolysis with tetramethylammonium hydroxide (TMAH), coupled <strong>to</strong> GC-<br />
MS. This method is widely used <strong>to</strong> identify and quantify biomarkers released from complex<br />
organic matrices, useful <strong>to</strong> estimate the origin and the decomposition state of the studied<br />
organic material. With a preparative apparatus (5), it is possible <strong>to</strong> carry out the analysis<br />
on samples with small amounts of organic carbon (several milligrams).<br />
2. MATERIALS AND METHODS<br />
The studied soil samples were taken from H horizons of forest soils, all over<br />
carbonatic materials (marl, limes<strong>to</strong>ne, calcareous sands<strong>to</strong>ne), all below holm oak stands<br />
(Quercus rotundifolia). After sampling, the soil samples were air-dried and sieved (2 mm).<br />
The fractionation of soil samples was done as described in Fig. 1. The method is<br />
inspired in that proposed by the Adelaide’s group (4). The result is a set of five fractions of<br />
increasing density. After isolation, each fraction was rinsed with distilled water, dried at<br />
60ºC, and finely ground. The fractions were pyrolyzed in the presence of TMAH (5). The<br />
products of the pyrolysis were characterized and identified by GC-MS.<br />
295
Sample<br />
NaPT d = 1.6<br />
Sonication<br />
Centrifugation<br />
NaPT d = 1.8<br />
Strong agitation<br />
Centrifugation<br />
NaPT d = 2.0<br />
Strong agitation<br />
Centrifugation<br />
NaPT d = 1.6<br />
Light agitation<br />
Centrifugation<br />
Residue Residue Residue Residue<br />
Suspended:<br />
Free light fraction<br />
(FL)<br />
Suspended:<br />
Occluded fraction<br />
(OC 1)<br />
Suspended:<br />
Occluded fraction<br />
(OC 2)<br />
Suspended:<br />
Occluded fraction<br />
(OC 3)<br />
Residue:<br />
Dense fraction<br />
(DF)<br />
Free SOM Protected SOM<br />
Figure 1. Density fractionation method (NaPT: sodium polytungstate).<br />
3. RESULTS AND DISCUSSION<br />
Results from one of the studied samples (H horizon over limes<strong>to</strong>ne) are given here<br />
as an example of the data obtained. In this sample, the distribution of <strong>to</strong>tal SOM among<br />
the density fractions is as follows: FL: 66.8%, OC1: 2.1%, OC2: 5.5%, OC3: 9.2%, DF:<br />
16.4%. I.e., the two extreme fractions (FL and DF) are by far the most of SOM, the<br />
occluded fractions being a very minor part.<br />
We focus on molecular families able <strong>to</strong> inform us about the degree of microbial<br />
transformation of the SOM, relative <strong>to</strong> its origin (mostly plant-derived): fatty acids (FAs),<br />
aromatics and carbohydrates. For many of these groups it is possible <strong>to</strong> obtain significant<br />
information from the identified compounds and the relative proportion between them.<br />
The identified fatty acids (FA) reflect the origin of the SOM fractions: both microbialderived<br />
(branched compounds, iso and ante-iso C 15 and C 17 ) and plant-derived (long chain<br />
compounds, C 20 -C 36 , with even carbon number). While short-chain FAs are typical of<br />
microbial organisms, plant-derived FAs usually show a bi-modal distribution, with two<br />
maxima, one at C 16 or C 18 , the next at either C 22 or C 24 . Long-chain FAs are largely found<br />
in cuticular waxes. The presence of both short- and long-chain FAs in both the FL and the<br />
DF fractions suggests the dominance in these fractions of plant-derived lipids; in contrast,<br />
the very low proportion of long-chain FAs in the occluded fractions (OC1, OC2 and OC3)<br />
suggest a dominance of microbial-derived FAs in these fractions.<br />
296
* * *<br />
Fatty acids<br />
Aromatic compounds<br />
Carbohydrates<br />
16<br />
3<br />
4<br />
5<br />
8<br />
9'<br />
9<br />
11<br />
12<br />
Hexose-derived<br />
Pen<strong>to</strong>se-derived<br />
12<br />
14<br />
22<br />
24<br />
18<br />
20<br />
1<br />
2<br />
6<br />
7<br />
10<br />
* * *<br />
*<br />
26<br />
16<br />
8<br />
11<br />
3<br />
4<br />
5<br />
9<br />
9'<br />
12<br />
1<br />
18<br />
2<br />
6<br />
7<br />
10<br />
*<br />
14<br />
12<br />
20 22<br />
24<br />
26<br />
16<br />
8<br />
11<br />
3<br />
4<br />
5<br />
9'<br />
9<br />
* * *<br />
12<br />
1<br />
14<br />
2<br />
6<br />
7<br />
10<br />
*<br />
12<br />
18<br />
20 22 24<br />
16<br />
1<br />
3<br />
4<br />
5<br />
8<br />
11<br />
9'<br />
18<br />
6<br />
9<br />
* *<br />
**<br />
14<br />
2<br />
7<br />
10<br />
12<br />
12<br />
20 22<br />
24<br />
26<br />
16<br />
1<br />
3<br />
4<br />
5<br />
8<br />
11<br />
*<br />
18<br />
24<br />
9'<br />
* *<br />
9 *<br />
12<br />
12<br />
14<br />
22<br />
20<br />
26<br />
2<br />
6<br />
7<br />
10<br />
Figure 2. Ion chroma<strong>to</strong>grams showing fatty acids (m/z = 74), aromatic compounds (m/z =<br />
77 and 91), and carbohydrates (m/z = 88 and 101) as their methylated forms.<br />
*: unidentified. See text for more details.<br />
297
A number of aromatic compounds have been identified (Fig. 2, middle column): 1,<br />
benzeneacetic acid. 2, dimethoxystyrene. 3, trimethoxybenzene. 4, methoxybenzoic acid.<br />
5, cinnamic acid. 6, dimethoxybenzaldehyde. 7, dimethoxy-ace<strong>to</strong>phenone. 8, dimethoxybenzoic<br />
acid. 9, dimethoxyterephtalic acid. 9', unknown. 10, p-methoxycinnamic acid. 11,<br />
timethoxybenzoic acid. 12, dimethoxycinnamic acid. The identified compounds reveal a<br />
vegetal origin; the most abundant ones are known lignin monomers. However, some<br />
aromatic compounds (e.g., trimethoxybenzene) have been described as the result of<br />
TMAH treatment on polysaccharides (6).<br />
TMAH-thermochimiolysis is not <strong>to</strong>o often applied for polysaccharide characterization,<br />
but sugar derivatives are abundant in the chroma<strong>to</strong>grams. An accurate identification of the<br />
original sugar compound is not possible, but it is possible <strong>to</strong> reliably separate pen<strong>to</strong>sederived<br />
from hexose-derived compounds. Pen<strong>to</strong>se-derived products have been found in<br />
low amounts: hexose-derived products are widely dominant (Fig. 2, right column).<br />
Pen<strong>to</strong>ses are found in low amounts in microbial polysaccharides; they are rather typical of<br />
non-cellulosic, plant-derived st<strong>ru</strong>ctural polysaccharides (hemicelluloses in a broad sense).<br />
Since hemicelluloses decompose faster than cellulose (which is made of glucose, an<br />
hexose), this suggest the co-dominance of resistant plant-derived polysaccharides<br />
(cellulose, more or less microbially-degraded) and polysaccharides of microbial origin and<br />
a lack of fresh plant-derived polysaccharides.<br />
4. CONCLUSIONS<br />
The fatty acids and the aromatic products (lignin monomers) show the importance of<br />
plant-derived materials in the OM of all density fractions. However, the presence of<br />
ramified FAs and the poor signs of pen<strong>to</strong>ses in the chroma<strong>to</strong>grams suggest that this OM<br />
has suffered microbial transformation. The occluded fractions (OC1, OC2, OC3) seem<br />
more microbially transformed than the free (FL) and the dense (DF) fractions, whose<br />
composition is closer <strong>to</strong> the vegetal origin of the SOM.<br />
REFERENCES<br />
1. Skjemstad J.O., Janik L.J. & Taylor J.A., 1998. Aust. J. Exp. Agric. 38: 667-680.<br />
2. Meijboom F.W., Hassink J. & Van Noordwijk M., 1995. Soil Biol. Biochem. 27: 1109-1111.<br />
3. Hassink J., 1995. Soil Biol. Biochem. 27: 1099-1108.<br />
4. Golchin A., Oades J.M., Skjemstad J.O., Clarke P., 1994. Aust. J. Soil Res. 32, 285-309.<br />
5. Grasset L. & Amblès A., 1998. J. Anal. Appl. Pyrol. 47: 1-12.<br />
6. Fabbri D. & Helleur R., 1999. J Anal Appl Pyrol 49: 277-293.<br />
298
Use of Bioluminescent Assay Systems <strong>to</strong> Moni<strong>to</strong>r De<strong>to</strong>xification<br />
Processes in Radionuclide’ Solutions<br />
Tatiana Rozhko 1,2 , N.Kudryasheva 1,2 , M. Alexandrova 1 , O. Mogil’naya 1 ,<br />
G. Vydryakova 1,2 , L. Bondareva 1 , A. Bolsunovsky 1<br />
1 Institute of Biophysics SB RAS, Krasnoyarsk, Russia, gutnikTV72@mail.<strong>ru</strong><br />
2 Siberian Federal University, Krasnoyarsk, Russia<br />
Keywords: de<strong>to</strong>xification, bioluminescent assay, alpha-radionuclides<br />
1. INTRODUCTION<br />
Increase of radioactive contamination in the environment makes the effects of lowlevel<br />
radiation on living organisms very important. Detailed investigations of the effect of<br />
low dose radiation on living organisms were conducted using simple assay systems such<br />
as microorganisms, bacteria, plant and mammal cells, tissues of labora<strong>to</strong>ry mice,<br />
drosophila flies, freshwater c<strong>ru</strong>staceans, etc (1-4). Assay systems based on luminous<br />
bacteria are good candidates for such investigations. Bacterial bioluminescent assays are<br />
widely used <strong>to</strong> moni<strong>to</strong>r environmental <strong>to</strong>xicity (5). The tested parameter is luminescent<br />
intensity of bacteria, which can be easily measured inst<strong>ru</strong>mentally. The advantages of the<br />
bioluminescent assays are their rapidity, sensitivity, simplicity, and availability of the<br />
devices for <strong>to</strong>xicity registration (5-6).<br />
Bioluminescent bioassays have been used <strong>to</strong> moni<strong>to</strong>r the effect of low-level alpha-ray<br />
irradiation in solutions of 241 Am(NO 3 ) 3 (7). In paper (8) effects of two radionuclides (Am-<br />
241 and U(235+238)) on bioluminescent bacteria were compared.<br />
It is known that Humic Substances (HS) de<strong>to</strong>xify solutions of radioactive elements<br />
due <strong>to</strong> their complexiation ability, thus protect the bacterial cells from alpha-irradiation. The<br />
purpose of this study was <strong>to</strong> moni<strong>to</strong>r the de<strong>to</strong>xification ability of HS in solutions of the two<br />
radionuclides using bioluminescent bacteria as assay system.<br />
2. MATERIALS AND METHODS<br />
Cell suspension of 16-h P.phosphoreum 1883 IBSO culture from the Collection of<br />
Luminous Bacteria CCIBSO was applied as a bioassay system <strong>to</strong> study <strong>to</strong>xicity of the<br />
radioactive solutions. Additionally, the intact bacterial cells were used for electronic<br />
microscopy studies.<br />
299
The Gumat-80 preparation (“Gumat”, Irkutsk) was used as a source of HS. It was<br />
produced by non-extracting treatment of coal. Concentrations of HS that inhibit<br />
bioluminescence by less than 20% were 5·10 -4 ÷0.3 g/L.<br />
Solutions of 241 Am(NO 3 ) 3 and (UO 2 )(NO 3 ) 2 were used as sources of α-radiation.<br />
The measurements were carried out with a BLM-8802 bioluminometer (Nauka<br />
Special Design Bureau, Krasnoyarsk, Russia).<br />
3. RESULTS AND DISCUSSION<br />
The dependence of bioluminescence intensity on time of exposure <strong>to</strong> radioactive<br />
solutions in the presence and in the absence of HS was moni<strong>to</strong>red. It was shown that HS<br />
change bioluminescence kinetics in 241 Аm solutions approaching it <strong>to</strong> control, thus<br />
decreasing radio<strong>to</strong>xicity of the solutions (Figure 1).<br />
I rel 2.5<br />
2<br />
1<br />
1.5<br />
1<br />
0.5<br />
control<br />
2<br />
0<br />
. 0 25 50 75 100 125 t, hr<br />
Figure 1. Bioluminescent relative intensity (Irel) vs time of exposure (t, hr) in solutions of<br />
241 Am(N0 3 ) 3 (10-10 М, 3000 Bq/l) in the absence (1)<br />
and in the presence (2) of HS (С=0,25 mg/ml).<br />
Control – bioluminescent relative intensity in the absence of 241 Am(N0 3 ) 3 .<br />
Redistribution of the radionuclides inside the bacterial cells was studied in the<br />
presence of HS (Figure 2).<br />
300
100<br />
Activation<br />
stage<br />
Inhibition<br />
stage<br />
Accumulation of 241 Am, %<br />
75<br />
50<br />
25<br />
0<br />
4 5 6 20 32<br />
time of expouse, hr<br />
in the absence of<br />
Humic Substances<br />
in the presence of<br />
Humic Substances<br />
Figure 2. Accumulation of 241 Am by bacterial cells vs time of exposure (t, hr) in solutions of<br />
241 Am(N0 3 ) 3 (10 -10 М, 3000 Bq/l) in the absence and in the presence<br />
of HS (С=0,25 mg/ml).<br />
The electron microscopy study of bacterial cells was carried out in the presence and<br />
absence of HS. HS were shown <strong>to</strong> decrease the damage of the bacteria in the americium<br />
solutions.<br />
We found that HS (C=0,25 mg/ml) do not change time-decay of bioluminescent<br />
intensity under all concentrations of (UO 2 )(NO 3 ) 2 (C=10 -3 ÷ 2⋅10 -7 M). Microscopy study<br />
showed that HS do not change bacterial images. Hence, these solutions are not de<strong>to</strong>xified<br />
by HS at the conditions of the experiment.<br />
4. CONCLUSION<br />
The study demonstrated a high potential of the bioluminescent assay <strong>to</strong> moni<strong>to</strong>r<br />
de<strong>to</strong>xification efficiency of HS in solutions of radioactive compounds. HS (С = 0.25 mg/ml)<br />
de<strong>to</strong>xified solutions of Americium and did not de<strong>to</strong>xify solutions of Uranium.<br />
ACKNOWLEDGEMENTS<br />
The work was supported by: Award No. RUX0-002-KR-06 of the U.S. Civilian<br />
Research & Development Foundation (CRDF) and RF Ministry of Education and Science,<br />
301
BRHE Program; Grant of “<strong>Molecular</strong> and Cellular Biology”, program of Russian Academy<br />
of Sciences, Grant of Siberian Federal University for young scientists.<br />
REFERENCES<br />
1. Lyutykh, V.P., Dolgikh, A.P. 1998. Meditsinskaya radiologiya i radiatsionnaya bezopasnost,<br />
43, 28-34.<br />
2. Nikolsky, A.V., Koterov, A.N. 1999. Meditsinskaya radiologiya i radiatsionnaya bezopasnost,<br />
44, 5-18.<br />
3. Spitkovsky, D.M. 1999. Radiatsionnaya biologiya. Radioekologiya, 39, 145-155.<br />
4. Koterov, A.N., Nikolsky, A.V. 1999. Radiatsionnaya biologiya. Radioekologiya, 39, 648.<br />
5. Gitelson, I., Kratasyuk, V.A. et al,. Ecological Biophysics.1. Pho<strong>to</strong>biophysics of ecosystems,<br />
Logos, Moscow, 2002.<br />
6. Kudryasheva, N., et al. 1998. Field Analytical Chemical Technologies, 2, 277-280.<br />
7. Rozhko, T., Kudryasheva, N., Kuznetsov, A., Vydryakova, G., Bondareva, L., Bolsunovsky, A.<br />
2007. Pho<strong>to</strong>chem. Pho<strong>to</strong>biol. Sci. 6, 67-70.<br />
8. Rozhko, T.V., Kudryasheva, N.S., Aleksandrova, M.A., Bondareva, .L.G., Bolsunovsky,<br />
A.A., Vydryakova G.V. 2008. Zhurnal Sibirskogo Federal’nogo Universiteta, Accepted.<br />
302
Humification of Peat and Characteristics of its Humic Substances<br />
Depending on their Origin and Age<br />
Jānis Šīre 1 , Māris Kļaviņš 1<br />
1 Department of Environmental Sciences, University of Latvia, Raiņa blvd. 19, LV1586, Rīga,<br />
Latvia, janis.sire@lu.lv<br />
Keywords: Peat; Humification degree; Decomposition degree<br />
1. INTRODUCTION<br />
Major part of peat organic matter is composed from humic substances. To<br />
characterize humification process, the development of humification indexes that link the<br />
rate of transformation of living organic matter and the development of humic substances<br />
with parameters describing the properties of the formed materials can be an important<br />
indica<strong>to</strong>r (1). Usually humification process is evaluated by making indirect measurements<br />
that describe st<strong>ru</strong>ctural changes that occur during the humification process. Several<br />
methods have been suggested for description of humification, such as the measurement of<br />
E 4 /E 6 ratio that indicates development of condensed macromolecules and the amount of<br />
organic /aliphatic carbon estimated by 13 C CP MAS NMR.<br />
The aim of this article is <strong>to</strong> study the humification process of peat and <strong>to</strong> identify links<br />
between peat age (its decomposition degree) and the basic properties of peat and the peat<br />
humic substances.<br />
2. MATERIALS AND METHODS<br />
28 peat samples were collected from the profiles of five high type bogs of industrial<br />
importance in Latvia. The profiles were obtained in varying depths from 0 <strong>to</strong> 145 cm. The<br />
peat samples were characterized by their decomposition degree, 14 C dating, elemental<br />
analysis (C, H, N, S, and O) and UV/Vis spectra and organic carbon content. Ratios E 2 /E 6 ,<br />
E 2 /E 3 , E 3 /E 4 , E 4 /E 6 were determined for the solution of the humic or fulvic in NaHCO 3<br />
solution. Organic carbon concentration of peat extracts was determined using Shimadzu<br />
TOC – VCSN.<br />
To study humification process following indica<strong>to</strong>rs has been used:<br />
1. Humification index (HI) (2)<br />
2. Pyrophosphate index (PyI) (3)<br />
3. <strong>Humus</strong> quality K value (4)<br />
303
3. RESULTS AND DISCUSSION<br />
In this study peat from 5 raised bogs in Latvia has been used and samples from<br />
different depths have been obtained, reflecting bog development conditions in Northern<br />
Europe. The age of the samples varies from 400 <strong>to</strong> 2260 years, and their decomposition<br />
degree (van Post scale) varies from H2 <strong>to</strong> H6.<br />
Basic parameters of peat do not display a similar increasing trend for all the studied<br />
samples. Carbon and nitrogen content of peat samples from the bog Mazais Veiķenieks<br />
increases with increasing age (the depth and decomposition degree), while the content of<br />
sulphur is decreasing. However, for the rest of the studied bogs the variability of elemental<br />
composition is not so random and most probably depends on the botanical composition<br />
and the specific peat formation conditions (first of all, the hydrological regime in the<br />
corresponding bog).<br />
The peat humification process has been analysed using van Krevelen graphs<br />
frequently applied for the analysis of carbon biogeochemical cycle and genesis of fossil<br />
fuel (5). The index of a<strong>to</strong>mic ratios O/C, H/C, and N/C is useful in the identification of<br />
st<strong>ru</strong>ctural changes and the degree of maturity of peat in different depositional<br />
environments. The graph of H/C a<strong>to</strong>mic ratio against O/C a<strong>to</strong>mic ratio reveals changes in<br />
the properties associated with coalification reactions.<br />
The relation between H/C a<strong>to</strong>mic ratio and O/C a<strong>to</strong>mic ratio of organic material of a<br />
differing decomposition degree – beginning with bog plants up <strong>to</strong> brown coal, lignite, and<br />
coal. The graph in Fig. 1 could be considered as a graphical statistical representation of<br />
humification process, indicating the degree of maturity and intensity of degradation<br />
processes such as dehydrogenation (reduction of H/C ratio), decarboxylation (reduction of<br />
O/C ratio), demethylation occurring during the decay of peat forming plants, and peat<br />
maturation continuing up <strong>to</strong> coal. <strong>From</strong> the point of view of chemistry, humification can be<br />
considered as a process in which more labile st<strong>ru</strong>ctures (carbohydrates, amino acids, etc)<br />
are destroyed, but thermodynamically more stable aromatic and polyaromatic st<strong>ru</strong>ctures<br />
emerge. It follows that the analysis of a<strong>to</strong>mic ratios confirms the background of processes<br />
during peat humification. As shown in Figure 1, H/C ratio decreases with increasing<br />
decomposition degree of the original living matter, starting with peat forming plants,<br />
cellulose, and proteins, and up <strong>to</strong> bituminous coal. Comparatively, the studied peats are at<br />
the start of the transformation process of living organic matter. In order <strong>to</strong> provide reliable<br />
and quantity information about the early diagenesis, we carried out further studies of the<br />
dependence of the elemental composition of the peat samples on their age (depth and<br />
decomposition degree). The trends of dependence between H/C values and the depth of<br />
304
the peat samples mostly show negative relation; Kaigu and Mazais Veiķenieks peat bogs<br />
have the highest negative correlations, while Dižais Veiķenieks bog shows a strong<br />
positive relation indicating the general trends of peat transformation, however, at the same<br />
time demonstrating that a<strong>to</strong>mic ratio cannot be correctly used <strong>to</strong> study the humification<br />
process due <strong>to</strong> the significant impact of the original plant composition and peat formation<br />
conditions.<br />
Figure 1. Van Krevelen (H/C vs. O/C a<strong>to</strong>mic ratio) graph of bog plants () peat samples<br />
from studied bogs in Latvia (•), reference peat samples (IHSS) and peat samples from<br />
common peat bogs (•), brown coal (), coal (), lignite ().<br />
The first question <strong>to</strong> be resolved includes the definition of the concepts<br />
“decomposition degree” and “humification degree”. The decomposition degree describes<br />
the extent <strong>to</strong> which original (living) organic matter is transformed. Decomposition process<br />
thus includes: a) transformation processes of living organisms and their tissues; b)<br />
degradation of molecules forming a living organism; c) mineralization (transformation of<br />
organic carbon compounds containing organic nitrogen, phosphorous, and sulphur<br />
compounds in<strong>to</strong> their inorganic species); d) formation of refrac<strong>to</strong>ry organic substances –<br />
humic substances. Decomposition can also be described as the breakdown of plant<br />
material accomplished by microorganisms that use decaying organic matter as a source of<br />
energy and a building material. Besides the chemical decomposition, an important<br />
indica<strong>to</strong>r of decomposition is mechanical friction. In case the decomposition degree is one<br />
305
of the key parameters describing possibilities <strong>to</strong> use peat for agricultural purposes, several<br />
schemes of the characterization of decomposition are suggested, such as von Post scale,<br />
r value, and the peat classification of International Peat Society.<br />
For analysis of humification degree (HD) we have suggested <strong>to</strong> use the ratio of the<br />
<strong>to</strong>tal amount of organic matter <strong>to</strong> the amount of formed humic substances:<br />
C<br />
HD =<br />
C<br />
In our study for a large number of well characterized peat samples we have found<br />
that this parameter strongly correlate with the peat depth and age as well as with other<br />
humification parameters and it can also be used <strong>to</strong> study the transformation processes of<br />
organic matter and peat development.<br />
4. CONCLUSIONS<br />
The humification degree as an indica<strong>to</strong>r of the living organic matter transformation<br />
degree in<strong>to</strong> new, refrac<strong>to</strong>ry organic matter could be based on the moni<strong>to</strong>ring of humic<br />
substances (HS), isolated by extraction in alkaline solution. Thus humification is narrower<br />
concept than decomposition degree and it can be estimated, analyzing the development of<br />
humus (humic substances). As humification degree we suggest <strong>to</strong> use the ratio of the <strong>to</strong>tal<br />
amount of organic matter <strong>to</strong> the amount of formed humic substances:<br />
C<br />
HD =<br />
C<br />
The humification degree values found for a large number of peat samples show, that<br />
this parameter strongly correlate with the peat depth and age and it can also be used <strong>to</strong><br />
study the transformation processes of organic matter and peat development.<br />
ACKNOWLEDGEMENTS<br />
We thank the European Social fund for financial support <strong>to</strong> J. Šīre.<br />
REFERENCES<br />
1. Lu, X.Q., Hanna, J.V., Johnson, W.D. 2001. Chem. Geol. 177, 249–264.<br />
2. Cavani, L., Ciavatta, C., Gessa, C. 2003. Bioresource Technol. 86, 45-52.<br />
3. Schnitzer, M., Levesque, M. 1979. Soil Sci. 127 (3), 140-145.<br />
4. Hargitai, L. 1994. Environ. Internat. 20 (1), 43-48.<br />
5. Van Krevelen, D.W., 1950. Fuel, 29, 269–284.<br />
HS<br />
peat<br />
HS<br />
peat<br />
.<br />
.<br />
306
The Impact of Land Use Conversion on Carbon and Humic Substances<br />
Alvyra Slepetiene 1 , Vic<strong>to</strong>ria Maryganova 2 , Jonas Slepetys 1 , Inga Liaudanskiene 1 ,<br />
Filomena Kavoliute 3 , Z. Kadziuliene 1<br />
1 Lithuanian Institute of Agriculture, Institu<strong>to</strong> al. 1, LT 58344, Akademija, Kedainiai distr., Lithuania,<br />
alvyra@lzi.lt<br />
2 Institute for Problems of Natural Resources Use and Ecology, National Academy of Sciences of<br />
Bela<strong>ru</strong>s, ul. F. Skoriny 10, 220114, Minsk, Bela<strong>ru</strong>s<br />
3 Vilnius University, M.K. Ciurlionio 21, LT 03101 Vilnius, Lithuania<br />
Keywords: carbon, humic acids, gel chroma<strong>to</strong>graphy, E 4 /E 6 , IR-spectroscopy<br />
1. INTRODUCTION<br />
Land use is considered <strong>to</strong> be an important fac<strong>to</strong>r influencing soil carbon variation and<br />
properties of humic substances. Soils under different land use classes can be ranked<br />
according <strong>to</strong> their average Corg contents (0-20cm): cropland (41.3 t C ha -1 ) < orchards/<br />
vineyards (ca. 48 t C/ha) < intensive grassland (60.5 t C ha -1 ) < extensive grassland<br />
(91.8 C t ha -1 ). In extensively used grassland (incl. alpine meadows) 42% of Austria’s <strong>to</strong>tal<br />
soil Corg pool is s<strong>to</strong>red. Sustainable land use practises and landscape conservation seem<br />
necessary <strong>to</strong> maintain this high s<strong>to</strong>rage capacity of montane grassland soils (Gerzabek et<br />
al., 2001). There is little experimental evidence about molecular weight and chemical<br />
st<strong>ru</strong>cture of humic acids in differently used agricultural and natural soils, especially<br />
describing changes influenced by land use conversion. As a result, one of the main<br />
objectives of this work was <strong>to</strong> study the effect of land use on carbon changes and<br />
properties of humic substances.<br />
2. MATERIALS AND METHODS<br />
Soil samples from the 0-30 cm layer were taken in 2007 in Silute and Kedainiai<br />
regions of Lithuania. Part of samples (6-10) represented Albeluvisols and the other part<br />
(15-17, 20-21) represented Cambisols. Carbon content in all samples was determined by a<br />
dry combustion method using an au<strong>to</strong>matic analyzer Vario EL III (Germany). Humic<br />
substances were extracted using alkaline sodium pyrophosphate solution. Humic acids<br />
(HA) were investigated by the methods of gel permeation chroma<strong>to</strong>graphy, absorption<br />
spectroscopy in visible region, and IR-spectroscopy. The molecular weight distribution of<br />
HA was determined by using gel permeation chroma<strong>to</strong>graphy on Sephadex G-100<br />
(Pharmacia, Sweden) with the application of 0.05 M Tris-HCl-buffer at pH 9.0 as eluent.<br />
307
The formula of Determan (Determan, 1970) was used for the estimation of an average<br />
apparent molecular weight of fractions. The relative contents of the molecular weight<br />
fractions of HA were estimated from the areas under corresponding peaks on the curves of<br />
their molecular weight distribution. Optical densities of HA at 465 nm (D 465 ) and 665 nm<br />
(D 665 ) in 0.1 M NaOH were measured and E 4 /E 6 ratios calculated. IR-spectra were <strong>ru</strong>n on<br />
KBr pellets.<br />
3. RESULTS AND DISCUSSION<br />
The content of carbon in Albeluvisols varied in range 1.40–2.83% and in Cambisols<br />
in range 1.98–2.22% in agricultural soils; 1.33%– in natural meadows and was much<br />
higher (6.81%) in flower garden fertilized by peat litter (Table 1).<br />
Table 1. Carbon content in differently used soils<br />
Sample<br />
number<br />
Site Soil description C% ±<br />
6 Silute region Nikelai fallow 2.77 0.17<br />
7 „ Nikelai grassland 2.83 0.19<br />
8 „ Kalniske – Jurgaiciai forest 1.98 0.24<br />
9 „ Palendriai fallow 1.40 0.06<br />
10 „ Palendriai pastured grassland 1.42 0.17<br />
15<br />
Kedainiai<br />
region<br />
Long term pasture (since1946) 2.22 0.06<br />
16 „ Arable land converted from pasture 1.98 0.13<br />
17 „ Natural meadow 1.51 0.06<br />
20 „ Abandoned apple-tree orchard 1.33 0.02<br />
21 „ Flower garden fertilised by peat litter 6.81 0.93<br />
It was found that land use conversion had both positive and negative effects on soil<br />
carbon sequestration. We determined that in agricultural soils carbon sequestration<br />
occurred in longevous sown grass swards (1.16 t C ha-1 year -1). Negative C changes<br />
occurred due <strong>to</strong> conversion of swards in<strong>to</strong> fallows as well as in unfertilised abandoned<br />
apple-tree orchards.<br />
The results of the humic acids analyses by gel chroma<strong>to</strong>graphy show high molecular<br />
weight and polydispersity of the humic acids (Table 2). All humic acids made up two major<br />
fractions. A higher molecular weight fraction 1 with an average molecular weight (MW) ≥<br />
100, 000 Da was found <strong>to</strong> vary from 16 <strong>to</strong> 40% for different HA under study. The content of<br />
a lower molecular weight fraction 2 characterized by МW from 15,240 <strong>to</strong> 36,980 Da varied<br />
within 60–80% range.<br />
308
Sample<br />
Table 2 . MW, D 465 and E 4 /E 6 ratios of humic acids from differently used soils<br />
Fraction 1 Fraction 2<br />
MW, Da % MW, Da %<br />
D 465 E 4 /E 6<br />
HA-6 ≥100,000 20 22,340 80 0.671 4.53<br />
HA-7 ≥ 100,000 16 24,430 84 0.632 4.51<br />
HA-8 ≥ 100,000 23 26,180 77 0.459 4.88<br />
HA-9 ≥ 100,000 20 15,240 80 0.618 4.04<br />
HA-10 ≥ 100,000 20 20,650 80 0.626 4.06<br />
HA-15 ≥ 100,000 29 18,280 71 0.474 4.47<br />
HA-16 ≥ 100,000 25 18,790 75 0.559 4.27<br />
HA-17 ≥100,000 23 23,600 77 0.585 3.95<br />
HA-20 ≥100,000 27 28,180 73 0.488 4.24<br />
HA-21 ≥100,000 40 36,980 60 0.441 5.73<br />
Note: Humic acids numbered according <strong>to</strong> sample number shown in Table 1<br />
Optical density D 465 has been considered <strong>to</strong> characterize the degree of<br />
polyconjugation in the humic molecules. A higher value of D 465 usually corresponds <strong>to</strong> a<br />
higher degree of polyconjugation and, consequently, <strong>to</strong> a higher degree of chemical<br />
maturity of HA (Orlov, 1990). The E 4 /E 6 ratio supposedly decreases with progressive<br />
humification and increase in the aromatic condensation (Kononova, 1966).<br />
The values of D 465 for HA under study varied in a wide range of 0.441–0.671 and the<br />
E 4 /E 6 ratios in a range of 3.95–5.73 (Table 2) which shows the difference in the degrees of<br />
polyconjugation and aromatic condensation in their macromolecules.<br />
The analysis of the data shows that conversion of grasslands and pastured<br />
grasslands in<strong>to</strong> fallows and arable lands leads <strong>to</strong> the transformation of HA in the direction<br />
of decreasing MW, amide groups and carbohydrates, increasing the aromatic st<strong>ru</strong>ctures,<br />
carboxylic groups and polyconjugated systems and, consequently, in the direction of<br />
increasing the degrees of their humification and chemical maturity. This is due <strong>to</strong><br />
decreasing the input of fresh organic residues in<strong>to</strong> the soil. Conversion of swards in<br />
unfertilised abandoned apple-tree orchard leads <strong>to</strong> the transformation of HA in the same<br />
direction.<br />
The HA-21 from the soil of the flower garden fertilised by peat litter contains<br />
macromolecules with the highest MW and is characterized by the least developed systems<br />
of polyconjugation, a low content of carboxylic functionalities and a high proportion of<br />
amide groups. The HA-21 is the youngest among all the HA under study. This indicates<br />
309
that the process of humification with the formation of the young immature humic molecules<br />
and accumulation of soil organic matter in this soil is the most intensive.<br />
The HA-8 from the forest soil has a relatively low degree of polyconjugation. It is poor<br />
in carboxylic groups and rich in amide and phenolic groups. The HA-17 from the soil of<br />
natural meadow can be regarded as mature HA with the large amount of carboxylic groups<br />
and the high degrees of aromatic condensation and polyconjugation.<br />
Significant relationships were identified between carbon and soil elements related <strong>to</strong><br />
it. Significant linear correlation (*- significant at P≤ 0.05; ** - at P≤ 0.01) was determined<br />
between <strong>to</strong>tal phospho<strong>ru</strong>s and organic matter contents (r= 0.470*), carbon (r= 0.539**),<br />
nitrogen (r= 0.595**) contents and HA concentration (r= 0.429*).<br />
CONCLUSIONS<br />
Land use conversion had both positive and negative effects on soil carbon<br />
sequestration. Conversion of grasslands and pastured grasslands in<strong>to</strong> fallows and arable<br />
lands, as well as conversion of swards in unfertilised abandoned apple-tree orchard leads<br />
<strong>to</strong> the transformation of HA in the direction of increasing the degree of their chemical<br />
maturity.<br />
The input of organic fertilisers in<strong>to</strong> the soil of the flower garden increases the process<br />
of humification with the formation of young immature HA and accumulation of soil organic<br />
matter.<br />
ACKNOWLEDGEMENTS<br />
This work was supported by the Lithuanian Foundation for Science (T-78/07) <strong>to</strong><br />
whom all authors gratefully acknowledge financial assistance.<br />
REFERENCES<br />
1. Determan G. Gel chroma<strong>to</strong>graphy. M., 1970 (in Russian).<br />
2. Gerzabek M.H., Strebl F., Tulipan M. and Schwarz S. Quantification of carbon pools in<br />
agriculturally used soils of Austria by use of a soil information system // COST 627, Carbon<br />
s<strong>to</strong>rage in European grasslands . Meeting of WG3, WG4 and MC on 28-29 September 2001.<br />
3. Kononova M. M. Soil organic matter. M., 1963 (in Russian).<br />
4. Orlov D. S. <strong>Humus</strong> acids of soils and general theory of humification. M., 1990 (in Russian).<br />
310
Char and Humin Fractions in Amazonian Dark Earths<br />
Guixue Song 1 , Etelvino H. Novotny 1,2,3 , Michael H.B. Hayes 1 , Eduardo R. de Azêvedo 3 ,<br />
Ti<strong>to</strong> J. Bonagamba 3<br />
1 Department of Chemical & Environmental Sciences, Limerick, Ireland, guixue.song@ul.ie<br />
2 Embrapa Solos, R. Jardim Botânico, 1024, CEP 22460-000, Rio de Janeiro-RJ-Brazil<br />
3 Institu<strong>to</strong> de Física de São Carlos-Universidade de São Paulo, São Carlos, Brazil<br />
Keywords: Amazonian dark earth, humin, Black carbon, char, urea, dimethyl sulfoxide, NMR<br />
1. INTRODUCTION<br />
The high and specific SOM contents of the Amazonian Dark Earths (ADE, Terra<br />
Preta de Índios), and their high contents of P and Ca provide high natural fertility <strong>to</strong> the<br />
soils. Char or black carbon (BC) plays a major role for the SOM stability in ADE soils (1)<br />
and it also provides a significant potential for carbon sequestration and sustainable<br />
ecosystems (2). There are several studies of the humic acids (HAs) of ADE soils (e.g., 3<br />
and 4). However, because of the difficulties in isolation, there is less awareness of humin,<br />
the most abundant SOM component, and of the interaction mechanisms of recalcitrant BC<br />
with SOM (especially humin) and clays. In this study, humic materials were extracted using<br />
the IHSS procedure and by exhaustive sequential extraction procedures. Iso<strong>to</strong>pic 13 C<br />
analyses, and solid-state 13 C NMR spectroscopy were used for characterizations.<br />
2. MATERIALS AND METHODS<br />
ADE sample 1 (500 g) was extracted by the exhaustive sequential extraction<br />
procedure using NaOH at pH 7, 10.6 and 12.6, and then with 0.1M NaOH + 6M urea<br />
(base/urea) following the procedure outlined in Song et al (5). Soil extracts were<br />
fractionated by the XAD-8 and XAD-4 resin-in-tandem procedure. ADE sample 2 (140 g)<br />
was treated and extracted following the procedure recommended by IHSS. Then the soil<br />
residue was extracted using 0.1M NaOH + 6M urea. HAs from 1 and from 2 were treated<br />
with 0.3M HF/0.1M HCl. Then the coarse char was carefully recovered by sieving (passing<br />
through 63 μm sieve) and sedimentation. The dry light fractions (
HF. The humic fractions were characterized by VACP-TOSS 13 C NMR spectroscopy (refer<br />
<strong>to</strong> Novonty et al. in this Conference Proceedings, and <strong>to</strong> 5).<br />
3. RESULTS AND DISCUSSION<br />
In the case of sample 1, the yields of HAs and FAs decreased significantly with<br />
increasing extractant pH (Table 1). The humic material isolated in base/urea was part of<br />
the humin fraction according <strong>to</strong> the classical definition. However, the isolates displayed<br />
characteristics of the alkaline humic fractions once released by base/urea. These are<br />
referred <strong>to</strong> as base/urea HAs or FAs. The HAs isolated with base and base/urea were the<br />
most abundant of the fractions (ca. 87%), with the FAs isolated with base and base/urea<br />
accounting for the remainder. The HAs and FAs isolated at pH 7 were the major fractions<br />
(ca. 57%) in the <strong>to</strong>tal HS isolated from base and base/urea solvents. That indicates that<br />
the ADE SOM is highly humified and oxidized. Using the urea enhanced base solvent from<br />
8% <strong>to</strong> 19% additional humic materials were isolated. The data could suggest the humin is<br />
a mixture of HAs and FAs components that probably were trapped in, or associated with,<br />
through non-covalent bonds (e.g. H-bonds), the humic/humin core. These results support<br />
the supramolecular theory proposed by Piccolo (6), in which the HS may be regarded as<br />
associations of self-assembling heterogeneous and relatively small molecules derived<br />
from the degradation and decomposition of biomass debris. The aggregates will likely be<br />
‘held <strong>to</strong>gether’ through a complex combination of hydrophobic associations, charge<br />
interactions, hydrogen bonds, and metal bridging (7). However, the base/urea humic<br />
fractions isolated and the DMSO humin contained relatively larger sized molecules than<br />
the conventional alkaline HAs or FAs. These are in ‘stable aggregates’ or<br />
‘macromolecules’ (8).<br />
Table 1. Yields of HAs, FAs, and humin isolated using base/urea and DMSO/H 2 SO 4<br />
ADE Sample 1 ADE Sample 2<br />
pH 7 pH 10.6 pH 12.6 Base/Urea 0.1M NaOH Base/Urea<br />
HA 3.38 1.13 0.07 1.04 17.55 1.61<br />
FA 0.32 0.27 0.1 0.17 2.32 0.17<br />
DMSO Humin 3.85 5.69<br />
DMSO FA 0.55<br />
The most recalcitrant SOM components associated intimately with silt and clay was<br />
isolated from DMSO/H 2 SO 4 . About 19 <strong>to</strong> 32% (calculated in terms of the <strong>to</strong>tal organic C<br />
contents of soil samples) of humin material can be extracted. With this sequence of<br />
extraction procedure, up <strong>to</strong> 74% of SOM was isolated.<br />
312
The δ 13 C values of the humic fractions indicated the humic material was mainly<br />
derived from C3 plants, with an average δ 13 C value of ca -28.1‰. The δ 13 C values of the<br />
HA fractions were slightly enriched with 13 C. The δ 13 C decreased from -28.1‰ <strong>to</strong> -30.0‰<br />
for DMSO humin and from -30.8 <strong>to</strong> -31.7‰ for the DMSO extracted residue, respectively.<br />
This might be explained selective utilization of organic compounds by microbes.<br />
aromatic carboxyl<br />
170 130<br />
FA pH 7<br />
169<br />
Sample1<br />
HA pH 10.6<br />
169<br />
HA pH 7<br />
Coarse char<br />
153,148 130<br />
173<br />
89, 83<br />
73<br />
63 55<br />
104<br />
33<br />
171<br />
33<br />
HA 0.1M NaOH<br />
33<br />
Sample2<br />
HA base/urea<br />
Humin before DMSO<br />
extraction<br />
DMSO humin<br />
173<br />
173<br />
173<br />
104<br />
aliphatic carboxyl<br />
73<br />
55<br />
33<br />
30(shoulder)<br />
15<br />
240 210 180 150 120 90 60 30 0 ppm<br />
Figure 1. VACP-TOSS 13 C NMR spectra of HAs and FAs isolated with base, base/urea<br />
HA, humin before DMSO/H 2 SO 4 extraction from light fraction, and DMSO humin.<br />
The predominant resonances for the HAs, FAs and coarse char in 110 <strong>to</strong> 156 ppm<br />
region (Figure 1) showed hydrogen-deficient condensed aromatic C, mainly derived from<br />
char. The dipolar dephasing spectra (not shown) of the HAs and FAs isolated from 0.1M<br />
NaOH and the coarse char presented significant unpro<strong>to</strong>nated C in 110 <strong>to</strong> 156 ppm region,<br />
ca 74%, 80% and 62%, respectively, compared <strong>to</strong> the corresponding <strong>to</strong>tal C area. The<br />
alkaline HAs and FAs were enriched with carboxylic groups attached <strong>to</strong> the condensed<br />
aromatic ‘core’, as evidenced by the relatively lower resonances of COO at ca. 169 <strong>to</strong> 171<br />
ppm. The coarse char was mixed with components from lignin units (55, 148 and 153 ppm<br />
resonances), cellulose (resonances at 63, 73, 83, 89, 104 ppm) and BC (prominent<br />
aromatic C at 130 ppm). In another word, the coarse char material presents signals of<br />
313
unaltered plant debris, BC and aliphatic components. The base/urea HA and DMSO humin<br />
had prominent aliphatic groups (crystalline polymethylene C at 33 ppm and amorphous<br />
polymethylene C at 30 ppm), and relatively low contents of aromatic C and carboxyl<br />
groups, suggesting significant contributions from long-chain aliphatic moieties (e.g., lipids,<br />
waxes, cutin, etc.). Compared <strong>to</strong> DMSO humin, humins before and after DMSO/H 2 SO 4<br />
extraction were very similar. It is likely that condensed BC, peptides and carbohydrate<br />
(e.g. cellulose) components were trapped in the humic matrix or physically protected by<br />
intimate association with clay, whereby both base/urea and DMSO/H 2 SO 4 solvent could<br />
only partially cleave the weak bonds between BC, humin and clay minerals.<br />
4. CONCLUSIONS<br />
The well humified and oxidised char derived from incomplete combustion of biomass<br />
contribute the main components in ADE SOM components. The most recalcitrant BC in<br />
the humin matrix is probably embedded within the silt and clay minerals forming organicmineral<br />
complexes, or protected by steric constraints which are difficult <strong>to</strong> cleave by<br />
base/urea and DMSO solvents. The primary recalcitrant SOM (DMSO humin) is from non-<br />
BC sources, such as long-chain fatty acids/ester, lipids, cutins, etc. containing derivatives<br />
of microbial origins.<br />
REFERENCES<br />
1. Glaser, B., Balashov, E., Haumaier, L., Guggenberger, G. & Zech, W. 2000. Organic<br />
Geochemistry, 31, 669-678.<br />
2. Lehmann, J., J. Gaunt & M. Rondon. 2006. Mitigation and Adaptation Strategies for Global<br />
Change, 11, 403–42.<br />
3. Novotny, E.H., deAzevedo, E.R., Bonagamba, T.J., Cunha, T.J.F., Madari, B.E., Benites, V.d.<br />
& Hayes, M.H.B. 2007. Environmental Science and Technology, 41, 400-405.<br />
4. Solomon, D., Lehmann, J., Thies, J., Schafer, T., Liang, B., Kinyangi, J., Neves, E., Petersen,<br />
J., Luizao, F. & Skjemstad, J. 2007. Geochimica et Cosmochimica Acta, 71, 2285-2298.<br />
5. Song, G., Novotny, E.H., Simpson, A.J., Clapp, C.E. & Hayes, M.H.B. 2007. European Journal<br />
of Soil Science, accepted for publication.<br />
6. Piccolo, A. 2001. Soil Science, 166, 810-832.<br />
7. Simpson, A.J. Simpson, A.J., W.L. Kingery, M.H.B. Hayes, M. Spraul, E. Humpfer, P.<br />
Dvortsak, R. Kerssebaum, M. Godejohann & M. Hofmann. 2002. Naturwissenschaften. 89, 84-<br />
88.<br />
8. Simpson, A.J., Song, G., Smith, E., Lam, B., Novotny, E.H. & Hayes, M.H.B. 2007.<br />
Environmental Science and Technology, 41, 876-883.<br />
314
Diverse Microbial Carbon Turnover and Dynamics in Temperate and<br />
Tropical Forest Soils<br />
Heather M. Throckmor<strong>to</strong>n 1 , Jeffrey A. Bird 2 , Mary K. Fires<strong>to</strong>ne 3 , William R. Horwath 1<br />
1 University of California, Davis, One Shields Ave., 95616 Davis, California,<br />
hthrockmor<strong>to</strong>n@ucdavis.edu<br />
2 Queens College CUNY, 65-30 Kissena Blvd., 11367 Flushing, New York<br />
3 University of California, 32 Hilgard Hall, 94720 Berkeley, California<br />
Keywords: microbial turnover, humus, soil organic matter, tropical, temperate, forest soils<br />
1. INTRODUCTION<br />
Microbial metabolism is widely accepted as the driving force in humification<br />
processes; however, turnover models wholly overlook the importance of microbial<br />
biochemistry despite the fact that most plant residues likely pass through microbial<br />
biomass prior <strong>to</strong> conversion <strong>to</strong> humic substances (Kogel-Knabner, 2002). This research<br />
investigates the importance of microbial biochemistry <strong>to</strong> humification pathways in two<br />
climatically different forest ecosystems; Blodgett forest (BF), a temperate forest in the<br />
Sierra Nevada and Luquillo forest (LF), a tropical forest in Puer<strong>to</strong> Rico. These sites<br />
represent diverse ecosystems that are known <strong>to</strong> support substantially different microbial<br />
communities, and provide an excellent opportunity <strong>to</strong> look at the effects of climate, parent<br />
material, and microbial community on humification.<br />
2. MATERIAL AND METHODS<br />
Temperate and tropical microorganisms from four biochemically contrasting groups<br />
(fungi, actinomycetes, bacteria gram (+), and bacteria gram (-)) were isolated from BF and<br />
LF and grown in 99-a<strong>to</strong>m-percent 13 C media. Enriched microorganisms were au<strong>to</strong>claved<br />
and lysed microbial cells were added <strong>to</strong> soil at a depth of 3 <strong>to</strong> 4 cm at both sites in a<br />
reciprocal design. Treated soils are being excavated at 5 time points over a span of 3<br />
years at BF and 2 years at LF. Excavated soils are separated in<strong>to</strong> two depth fractions (0-<br />
7.5 and 7.5-15 cm below the surface) and analyzed for <strong>to</strong>tal C and 13 C using combustion<br />
gas chroma<strong>to</strong>graphy-iso<strong>to</strong>pe ratio mass spectrometry (GC-IRMS); microbial biomass<br />
carbon (MBC) is determined using the chloroform fumigation method; dissolved organic<br />
carbon (DOC) is determined by K 2 SO 4 extraction and analyzed with a UV-persulfate DOC<br />
analyzer coupled <strong>to</strong> an IRMS. Soils are incubated at 55% of field capacity and analyzed for<br />
CO 2 using infrared absorption spectroscopy and GC-IRMS.<br />
315
3. RESULTS AND DISCUSSIONS<br />
Decomposition rates were substantially greater at LF than at BF for all treatments<br />
(fig. 1 and 2). While a substantial amount of new C had been lost by the third excavation<br />
for BF and LF (66 and 82% respectively), less than 5% of new C was recovered in the 7.5<br />
<strong>to</strong> 15 cm depth from both sites, indicating that little new C was lost <strong>to</strong> leaching at either<br />
site. The microbial biomass pool and overall CO 2 flux was greater for LF than for BF soils,<br />
which corresponds <strong>to</strong> greater decomposition rates for new C at LF than at BF. While there<br />
were initial differences in overall decomposition rates between microbial groups at both<br />
sites, over time the recoveries of new microbial C became more similar for different groups<br />
(fig. 1 and 2). Within microbial groups, there were little <strong>to</strong> no differences in overall<br />
decomposition rates when comparing temperate and tropical additions (fig. 1 and 2).<br />
However, there were differences between temperate and tropical additions as new C<br />
recovery within the microbial biomass pool for BF and LF (fig. 3 and 4).<br />
Tropical Microbes: Percent Recovery (%)<br />
100<br />
80<br />
60<br />
40<br />
20<br />
13 months<br />
5 months<br />
1 month<br />
0<br />
0 20 40 60 80 100<br />
Temperate Microbes: Percent Recovery (%)<br />
Fungi<br />
Actinos<br />
Gram +<br />
Gram -<br />
Figure 1. Percent recovery of new soil C remaining from different microbial groups<br />
at BF at 1, 5, and 13 months.<br />
316<br />
Tropical Microbes: Percent Recovery (%)<br />
100<br />
80<br />
60<br />
40<br />
20<br />
8.5 months<br />
3.5 months<br />
0.5 months<br />
0<br />
0 20 40 60 80 100<br />
Temperate Microbes: Percent Recovery (%)<br />
Fungi<br />
Actinos<br />
Gram+<br />
Gram-<br />
Figure 2. Percent recovery of new soil C remaining from different microbial groups<br />
at LF at 0.5, 3.5 and 8.5 months.
After one month, recoveries of tropical additions from BF as MBC were significantly<br />
greater for all groups except gram (-) bacteria. After 5 months, these trends reversed and<br />
recovery of temperate additions were significantly greater for all groups except gram (-)<br />
bacteria. After 13 months, tropical and temperate C recovered as MBC converge for all<br />
groups (fig. 3).<br />
Tropical Microbes: Percent Recovery (%)<br />
15<br />
12<br />
9<br />
6<br />
3<br />
0<br />
1 month<br />
5 months<br />
13 months<br />
0 3 6 9 12 15<br />
Temperate Microbes: Percent Recovery (%)<br />
Fungi<br />
Actinos<br />
Gram +<br />
Gram -<br />
Figure 3. Percent recovery of new soil C as MBC from different microbial groups<br />
at BF at 1, 5, and 13 months.<br />
Similarly <strong>to</strong> BF, differences between temperate and tropical additions recovered as<br />
MBC were initially observed at LF at the first excavation (at 0.5 months). After 3.5 months,<br />
temperate and tropical recoveries converge for all microbial groups (fig. 4).<br />
Tropical Microbes: Percent Recovery (%)<br />
15<br />
12<br />
9<br />
6<br />
3<br />
0<br />
3.5 months<br />
0.5 months<br />
0 3 6 9 12 15<br />
Temperate Microbes: Percent Recovery (%)<br />
Fungi<br />
Actinos<br />
Gram+<br />
Gram-<br />
Figure 4. Percent recovery of new C as MBC from different microbial groups<br />
at LF at 0.5 and 3.5 months.<br />
317
Initial recoveries of new C within the DOC pool at BF were significantly different<br />
between most treatments. After 5 and 13 months, new C recoveries as DOC converge and<br />
stabilize at ±0.4% of initial input C at BF. After 0.5 months, new C recoveries as DOC at<br />
LF were less than 0.5% of input C with some significant differences between treatments.<br />
After several months, new C recoveries as DOC declined <strong>to</strong>
The Comparison between <strong>Humus</strong> St<strong>ru</strong>cture of 5 <strong>to</strong> 1 μm Particle-Size<br />
Fractions and Fine Clay Fractions in Soils of Locally Hydromorphic<br />
Landscapes<br />
Svetlana A. Tischenko, Olga S. Bezuglova<br />
The Southern Federal University, 105, B.Sadovaya, Ros<strong>to</strong>v-on-Don, Russia, stischenko@mail.<strong>ru</strong><br />
Keywords: soil organic matter, chernozem, locally hydromorphic soils, humus st<strong>ru</strong>cture, humic<br />
substances, particle-size fraction<br />
1. INTRODUCTION<br />
One of the fac<strong>to</strong>rs of agricultural soil degradation in the chernozemic zone is the wide<br />
spread appearance of local hydromorphic areas. Their appearance within the st<strong>ru</strong>cture of<br />
agrolandscape is evidence of local changes in hydrological regime. The change <strong>to</strong><br />
hydromorphic soils last decades and affected areas are evident within the Russian<br />
Federation, Ukraine and Moldova.<br />
Research is needed that defines the laws that govern distribution and properties of<br />
soil humus of different soil fractions. In addition we need <strong>to</strong> acquire knowledge no humus<br />
accumulation processes and the extent <strong>to</strong> which those process are affected by various<br />
mechanical elements, interrelationships between organic and mineral parts of soil and<br />
their role in humus st<strong>ru</strong>cture formation etc. It is known (7, 8, 9) that the 5–1 μm particlesize<br />
fraction contributes in humus accumulation in <strong>to</strong> an equal or greater extent than the<br />
< 1 μm fraction. The degree of humus accumulation by 5–1 μm and < 1 μm particle-size<br />
fractions varies with soil type, but basically depends on the mineralogical st<strong>ru</strong>cture (2, 3)<br />
and the degree of dispersiveness that characterizes soil organic matter (4).<br />
2. MATERIALS AND METHODS<br />
The soil sample used in this study was collected from an agricultural field located in<br />
the South of Ros<strong>to</strong>v region, Russia. The soil fraction of the mechanical elements was<br />
obtained by sedimentation as described by Gorbunov (1). The definition of group and<br />
fractional st<strong>ru</strong>cture of soil humus was determined according <strong>to</strong> the method shown in (6).<br />
3. RESULTS AND DISCUSSION<br />
The humus st<strong>ru</strong>cture of clay fractions appreciably differs from humus st<strong>ru</strong>cture of soil<br />
as a whole. Fulvoacids prevail in the humus st<strong>ru</strong>cture, and the appreciable reduction of the<br />
non-hydrolyzed part of humus is also evident. In the clay fraction its content constitute only<br />
319
25-30 % from the contents of the non-hydrolyzed part of humus in soils (tab. 1). Probably,<br />
it is connected that during separation of clay fraction the non-hydrolyzed part of humus<br />
really passes in group of humic acids. These results speak about the large concentration<br />
гумуса in the clay fraction of soils of the locally hydromorphic landscapes. There is it,<br />
apparently, because of changes in mineralogy of hydromorphic soils.<br />
Horiz<br />
on<br />
Table 1: <strong>Humus</strong> st<strong>ru</strong>cture of the clay fraction of locally hydromorphic soils<br />
С<br />
<strong>to</strong>tal<br />
%<br />
HA<br />
FA<br />
1+2 3 ∑ HA 1+1а+2 3 ∑ FA<br />
N-G<br />
С HA<br />
С FA<br />
Meadow chernozemic super-power soil<br />
А 1 2.86 26.57 17.13 43.70 17.48 5.24 22.72 33.58 1.9<br />
АВ 3.30 26.36 16.96 43.32 13.63 4.24 17.87 38.81 2.4<br />
В 1 2.86 24.48 18.53 43.01 20.63 5.94 26.57 30.33 1.6<br />
В 2 2.30 25.65 13.04 38.69 16.96 8.26 25.22 36.09 1.5<br />
ВС 2.52 18.25 19.05 37.30 16.27 7.54 23.81 38.89 1.56<br />
С 1.85 18.37 15.14 33.51 22.70 13.51 36.21 30.28 0.93<br />
Meadow gleyed power soil<br />
А 1 2.63 28.89 24.33 53.22 9.13 6.46 15.59 31.19 3.41<br />
А S 2.63 33.08 18.25 51.33 3.04 8.37 11.41 37.26 4.5<br />
АВ 3.19 33.23 15.67 48.90 3.76 4.39 8.15 42.95 6.0<br />
АВ g 2.63 29.66 7.0 37.26 7.60 3.80 11.40 51.34 3.27<br />
В g 2.07 25.60 7.25 32.85 8.21 4.83 13.04 54.11 2.52<br />
The research conducted earlier by О.G. Nazarenko (5) showed the significant humus<br />
accumulation in 5 <strong>to</strong> 1 μm particle-size fraction as compared with coarse and fine fractions<br />
in soils of locally hydromorphic landscapes. This study showed the st<strong>ru</strong>cture of 5 <strong>to</strong> 1 μm<br />
particle-size fraction includes a prevalence humic acids coupled with calcium. The fraction<br />
humic acids strongly coupled <strong>to</strong> clay minerals decreases slightly with clay fraction.<br />
Experiments determined that the sum <strong>to</strong>tal of fulvoacids was minor (tab. 2). Appreciable<br />
differences in the humus st<strong>ru</strong>cture of the clay fraction were observed with the contents of<br />
the non-hydrolyzed portion of humus. For all researched soils, the quantity of the nonhydrolyzed<br />
portion varies within small limits. Other research effort (3, 9) found the amount<br />
of humus increased with particles size; for this <strong>to</strong> be t<strong>ru</strong>e, it would require an assumption<br />
that humic acids were strongly associated with the mineral fraction of soils.<br />
320
Table 2: <strong>Humus</strong> st<strong>ru</strong>cture of 5 <strong>to</strong> 1 μm particle-size fraction of locally hydromorphic soils<br />
Horizon<br />
С<br />
HA<br />
FA<br />
<strong>to</strong>tal ,<br />
% 1+2 3 ∑ HA 1+1а+2 3 ∑ FA<br />
N-G<br />
С HA<br />
С FA<br />
Meadow chernozemic super-power soil<br />
А 1 5.0 32.00 14.0 46.0 9.0 2.2 11.2 42.8 4.1<br />
АВ 4.56 37.50 15.35 52.85 7.46 1.32 8.78 38.37 6.0<br />
В 1 4.23 45.63 13.95 59.58 5.44 1.18 6.62 33.8 9.0<br />
В 2 3.16 45.25 15.51 60.76 5.38 3.16 8.54 30.7 7.1<br />
ВС 4.0 35.75 14.75 50.5 4.25 2.75 7.0 42.5 7.2<br />
Meadow gleyed power soil<br />
А 1 5.43 32.41 12.89 45.30 7.37 3.13 10.50 44.2 4.3<br />
А S 4.54 35.24 15.42 50.66 6.17 2.42 8.59 40.75 5.9<br />
АВ 5.43 39.59 11.79 51.38 3.13 2.21 5.34 43.28 9.7<br />
АВ g 4.42 33.48 13.35 46.83 6.33 2.49 8.82 44.35 5.3<br />
В g 4.09 26.65 17.11 43.76 8.31 2.69 11.0 45.24 4.0<br />
4. CONCLUSIONS<br />
The following tendencies in changes of humus st<strong>ru</strong>cture of the clay fraction of the<br />
hydromorphic soils in comparison with chernozems are carry out. A reduction of the humic<br />
acids:fulvoacids ratio and reduction of the share non-hydrolyzed part of humus are<br />
observed. In addition, for the soils studied, a substantial fraction humic acids were<br />
observed <strong>to</strong> be strongly associated with clay minerals. These tendencies increase with<br />
soils exposed <strong>to</strong> increasing durations of water saturated condition.<br />
As a whole, differences existed in the humic st<strong>ru</strong>cture associated with particle-sizes<br />
fractions ranging from of 5–1 μm and particles < 1 μm. The st<strong>ru</strong>cture of humus from<br />
particles sizes ranging from 5–1 μm was typically coupled with calcium. The content of<br />
humic acids in soils was strongly correlated <strong>to</strong> clay minerals and decreased slightly as the<br />
fraction of clay decreased. Appreciable differences in humus st<strong>ru</strong>cture were observed with<br />
respect <strong>to</strong> the content of non-hydrolyzed humus. For the 5–1 μm particle-size fraction<br />
small variations were observed in the ratio of non-hydrolyzed:<strong>to</strong>tal humus; whereas for the<br />
< 1 μm particle-size-fraction, this ratio decreased.<br />
321
REFERENCES<br />
1. Gorbunov, N. I. 1963. High disperses minerals and methods of their studying. Moscow,<br />
Publishing house of Russian Academy of Sciences, pp. 302.<br />
2. Greenland, D. J. 1965. Interaction between clays and organic compounds in soils. Part II.<br />
Adsorption of soil organic compounds and its effect on soil properties. Soils a. Fertilizers 28<br />
(6).<br />
3. Khan, D. V. 1959. The st<strong>ru</strong>cture of humus substances and their connection with a mineral part<br />
of the soil. Eurasian Soil Sci. J. 1, 10-18.<br />
4. Kocherina, E. I. 1954. Some chemical and physical properties of mechanical fractions of sod<br />
podzolic soil. Eurasian Soil Sci. J. 12, 53-71.<br />
5. Nazarenko, O. G. 1990. The colloid-chemical nature of the soil absorbing complex in mocharic<br />
soils of the Eastern Donbass. Thesis on a competition of Cand. Biol. Sci. Degree, Moscow, pp.<br />
154.<br />
6. Ponomareva, V. V., Plotnikova, T. A. 1975. The definition of group and fractional st<strong>ru</strong>cture of<br />
soil humus according <strong>to</strong> the scheme N.V.Tyurin. In: Ponomarevoj, V. V., Plotnikovoj, T. A.<br />
(Eds.): The Agrochemical Methods of Soil Research. Moscow: Publishing House «Science»,<br />
pp. 47-55.<br />
7. Ti<strong>to</strong>va, N. A. et al. 1989. The composition of high disperses particles components of the tillable<br />
sod podzolic soil. Eurasian Soil Sci. J. 6, 89-97.<br />
8. Travnikova, L. S., Ti<strong>to</strong>va, N. A. 1978. The composition and distribution of clay minerals on < 5<br />
μm fractions in soil solonetzic complex of Kalmykia // Eurasian Soil Sci. J. 4, 74-86.<br />
9. Trofimenko, K. I., Kizyakov, U. E. 1967. The organic matter of separated particle-size fractions<br />
of the basic types of soils of the Ciscaucasia. Eurasian Soil Sci. J. 2, 82-90.<br />
322
Properties of Humic Acids in Forest Soils: Influence of Different Plant<br />
Covering<br />
Andreina Traversa 1 , Daniel Said-Pullicino 2 , Valeria D’Orazio 1 , Giovanni Gigliotti 2 ,<br />
Nicola Senesi 1<br />
1 Dipartimen<strong>to</strong> di Biologia e Chimica Agroforestale e Ambientale, Università di Bari, Italy,<br />
traversa.andreina@agr.uniba.it<br />
2 Dipartimen<strong>to</strong> di Scienze Agrarie e Ambientali, Università di Pe<strong>ru</strong>gia, Italy<br />
Keywords: Forest litter, humic acids, infrared spectroscopy, lignin-derived phenols<br />
1. INTRODUCTION<br />
The chemical composition and morphology of plant litter is among the main fac<strong>to</strong>rs<br />
that affect the dynamics and properties of organic matter in forest soils (1). In particular,<br />
the transformations of the humic acid (HA) fraction with depth generally show a<br />
progressive loss of carbohydrates and, <strong>to</strong> a lesser extent, of lignin, and an increase of<br />
carboxylic functional groups. Lignin is considered a relatively recalcitrant biopolymer (2)<br />
and a precursor of more complex compounds such as humic substances (3). The use of<br />
soil biomarkers such as lignin-derived phenols could improve our understanding of how<br />
plant residues are transformed in<strong>to</strong> stabilized soil organic matter.<br />
This work aims <strong>to</strong> evaluate the influence of different plant covering on soil HA<br />
properties in temperate forest floor layers.<br />
2. MATERIALS AND METHODS<br />
Forest litters and soil surface layers (0-2, 2-5 and 5-20 cm) were sampled from four<br />
forested sites of the “Bosco delle Pianelle”, (Taran<strong>to</strong>, Southern Italy), which is<br />
characterized by the presence of the following species: (i) Quercus ilex L. (L); (ii) Carpinus<br />
betulus L. and Carpinus orientalis Miller (CC); (iii) Pinus halepensis Miller (P); (iv) Quercus<br />
trojana Webb. and Quercus ilex L. (FL).<br />
The HAs were isolated from litters (humic acid-like, HAL) and soil samples (HA)<br />
according <strong>to</strong> the procedure suggested by the IHSS (4) and characterized by elemental<br />
analysis, ratio of absorbances at 465 and 665 nm (E 4 /E 6 ), carboxylic group content<br />
(calcium acetate method) and Fourier transform infrared (FT IR) spectroscopy. The<br />
contents of lignin- derived phenols and their degree of oxidation in the bulk samples and<br />
HA fractions were estimated using alkaline CuO oxidation followed by GC-FID<br />
quantification (5, 6).<br />
323
3. RESULTS AND DISCUSSION<br />
Elemental analysis (data not shown) shows significant similarities between the<br />
composition of organic matter in the bulk soil samples and the corresponding HAs,<br />
suggesting that the composition of HAs is related <strong>to</strong> that of the plant debris from which<br />
they originate. The C/N ratio decreases with soil depth, whereas the C/H ratio tends <strong>to</strong><br />
increase with depth for both bulk soil samples and HAs.<br />
Table 1. Chemical characteristics of forest floor layers<br />
and their respective humic acid fractions<br />
Site / Horizon<br />
Bulk litter and bulk<br />
soil samples<br />
Humic acids<br />
VSC S/V (ac:al) v VSC S/V (ac:al) v E 4 /E 6 COOH<br />
Quercus ilex forest (L)<br />
Litter layer 48.32 1.28 0.19 28.98 1.41 0.44 8.2 2.87<br />
0 – 2 cm 32.63 0.90 0.25 25.94 1.40 0.47 6.9 2.88<br />
2 – 5 cm 23.43 0.67 0.37 19.40 0.90 0.57 5.8 3.55<br />
5 – 20 cm 11.78 0.90 0.32 4.95 0.67 0.60 5.0 3.98<br />
Carpinus betulus and Carpinus orientalis forest (CC)<br />
Litter layer 67.54 1.27 0.24 26.71 1.52 0.33 8.3 2.98<br />
0 – 2 cm 14.21 0.96 0.23 12.10 1.19 0.63 5.2 3.63<br />
2 – 5 cm 10.03 0.84 0.32 7.79 0.97 0.72 5.0 4.12<br />
5 – 20 cm 5.24 0.66 0.32 4.85 0.81 0.69 5.0 4.12<br />
Pinus halepensis forest (P)<br />
Litter layer 37.37 0.08 0.20 40.44 0.10 0.36 11.0 2.88<br />
0 – 2 cm 27.68 0.15 0.27 31.97 0.15 0.44 7.2 3.42<br />
2 – 5 cm 31.05 0.23 0.33 19.33 0.28 0.52 6.5 3.30<br />
5 – 20 cm 20.56 0.35 0.24 17.07 0.40 0.54 6.0 3.48<br />
Quercus trojana and Quercus ilex forest (FL)<br />
Litter layer 72.22 0.68 0.23 33.48 0.93 0.34 8.0 2.66<br />
0 – 2 cm 34.74 0.64 0.30 39.50 0.75 0.78 6.5 3.46<br />
2 – 5 cm 31.33 0.59 0.34 21.17 0.70 0.66 7.1 3.12<br />
5 – 20 cm 24.66 0.55 0.36 18.32 0.70 0.68 6.8 3.30<br />
The sum of the C-normalised yields of the major lignin-derived phenols (VSC, vanillyl,<br />
syringyl and cinnamyl phenols; Table 1) decreases with depth for bulk samples as well as<br />
for HAs in all soil profiles, indicative of extensive degradation of lignin derived from plant<br />
debris in the litter layers. As expected, all soil profiles are characterised by low values for<br />
the ratio of cinnamyl <strong>to</strong> vanillyl phenols (C/V; data not shown), typical of forest floor layers<br />
under woody coverage. The ratios of syringyl <strong>to</strong> vanillyl phenols (S/V; Table 1) are higher<br />
324
for soil profiles under angiosperm plant coverage (L, CC, FL) with respect <strong>to</strong> those from<br />
the coniferous forest (P). The similarity in S/V values obtained for bulk litter and soil<br />
samples, and their corresponding HAs (r = 0.94) confirms the direct influence that plant<br />
coverage exerts on the HAs composition. With the exception of samples from the<br />
coniferous P series, the S/V ratio tends <strong>to</strong> decrease with depth for both bulk soil and HA<br />
fractions, which indicates the occurrence of lignin degradation. During the degradation of<br />
lignin by white-rot fungi, syringyl units are preferentially degraded over vanillyl st<strong>ru</strong>ctures,<br />
resulting in the lowering of the S/V ratio (7). The ratio of vanillic acid <strong>to</strong> vanillin, (ac:al) v<br />
increases with depth for both the bulk soil samples and their corresponding HAs (Table 1).<br />
In particular, the HAs yielded consistently more acidic phenols than the bulk soil samples,<br />
which reflects a degree of microbial alteration of the residual lignin. This result, <strong>to</strong>gether<br />
with the observed enhancement of carboxylic groups with depth (Table 1), suggests an<br />
increase of the degree of oxidation along the soil profile. Moreover, the decrease of the<br />
E 4 /E 6 ratio (Table 1) and the increase of the C/H ratio (data not shown) with depth suggest<br />
the increase of aromaticity and degree of polycondensation of the HAs possibly due <strong>to</strong> the<br />
microbial degradation of more labile constituents.<br />
The FT IR spectra of HAL (Figure 1) feature common bands with different relative<br />
intensities. The HAL samples from the L, CC and FL series also show typical bands<br />
attributable <strong>to</strong> syringil and vanillyl rings of lignin-derived phenols (1152 and 1126 cm -1 ),<br />
Transmittance %<br />
L<br />
L1<br />
L2<br />
L3<br />
L series<br />
L<br />
L1<br />
L<br />
2L<br />
3<br />
CC series<br />
Transmittance %<br />
L<br />
L1<br />
L2<br />
L3<br />
P<br />
L<br />
L1<br />
L2<br />
L3<br />
FL series<br />
Wavenumbers (cm -1 ) 400<br />
Wavenumbers (cm -1 )<br />
4000 400<br />
Figure 1. FT-IR spectra of HAL (L) and Has (L1= 0-2, L2= 2-5, L3= 5-20 cm) series.<br />
325
whereas the HAL from the P series exhibits only the band typical of vanillyl phenols, which<br />
is possibly due <strong>to</strong> the small quantity of syringil units in the gymnosperm lignin. With depth,<br />
all HAs exhibit a decrease of aliphatic components (2922 and 2852 cm -1 ), a slight<br />
decrease of phenols (1418 cm -1 ), a sharp decrease of polysaccharides (1078 and 1040<br />
cm -1 ), and an increase of carboxylic groups (1235 cm -1 ), which are especially evident in<br />
the L and CC series. Moreover, the FT IR spectra of HAs isolated from the deepest soil<br />
layers appear <strong>to</strong> be very similar one <strong>to</strong> another, irrespective of the plant debris from which<br />
they derive.<br />
4. CONCLUSIONS<br />
The properties of the litter originating from different plant covering appear <strong>to</strong> influence<br />
directly the chemical composition of HAs in the underlying soils. Lignin appears <strong>to</strong> be<br />
present in the HA in st<strong>ru</strong>ctural units similar <strong>to</strong> those found in plant debris from the overlying<br />
organic layers. Furthermore, the lignin composition is reminiscent of the lignin signature<br />
obtained for the plant covering, appearing relatively intact but somewhat oxidised. The<br />
HAs isolated from the deeper soil horizons, which have been subjected <strong>to</strong> more intensive<br />
diagenetic modifications, tend <strong>to</strong> be highly homogenous and relatively deprived of the<br />
more labile constituents such as polysaccharides. Finally, the lower aromatic<br />
polycondensation and oxidation degree of the HAs from the P and FL series, with respect<br />
<strong>to</strong> those from L and CC series, would indicate a partial incorporation of lignin-derived<br />
products in<strong>to</strong> native soils HAs.<br />
REFERENCES<br />
1. Gonet, S.S., Debska, B., Dziamski, A. 2006. Proceedings of the 13th Meeting of IHSS 45-II,<br />
493-496.<br />
2. Kögel-Knabner, I. 1993. Soil Biochemistry 8, 101-137.<br />
3. Simpson, A.J., Kingery, W.L., Hatcher, P.G. 2003. Environmental Science and Technology 37,<br />
337-342.<br />
4. Swift, R.S.1996. In: Sparks, D.L., Page, A.L., Helmke, P.A., Loeppert, R.H., Soltanpour, P.N.,<br />
Tabatabai, M.A., Johns<strong>to</strong>n, C.T., Sumner, M.E. (Eds.), Methods of Soil Analysis: Part 3.<br />
Chemical Methods. SSSA Book Series No. 5, ASA and SSSA , Madison, WI, pp. 1011-1069.<br />
5. Hedges, J.I., Ertel, J.R. 1982. Analytical Chemistry 54, 174-178.<br />
6. Amelung, W., Flach, K.W., Zech, W. 1999. Soil Science Society of America Journal 63, 1222-<br />
1228.<br />
7. Ziegler , F., Kögel, I., Zech, W. 1986. Z. Pflanz. Bodenkunde 149, 323-331.<br />
326
Fluorescence Spectroscopy of Humic Acids Isolated from Different<br />
Litters and Corresponding Underlying Soils<br />
Andreina Traversa, Valeria D’Orazio, Nicola Senesi<br />
Dipartimen<strong>to</strong> di Biologia e Chimica Agroforestale e Ambientale, Università di Bari, Italy,<br />
traversa.andreina@agr.uniba.it<br />
Keywords: Forest litter, humic acids, fluorescence spectroscopy<br />
1. INTRODUCTION<br />
Humic acids (HAs) represent an important fraction of soil organic matter, and are<br />
characterized by a wide chemical and st<strong>ru</strong>ctural complexity that is yet not well-known. In<br />
the last decades numerous studies have been carried out using fluorescence<br />
spectroscopy <strong>to</strong> characterize humic substances also in relation <strong>to</strong> their origin (1).<br />
Obviously, a series of fac<strong>to</strong>rs such as the occurrence of aromatic units and extended<br />
electron π systems, heteroa<strong>to</strong>m substitution, type and number of substituent groups on the<br />
aromatic rings, etc., are affecting fluorescence properties of these macromolecules.<br />
Therefore, the fluorescence behaviour of humic substances depends on their various<br />
st<strong>ru</strong>ctural components, and each fluorescence spect<strong>ru</strong>m is due <strong>to</strong> the contribution of<br />
several individual fluorophores present in the molecule.<br />
The aim of this paper was <strong>to</strong> investigate by means of fluorescence spectroscopy the<br />
properties of HAs isolated from various forest litters and the corresponding underlying soils<br />
as affected by different covering plants.<br />
2. MATERIALS AND METHODS<br />
Forest litters and the corresponding soil surface layers at three different depths (0-2<br />
cm, s1; 2-5 cm, s2; and 5-20 cm, s3) were sampled in the “Bosco delle Pianelle”, Taran<strong>to</strong><br />
province, Southern Italy, under four different covering species: (a) Quercus ilex L. (L); (b)<br />
Carpinus betulus L. and Carpinus orientalis Miller (CC); (c) Pinus halepensis Miller (P); (d)<br />
Quercus trojana Webb. and Quercus ilex L. (FL). The HAs were isolated from litters (humic<br />
acid-like, HAL) and soil samples (HA) according <strong>to</strong> the procedure suggested by the IHSS<br />
(2). Fluorescence spectra were recorded on aqueous solutions of HALs and HAs, at a<br />
concentration of 100 mg L -1 , equilibrated overnight at room temperature, and adjusted <strong>to</strong><br />
pH 8 with NaOH, by using a Perkin-Elmer (Norwalk, CT) LS 55 luminescence<br />
spectropho<strong>to</strong>meter equipped with the WinLab 4.00.02 software for data processing.<br />
327
Emission spectra were recorded over the range 380–600 nm (λ exc fixed at 360 nm);<br />
excitation spectra were recorded over the range 300–500 nm (λ em fixed at 520 nm); and<br />
synchronous-scan excitation spectra were measured by scanning simultaneously both the<br />
excitation and the emission wavelengths (from 300 <strong>to</strong> 550 nm), while maintaining a<br />
constant, optimized wavelength difference Δλ (λ em – λ exc ) = 18 nm. Total luminescence<br />
spectra, in the form of excitation-emission matrices (EEMs, con<strong>to</strong>ur maps), were recorded<br />
over the emission wavelength range from 300 <strong>to</strong> 600 nm, increasing sequentially by 5 mm<br />
steps the excitation wavelength from 250 <strong>to</strong> 500 nm. The EEM plots were generated as<br />
con<strong>to</strong>ur maps from spectral data by using Surfer 8.0 software (Golden Software, Inc.,<br />
2002, Golden, CO).<br />
3. RESULTS AND DISCUSSION<br />
18<br />
509<br />
506<br />
L<br />
CC 509<br />
398 441<br />
507<br />
440 P<br />
329<br />
FL<br />
331<br />
0<br />
300 Wavelengths (nm) 550<br />
42 480<br />
Ls-HAs<br />
38 500<br />
CCs-HAs<br />
500<br />
500<br />
RFI<br />
RFI<br />
HAL<br />
476<br />
s2<br />
s3<br />
s1<br />
0<br />
300 Wavelengths (nm) 550<br />
38 47<br />
Ps-HAs<br />
48<br />
RFI<br />
47<br />
0<br />
30 Wavelengths (nm) 55<br />
s3<br />
s2<br />
s<br />
443<br />
444<br />
47 s3<br />
s2<br />
s1<br />
0<br />
300 550<br />
35 48<br />
FLs-<br />
479<br />
477 s3<br />
s2<br />
s1<br />
0<br />
300 550<br />
Figure 1. Synchronous-scan fluorescence spectra of HALs and HAs.<br />
328
Synchronous-scan fluorescence spectra of HALs (Figure 1) are characterized by a<br />
main peak at longer wavelengths (about 509 nm) and a shoulder at shorter wavelengths<br />
(about 440 nm). Additional shoulders appear at about 330 nm for P-HAL and FL-HAL and<br />
at 398 nm for P-HAL. In all HALs the relative fluorescence intensity (RFI) values are<br />
similar each <strong>to</strong> the other, and are slightly lower in P- HAL and FL-HAL. Synchronous-scan<br />
fluorescence spectra of HAs show a main peak in the range from 476 <strong>to</strong> 500 nm (Figure<br />
1), with the maximum slightly shifting <strong>to</strong>wards longer wavelengths with increasing depth.<br />
Further, RFI values show a consistent increase with depth, with the exception of L-HAs2,<br />
which is characterized by a RFI value greater than that of L-HAs3. Emission fluorescence<br />
spectra of HALs and HAs (not shown) feature a unique broad band having the maximum in<br />
the range, respectively, between 454 and 476 nm, and 484 and 520 nm. Excitation<br />
fluorescence spectra of HALs (not shown) show a simple pattern, with a peak at about 439<br />
nm and a shoulder at about 398 nm, whereas the HAs excitation spectra exhibit a peak<br />
between 441 and 456 nm.<br />
L<br />
E x /E m 375/476<br />
E x /E m 440/521 E x /E m 350/463<br />
E x /E m 395/472<br />
CC<br />
P<br />
FL<br />
E x /E m 350/457<br />
E x /E m 405/500<br />
E x /E m 435/510<br />
E x /E m 450/521<br />
E x /E m 440/518<br />
E x /E m 435/514<br />
Ls1<br />
CCs1<br />
Ps1<br />
FLs1<br />
E x /E m 445/522 E x /E m 455/527<br />
E x /E m 445/522<br />
E x /E m 440/519<br />
Ls2<br />
CCs2<br />
Ps2<br />
FLs2<br />
E x /E m 460/521 E x /E m 455/525<br />
E x /E m 445/521<br />
E x /E m 445/519<br />
Ls3<br />
CCs3<br />
Ps3<br />
FLs3<br />
Ex<br />
Em<br />
Figure 2. Total Luminescence spectra of HALs and HAs.<br />
329
The EEM spectra of HALs (Figure 2) from L and CC litters are characterized by the<br />
occurrence of a main peak centered at an excitation/emission wavelength pair (EEWP)<br />
of375-395 ex /472-476 em , which suggests the occurrence of similar fluorophores, probably<br />
st<strong>ru</strong>ctural components like esculetin and/or scopoletin. Further, the EEM spectra of CC-<br />
HAL shows an additional main peak at an EEWP of 440 ex /521 em , ascribed <strong>to</strong> conjugated<br />
chinons and phenols with a high polycondensation degree.<br />
The EEMs spectra of P-HAL and FL-HAL are characterized by numerous fluorescent<br />
units with EEWPs in the short and medium wavelength regions. The highest RFI values for<br />
both HALs are associated with the peak at about 350 ex /457-463 em , likely due <strong>to</strong> st<strong>ru</strong>ctural<br />
methoxy-coumarins, and/or hydroxyquinolines (3).<br />
The EEMs spectra of HAs (Figure 2) show a common peak at an EEWP 435-<br />
460 ex /510-527 em , which may be associated with the occurrence of aromatic units at a high<br />
polycondensation degree. All HAs show, with increasing depth, a shift of EEWPs <strong>to</strong>wards<br />
longer wavelengths and an increase of the corresponding RFI values (except sample HA-<br />
Ls2).<br />
4. CONCLUSIONS<br />
In general, the fluorescent properties of HALs indicate the occurrence of simple<br />
st<strong>ru</strong>ctural moieties, with slight differences due both <strong>to</strong> the parent litter and <strong>to</strong> its<br />
degradation. In particular, P- and FL-HAL would suggest a greater litter decomposition<br />
with respect <strong>to</strong> L- and CC-HAL samples.<br />
The comparative analysis of HAs from the various series shows the occurrence of<br />
smaller st<strong>ru</strong>ctural components in the HAs from the s1 layers, which suggests the<br />
incorporation of litter degradation products in<strong>to</strong> native soil HAs, especially in the P- and<br />
FL-HAs1. The HAs from the subsurface and deepest layers show an increasing<br />
humification degree with depth, likely related <strong>to</strong> a different mobility and/or adsorption of<br />
organic colloids on the mineral phase.<br />
REFERENCES<br />
1. Senesi, N., Miano, T.M., Provenzano, M.R., B<strong>ru</strong>netti, G. 1991. Soil Science 152, 259-271.<br />
2. Swift, R.S. 1996. In: Sparks, D.L., Page, A.L., Helmke, P.A., Loeppert, R.H., Soltanpour, P.N.,<br />
Tabatabai, M.A., Johns<strong>to</strong>n, C.T., Sumner, M.E. (Eds.), Methods of Soil Analysis: Part 3.<br />
Chemical Methods. SSSA Book Series No. 5, ASA and SSSA , Madison, WI, pp. 1011-1069.<br />
3. Wolfbeis O. S. 1985. In: <strong>Molecular</strong> Luminescence Spectroscopy Part I: Methods and<br />
Applications. Schulman, S.G. (Ed.), Wiley, New York, pp. 167-370.<br />
330
In Situ Humification and Humics Preservation in Phosphatic Pellets,<br />
under Sulfate Reducing Conditions<br />
Jean Trichet, Aïda Ben Hassen-Trabelsi<br />
Université d'Orléans, Institut des Sciences de la Terre, 45067 Orléans Cedex 2, France,<br />
jgtrichet@tele2.fr<br />
Keywords: phosphatic pellets, phy<strong>to</strong>plank<strong>to</strong>n-derived humics, sulfate reduction, physical<br />
preservation of humus<br />
INTRODUCTION AND RATIONALE<br />
The phosphate-bearing particles in the Ypresian phosphatic ore of Ras-Draâ,<br />
Tunisia, dated ca. 50 My, are rounded grains, some hundreds of micrometers in mean<br />
diameter, called «pellets» by petrographers. These pellets are embedded in a<br />
sedimentary, more or less carbonated, shaly matrix. The pellets studied in this ore<br />
contained between 28.4 and 38.3 % of P 2 O 5 and between 0.3 and 1.6 % of TOC.<br />
Surprisingly – with regards <strong>to</strong> the age of the pellets – their organic matter is very rich in<br />
extractable (NaOH N/10) humics, namely up <strong>to</strong> 75.6 % of humic C (% of TOC, in C V<br />
layer).<br />
Surprisingly also – with regards <strong>to</strong> this data – the organic matter present in the matrix<br />
of the pellets is by far not as rich in humic compounds as are the pellets (up <strong>to</strong> 21.4 % of<br />
matricial humic C, % of TOC in C V layer). The composition of the organic matter of the<br />
matrix is quite usual for a 50 My old, epicontinental, never buried (over a maximum of 200-<br />
250 m depth), sedimentary layer. It is a low-rank kerogen. Pellets appear therefore as<br />
chemically singular bodies, whose diagenetic s<strong>to</strong>ry has been quite different, and<br />
independent, of that of their embedding matricial sediment.<br />
These bodies have been demonstrated <strong>to</strong> have derived from fish feces (1).<br />
INTERPRETATIONS AND CONCLUSIONS<br />
The humification of the pellets organic matter and the remarkable preservation of the<br />
resulting humics, during 50 My, address the following questions and lead <strong>to</strong> the following<br />
answers:<br />
1 – The origin of the organic matter is marine plank<strong>to</strong>nic, as deduced from elemental<br />
analysis, Rock-Eval pyrolysis and pho<strong>to</strong>nic microscopy. This organic matter has been<br />
ingested as food by planktivorous fishes.<br />
2 – The early diagenesis of the organic matter excreted by fishes was carried in<br />
sulfate-reducing conditions, as shown by the following data: (1) Humic acids contain large<br />
331
amounts of organic sulfur, up <strong>to</strong> 14%, by weight (2) if the gas chroma<strong>to</strong>graphic spectra of<br />
n-alkanes and iso-alkanes in the pellets witness generally <strong>to</strong> mixed phy<strong>to</strong>plank<strong>to</strong>nic and<br />
microbial sources for the organic matter, they can also display a purely microbial<br />
spect<strong>ru</strong>m, suggesting that the original phy<strong>to</strong>plank<strong>to</strong>nic constituents were decomposed by<br />
bacteria, inside the pellets. Conversely, the alkanes present in the matrix sediments<br />
surrounding the pellets are typically phy<strong>to</strong>plank<strong>to</strong>nic in origin.<br />
The humic constituents present in the pellets can therefore be considered as the<br />
microbially oxidized counterpart of the reduced SO 4 -S.<br />
3 – How could these humics be preserved as such during 50My?<br />
They owed their preservation <strong>to</strong> the early physical properties prevailing in the pellets<br />
(1) as early as their egestion by the fish, the feces are embedded in a phosphatized<br />
external membrane which protects them from tearing during their transfer through the<br />
water column and during their reworking by bot<strong>to</strong>m currents (2) the growth of denselypacked<br />
apatite crystals inside the pellets - P being issued from the non-digested fish<br />
bones ingested by carnivorous fishes, last in food chains – develops pressure forces on<br />
the organic particles inside the pellets and isolates these particles from any circulating fluid<br />
This pressure can be observed when dissolving the apatite crystals with diluted Hcl. The<br />
humic particles expand suddenly when the frame of the apatite crystals disappears. This<br />
can be easily observed under the binocular lens.<br />
Finally, the transformations underwent by the phy<strong>to</strong>plank<strong>to</strong>nic-derived excreted<br />
organic matter in the fecal pellets of carnivorous fishes are early oxidation reactions which<br />
transform the organic matter present in the pellets in<strong>to</strong> humics. The abundance of S in the<br />
organic matter and the easy Maillard reactions between abundant carbohydrates and<br />
amino compounds were both favorable <strong>to</strong> the stabilization of these humics. In the absence<br />
of heat input and of fluid circulation at their contact, the humic particles were protected<br />
from any further diagenesis and evolution.<br />
The presence of humics was already acknowledged in Australian phosphorites<br />
pellets dated 510 My (Cambrian), by Mark Sandstrom (2).<br />
REFERENCES<br />
1. Ben Hassen, A. 2007. Données nouvelles sur la matière organique associée aux séries du<br />
bassin phosphaté du sud-tunisien (Gisement de Ras-Draâ) et sur la phospha<strong>to</strong>genèse.<br />
Thesis, The University of Orléans, France.<br />
2. Sandstrom, M.W. 1982. Organic Geochemistry of Phosphorites and Associated Sediments.<br />
PhD Thesis. Australian National University, Canberra, Australia.<br />
332
Comparison of 13 C NMR Spectra of Fulvic Acids from Neighboring Two<br />
Clear Water Lakes in Japan<br />
Kumiko Tsuda 1 , Suzuka Aso 2 , Hiroki Kodama 3 , Koyo Yonebayashi 4 , Nobuhide Fujitake 2<br />
1 Graduate School of Science and Technology, Kobe University, Rokkodai 1, Kobe 657-8501,<br />
Japan, 043d861n@stu.kobe-u.ac.jp<br />
2 Graduate School of Agricultural Science, Kobe University, Rokkodai 1, Kobe 657-8501, Japan<br />
3 Analytical Research Center for Experimental Science, Saga University, Honjo 1, Saga 840-8502,<br />
Japan<br />
4 Department of Environmental Science, Ishikawa Prefectural University, Nonoichi, Ishikawa 921-<br />
8836, Japan<br />
Keywords: fulvic acid (FA), clear water, Lake Biwa, Lake Tankai, liquid-state 13 C NMR<br />
1. INTRODUCTION<br />
Most of rivers and lakes in Japan are clear waters that exhibit low concentrations of<br />
fulvic acids (FAs) (1). FAs complex or sorb major cations, trace metals, trace anions, and<br />
hydrophobic pollutants, and thereby change both bioavailability and geochemical cycling of<br />
these substances (2). Therefore, it is important <strong>to</strong> reveal chemical properties of FAs for<br />
understanding the above functions even if their concentrations are low. One of the most<br />
promising techniques for analyzing chemical properties of FAs is 13 C NMR spectroscopy<br />
(3). There are however, few studies on 13 C NMR spectral properties of FAs in clear waters<br />
because it is difficult <strong>to</strong> collect the sufficient amounts of FA samples from clear waters.<br />
Recently, we made up a large-scale preparative isolation apparatus of aquatic FAs (4).<br />
In this study, we collected FAs from neighboring two clear water lakes in<br />
Japan―Lake Biwa and Lake Tankai, using our isolation apparatus, and compared their<br />
13 C NMR spectra. Additionally, the spectral variations of FAs from these waters in different<br />
seasons were investigated.<br />
2. MATERIALS AND METHODS<br />
Lake Biwa is the largest lake in Japan; the area is 670.25 km 2 and the maximum<br />
water depth is 104 m. Lake Tankai is a small lake nearby Lake Biwa; the area is 0.12 km 2<br />
and the maximum water depth is 20 m. Lake Biwa is more affected by human activities<br />
than Lake Tankai. FA samples were collected in spring, summer, autumn and winter.<br />
These samples are named BiwaSpr, BiwaAut, BiwaWin, TankaiSpr, TankaiSum,<br />
TankaiAut and TankaiWin. Biwa Sum could not be collected for some technical failure.<br />
333
The FA samples were isolated and purified by the DAX-8 procedure (5) with a largescale<br />
preparative isolation apparatus (4). Liquid-state 13 C NMR spectra were recorded at<br />
125.77 MHz on a B<strong>ru</strong>ker Avance 500 spectrometer.<br />
3. RESULTS AND DISCUSSION<br />
Some chemical properties of FAs from both lakes are listed in Table 1. 13 C NMR<br />
spectra of FAs from the two clear water lakes are shown in Fig. 1. All of spectra exhibited<br />
major broad peaks assigned from Alkyl and a part of O-Alkyl carbons in ranging from 10 <strong>to</strong><br />
66 ppm. The spectra of BiwaSpr exhibited many distinct signals overlapping with the broad<br />
peaks. Intensities of the distinct signals in the BiwaSpr were stronger than those in the<br />
BiwaAut. Those signals were not observed in the BiwaWin. No distinct signals in the Lake<br />
Tankai FAs, which were collected from nearby Lake Biwa and are less affected by human<br />
activities, were also observed. The appearances of the aliphatic signals would be<br />
attributed <strong>to</strong> seasonal and/or regional phenomena. In early spring, more anthropogenic<br />
compounds such as nitrogen or phosphate fertilizers flow in<strong>to</strong> Lake Biwa that might<br />
stimulate the growth of lake algae. Therefore, algal metabolites or detritus may influence<br />
on such phenomena.<br />
Carbon species distributions of the FAs (6, 7) are listed in Table 2. Aromaticity was<br />
calculated by the expressing of the amount of Aryl-+O-Aryl-C (110-165 ppm) as<br />
percentage of Alkyl-+O-Alkyl-+Aryl+O-Aryl-C (5-165 ppm) (8).<br />
Table 1. Elemental composition, Mw and E 600 * of FAs from the two clear water lakes<br />
Weight %<br />
A<strong>to</strong>mic ratios<br />
Name on ash-free basis<br />
(HPSEC)MW E 600 *<br />
C H N O H/C O/H O/C N/C<br />
BiwaSpr 55.4 6.42 1.79 36.4 1.39 0.35 0.49 0.03 929 0.52<br />
BiwaSum**<br />
BiwaAut 56.1 6.06 2.31 35.5 1.29 0.37 0.47 0.04 884 0.71<br />
BiwaWin 58.9 6.15 1.54 33.5 1.25 0.34 0.43 0.02 1043 1.44<br />
TankaiSpr 55.2 5.22 0.84 38.7 1.14 0.46 0.53 0.01 874 0.91<br />
TankaiSum 53.0 5.09 1.31 40.6 1.15 0.50 0.57 0.02 983 1.18<br />
TankaiAut 55.0 5.34 1.07 38.6 1.17 0.45 0.53 0.02 920 1.36<br />
TankaiWin 53.9 4.98 0.86 40.3 1.11 0.51 0.56 0.01 924 1.29<br />
* Absorbance of 1% solution at 600 nm<br />
**Not collected<br />
334
Figure 1. Liquid-state 13 C NMR spectra of FAs from the two clear water lakes.<br />
Name<br />
Table 2. Carbon species distribution of FAs from two clear water lakes<br />
% of carbon species (δ, ppm)<br />
(5-33) (33-54) (54-66) (66-110) (110-145) (145-165) 165-190 190-230<br />
Alkyl-C(1) Alkyl-C(2) O-Alkyl-C O-Alkyl-C Aryl-C O-Aryl-C COO-C CO-C<br />
BiwaSpr 24.8 27.1 5.3 11.3 10.3 2.3 14.5 4.4 0.16<br />
BiwaSum**<br />
BiwaAut 22.9 21.9 5.9 12.2 13.9 3.2 14.4 5.6 0.21<br />
BiwaWin 26.4 21.7 4.8 9.6 15.9 2.1 15.6 3.9 0.22<br />
TankaiSpr 17.6 16.4 4.4 13.6 22.8 5.2 16.6 3.4 0.35<br />
TankaiSum 23.0 18.7 4.8 13.5 18.5 4.4 14.9 2.2 0.28<br />
TankaiAut 26.0 15.7 2.0 10.6 18.5 3.1 17.1 7.0 0.28<br />
TankaiWin 19.5 19.1 4.8 10.9 20.5 3.6 17.6 4.0 0.31<br />
* Not collected<br />
**Aromaticity<br />
AR*<br />
335
Alkyl-C (1), (2) proportions in the Lake Biwa FAs were much higher than those in the<br />
Lake Tankai FAs. On the other hand, Aryl-C proportions in the Lake Biwa FAs were lower<br />
than those in the Lake Tankai FAs. The BiwaSpr exhibited the lowest aromaticity (0.16)<br />
whereas the TankaiSpr exhibited the highest aromaticity (0.35). These results suggest that<br />
the Lake Biwa FAs would be derived mainly from microbial biomass whereas the Lake<br />
Tankai FAs would be derived mainly from degradation of plant material and leaching of soil<br />
(9), and these derivatives reach the largest amount in spring.<br />
4. CONCLUSIONS<br />
There were distinct dissimilarities between 13 C NMR spectral properties of FAs from<br />
the two clear water lakes. Lake Tankai FAs were more aromatic than Lake Biwa FAs.<br />
Seasonal changes of the spectral properties of Lake Biwa FAs were more remarkable than<br />
those of Lake Tankai FAs. As shown by intensities of distinct signals in the spectra<br />
(BiwaSpr > BiwaAut >> BiwaWin, Lake Tankai FAs), these changes would be attributed <strong>to</strong><br />
seasonal and/or regional phenomena.<br />
ACKNOWLEDGEMENTS<br />
This work was supported by a Grant-in-Aid for Scientific Research (B-16380049,<br />
2004-2007), and partially supported by the fund of Department of Lake Biwa Environment,<br />
Shiga Prefecture, Japan.<br />
REFERENCES<br />
1. Thurman, E.M. 1985. In: Organic geochemistry of natural waters, Martius Nijhoff / Dr. W. Junk<br />
Publishers, Dordrecht, pp. 273-354.<br />
2. Steinberg, C., Muenster, U. 1985. In: Humic substances in soil, sediment, and water:<br />
geochemistry, isolation and characterization, G.R. Aiken, et al. (Eds), Wiley, New York, pp.<br />
105-145.<br />
3. Pres<strong>to</strong>n, C.M. 1996. Soil Sci. 161, 144-166.<br />
4. Yonebayashi, K., Kodama, H. 2000. In: Proceedings 12th International meeting of IHSS. pp.<br />
1225-1228.<br />
5. Thurman, E.M., Malcolm, R.L. 1981. Environ. Sci. Technol. 15, 463-466.<br />
6. Wilson, M.A. 1980. J. Soil. Sci. 32, 167-186.<br />
7. Fujitake, N., Kawahigashi, M. 1999. Soil Sci. Plant Nutr. 45, 359-366.<br />
8. Hatcher, P.G., Schnizer, M., Dennis, L.W., Maciel, G.E. 1981. Soil Sci. Soc. Ame. J. 45, 1089-<br />
1094.<br />
9. McKnight, D.M., Andrews, E.D., Aiken, G.R., Spaulding, S.A. 1994. Limnol. Oceanogr. 39,<br />
1972-1979.<br />
336
Correlation between Optical and Chemical Properties of DNOM<br />
Rolf D. Vogt and Egil T. Gjessing<br />
Dept. of Chemistry, University of Oslo, POB 1033 Blindern, 0315 Oslo, Norway,<br />
rolf.vogt@kjemi.uio.no<br />
Keywords: proxies, DNOM characteristics, spectroscopic measurements<br />
1. INTRODUCTION<br />
Dissolved natural organic matter (DNOM) governs important processes in the<br />
environment. These processes need <strong>to</strong> be unders<strong>to</strong>od and accounted for in order <strong>to</strong><br />
predict effects of anthropogenic pressure on the environmental. The main challenges<br />
dealing with humic substances (HS) is its heterogeneous nature and the spatial and<br />
temporal variation in its physiochemical characteristics. The heterogeneity makes sound<br />
determination of the properties of HS a time consuming and tedious act.<br />
Scientists have dealt with this by developing a number of simple proxies based on<br />
radiation adsorption, in the UV, Visible and IR range, and Fluorescence; e.g. UV<br />
Absorption at λ254, sUVa, SAR, RkSF, SFE, Humification Index, and Fluorescence peak<br />
ratios etc. These surrogates are readily used <strong>to</strong> provide information about the quality and<br />
amount of the DNOM that is only available through more sophisticated analysis. The<br />
spectroscopic characterisation of DNOM has been found <strong>to</strong> be useful, because it can<br />
characterise DNOM without major sample preparation, which can result in unnecessary<br />
artefacts (1). Also, it enables the measuring of a large number of samples, since it is<br />
simple, quick, and highly sensitive.<br />
The problem is that our understanding of these proxies is not all that well funded and<br />
even some apparently antagonistic perceptions exist; The UV adsorption, conceptually<br />
linked <strong>to</strong> the amount of aromatic carboxyl and phenolic groups and <strong>to</strong> C=C systems<br />
(Williams and Fleming, 1995), is for instance commonly used as a proxy for the amount of<br />
DOC (3). At the same time it is generally perceived that specific UV radiation (sUVa =<br />
Abs.λ254/DOC) is an important proxy that varies considerably due <strong>to</strong> varying degree of<br />
aromaticity, <strong>to</strong>tal C-content and molecular weight (4) of the water-soluble HS. This proxy is<br />
frequently used by waterworks <strong>to</strong> reflect the reactivity of organics in water <strong>to</strong>ward removal<br />
and <strong>to</strong>ward organic halide (disinfection by-products; DBPs) formation potential (i.e. AOX<br />
form.pot.). A confounding issue is that especially iron (Fe) has also been suggested <strong>to</strong><br />
contribute <strong>to</strong> UV attenuation, either directly or by interactions with DOC (5). The Specific<br />
Absorbance Ratio (SAR = Abs.λ254/ Abs.λ400) is expected <strong>to</strong> increase with decreasing<br />
337
degree of aromaticity (6) and molecular weight (7). The (E4/E6) ratio, conceptually<br />
associated with the length of the conjugated bonds (i.e. red- and blueshift; 2), is found <strong>to</strong><br />
be inversely proportional <strong>to</strong> the degree of humification, condensation, aromaticity and<br />
molecular weight (4). It is also related <strong>to</strong> the adsorption ratio of organic micro-pollutants<br />
and thereby <strong>to</strong> their <strong>to</strong>xicity (8). The HIX (Fluorescence @ λ435–480 nm/λ 300–345 nm; 9)<br />
reflects the degree of condensation (10) and is associated with the amount of humic<br />
substances relative <strong>to</strong> non-humic material. This parameter has been found <strong>to</strong> have positive<br />
correlation with the C/H ratio of organic molecules (11). Fluorescence can be applied <strong>to</strong><br />
differentiate and classify the various types of humic substances (12). There is usually a<br />
strong correlation with molecular weight and, in addition, the ratio of fluorescenceabsorbance<br />
has been used as an indica<strong>to</strong>r for molecular weight (13).<br />
2. MATERIALS AND METHODS<br />
This study uses correlation analysis and multivariate statistics <strong>to</strong> study the empirical<br />
relationships between optical properties and a large number of sophisticated chemical<br />
parameters determined on isolated DNOM material. Since 1986 several <strong>Humus</strong>-/NOMisolates<br />
have been “produced” in the Nordic countries. The NOMiNiC project (Natural<br />
Organic Matter in the Nordic Countries; (14) and the NOM-Typing project (15) produced a<br />
set of 10+9 Reverse Osmosis (RO) and freeze dried DNOM isolates of <strong>ru</strong>noff from<br />
coniferous-forested Nordic catchments, differing in climate, anthropogenic S-loading and<br />
relative coverage of mineral soil, bogs and lakes. 3 new samples, from more barren land<br />
and from higher altitude, have recently been added <strong>to</strong> this sample set. All materials are<br />
pre-treated and isolated in the same manner. These materials are distributed; free of<br />
charge, <strong>to</strong> colleagues that whish <strong>to</strong> use these materials in their line of research using their<br />
analytical techniques <strong>to</strong> characterize the material. Considerable numbers of<br />
characterization data have thereby been generated on these samples. This allows us <strong>to</strong><br />
check if the interpretations of the proxies are valid and <strong>to</strong> disclose new relationships.<br />
3. PRELIMINARY RESULTS AND DISCUSSIONS<br />
A large number of strong correlations exist between the various parameters<br />
determined on the different sets of DNOM isolates. The empirical relationships between<br />
simple spectroscopic proxies and some central parameters are presented in Table 1. The<br />
challenge is <strong>to</strong> differentiate between strong correlations that are due <strong>to</strong> co-variations due<br />
<strong>to</strong> e.g. common catchment source (14) and real inherent relationships. Example of covariations<br />
may be in that DNOM from peat’s are generally more coloured, more high<br />
338
molecular weight and more hydrophobic than DNOM from mineral soils. Another problem<br />
is <strong>to</strong> understand what is the governing parameter; A simple example is that colour<br />
(Abs.λ410) is found <strong>to</strong> be positively correlated <strong>to</strong> Fe (Table 1), though this is due <strong>to</strong> that<br />
the organic binding of the Fe increases its conc. and not that Fe increases the colour of<br />
the solution.<br />
Table 1. Selected correlations with r > 0,85 in the NOM-Typing data set. sUVa denotes<br />
Abs.λ254/DOC. SAR denotes Abs.λ254/ Abs.λ400. Fe and Al denote <strong>to</strong>tal elemental cons.<br />
in solution. Org. Al denote Al bound <strong>to</strong> organic matter. Carbohydrates is determined as the<br />
relative integral of the 13C NMR spectre between 90 – 112 nm. AOX from pot. denote the<br />
potential <strong>to</strong> form absorbable organic halogen compounds<br />
Fluorescence ratio<br />
DOC Colour UV abs sUVa SAR IR 1400 /IR 2850 A/B A/C B/C<br />
pH 0,85<br />
Fe 0,99 0,98 0,98<br />
Al 0,88 0,93 0,91<br />
Org. Al 0,94 0,90<br />
SiO 2 0,99 0,95 0,98 0,90<br />
% Ash -0,88 -0,92 -0,90<br />
% N 0,87 0,95 0,92<br />
NO 3 -0,86 0,86 0,87 0,94<br />
Amino acid -0,86<br />
Amino sugars 0,93 0,94<br />
Carbohydrates -0,85<br />
AOX form. pot. 0,90 -0,88 -0,87 -0,88 -0,90<br />
4. CONCLUSIONS<br />
Considerable new knowledge can be generated by studying the relationship between<br />
parameters characterizing a set of DNOM samples pre-treated and isolated in the same<br />
way.<br />
ACKNOWLEDGEMENTS<br />
We wish <strong>to</strong> thank NORDTEST for funding, all the contribu<strong>to</strong>rs of data on the DNOM<br />
isolates and Associate Professor Dr. Dag Olav Andersen for all field work.<br />
339
REFERENCES<br />
1. Kalbitz, K., Geyer, S., and Geyer, W., 2000. A comparative characterization of dissolved<br />
organic matter by means of original aqueous samples and isolated humic substances,<br />
Chemosphere 40, pp. 1305–1312.<br />
2. Williams, D.H. and I. Fleming (1995). Spectroscopic methods in organic chemistry, Mcgraw-Hil<br />
3. Vik, Eilen A.; Carlson, Dale A.; Eikum, Arild S.; Gjessing, Egil T. Removing aquatic humus<br />
from Norwegian lakes. Journal - American Water Works Association (1985), 77(3), 58-66.<br />
4. Chen, Y., Senesi, N. and Schnitzer, M., 1977. Information provided on humic substances by<br />
E4/E6 ratios. Soil Sci. Soc. Am. J. 41, pp. 352–358.<br />
5. Alberts, J.J., 1982. The effect of metal ions on the ultraviolet spectra of humic acid, tannic acid<br />
and lignosulfonic acid. Water Research.16, I7, 1982, Pages 1273-1276<br />
6. Hautala, K., Peuravuori, J., Pihlaja, K., 2000. Measurement of aquatic humus content by<br />
spectroscopic analyses. Water Research, Volume Date 2000, 34(1), 246-258.<br />
7. Peuravuori, J. and Pihlaja, K., 1997. <strong>Molecular</strong> size distribution and spectroscopic properties<br />
of aquatic humic substances. Anal. Chim. Acta 337, pp. 133–149<br />
8. Kadlec, Matthew C.; Benson, William H. 1995. Relationship of aquatic natural organic material<br />
characteristics <strong>to</strong> the <strong>to</strong>xicity of selected insecticides. Eco<strong>to</strong>xicology and Environmental Safety,<br />
31(1), 84-97.<br />
9. Zsolnay, Á., Baigar, E., Jimenez, M., Steinweg, B., and Saccomandi, F., 1999. Differentiating<br />
with fluorescence spectroscopy the sources of dissolved organic matter in soils subjected <strong>to</strong><br />
drying, Chemosphere 38, pp. 45–50.<br />
10. Turro, N.J., 1978. Modern <strong>Molecular</strong> Pho<strong>to</strong>chemistry, Benjamin/Cummings, California, USA.<br />
11. Zsolnay, Á., 2003. Dissolved organic matter: artefacts, definitions, and functions, Geoderma<br />
113, pp. 187–209.<br />
12. Senesi, N., Miano, T.M., Provenzano, M.R. and B<strong>ru</strong>netti, G., 1991. Characterization,<br />
differentiation and classification of humic substances by fluorescence spectroscopy. Soil Sci.<br />
152, pp. 259–271.<br />
13. Stewart, A.J. and Wetzel, R.G., 1980. Fluorescence-absorbance ratios. A molecular-weight<br />
tracer of dissolved organic matter. Limnol. Oceanogr. 25, pp. 559–564.<br />
14. Vogt, R.D., Akkanen, J., Andersen, D.O., Brüggemann, R., Chatterjee, B., Gjessing, E.,<br />
Kukkonen, J.V.K., Larsen, H.E., Luster, J., Paul, A., Pflugmacher, S., Starr, M., Steinberg,<br />
C.E.W., Schmitt-Kopplin, P., and Zsolnay, Á., 2004. Key site variables governing the functional<br />
characteristics of Dissolved Natural Organic Matter (DNOM) in Nordic forested watersheds.<br />
Aquat. Sci. 66(2): 195 – 210.<br />
15. Gjessing, E. T.; Egeberg, P. K.; Håkedal, J. Natural organic matter in drinking water –<br />
The“NOM-typing project“, Background and basic characteristics of original water samples and<br />
NOM isolates. Environ. Intern. 1999, 25, 145–159.<br />
340
Difference between Humic Acids from Soils Derived under Different<br />
Tree Species in a Temperate Rain Forest, as Measured with<br />
13 C CPMAS-NMR<br />
Tsung-Yao Tseng 1,3 , Ya-Nan Wang 1 , Chyi-Rong Chiou 1 , Ming-Kuang Wang 2 ,<br />
Hsun-Jung Yeh 1 , Tsai-Huei Chen 3<br />
1 School of Forestry and Resource Conservation, National Taiwan University, Taipei, Taiwan 106<br />
2 Department of Agricultural Chemistry, National Taiwan University, Taipei, Taiwan, 106,<br />
mkwang@ntu.edu.tw<br />
3 Taiwan Forestry Research Institute, Council of Agriculture, Taipei, Taiwan, 100<br />
Keywords: 13 C CPMAS-NMR, decomposition, humic acids, tree species<br />
1. INTRODUCTION<br />
In recent interest has refocused on soil organic matter (SOM). The formation of<br />
humic acids (HAs) under different tree species was rarely reported. The objective of this<br />
study was <strong>to</strong> investigate the characteristics of HAs derived under different tree species.<br />
2. MATERIALS AND METHODS<br />
Three soils under different tree species were conducted at the Ta-Ta-Chia LTER site<br />
in central Taiwan, located at elevation about 2,600 m; average annual precipitation is<br />
3,000 mm, and the average annual temperature is 10.3°C. The soils are classified as<br />
loamy silty, mixed, mesic, Dystric Cryochrepts (2). The three tree species was dominated<br />
by (1) Taiwan red pine (Pinus taiwanensis); (2) Taiwan hemlock (Tsuga chinensis var.<br />
formosana) and (3) dwarf bamboo (Yushania niitakayamensis). Plant tissues (fresh<br />
leaves), litters, and soils were collected in triplicates that were all examined by solid-state<br />
13 C CPMAS-NMR. Soil humic acids were isolated, fractionated, and purified using the<br />
IHSS method. Humic acids also examined by 13 C-NMR, and the 13 C-NMR spectra were<br />
divided in<strong>to</strong> different chemical shift regions described by Oades (1). Areas of the chemical<br />
shift were measured by computer program and expressed as percentage of <strong>to</strong>tal area (i.e.,<br />
relative intensity).<br />
3. RESULTS AND DISCUSSION<br />
Table 1 gives selected soil physic-chemical properties. Table 2 displays the<br />
percentage distribution of all 13 C-NMR spectra of the fresh leaves, litters and soils. The<br />
341
elative lignin content of fresh tissues in bamboo (8.7%) of particular interest is lower than<br />
that in pine (16.7%) and hemlock (16.8%). After decomposition, the components in litters<br />
of cellulose (O-alkyl-C) and hemi-cellulose (N-alkyl/methoxyl-C plus acetal-C) tend <strong>to</strong><br />
decline, and microbial re-synthesized carbohydrates (alkyl-C plus carboxyl-C) increase in<br />
litters. The microbial re-synthesized carbohydrates contents in bamboo and hemlock<br />
(37.1%) are greater than that in pine (21.4%). The microbial re-synthesized carbohydrates<br />
contents in bamboo (37.1%) are greater than that in hemlock (30.9%) (O/A and A<br />
horizons). Furthermore, hemlock and bamboo soils contain less amounts of cellulose in<br />
the A horizon but higher amounts of aromatic-C and phenolic-C, while pine soil shows the<br />
reverse trend. This may be because dwarf bamboo plant materials decompose easily, and<br />
pine plant tissues decompose slower than those of hemlock and bamboo.<br />
Table 3 displays functional groups percentages of HAs under different tree species.<br />
The HAs of pine comprise consistent percentages of functional groups in the O/A and A<br />
horizons. On the other hand, the aromatic-C component in HAs of bamboo is greater<br />
changed. Concentrations of organic functional groups of HAs in pine and hemlock follow<br />
the general trend: alkyl-C > O-alkyl-C ≈ N-alkyl/methoxyl-C > aromatic-C > carboxyl-C ><br />
acetal-C > phenolic-C; while the trend in bamboo was: alkyl-C > aromatic-C > O-alkyl-C ≈<br />
N-alkyl/methoxyl-C > carboxyl-C > acetal-C > phenolic-C. Thus, we suggest that the trend<br />
of debris relative decomposition rates in the three tree species are bamboo > hemlock ><br />
pine.<br />
Table 1. Selected physical and chemical properties of soils tested<br />
Tree<br />
species<br />
Horizon Depth pH C N C/N CEC Sum of Cations<br />
(cm) (1:1) — (g kg -1 ) — (c mol (+) kg -1 )<br />
Pine O/A 0-15 3.1 128.3 7.4 20.2 12.0 0.7<br />
A 15-25 3.6 89.3 6.5 16.2 8.0 0.3<br />
Hemlock O/A 0-11 3.3 331.4 15.2 25.4 16.0 1.4<br />
A 11-20 3.9 17.0 0.9 23.2 13.0 0.7<br />
Bamboo O/A 0-19 3.8 69.1 4.4 18.3 14.0 0.3<br />
A 19-25 4.3 4.7 1.2 4.6 12.0 0.1<br />
342
Table 2. Percentages of functional groups of fresh tissues and soils by 13 C-NMR<br />
Tree<br />
species<br />
Alkyl<br />
N-Alkyl<br />
-C ‡ -C<br />
O- Alkyl<br />
-C<br />
Acetal<br />
-C<br />
Aromatic<br />
-C<br />
Phenolic<br />
-C<br />
Carboxyl<br />
-C<br />
Pine FT 17.6 11.2 34.9 14.6 10.2 6.5 5.0<br />
L 16.8 11.1 38.2 12.2 11.0 6.1 4.6<br />
O/A 27.8 13.0 21.9 9.2 12.1 6.3 9.7<br />
A 26.9 13.5 20.5 9.8 12.5 7.0 9.8<br />
Hemlock FT 17.6 11.2 34.9 14.6 10.2 6.5 5.0<br />
L 19.4 12.3 35.7 12.9 9.4 6.8 4.5<br />
O/A 23.5 13.3 29.4 10.4 10.9 5.2 7.4<br />
A 35.9 4.2 13.6 11.5 19.0 7.4 8.3<br />
Bamboo FT 18.2 14.3 41.8 12.1 6.5 2.2 5.0<br />
L 19.4 12.3 35.7 12.0 9.4 6.8 4.5<br />
O/A 26.4 13.6 23.7 8.3 10.7 6.5 10.7<br />
A 20.8 9.9 13.2 10.7 19.3 11.9 14.2<br />
‡ : Functional groups (chemical shift/ppm): Alkyl-C (0-45), N-Alkyl-C (45-65), O- Alkyl -<br />
C (65-90), Acetal-C (90-110), Aromatic-C (110-140), Phenolic-C (140-160), and Carboxyl-<br />
C (160-200).<br />
Table 3. Percentages of functional groups of HAs by 13 C-NMR<br />
Tree<br />
species<br />
Horizon<br />
Alkyl<br />
-C<br />
N-Alkyl<br />
-C<br />
O- Alkyl<br />
-C<br />
Acetal<br />
-C<br />
Aromatic<br />
-C<br />
Phenolic<br />
-C<br />
Carboxyl<br />
-C<br />
Pine O/A 35.6 15.0 15.2 5.7 13.7 3.8 10.9<br />
A 36.6 14.6 14.8 5.5 14.5 3.1 11.0<br />
Hemlock O/A 30.4 17.1 18.9 7.3 12.9 4.5 8.9<br />
A 45.2 14.2 13.9 5.0 9.4 2.9 9.4<br />
Bamboo O/A 34.3 14.9 16.5 5.2 15.0 2.5 11.6<br />
A 29.8 14.0 14.2 5.4 20.8 3.0 12.7<br />
343
4. CONCLUSIONS<br />
The debris of pine forest does not decompose easily in forest soil environments at<br />
high elevation and mountains. The relative decomposition rates of plant tissues of the<br />
three species show the following trend: bamboo > hemlock > pine forest.<br />
ACKNOWLEDGEMENTS<br />
The authors thank the National Science Council, Taiwan, for financial support.<br />
REFERENCES<br />
1. Oades, J.M., 1995. Recent advances in organomineral interactions: Implications for carbon<br />
cycling and soil st<strong>ru</strong>cture. In: P.M. Huang et al. (Edi<strong>to</strong>rs), Environmental Impact of Soil<br />
Component Interactions. Vol. 1. Natural and Anthropogeneic Organics. CRC Lewis Publishers,<br />
Boca Ra<strong>to</strong>n, FL. pp. 119-134.<br />
2. Soil Survey Staff, 2006. Key <strong>to</strong> Soil Taxonomy (10th edition). United States Department of<br />
Agriculture and Natural Resource Conservation Service. Washing<strong>to</strong>n, D.C.<br />
344
<strong>Humus</strong> Level in Soils of South Kazakhstan Irrigated Massifs<br />
Bogusław Wiłkomirski 1 , Maria Ibraeva 2 , Azimbay Otarov 2 , Małgorzata Suska-Malawska 1<br />
1 Institute of Botany, Warsaw University, Al. Ujazdowskie 4, 00-478 Warsaw, Poland,<br />
bowi@biol.uw.edu.pl<br />
2 Research Institute of Soil Science and Agrochemistry after U. U. Uspanov, Akademgorodok 3,<br />
030060 Almaty, Kazakhstan<br />
Keywords: humus, irrigation, Kazakhstan<br />
1. INTRODUCTION<br />
Soil cover of Republic Kazakhstan occupies the 9 th place in the world by its area, and<br />
the 1 st place by the area per capita. The soil cover differs from the soils of other countries<br />
by low resistance <strong>to</strong> anthropogenic influence, hence it is subjected <strong>to</strong> the processes of<br />
degradation and desertification (1).<br />
The problem of degradation of the irrigated soils used in the specific conditions of<br />
land tenure system is of concern in environmental investigations. The process of soil<br />
dehumification is one of the major fac<strong>to</strong>rs of soil degradation (2). The development of<br />
dehumification process in irrigated soils, its mechanism, and principal causes leading <strong>to</strong><br />
dehumification were considered in our previous works (3, 4). Our researches proved that<br />
the level of <strong>to</strong>tal humus in the soils of Akdala massif newly irrigated for rice cultivation<br />
decreased by 19-25% in comparison with the initial status. The loss of the most mobile<br />
water soluble form of humus achieved 12-36% for one season. The loss of humus<br />
achieved already 30-40% in the soils of old irrigated massifs in Kyzylorda oblast and its<br />
level made less than 1% on about 60% of the arable lands in the oblast (5). The loss of<br />
humus was promoted by mobilization and migration processes, which are rather intensive<br />
in the conditions of permanent flooding. Such loss, undoubtedly, causes the worsening of<br />
soil fertility, decreases its buffer capacity and resistance <strong>to</strong> unfavorable anthropogenic<br />
fac<strong>to</strong>rs. In this connection the research and assessment of modern humus level in the<br />
irrigated soils is one of the most urgent tasks in modern environmental and soil sciences.<br />
The aim of the present study was <strong>to</strong> investigate and assess the current humus<br />
condition of the South Kazakhstan irrigated soils. Such investigations are necessary <strong>to</strong><br />
determine the soil degradation reasons and <strong>to</strong> develop the practical measures for the<br />
stabilization and improvement of soil humus condition. It is known that the soils with a<br />
stable and high humus level are necessary <strong>to</strong> receive stable, high and ecologically pure<br />
crops. Such investigations can be also an introduction for developments of the methods of<br />
regulation and optimization of humus condition in the irrigated soils.<br />
345
2. MATERIALS AND METHODS<br />
Soil survey works on studying of soil humus condition have been carried out within<br />
the framework of the international project “Co-ordination of scientific activities <strong>to</strong>wards<br />
elaboration of common strategy for environmental protection and sustainable management<br />
in Syr-Darya River Basin, in Uzbekistan and Kazakhstan”. <strong>Humus</strong> condition was estimated<br />
by the <strong>to</strong>tal humus level in soils, contents of humus water soluble part, degree of its<br />
solubility and saturation with nitrogen. All humus analyses were carried out using standard<br />
methods.<br />
The investigations have been carried out in Shieli and Akdala massifs. Shieli massif<br />
is located in the South Kazakhstan, in lower flow (predelta) of the Syr Darya River, Akdala<br />
massif is located in South-East Kazakhstan, in the ancient delta of the River Ili. The major<br />
part of the massifs has a favorable relief fro irrigation. Rice is the major plant cultivated at<br />
both massifs.<br />
3. RESULTS AND DISCUSSION<br />
Alluvial-meadow, meadow-boggy, boggy soils were mainly used for rice cultivation at<br />
Shieli massif and takyr-like soils – at Akdala massif. As a result of the long-term use of the<br />
soils for rice cultivation, the soils of both massifs developed according <strong>to</strong> the classification<br />
of Kazakhstan soil scientists (6, 7, 8) and have turned <strong>to</strong> the irrigated (paddy) boggy soils.<br />
The changes of soils under this culture are provided with the specific conditions of its<br />
cultivation – constant flooding.<br />
Content of <strong>to</strong>tal and water soluble forms of humus in soils covering investigated<br />
massifs were established. The obtained results were elaborated by statistical methods.<br />
According <strong>to</strong> the classification the investigated soils can be referred <strong>to</strong> group of low humus<br />
level. A small variation concerning humus level is observed between two investigated<br />
massifs. The soils of Akdala massif are characterized by a lower level of humus (1.28 ±<br />
0.136%), the soils of Shieli massif – by a higher level (1.45 ± 0.191%). The different design<br />
is observed at the content of water soluble form of humus. The soils of Akdala massif have<br />
higher level of this form (0.006 ± 0.0007%), the soils of Shieli massif, the lower one (0.003<br />
±0,0002%).<br />
The content of nitrogen in humus from investigated soils was also determined. The<br />
presence of nitrogen, as one of the main nutritive element for plants, is one of the main<br />
parameters of a qualitative humus composition. The soils of newly irrigated Akdala massif<br />
were characterized by lower saturation with nitrogen (5,6 ±0,24%), whereas the saturation<br />
with nitrogen in the soils of Shieli massif achieved higher level (6,8 ±0,40%).<br />
346
All results were elaborated statistically (9). Analytical data received as a results of the<br />
researches, are characterized by a statistical stability and can be used for the assessment<br />
of the current humus condition of the soils investigated at the massifs of rice cultivation.<br />
Over the last 30 years irrigated areas have increased rapidly, helping <strong>to</strong> feed a<br />
growing population. Although the achievements of irrigation in ensuring food security have<br />
been impressive, the investigations indicate some environmental problems. In addition <strong>to</strong><br />
large water use, water quality reduction and salinization, soil degradation is usually<br />
considered the most significant problem of the irrigation sec<strong>to</strong>r. The process of soil<br />
dehumification is one of the major fac<strong>to</strong>rs of soil degradation leading <strong>to</strong> a number of<br />
economic and social consequences including the reduction of harvesting capacity,<br />
decrease of agricultural export potential and slow development of food industry.<br />
4. CONCLUSIONS<br />
1. The development of large-scale irrigation of agriculture in the arid region of<br />
southern and south-eastern Kazakhstan has resulted in the process of soil dehumification.<br />
2. Process of soil dehumificaion is observed, practically, at all arable and forage<br />
lands, although bigger humus loss is observed in irrigated soils. The loss of humus is<br />
promoted by mobilization and migration processes, which are rather intensive in the<br />
conditions of permanent flooding.<br />
3. Current humus condition of the irrigated soils in the southern Kazakhstan is<br />
characterized by a very low degree of protection of <strong>to</strong>tal humus.<br />
4. The humus of the soils has different degree of solubility in dependence on the<br />
beginning of massif irrigation. The degree of solubility is higher in soils of newly irrigated<br />
Akdala massif, than that in the soil of the massif irrigated from a long time (Shieli).<br />
5. The investigation and assessment of the current humus condition in southern<br />
Kazakhstan is really important and investigations are necessary for the determination of<br />
the soil degradation reasons and development of practical measures for the stabilization<br />
and improvement of soil humus condition.<br />
ACKNOWLEDGEMENTS<br />
The work was performed within proposal No 26199 financed by European Union in<br />
FP6-2002- INCO/Russia+NIS/SSA-4. We wish <strong>to</strong> acknowledge our indebtedness <strong>to</strong> the<br />
European Commission which financial support made this work possible.<br />
347
REFERENCES<br />
1. Saparov A. S. 2007. Soil cover of Republic Kazakhstan: current conditions, problems and the<br />
ways of their solution. Thesis of the international conference: “Sustainable management of<br />
natural resources and environmental protection in the Syr Darya River Basin. Curriculum,<br />
methods and effects, education”. Mikołajki, Poland.<br />
2. Zonn I. S. 2005. Desetrtification in the Central Asian countries. In: Faye, B., Esenov. P. (eds.)<br />
Desertification combat and food safety. IOS P5ress, NATO Science Series, p. 13 – 17.<br />
3. Ibraeva M. 2003. <strong>Humus</strong> condition of soils, used for rice cultivation in the arid zone of<br />
Kazakhstan. Theses of proceedings, II International conference “Humic substances in<br />
biosphere”, Moscow, Saint-Petersburg, pp 46-47.<br />
4. Otarov A., Ibraeva M., Saparov A. 2007. Degradation processes and modern soil-ecological<br />
condition of paddy soils in the republic. Soil genesis, fertility and ecology. Almaty, “Thetis”.<br />
5. Zubairov O.Z. 2002. Amelioration condition of irrigated soils in Kyzylorda oblast. / System of<br />
agricultural production in Kyzylorda oblast, Almaty, publishing house “Bastau”, 2002, p.385-<br />
387.<br />
6. Borovsky V.M., Ablakov E.B., Kozhevnikov K.Ya. 1959. Ancient delta of Syr-Darya and<br />
northern Kyzyl-Kum. V.2, Alma-Ata, publishing house of AS KazSSR, p. 418 .<br />
7. Karazhanov K.D. 1973. Soils of Kazalinsk massif and perspectives of their use. – Alma-Ata,<br />
“Nauka” KazSSR, p. 171<br />
8. Volkov A. 1983. Systematic description of soils. Soils of KazSSR, issue 14. Kyzylorda oblast.<br />
Alma-Ata, publishing house “Nauka” KazSSR, pp.46-50.<br />
9. Dmitriev E.A. 1995. Mathematical statistics in soil science. Moscow, publishing house of<br />
Moscow State University, 1995, p. 320.<br />
348
The Role of Lichens in Carbon Preservation in Soils of Tundra Zone<br />
Anna Zavarzina 1 , Christian Knoblauch 2 , Alexey Zavarzin 3 , Eva-Maria Pfeiffer 2<br />
1 Faculty of Soil Science, Moscow State University, 119991 Moscow, Russia, zavarzina@mail.<strong>ru</strong><br />
2 Institute of Soil Science, University of Hamburg, Allende-Platz 2, 20146 Hamburg, Germany<br />
3 Faculty of Biology and Soil Sciences, St.Petersburg State University, 199034 St.Petersburg,<br />
Russia<br />
Keywords: 13 C natural abundance, mineralization, lichens<br />
1. INTRODUCTION<br />
Humic substances (HS) comprise the major part of stable organic matter in soils. It is<br />
considered that the main st<strong>ru</strong>ctural precursor of HS in the boreal zone is lignin and its<br />
transformation products due <strong>to</strong> its high content in plant tissue and relative resistance <strong>to</strong><br />
biodegradation. Vegetation of large terri<strong>to</strong>ries in the tundra zone is dominated by lichens<br />
and mosses, almost lacking lignin. Little is known about the quantitative contribution of<br />
such lignin-free vegetation <strong>to</strong> the soil organic matter pool. Lichens – symbiotic associations<br />
of a fungus and a pho<strong>to</strong>biont (green algae or cyanobacteria) – represent a promising<br />
object for investigating carbon immobilization in a lignin-free environment. As primary<br />
producers of biomass they are pioneers on the rocky surfaces and apparently do not<br />
depend on organotrophic nutrition. The aim of this work was <strong>to</strong> study the role of lichenderived<br />
carbon in accumulation of stable organic matter in tundra soils. We compared δ 13 C<br />
signatures of dominating plant species with that of underlying soils and investigated<br />
relative mineralization rates of selected plant species in a labora<strong>to</strong>ry incubation<br />
experiment.<br />
2. MATERIALS AND METHODS<br />
The samples of dominating vegetation, litter and soil were taken from several<br />
representative field plots in Khibiny mountains (Murmansk region, Russia; tundra zone)<br />
and from reference plots in Moscow and Leningrad regions (boreal zone). Stable iso<strong>to</strong>pe<br />
measurements (δ 13 C) were conducted with a FinniganMAT DeltaPlus IR-Mass-<br />
Spectrometer equipped with an elemental analyzer (CE2500) and a conflow interface. The<br />
iso<strong>to</strong>pic fractionation during organic matter degradation was determined in respiration<br />
experiments by measuring the iso<strong>to</strong>pic composition of produced CO 2 and by measuring<br />
depth profiles of δ 13 C of organic matter. The relative mineralization rates of lichens,<br />
mosses and sh<strong>ru</strong>bs, most abundant in the studied sites, were assessed using milled plant<br />
biomass that was added <strong>to</strong> fresh tundra soil and incubated at 20°C in the dark for 17 days.<br />
349
The CO 2 evolved was trapped by 0.5 M NaOH and precipitated by 0.5 M BaCO 3 for δ 13 C<br />
measurements. The amount of CO 2 produced during soil respiration and mineralization of<br />
added carbon sources was quantified by titrating the excess of alkaly with 0.1 M HCl.<br />
3. RESULTS AND DISCUSSION<br />
In the measurements of the 13 C-composition of lichens of different tundra sites we<br />
determined δ 13 С values between –21‰ and –22‰ for Parmeliaceae (genera Cetraria,<br />
Flavocetraria, Alec<strong>to</strong>ria), from –23.5‰ <strong>to</strong> –25.5‰ for Cladoniaceae (genus Cladonia); and<br />
from –24‰ <strong>to</strong> –34‰ for the members of the order Peltigerales (genera Peltigera, Lobaria,<br />
Nephroma, Solorina). The stable carbon iso<strong>to</strong>pic composition of mosses was between<br />
-27‰ and –29.5‰, while that of higher plants was in the range of –28.2‰ <strong>to</strong> –30.3‰<br />
(except for Empet<strong>ru</strong>m nig<strong>ru</strong>m with δ 13 С value of –25.7‰). The δ 13 С values of tundra soils,<br />
developed under sh<strong>ru</strong>b-moss-lichen cover were from –24.00 ‰ <strong>to</strong> –25.00 ‰, while 13 C-<br />
composition of reference soils developed in boreal zone under lignified vegetation was in<br />
the range of –27.00 ‰ <strong>to</strong> –29.00 ‰. The 13 C-composition of soils became „heavier“ with<br />
depth. It was due <strong>to</strong> iso<strong>to</strong>pe fractionation during mineralization of organic matter as δ 13 С<br />
values of CO 2 respired from the soils were always „lighter“ than that of soil organic matter.<br />
The 13 C-composition of tundra soils was closest <strong>to</strong> that of different Cladonia species that<br />
suggests the dominant role of these lichens in carbon sequestration in the studied sites.<br />
This was proved by the results of labora<strong>to</strong>ry incubation experiment when we compared the<br />
relative mineralization rates of representative lichen, moss and sh<strong>ru</strong>b species. The highest<br />
mineralization rates were found in peltigerous lichens, Cetraria nivalis and the sh<strong>ru</strong>b<br />
Empet<strong>ru</strong>m nig<strong>ru</strong>m. Mineralization rates of Cladonia spp. were one of the lowest suggesting<br />
long preservation of their biomass and its transformation products in soils.<br />
4. CONCLUSIONS<br />
The 13 C-composition of tundra soils developed under moss-sh<strong>ru</strong>b-lichen cover<br />
reflects that of Cladonia spp. They dominate in the vegetation of investigated tundra soils<br />
and are characterized by low mineralization rates in comparison <strong>to</strong> other lichens, mosses<br />
and sh<strong>ru</strong>bs studied. The results of the present work suggest importance of Cladonia<br />
lichens as carbon source for humification in the soils of tundra zone.<br />
ACKNOWLEDGEMENTS<br />
Financial support from President of Russian Federation (MK-5336.2007.4 grant) and<br />
DFG (PF245 grant) are gratefully acknowledged.<br />
350