Current results from AIRS/AMSU/HSB
Current results from AIRS/AMSU/HSB
Current results from AIRS/AMSU/HSB

You also want an ePaper? Increase the reach of your titles
YUMPU automatically turns print PDFs into web optimized ePapers that Google loves.
International TOVS Study Conference-XIII Proceedings<br />
<strong>Current</strong> <strong>results</strong> <strong>from</strong> <strong>AIRS</strong>/<strong>AMSU</strong>/<strong>HSB</strong><br />
Joel Susskind a , Robert Atlas a , Christopher Barnet b , John Blaisdell c ,<br />
Lena Iredell c , Genia Brin c , Juan Carlos Jusem c , Fricky Keita c ,<br />
Louis Kouvaris c , Gyula Molnar b<br />
a NASA Goddard Space Flight Center, Greenbelt, MD, USA 20771<br />
b Joint Center for Earth Systems Technology, NASA GSFC, Greenbelt, MD, USA<br />
20771<br />
c Science Applications International Corporation, NASA GSFC, Greenbelt, MD, USA<br />
20771<br />
Abstract<br />
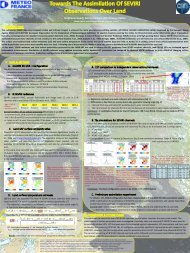
<strong>AIRS</strong> was launched on EOS Aqua on May 4, 2002, together with <strong>AMSU</strong> A and <strong>HSB</strong>, to form a next<br />
generation polar orbiting infrared and microwave atmospheric sounding system. The primary<br />
products of <strong>AIRS</strong>/<strong>AMSU</strong>/<strong>HSB</strong> are twice daily global fields of atmospheric temperature-humidity<br />
profiles, ozone profiles, sea/land surface skin temperature, and cloud related parameters including<br />
OLR. The sounding goals of <strong>AIRS</strong> are to produce 1 km tropospheric layer mean temperatures with an<br />
rms error of 1K, and layer precipitable water with an rms error of 20%, in cases with up to 80%<br />
effective cloud cover. Pre-launch simulation studies indicated that these <strong>results</strong> should be achievable.<br />
Minor modifications have been made to the pre-launch retrieval algorithm as alluded to in this paper.<br />
Sample fields of parameters retrieved <strong>from</strong> <strong>AIRS</strong>/<strong>AMSU</strong>/<strong>HSB</strong> data are presented and temperature<br />
profiles are validated as a function of retrieved fractional cloud cover. As in simulation, the<br />
degradation of retrieval accuracy with increasing cloud cover is small. Select fields are also<br />
compared to those contained in the ECMWF analysis, done without the benefit of <strong>AIRS</strong> data, to<br />
demonstrate information that <strong>AIRS</strong> can add to that already contained in the ECMWF analysis.<br />
Assimilation of <strong>AIRS</strong> temperature soundings in up to 80% cloud cover for the month of January 2003<br />
into the GSFC FVSSI data assimilation system resulted in improved 5 day forecasts globally, both<br />
with regard to anomaly correction coefficients and the prediction of location and intensity of<br />
cyclones.<br />
Introduction<br />
<strong>AIRS</strong>/<strong>AMSU</strong>/<strong>HSB</strong> is a state of the art advanced infra-red microwave sounding system that was<br />
launched on the EOS Aqua platform in a 1:30 AM/PM sun synchronous orbit on May 4, 2002. An<br />
overview of the <strong>AIRS</strong> instrument is given in Pagano et al 1 . The sounding goals of <strong>AIRS</strong> are to<br />
produce 1 km tropospheric layer mean temperatures with an rms error of 1K, and layer precipitable<br />
water with an rms error of 20%, in cases with up to 80% effective cloud cover. Aside <strong>from</strong> being part<br />
of a climate mission, one of the objectives of <strong>AIRS</strong> is to provide sounding information of sufficient<br />
accuracy such that when assimilated into a general circulation model, significant improvement in<br />
forecast skill would arise. The pre-launch algorithm to produce level 2 products (geophysical<br />
parameters) using <strong>AIRS</strong>/<strong>AMSU</strong>/<strong>HSB</strong> data, and expected <strong>results</strong> based on simulation studies, are<br />
given in Susskind et al. 2 The <strong>results</strong> of that simulation indicate that the sounding goals of<br />
<strong>AIRS</strong>/<strong>AMSU</strong>/<strong>HSB</strong> should be achievable. In that simulation, perfect knowledge of the instrumental<br />
spectral response functions and the inherent physics of the radiative transfer equations was assumed.<br />
Therefore, if the true state of the atmosphere and underlying surface were known perfectly, one could<br />
compute the radiances <strong>AIRS</strong>, <strong>AMSU</strong>, and <strong>HSB</strong> would see exactly up to instrumental noise. Susskind<br />
331
International TOVS Study Conference-XIII Proceedings<br />
et al. 2 alluded to the fact that this is not the case but in reality, and additional terms would have to be<br />
included in the retrieval algorithm to account for systematic differences (biases) between observed<br />
brightness temperatures and those computed knowing the “true” surface and atmospheric state, as<br />
well as residual computational errors after that systematic bias is accounted for (computational noise).<br />
In this paper, we show <strong>results</strong> based on the algorithm we were using to analyze <strong>AIRS</strong>/<strong>AMSU</strong>/<strong>HSB</strong><br />
data on June 30, 2003, which we will refer to as Version 3.1. This algorithm is very similar to the<br />
pre-launch version, with the major differences attributable to the factors described above. JPL<br />
delivered an earlier version of the algorithm, Version 3.0, to the Goddard DAAC, for the earliest near<br />
real time processing of <strong>AIRS</strong> level 2 products starting in August 2003. We have used Version 3.1 to<br />
analyze data for the <strong>AIRS</strong> focus day September 6, 2002, and all of January 2003 for use in a forecast<br />
impact experiment. Research to further improve the <strong>results</strong> of analysis of <strong>AIRS</strong>/<strong>AMSU</strong>/<strong>HSB</strong> data is<br />
continuing. JPL plans to deliver an improved version to the DAAC in the Spring of 2004 to be used<br />
to process near real time <strong>AIRS</strong> data <strong>from</strong> that point forward, as well as reprocess all <strong>AIRS</strong> data <strong>from</strong><br />
September 2002, when the instrument became stable.<br />
Overview of the <strong>AIRS</strong> Team Retrieval Algorithm<br />
The <strong>AIRS</strong> team retrieval algorithm is basically identical to that described in Susskind et al. 2 The key<br />
steps are outlined below: 1) Start with an initial state consistent with the <strong>AMSU</strong> A and <strong>HSB</strong><br />
radiances 3 ; 2) Derive IR clear column radiances ˆ 0<br />
R i valid for the 3x3 <strong>AIRS</strong> Fields of View (FOVs)<br />
within an <strong>AMSU</strong> A Field of Regard (FOR) consistent with the observed radiances and the initial state;<br />
3) Obtain an <strong>AIRS</strong> regression guess<br />
4 consistent with ˆ 0<br />
R i using 1504 <strong>AIRS</strong> channels; 4) Derive R ˆ 1 i<br />
consistent with the <strong>AIRS</strong> radiances and the regression guess; 5) Derive all surface and atmospheric<br />
parameters using ˆ 1<br />
R i for 415 <strong>AIRS</strong> channels and all <strong>AMSU</strong> and <strong>HSB</strong> radiances; 6) Derive cloud<br />
parameters and OLR consistent with the solution and observed R i ; 7) Apply quality control, which<br />
rejects a solution if the retrieved cloud fraction is greater than 80% or other tests fail. In the event that<br />
a retrieval is rejected, cloud parameters are determined using the initial microwave state and observed<br />
<strong>AIRS</strong> radiances. Figure 1 shows a typical <strong>AIRS</strong> spectrum and indicates by different colors the <strong>AIRS</strong><br />
channels used in different retrieval steps which are performed sequentially.<br />
Results Using Version 3.1<br />
Figure 2 shows the number of cases for each retrieved effective fractional cloud, in 0.5% bins, for the<br />
whole day September 6, 2002. The effective fractional cloud cover is given by the product of the<br />
fraction of the field of view covered by clouds and the cloud emissivity at 11 µm. The average global<br />
effective cloudiness was determined to be 38.26%. Also shown is the percent of accepted retrievals<br />
as a function of retrieved effective cloud cover. Roughly 93% of the cases with retrieved effective<br />
cloud cover 20% were accepted, falling to 63% at 60% effective cloud cover, and to 45% at 80%<br />
effective cloud cover. All cases with retrieved effective cloud cover greater than 80% are rejected. 2<br />
The average effective fractional cloudiness for all accepted cases was 27.06%. These <strong>results</strong> are very<br />
similar to what was shown in the simulation study. 2<br />
332
International TOVS Study Conference-XIII Proceedings<br />
Figure 1<br />
Figure 2<br />
333
International TOVS Study Conference-XIII Proceedings<br />
Figure 3 shows the RMS difference between retrieved 1 km layer mean temperatures and the<br />
collocated ECMWF forecast for all accepted cases as a function of retrieved effective cloud fraction.<br />
Results are shown for each of the lowest 8 km of the atmosphere. Agreement degrades with<br />
increasing cloud cover, but only very slowly except in the lowest 1 km of the atmosphere. RMS<br />
temperature differences <strong>from</strong> ECMWF at all levels are somewhat larger than the 1 K goal for retrieval<br />
accuracy. Part of this difference can be attributed to the fact that the ECMWF forecast is not perfect.<br />
It is also possible that the accuracy of the ECMWF forecast may be somewhat poorer with increasing<br />
cloud cover. The increase in RMS temperature differences at 0% cloudiness is somewhat misleading<br />
because a large percentage of clear cases occurred over Antarctica on this day.<br />
Figures 4a and 4b show RMS differences of temperature and moisture profiles <strong>from</strong> the “truth” with<br />
both simulated and real data. The gray and black curves reflect all accepted cases, and the pink and<br />
red curves are cases identified as clear, for simulated and observed radiances respectively. For<br />
temperature, 1 km layer mean differences <strong>from</strong> the truth are shown, and for water vapor, %<br />
differences in total integrated water vapor in 1 km layers are shown. In simulation, the truth is known<br />
perfectly, while with real data, the 3 hour ECMWF forecast is taken as a proxy for “truth”. For real<br />
data, as in simulation, temperature retrievals under cloudy conditions (roughly 66% of all cases are<br />
accepted) degrade by only a few tenths of a degree compared to cases identified as clear (roughly 8%<br />
of the cases are identified as clear), while water vapor retrievals do not degrade at all. Differences<br />
<strong>from</strong> “truth” are poorer with real data than in simulation. Two major causes of degradation are: 1)<br />
perfect physics was assumed in simulation; and 2) the “truth” has errors in real data. The degradation<br />
of soundings in the presence of “real clouds”, as compared to soundings in clear cases, appears to be<br />
similar to that implied by simulation.<br />
334
International TOVS Study Conference-XIII Proceedings<br />
Figure 4a<br />
Figure 4b<br />
Figure 5a shows RMS layer mean temperature differences between accepted retrievals, the ECMWF<br />
forecast, and collocated radiosonde reports (± 1 hour, ± 100 km) for September 6, 2002. The number<br />
of cases included in each of the layers is indicated at the right of the figure. It is interesting to note<br />
that the RMS temperature differences between the retrievals and ECMWF are generally smaller in the<br />
vicinity of radiosondes than they were globally (see Figure 4a). This is because the ECMWF forecast<br />
is more accurate in the vicinity of radiosondes than it is globally. The 3 hour ECMWF forecast agrees<br />
with radiosondes to 1 K between roughly 750 mb and 20 mb. Spatial and temporal sampling<br />
differences between ECMWF, retrievals, and radiosondes contribute to some extent to the increased<br />
differences between both ECMWF and retrievals as compared to radiosondes beneath 750 mb, as<br />
spatial and temporal variability of the atmosphere is greatest near the surface. Retrieval accuracy near<br />
radiosondes is somewhat poorer than that of the forecast at all levels, especially in the vicinity of 200<br />
mb. This is most likely due to limitations in the current methodology used to account for systematic<br />
errors in the radiative transfer used in the calculations and accounting for residual physics errors in the<br />
channel noise covariance matrix. We expect further improvement in this area.<br />
Figure 5b shows analogous <strong>results</strong> for percent differences in 1 km layer mean precipitable water, for<br />
which the sounding goal for <strong>AIRS</strong> is 20%. With regard to water vapor, it is clear that <strong>AIRS</strong> retrievals<br />
are significantly more accurate than the ECMWF forecast above 700 mb. <strong>AIRS</strong> differences <strong>from</strong><br />
radiosondes are greater than the 20% goal. Spatial and temporal sampling differences between <strong>AIRS</strong><br />
and radiosondes may contribute significantly to the apparent water vapor “errors” as water vapor<br />
changes rapidly in space and time.<br />
335
International TOVS Study Conference-XIII Proceedings<br />
Figure 5a<br />
Figure 5b<br />
Figure 6a shows the retrieved effective cloud top pressure and effective cloud fraction for ascending<br />
orbits on January 25, 2003. The <strong>results</strong> are presented in terms of cloud fraction in 5 groups, 0-20%,<br />
20-40%, etc. with darker colors indicating greater cloud cover. These groups are shown in each of 7<br />
colors, indicative of cloud top pressure. The reds and purples indicate the highest clouds, and the<br />
yellows and oranges the lowest clouds. Cloud fields are retrieved for all cases in which valid<br />
<strong>AIRS</strong>/<strong>AMSU</strong> observations exist. Gray means no data was observed. Figure 6b shows the retrieved<br />
500 mb temperature field. Gray indicates regions where either no valid observations existed or the<br />
retrieval was rejected, generally in regions of cloud cover 80-100%. Retrieved temperature profile<br />
fields are quite coherent, and show no apparent artifacts due to clouds in the field of view. Figures 7c<br />
and 7d show retrieved values of total precipitable water vapor above the surface and above 300 mb.<br />
Note the high values of upper tropospheric water vapor to the east of extensive cloud bands attributed<br />
to cold fronts.<br />
Figure 7a shows the retrieved 700 mb temperature field for ascending orbits on January 25, 2003.<br />
Figure 7b shows the collocated ECMWF 3 hour forecast 700 mb temperature field. These fields<br />
appear very similar to each other. Their difference is shown in Figure 7c, in which white shows<br />
agreement to ± 0.5K, each shade of red shows <strong>AIRS</strong> warmer than ECMWF in intervals of 1 K (0.5 –<br />
1.5, 1.5 – 2.5, etc.), and each shade of blue shows <strong>AIRS</strong> colder then ECMWF in intervals of 1 K. The<br />
area weighted global mean difference of the two fields is 0.08 K, and the area weighted standard<br />
deviation is 1.13 K. Most areas are white or the first shade of red or blue. The largest differences<br />
between the two fields occur in the vicinity of 35°S – 55°S, 100°E – 140°E, and show up as a dipole,<br />
336
International TOVS Study Conference-XIII Proceedings<br />
Figure 6<br />
with <strong>AIRS</strong> warmer to the west of 120°E and colder to the east. Figures 7a and 7b show this to be an<br />
area of a cold air mass, extending <strong>from</strong> the polar region to the mid-latitudes. This cold air mass is<br />
coherent in both the retrieved and forecasted fields, but is centered further east in the retrieved field<br />
compared to the forecast field, corresponding to a phase error in the 3 hour ECMWF forecast. This is<br />
precisely the type of information that satellite data can provide (if accurate enough) to help improve<br />
forecast skill. Figure 7d shows the difference between the retrieved and forecast 100 mb temperature<br />
fields. At the 100 mb level, a corresponding warm front (not shown) exists in both the retrieved and<br />
forecast fields in the area discussed above, with an analogous phase error to that found at 700 mb.<br />
Consequently, the retrieved 100 mb field is cooler than ECMWF to the west and warmer to the east in<br />
the region discussed above. This out of phase relationship of patterns of differences <strong>from</strong> ECMWF at<br />
700 mb and 100 mb is indicative of phase errors in the ECMWF forecast, as there is no reason for<br />
retrieval errors to be out of phase with each other at 700 mb and 100 mb. This out of phase<br />
relationship in spatial patterns of differences between retrieved and forecast temperatures at 700 mb<br />
and 100 mb is found in numerous places in Figures 7c and 7d and indicates many areas where the<br />
satellite data should improve the ECMWF forecast.<br />
Forecast Impact Experiments<br />
The data assimilation system used in the experiments is FVSSI which represents a combination of the<br />
NASA Finite Volume General Circulation Model (FVGCM) with the NCEP operational Spectral<br />
Statistical Interpolation (SSI) global analysis scheme implemented at lower than the operational<br />
horizontal resolution – T62. The basics of the finite-volume dynamical core formulation are given in<br />
DAO’s Algorithm Theoretical Basis Document (see http://polar.gsfc.nasa.gov/sci_research/atbd.php),<br />
and the FVGCM has been shown to produce very accurate weather forecasts when run at high<br />
resolution. 5 The <strong>AIRS</strong> temperature profiles produced by SRT were presented to the SSI analysis as<br />
rawinsonde profiles with observational error specified at 1°K at all vertical levels.<br />
337
International TOVS Study Conference-XIII Proceedings<br />
Figure 7<br />
Results are presented for three sets of experiments in which data was assimilated for the period<br />
January 1 – January 31, 2003. Five day forecasts were run every two days beginning January 6, 2003<br />
and forecasts every 12 hours were verified against the NCEP analysis, which was taken as “truth”. In<br />
the first experiment, called “control”, all the data used operationally by NCEP was assimilated, but no<br />
<strong>AIRS</strong> data was assimilated. The operational data included all conventional data, TOVS and ATOVS<br />
radiances for NOAA-14, 15, and 16, cloud tracked winds, SSM/I total precipitable water and surface<br />
wind speed over ocean, QuikScat surface wind speed and direction, and SBUV ozone profiles. In the<br />
second and third experiments, called “clear <strong>AIRS</strong>” and “all <strong>AIRS</strong>”, temperature profiles retrieved<br />
<strong>from</strong> <strong>AIRS</strong> soundings were assimilated in addition to the data included in the “control” experiment.<br />
“Clear ocean” included all accepted temperature retrievals derived <strong>from</strong> <strong>AIRS</strong> over ocean and sea ice<br />
in cases where the retrieved cloud fraction derived <strong>from</strong> <strong>AIRS</strong> was less than or equal to 2%, while the<br />
“all ocean” experiment assimilated accepted <strong>AIRS</strong> temperature soundings over ocean and sea ice for<br />
all retrieved cloud fractions.<br />
Figure 8 shows anomaly correction coefficients of forecast sea level pressure verified against the<br />
NCEP analysis for both Northern Hemisphere extra-tropics and Southern Hemisphere extra-tropics<br />
for both the “control” and “all <strong>AIRS</strong>” experiments. In the Northern Hemisphere, addition of all <strong>AIRS</strong><br />
soundings resulted in an improvement in average forecast skill of the order of 1 hour or less, but an<br />
improvement in average forecast skill in the Southern Hemisphere on the order of 6 hours <strong>results</strong> <strong>from</strong><br />
assimilation of <strong>AIRS</strong> soundings. Assimilation of <strong>AIRS</strong> soundings under essentially clear conditions<br />
(not shown), resulted in somewhat poorer forecasts than using all <strong>AIRS</strong> soundings. It should be noted<br />
that the<br />
338
International TOVS Study Conference-XIII Proceedings<br />
Figure 8 Figure 9<br />
Aqua orbit (1:30 ascending) is almost identical to that of NOAA 16 carrying HIRS3, <strong>AMSU</strong> A and<br />
<strong>AMSU</strong> B, so <strong>AIRS</strong>/<strong>AMSU</strong>/<strong>HSB</strong> soundings are providing additional information to that contained in<br />
the <strong>AMSU</strong> A/<strong>AMSU</strong> B radiances on NOAA 16 in the same orbit.<br />
Figure 9 shows the RMS position error (km) and magnitude error (hPa) for 5 day forecasts of extra<br />
tropical cyclones in the three experiments. It is apparent that addition of <strong>AIRS</strong> soundings improved<br />
RMS forecast skill for both the position and magnitude of extra-tropical cyclones globally, and<br />
addition of <strong>AIRS</strong> soundings in partially cloudy areas further improved forecast skill as compared to<br />
use of soundings only in essentially clear conditions.<br />
Several thousand cyclones verifications are included in these statistics. Addition of <strong>AIRS</strong> data did not<br />
improve forecasted cyclone position and intensity for each cyclone. Some were improved<br />
substantially however. Figure 10 shows the impact of <strong>AIRS</strong> data on the 24 hour forecast of position<br />
and intensity of tropical storm Beni, which was centered roughly 4° east of New Caledonia on<br />
January 31, 2003 with a central pressure of 990 mb (see Figure 10d). The control forecast (Figure<br />
10a) produced a relatively weak cyclone (1007 mb) displaced considerably to the northwest, while the<br />
24 hour forecast using <strong>AIRS</strong> data (Figure 10b) was much more accurate in both position and intensity<br />
(995 mb). It is significant to note that our forecast using <strong>AIRS</strong> data was more accurate in both<br />
position and intensity than the NCEP operational forecast (Figure 10c) in this case, which, even<br />
though it used a higher resolution model and analysis system, did not have the benefit of <strong>AIRS</strong> data.<br />
The <strong>results</strong> shown indicate the potential of <strong>AIRS</strong> soundings to improve operational forecast skill. We<br />
are working with NCEP to arrange an experiment to add <strong>AIRS</strong> temperature soundings to an otherwise<br />
339
International TOVS Study Conference-XIII Proceedings<br />
equivalent run on the NCEP computing system to see the extent, if any, that operational forecast skill<br />
can be improved upon.<br />
References<br />
Figure 10<br />
Pagano, T. S., H. H. Aumann, D. E. Hagan, and K. Overoye, February 2003. Prelaunch and in-flight<br />
radiometric calibration of the Atmospheric Infrared Sounder (<strong>AIRS</strong>). IEEE Trans. Geosci. Remote<br />
Sensing, 41, 265-273.<br />
Susskind, J., C. D. Barnet, and J. M. Blaisdell, February 2003. Retrieval of Atmospheric and Surface<br />
Parameters <strong>from</strong> <strong>AIRS</strong>/<strong>AMSU</strong>/<strong>HSB</strong> Data in the Presence of Clouds. IEEE Trans. Geosci. Remote<br />
Sensing, 41, 390-409.<br />
Rosenkranz, P. W., 2000. Retrieval of temperature and moisture profiles <strong>from</strong> <strong>AMSU</strong>-A and <strong>AMSU</strong>-<br />
B measurements. In Proc. IGARSS.<br />
Goldberg, M. D., Y. Qu, L. M. McMillin, W. Wolff, L. Zhou, and M. Divakaria, February 2003.<br />
<strong>AIRS</strong> near-real-time products and algorithms in support of operational numerical weather prediction.<br />
IEEE Trans. Geosci. Remote Sensing, 41, 379-389.<br />
Lin, S.J., R. Atlas, and K. S. Yeh, January-February, 2004. Global weather prediction and high end<br />
computing at NASA. Computing in Science and Engineering, 29-35.<br />
340
Proceedings<br />
of the<br />
Thirteenth International<br />
TOVS Study Conference<br />
Sainte-Adèle, Québec, Canada<br />
29 October – 4 November 2003