Current results from AIRS/AMSU/HSB
Current results from AIRS/AMSU/HSB
Current results from AIRS/AMSU/HSB

Create successful ePaper yourself
Turn your PDF publications into a flip-book with our unique Google optimized e-Paper software.
International TOVS Study Conference-XIII Proceedings<br />
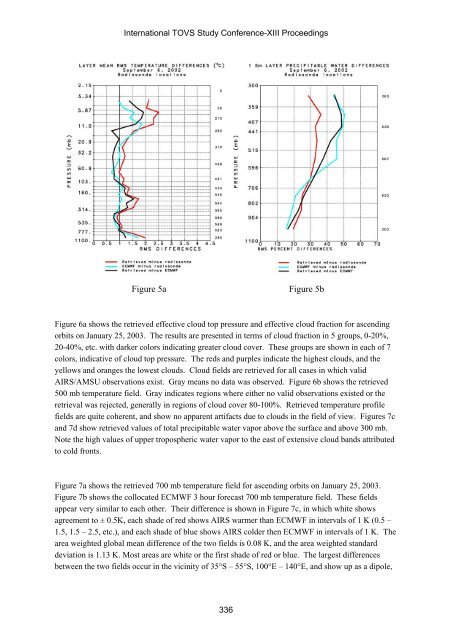
Figure 5a<br />
Figure 5b<br />
Figure 6a shows the retrieved effective cloud top pressure and effective cloud fraction for ascending<br />
orbits on January 25, 2003. The <strong>results</strong> are presented in terms of cloud fraction in 5 groups, 0-20%,<br />
20-40%, etc. with darker colors indicating greater cloud cover. These groups are shown in each of 7<br />
colors, indicative of cloud top pressure. The reds and purples indicate the highest clouds, and the<br />
yellows and oranges the lowest clouds. Cloud fields are retrieved for all cases in which valid<br />
<strong>AIRS</strong>/<strong>AMSU</strong> observations exist. Gray means no data was observed. Figure 6b shows the retrieved<br />
500 mb temperature field. Gray indicates regions where either no valid observations existed or the<br />
retrieval was rejected, generally in regions of cloud cover 80-100%. Retrieved temperature profile<br />
fields are quite coherent, and show no apparent artifacts due to clouds in the field of view. Figures 7c<br />
and 7d show retrieved values of total precipitable water vapor above the surface and above 300 mb.<br />
Note the high values of upper tropospheric water vapor to the east of extensive cloud bands attributed<br />
to cold fronts.<br />
Figure 7a shows the retrieved 700 mb temperature field for ascending orbits on January 25, 2003.<br />
Figure 7b shows the collocated ECMWF 3 hour forecast 700 mb temperature field. These fields<br />
appear very similar to each other. Their difference is shown in Figure 7c, in which white shows<br />
agreement to ± 0.5K, each shade of red shows <strong>AIRS</strong> warmer than ECMWF in intervals of 1 K (0.5 –<br />
1.5, 1.5 – 2.5, etc.), and each shade of blue shows <strong>AIRS</strong> colder then ECMWF in intervals of 1 K. The<br />
area weighted global mean difference of the two fields is 0.08 K, and the area weighted standard<br />
deviation is 1.13 K. Most areas are white or the first shade of red or blue. The largest differences<br />
between the two fields occur in the vicinity of 35°S – 55°S, 100°E – 140°E, and show up as a dipole,<br />
336