Current results from AIRS/AMSU/HSB
Current results from AIRS/AMSU/HSB
Current results from AIRS/AMSU/HSB

Create successful ePaper yourself
Turn your PDF publications into a flip-book with our unique Google optimized e-Paper software.
International TOVS Study Conference-XIII Proceedings<br />
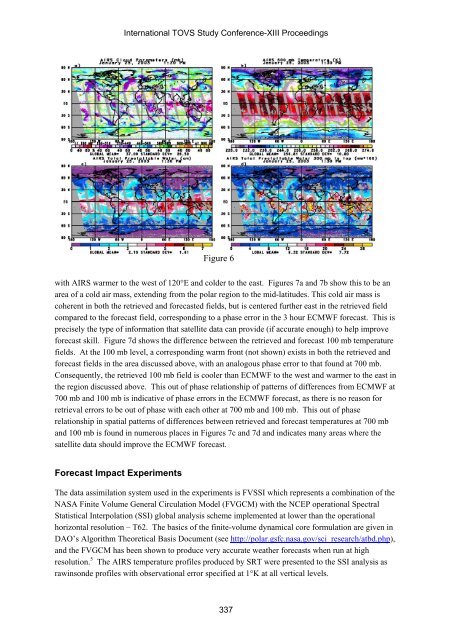
Figure 6<br />
with <strong>AIRS</strong> warmer to the west of 120°E and colder to the east. Figures 7a and 7b show this to be an<br />
area of a cold air mass, extending <strong>from</strong> the polar region to the mid-latitudes. This cold air mass is<br />
coherent in both the retrieved and forecasted fields, but is centered further east in the retrieved field<br />
compared to the forecast field, corresponding to a phase error in the 3 hour ECMWF forecast. This is<br />
precisely the type of information that satellite data can provide (if accurate enough) to help improve<br />
forecast skill. Figure 7d shows the difference between the retrieved and forecast 100 mb temperature<br />
fields. At the 100 mb level, a corresponding warm front (not shown) exists in both the retrieved and<br />
forecast fields in the area discussed above, with an analogous phase error to that found at 700 mb.<br />
Consequently, the retrieved 100 mb field is cooler than ECMWF to the west and warmer to the east in<br />
the region discussed above. This out of phase relationship of patterns of differences <strong>from</strong> ECMWF at<br />
700 mb and 100 mb is indicative of phase errors in the ECMWF forecast, as there is no reason for<br />
retrieval errors to be out of phase with each other at 700 mb and 100 mb. This out of phase<br />
relationship in spatial patterns of differences between retrieved and forecast temperatures at 700 mb<br />
and 100 mb is found in numerous places in Figures 7c and 7d and indicates many areas where the<br />
satellite data should improve the ECMWF forecast.<br />
Forecast Impact Experiments<br />
The data assimilation system used in the experiments is FVSSI which represents a combination of the<br />
NASA Finite Volume General Circulation Model (FVGCM) with the NCEP operational Spectral<br />
Statistical Interpolation (SSI) global analysis scheme implemented at lower than the operational<br />
horizontal resolution – T62. The basics of the finite-volume dynamical core formulation are given in<br />
DAO’s Algorithm Theoretical Basis Document (see http://polar.gsfc.nasa.gov/sci_research/atbd.php),<br />
and the FVGCM has been shown to produce very accurate weather forecasts when run at high<br />
resolution. 5 The <strong>AIRS</strong> temperature profiles produced by SRT were presented to the SSI analysis as<br />
rawinsonde profiles with observational error specified at 1°K at all vertical levels.<br />
337