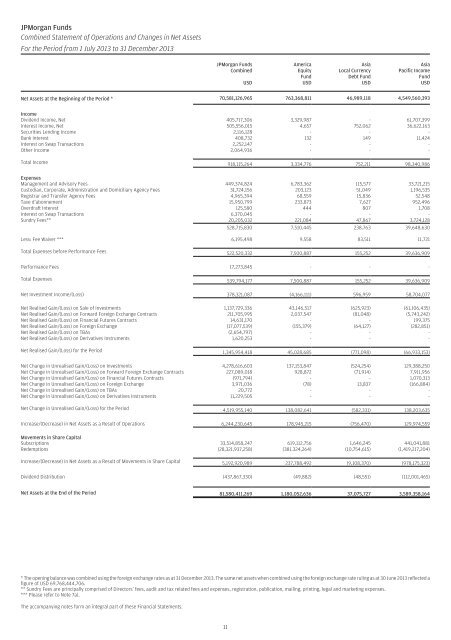
<strong><strong>JP</strong><strong>Morgan</strong></strong> <strong>Funds</strong> Combined Statement of Operations and Changes in Net <strong>Asset</strong>s For the Period from 1 July 2013 to 31 December 2013 <strong><strong>JP</strong><strong>Morgan</strong></strong> <strong>Funds</strong> Combined USD America Equity Fund USD Asia Local Currency Debt Fund USD Asia Pacific Income Fund USD Net <strong>Asset</strong>s at the Beginning of the Period * 70,581,126,965 763,368,811 46,989,118 4,549,560,393 Income Dividend Income, Net 405,717,306 3,329,987 - 61,707,399 Interest Income, Net 505,556,015 4,657 752,062 36,622,163 Securities Lending Income 2,116,128 - - - Bank Interest 408,732 132 149 11,424 Interest on Swap Transactions 2,252,147 - - - Other Income 2,064,936 - - - Total Income 918,115,264 3,334,776 752,211 98,340,986 Expenses Management and Advisory Fees 449,374,824 6,783,362 115,577 33,721,215 Custodian, Corporate, Administration and Domiciliary Agency Fees 31,724,156 203,123 51,049 1,196,535 Registrar and Transfer Agency Fees 4,965,394 68,559 15,836 52,548 Taxe d’abonnement 15,950,799 233,873 7,627 952,496 Overdraft Interest 125,580 444 807 1,708 Interest on Swap Transactions 6,370,045 - - - Sundry Fees** 20,205,032 221,084 47,867 3,724,128 528,715,830 7,510,445 238,763 39,648,630 Less: Fee Waiver *** 6,195,498 9,558 83,511 11,721 Total Expenses before Performance Fees 522,520,332 7,500,887 155,252 39,636,909 Performance Fees 17,273,845 - - - Total Expenses 539,794,177 7,500,887 155,252 39,636,909 Net Investment Income/(Loss) 378,321,087 (4,166,111) 596,959 58,704,077 Net Realised Gain/(Loss) on Sale of Investments 1,137,729,336 43,146,517 (625,923) (61,106,435) Net Realised Gain/(Loss) on Forward Foreign Exchange Contracts 211,705,995 2,037,547 (81,048) (5,743,242) Net Realised Gain/(Loss) on Financial Futures Contracts 14,631,170 - - 199,375 Net Realised Gain/(Loss) on Foreign Exchange (17,077,539) (155,379) (64,127) (282,851) Net Realised Gain/(Loss) on TBAs (2,654,797) - - - Net Realised Gain/(Loss) on Derivatives Instruments 1,620,253 - - - Net Realised Gain/(Loss) for the Period 1,345,954,418 45,028,685 (771,098) (66,933,153) Net Change in Unrealised Gain/(Loss) on Investments 4,278,616,603 137,153,847 (524,254) 129,388,250 Net Change in Unrealised Gain/(Loss) on Forward Foreign Exchange Contracts 227,089,018 928,872 (71,914) 7,911,956 Net Change in Unrealised Gain/(Loss) on Financial Futures Contracts (971,794) - - 1,070,313 Net Change in Unrealised Gain/(Loss) on Foreign Exchange 3,971,036 (78) 13,837 (166,884) Net Change in Unrealised Gain/(Loss) on TBAs 20,772 - - - Net Change in Unrealised Gain/(Loss) on Derivatives Instruments 11,229,505 - - - Net Change in Unrealised Gain/(Loss) for the Period 4,519,955,140 138,082,641 (582,331) 138,203,635 Increase/(Decrease) in Net <strong>Asset</strong>s as a Result of Operations 6,244,230,645 178,945,215 (756,470) 129,974,559 Movements in Share Capital Subscriptions 33,514,858,247 619,112,756 1,646,245 441,041,881 Redemptions (28,321,937,258) (381,324,264) (10,754,615) (1,419,217,204) Increase/(Decrease) in Net <strong>Asset</strong>s as a Result of Movements in Share Capital 5,192,920,989 237,788,492 (9,108,370) (978,175,323) Dividend Distribution (437,867,330) (49,882) (48,551) (112,001,465) Net <strong>Asset</strong>s at the End of the Period 81,580,411,269 1,180,052,636 37,075,727 3,589,358,164 * The opening balance was combined using the foreign exchange rates as at 31 December 2013. The same net assets when combined using the foreign exchange rate ruling as at 30 June 2013 reflected a figure of USD 69,768,444,706. ** Sundry Fees are principally comprised of Directors’ fees, audit and tax related fees and expenses, registration, publication, mailing, printing, legal and marketing expenses. *** Please refer to Note 7a). The accompanying notes form an integral part of these Financial Statements. 11
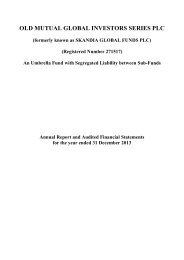
<strong><strong>JP</strong><strong>Morgan</strong></strong> <strong>Funds</strong> Combined Statement of Operations and Changes in Net <strong>Asset</strong>s (continued) For the Period from 1 July 2013 to 31 December 2013 Brazil Equity Fund USD China Fund USD Eastern Europe Equity Fund EUR Emerging Europe, Middle East and Africa Equity Fund USD Emerging Markets Debt Fund USD Emerging Markets Dividend Fund USD Emerging Markets Equity Fund USD 409,868,248 2,082,791,008 627,552,460 537,872,234 1,534,463,913 102,908,453 5,175,815,410 4,755,078 1,519,299 6,097,836 5,905,699 - 2,146,465 50,583,221 22,601 3,395 14,984 9,100 42,734,077 305 46,596 - 229,639 - - - - - - 11,820 650 4,190 11,397 454 13,939 - - - - - - - - - 618,485 234,776 - - 458 4,777,679 1,764,153 6,731,955 6,153,765 42,745,474 2,147,224 50,644,214 2,971,580 19,201,202 4,811,163 3,882,492 7,296,096 512,490 25,326,919 208,177 807,892 472,411 422,116 419,877 134,535 2,248,828 44,365 87,150 46,524 47,033 78,023 25,746 198,122 70,869 551,999 145,850 111,451 267,129 18,251 833,372 - 191 - - - 812 2,752 - - - - - - - 175,053 1,046,333 153,543 189,866 1,049,508 89,994 893,035 3,470,044 21,694,767 5,629,491 4,652,958 9,110,633 781,828 29,503,028 1,024 7,256 4,837 7,103 25,996 116,150 16,738 3,469,020 21,687,511 5,624,654 4,645,855 9,084,637 665,678 29,486,290 - - - - - - - 3,469,020 21,687,511 5,624,654 4,645,855 9,084,637 665,678 29,486,290 1,308,659 (19,923,358) 1,107,301 1,507,910 33,660,837 1,481,546 21,157,924 (39,048,338) 200,892,232 (4,342,636) 7,804,621 (57,868,725) (619,479) 17,962,649 3,231 (12,465) 65,012 77,667 12,294,321 (283,450) 1,993,254 - - - - (1,981,975) - - 279,353 116,300 107,758 124,767 773,395 (42,393) (1,753,841) - - - - - - - (621,082) - - - (65,476) - - (39,386,836) 200,996,067 (4,169,866) 8,007,055 (46,848,460) (945,322) 18,202,062 17,276,397 197,574,874 29,594,022 49,945,736 51,257,271 4,962,434 166,673,725 - - - - 13,073,248 439,954 963,240 - - - - 1,515,816 - - 289,454 (36,404) 147,498 107,087 (37,317) (21,761) 245,427 - - - - - - - (87,869) - - - 112,694 - - 17,477,982 197,538,470 29,741,520 50,052,823 65,921,712 5,380,627 167,882,392 (20,600,195) 378,611,179 26,678,955 59,567,788 52,734,089 5,916,851 207,242,378 111,422,590 434,950,780 98,006,989 50,134,764 384,930,473 26,199,248 839,269,381 (172,516,559) (688,995,369) (93,331,543) (81,167,682) (521,355,291) (38,573,744) (993,241,557) (61,093,969) (254,044,589) 4,675,446 (31,032,918) (136,424,818) (12,374,496) (153,972,176) (64,351) (11,000,140) (5,579,488) (3,006,416) (36,184,264) (1,249,373) (13,983,074) 328,109,733 2,196,357,458 653,327,373 563,400,688 1,414,588,920 95,201,435 5,215,102,538 12
- Page 1 and 2: JPMorgan Funds Unaudited Semi-Annua
- Page 3 and 4: JPMorgan Funds Unaudited Semi-Annua
- Page 5 and 6: JPMorgan Funds Management and Admin
- Page 7 and 8: JPMorgan Funds Combined Statement o
- Page 9 and 10: JPMorgan Funds Combined Statement o
- Page 11 and 12: JPMorgan Funds Combined Statement o
- Page 13: JPMorgan Funds Combined Statement o
- Page 17 and 18: JPMorgan Funds Combined Statement o
- Page 19 and 20: JPMorgan Funds Combined Statement o
- Page 21 and 22: JPMorgan Funds Statement of Changes
- Page 23 and 24: JPMorgan Funds Statement of Changes
- Page 25 and 26: JPMorgan Funds Statement of Changes
- Page 27 and 28: JPMorgan Funds Statement of Changes
- Page 29 and 30: JPMorgan Funds Statement of Changes
- Page 31 and 32: JPMorgan Funds Statistical Informat
- Page 33 and 34: JPMorgan Funds Statistical Informat
- Page 35 and 36: JPMorgan Funds Statistical Informat
- Page 37 and 38: JPMorgan Funds Statistical Informat
- Page 39 and 40: JPMorgan Funds Statistical Informat
- Page 41 and 42: JPMorgan Funds Statistical Informat
- Page 43 and 44: JPMorgan Funds Notes to the Unaudit
- Page 45 and 46: JPMorgan Funds Notes to the Unaudit
- Page 47 and 48: JPMorgan Funds Notes to the Unaudit
- Page 49 and 50: JPMorgan Funds Notes to the Unaudit
- Page 51 and 52: JPMorgan Funds Notes to the Unaudit
- Page 53 and 54: JPMorgan Funds Notes to the Unaudit
- Page 55 and 56: JPMorgan Funds - America Equity Fun
- Page 57 and 58: JPMorgan Funds - Asia Local Currenc
- Page 59 and 60: JPMorgan Funds - Asia Pacific Incom
- Page 61 and 62: JPMorgan Funds - Asia Pacific Incom
- Page 63 and 64: JPMorgan Funds - Asia Pacific Incom
- Page 65 and 66:
JPMorgan Funds - Brazil Equity Fund
- Page 67 and 68:
JPMorgan Funds - China Fund Schedul
- Page 69 and 70:
JPMorgan Funds - Eastern Europe Equ
- Page 71 and 72:
JPMorgan Funds - Emerging Europe, M
- Page 73 and 74:
JPMorgan Funds - Emerging Markets D
- Page 75 and 76:
JPMorgan Funds - Emerging Markets D
- Page 77 and 78:
JPMorgan Funds - Emerging Markets D
- Page 79 and 80:
JPMorgan Funds - Emerging Markets D
- Page 81 and 82:
JPMorgan Funds - Emerging Markets D
- Page 83 and 84:
JPMorgan Funds - Emerging Markets E
- Page 85 and 86:
JPMorgan Funds - Emerging Markets I
- Page 87 and 88:
JPMorgan Funds - Emerging Markets I
- Page 89 and 90:
JPMorgan Funds - Emerging Markets I
- Page 91 and 92:
JPMorgan Funds - Emerging Markets L
- Page 93 and 94:
JPMorgan Funds - Emerging Markets L
- Page 95 and 96:
JPMorgan Funds - Emerging Markets L
- Page 97 and 98:
JPMorgan Funds - Emerging Markets O
- Page 99 and 100:
JPMorgan Funds - Emerging Middle Ea
- Page 101 and 102:
JPMorgan Funds - Euroland Equity Fu
- Page 103 and 104:
JPMorgan Funds - Euroland Equity Fu
- Page 105 and 106:
JPMorgan Funds - Euroland Select Eq
- Page 107 and 108:
JPMorgan Funds - Europe Dynamic Fun
- Page 109 and 110:
JPMorgan Funds - Europe Dynamic Fun
- Page 111 and 112:
JPMorgan Funds - Europe Equity Fund
- Page 113 and 114:
JPMorgan Funds - Europe Small Cap F
- Page 115 and 116:
JPMorgan Funds - Europe Small Cap F
- Page 117 and 118:
JPMorgan Funds - Europe Technology
- Page 119 and 120:
JPMorgan Funds - Germany Equity Fun
- Page 121 and 122:
JPMorgan Funds - Global Consumer Tr
- Page 123 and 124:
JPMorgan Funds - Global Convertible
- Page 125 and 126:
JPMorgan Funds - Global Convertible
- Page 127 and 128:
JPMorgan Funds - Global Dynamic Fun
- Page 129 and 130:
JPMorgan Funds - Global Dynamic Fun
- Page 131 and 132:
JPMorgan Funds - Global Focus Fund
- Page 133 and 134:
JPMorgan Funds - Global Focus Fund
- Page 135 and 136:
JPMorgan Funds - Global Government
- Page 137 and 138:
JPMorgan Funds - Global Government
- Page 139 and 140:
JPMorgan Funds - Global Natural Res
- Page 141 and 142:
JPMorgan Funds - Global Real Estate
- Page 143 and 144:
JPMorgan Funds - Global Unconstrain
- Page 145 and 146:
JPMorgan Funds - Global Unconstrain
- Page 147 and 148:
JPMorgan Funds - Hong Kong Fund Sch
- Page 149 and 150:
JPMorgan Funds - Indonesia Equity F
- Page 151 and 152:
JPMorgan Funds - Japan Equity Fund
- Page 153 and 154:
JPMorgan Funds - Korea Equity Fund
- Page 155 and 156:
JPMorgan Funds - Latin America Equi
- Page 157 and 158:
JPMorgan Funds - Russia Fund Schedu
- Page 159 and 160:
JPMorgan Funds - Taiwan Fund Schedu
- Page 161 and 162:
JPMorgan Funds - US Aggregate Bond
- Page 163 and 164:
JPMorgan Funds - US Aggregate Bond
- Page 165 and 166:
JPMorgan Funds - US Aggregate Bond
- Page 167 and 168:
JPMorgan Funds - US Aggregate Bond
- Page 169 and 170:
JPMorgan Funds - US Aggregate Bond
- Page 171 and 172:
JPMorgan Funds - US Aggregate Bond
- Page 173 and 174:
JPMorgan Funds - US Aggregate Bond
- Page 175 and 176:
JPMorgan Funds - US Aggregate Bond
- Page 177 and 178:
JPMorgan Funds - US Growth Fund Sch
- Page 179 and 180:
JPMorgan Funds - US High Yield Plus
- Page 181 and 182:
JPMorgan Funds - US High Yield Plus
- Page 183 and 184:
JPMorgan Funds - US High Yield Plus
- Page 185 and 186:
JPMorgan Funds - US High Yield Plus
- Page 187 and 188:
JPMorgan Funds - US Small Cap Growt
- Page 189 and 190:
JPMorgan Funds - US Value Fund Sche
- Page 191 and 192:
JPMorgan Funds - US Value Fund Sche
- Page 193 and 194:
JPMorgan Funds Appendix - Unaudited
- Page 195 and 196:
JPMorgan Funds Appendix - Unaudited
- Page 197 and 198:
JPMorgan Funds Appendix - Unaudited
- Page 199 and 200:
JPMorgan Funds Appendix - Unaudited
- Page 201 and 202:
JPMorgan Funds Appendix - Unaudited
- Page 203 and 204:
JPMorgan Funds Appendix - Unaudited
- Page 205 and 206:
JPMorgan Funds Appendix - Unaudited
- Page 207 and 208:
JPMorgan Funds Appendix - Unaudited
- Page 209 and 210:
JPMorgan Funds Appendix - Unaudited
- Page 211 and 212:
JPMorgan Funds Appendix - Unaudited
- Page 213 and 214:
JPMorgan Funds Appendix - Unaudited
- Page 215 and 216:
JPMorgan Funds Appendix - Unaudited
- Page 217 and 218:
JPMorgan Funds Appendix - Unaudited
- Page 219 and 220:
JPMorgan Funds Appendix - Unaudited
- Page 221 and 222:
JPMorgan Funds Appendix - Unaudited
- Page 223 and 224:
JPMorgan Funds Appendix - Unaudited
- Page 225 and 226:
JPMorgan Funds Appendix - Unaudited
- Page 227 and 228:
JPMorgan Funds Appendix - Unaudited
- Page 229 and 230:
JPMorgan Funds Appendix - Unaudited
- Page 231 and 232:
JPMorgan Funds Appendix - Unaudited
- Page 233 and 234:
JPMorgan Funds Appendix - Unaudited
- Page 235 and 236:
JPMorgan Funds Appendix - Unaudited
- Page 237 and 238:
JPMorgan Funds Appendix - Unaudited
- Page 239 and 240:
JPMorgan Funds Appendix - Unaudited
- Page 241 and 242:
JPMorgan Funds Appendix - Unaudited
- Page 243 and 244:
JPMorgan Funds Appendix - Unaudited
- Page 245 and 246:
JPMorgan Funds Appendix - Unaudited
- Page 247 and 248:
JPMorgan Funds Appendix - Unaudited
- Page 249 and 250:
JPMorgan Funds Appendix - Unaudited
- Page 252 and 253:
www.jpmorganam.com.hk
- Page 254 and 255:
This report is an abridged version
- Page 256 and 257:
JPMorgan Funds Board of Directors C
- Page 258 and 259:
JPMorgan Funds Board of Directors
- Page 260 and 261:
JPMorgan Funds Board of Directors
- Page 262 and 263:
JPMorgan Funds Board of Directors
- Page 264 and 265:
Audit Report To the Shareholders of
- Page 266 and 267:
JPMorgan Funds Combined Statement o
- Page 268 and 269:
JPMorgan Funds Combined Statement o
- Page 270 and 271:
JPMorgan Funds Combined Statement o
- Page 272 and 273:
JPMorgan Funds Combined Statement o
- Page 274 and 275:
JPMorgan Funds Combined Statement o
- Page 276 and 277:
JPMorgan Funds Combined Statement o
- Page 278 and 279:
JPMorgan Funds Combined Statement o
- Page 280 and 281:
JPMorgan Funds Combined Statement o
- Page 282 and 283:
JPMorgan Funds Statement of Changes
- Page 284 and 285:
JPMorgan Funds Statement of Changes
- Page 286 and 287:
JPMorgan Funds Statement of Changes
- Page 288 and 289:
JPMorgan Funds Statement of Changes
- Page 290 and 291:
JPMorgan Funds Statement of Changes
- Page 292 and 293:
JPMorgan Funds Statistical Informat
- Page 294 and 295:
JPMorgan Funds Statistical Informat
- Page 296 and 297:
JPMorgan Funds Statistical Informat
- Page 298 and 299:
JPMorgan Funds Statistical Informat
- Page 300 and 301:
JPMorgan Funds Notes to the Financi
- Page 302 and 303:
JPMorgan Funds Notes to the Financi
- Page 304 and 305:
JPMorgan Funds Notes to the Financi
- Page 306 and 307:
JPMorgan Funds Notes to the Financi
- Page 308 and 309:
JPMorgan Funds Notes to the Financi
- Page 310 and 311:
JPMorgan Funds Notes to the Financi
- Page 312 and 313:
JPMorgan Funds Notes to the Financi
- Page 314 and 315:
JPMorgan Funds - America Equity Fun
- Page 316 and 317:
JPMorgan Funds - Asia Local Currenc
- Page 318 and 319:
JPMorgan Funds - Asia Local Currenc
- Page 320 and 321:
JPMorgan Funds - Asia Pacific Incom
- Page 322 and 323:
JPMorgan Funds - Asia Pacific Incom
- Page 324 and 325:
JPMorgan Funds - Asia Pacific Incom
- Page 326 and 327:
JPMorgan Funds - Brazil Equity Fund
- Page 328 and 329:
JPMorgan Funds - China Fund Schedul
- Page 330 and 331:
JPMorgan Funds - Eastern Europe Equ
- Page 332 and 333:
JPMorgan Funds - Emerging Europe, M
- Page 334 and 335:
JPMorgan Funds - Emerging Markets B
- Page 336 and 337:
JPMorgan Funds - Emerging Markets B
- Page 338 and 339:
JPMorgan Funds - Emerging Markets D
- Page 340 and 341:
JPMorgan Funds - Emerging Markets D
- Page 342 and 343:
JPMorgan Funds - Emerging Markets D
- Page 344 and 345:
JPMorgan Funds - Emerging Markets E
- Page 346 and 347:
JPMorgan Funds - Emerging Markets E
- Page 348 and 349:
JPMorgan Funds - Emerging Markets L
- Page 350 and 351:
JPMorgan Funds - Emerging Markets L
- Page 352 and 353:
JPMorgan Funds - Emerging Markets O
- Page 354 and 355:
JPMorgan Funds - Emerging Markets O
- Page 356 and 357:
JPMorgan Funds - Emerging Middle Ea
- Page 358 and 359:
JPMorgan Funds - Euroland Equity Fu
- Page 360 and 361:
JPMorgan Funds - Euroland Select Eq
- Page 362 and 363:
JPMorgan Funds - Euroland Select Eq
- Page 364 and 365:
JPMorgan Funds - Europe Dynamic Fun
- Page 366 and 367:
JPMorgan Funds - Europe Dynamic Meg
- Page 368 and 369:
JPMorgan Funds - Europe Dynamic Meg
- Page 370 and 371:
JPMorgan Funds - Europe Equity Fund
- Page 372 and 373:
JPMorgan Funds - Europe Small Cap F
- Page 374 and 375:
JPMorgan Funds - Europe Technology
- Page 376 and 377:
JPMorgan Funds - Germany Equity Fun
- Page 378 and 379:
JPMorgan Funds - Global Consumer Tr
- Page 380 and 381:
JPMorgan Funds - Global Convertible
- Page 382 and 383:
JPMorgan Funds - Global Convertible
- Page 384 and 385:
JPMorgan Funds - Global Dynamic Fun
- Page 386 and 387:
JPMorgan Funds - Global Dynamic Fun
- Page 388 and 389:
JPMorgan Funds - Global Focus Fund
- Page 390 and 391:
JPMorgan Funds - Global Focus Fund
- Page 392 and 393:
JPMorgan Funds - Global Government
- Page 394 and 395:
JPMorgan Funds - Global Government
- Page 396 and 397:
JPMorgan Funds - Global Mining Fund
- Page 398 and 399:
JPMorgan Funds - Global Natural Res
- Page 400 and 401:
JPMorgan Funds - Global Natural Res
- Page 402 and 403:
JPMorgan Funds - Global Real Estate
- Page 404 and 405:
JPMorgan Funds - Global Unconstrain
- Page 406 and 407:
JPMorgan Funds - Global Unconstrain
- Page 408 and 409:
JPMorgan Funds - Hong Kong Fund Sch
- Page 410 and 411:
JPMorgan Funds - Japan Equity Fund
- Page 412 and 413:
JPMorgan Funds - Korea Equity Fund
- Page 414 and 415:
JPMorgan Funds - Latin America Equi
- Page 416 and 417:
JPMorgan Funds - Russia Fund Schedu
- Page 418 and 419:
JPMorgan Funds - Singapore Fund Sch
- Page 420 and 421:
JPMorgan Funds - US Aggregate Bond
- Page 422 and 423:
JPMorgan Funds - US Aggregate Bond
- Page 424 and 425:
JPMorgan Funds - US Aggregate Bond
- Page 426 and 427:
JPMorgan Funds - US Aggregate Bond
- Page 428 and 429:
JPMorgan Funds - US Aggregate Bond
- Page 430 and 431:
JPMorgan Funds - US Aggregate Bond
- Page 432 and 433:
JPMorgan Funds - US Aggregate Bond
- Page 434 and 435:
JPMorgan Funds - US Aggregate Bond
- Page 436 and 437:
JPMorgan Funds - US Aggregate Bond
- Page 438 and 439:
JPMorgan Funds - US Aggregate Bond
- Page 440 and 441:
JPMorgan Funds - US Growth Fund Sch
- Page 442 and 443:
JPMorgan Funds - US Growth Fund Sch
- Page 444 and 445:
JPMorgan Funds - US Small Cap Growt
- Page 446 and 447:
JPMorgan Funds - US Value Fund Sche
- Page 448 and 449:
JPMorgan Funds - US Value Fund Sche
- Page 450 and 451:
JPMorgan Funds Appendix - Unaudited
- Page 452 and 453:
JPMorgan Funds Appendix - Unaudited
- Page 454 and 455:
JPMorgan Funds Appendix - Unaudited
- Page 456 and 457:
JPMorgan Funds Appendix - Unaudited
- Page 458 and 459:
JPMorgan Funds Appendix - Unaudited
- Page 460 and 461:
JPMorgan Funds Appendix - Unaudited
- Page 462 and 463:
JPMorgan Funds Appendix - Unaudited
- Page 464 and 465:
JPMorgan Funds Appendix - Unaudited
- Page 466 and 467:
JPMorgan Funds Appendix - Unaudited
- Page 468 and 469:
JPMorgan Funds Appendix - Unaudited
- Page 470 and 471:
JPMorgan Funds Appendix - Unaudited
- Page 472 and 473:
JPMorgan Funds Appendix - Unaudited
- Page 474 and 475:
JPMorgan Funds Appendix - Unaudited
- Page 476 and 477:
JPMorgan Funds Appendix - Unaudited
- Page 478 and 479:
JPMorgan Funds Appendix - Unaudited
- Page 480 and 481:
JPMorgan Funds Appendix - Unaudited
- Page 482 and 483:
JPMorgan Funds Appendix - Unaudited
- Page 484 and 485:
JPMorgan Funds Appendix - Unaudited
- Page 486 and 487:
JPMorgan Funds Appendix - Unaudited
- Page 488 and 489:
JPMorgan Funds Appendix - Unaudited
- Page 490 and 491:
JPMorgan Funds Appendix - Unaudited
- Page 492 and 493:
JPMorgan Funds Appendix - Unaudited
- Page 494 and 495:
JPMorgan Funds Appendix - Unaudited
- Page 496 and 497:
JPMorgan Funds Appendix - Unaudited
- Page 498 and 499:
JPMorgan Funds Appendix - Unaudited
- Page 500 and 501:
JPMorgan Funds Appendix - Unaudited
- Page 502:
Language Disclaimer Annual