JPMorgan Funds Audited Annual Report - JP Morgan Asset ...
JPMorgan Funds Audited Annual Report - JP Morgan Asset ...
JPMorgan Funds Audited Annual Report - JP Morgan Asset ...

You also want an ePaper? Increase the reach of your titles
YUMPU automatically turns print PDFs into web optimized ePapers that Google loves.
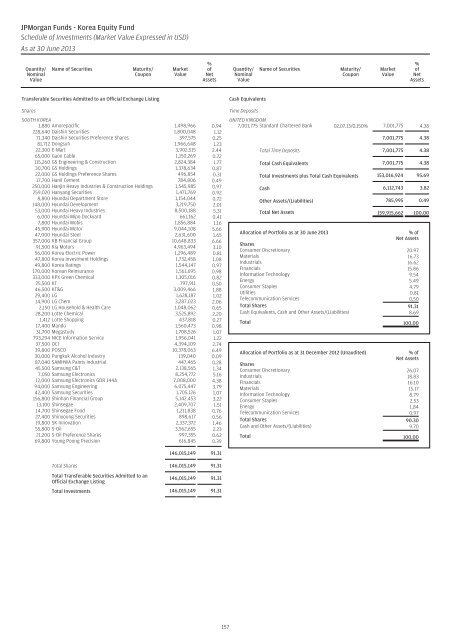
<strong><strong>JP</strong><strong>Morgan</strong></strong> <strong>Funds</strong> - Korea Equity Fund<br />
Schedule of Investments (Market Value Expressed in USD)<br />
As at 30 June 2013<br />
Quantity/<br />
Nominal<br />
Value<br />
Name of Securities<br />
Maturity/<br />
Coupon<br />
Market<br />
Value<br />
%<br />
of<br />
Net<br />
<strong>Asset</strong>s<br />
Quantity/<br />
Nominal<br />
Value<br />
Name of Securities<br />
Maturity/<br />
Coupon<br />
Market<br />
Value<br />
%<br />
of<br />
Net<br />
<strong>Asset</strong>s<br />
Transferable Securities Admitted to an Official Exchange Listing<br />
Shares<br />
SOUTH KOREA<br />
1,880 Amorepacific 1,498,966 0.94<br />
228,640 Daishin Securities 1,800,048 1.12<br />
71,340 Daishin Securities Preference Shares 397,575 0.25<br />
81,712 Dongsuh 1,966,648 1.23<br />
22,300 E-Mart 3,902,515 2.44<br />
65,000 Gaon Cable 1,150,269 0.72<br />
115,260 GS Engineering & Construction 2,824,384 1.77<br />
30,700 GS Holdings 1,378,634 0.87<br />
22,000 GS Holdings Preference Shares 496,854 0.31<br />
17,700 Hanil Cement 784,806 0.49<br />
250,000 Hanjin Heavy Industries & Construction Holdings 1,545,985 0.97<br />
259,020 Hanyang Securities 1,471,769 0.92<br />
8,800 Hyundai Department Store 1,154,044 0.72<br />
148,000 Hyundai Development 3,219,750 2.01<br />
53,000 Hyundai Heavy Industries 8,500,188 5.31<br />
6,000 Hyundai Mipo Dockyard 661,162 0.41<br />
7,800 Hyundai Mobis 1,856,884 1.16<br />
45,900 Hyundai Motor 9,044,108 5.66<br />
47,000 Hyundai Steel 2,631,600 1.65<br />
357,000 KB Financial Group 10,648,833 6.66<br />
91,500 Kia Motors 4,963,494 3.10<br />
56,000 Korea Electric Power 1,296,489 0.81<br />
47,800 Korea Investment Holdings 1,732,458 1.08<br />
49,800 Korea Ratings 1,544,147 0.97<br />
170,000 Korean Reinsurance 1,561,695 0.98<br />
333,000 KPX Green Chemical 1,305,016 0.82<br />
25,500 KT 797,911 0.50<br />
46,500 KT&G 3,009,466 1.88<br />
29,400 LG 1,628,187 1.02<br />
14,900 LG Chem 3,287,023 2.06<br />
2,150 LG Household & Health Care 1,048,062 0.65<br />
28,200 Lotte Chemical 3,525,892 2.20<br />
1,412 Lotte Shopping 437,818 0.27<br />
17,400 Mando 1,560,473 0.98<br />
31,700 Megastudy 1,708,526 1.07<br />
793,294 NICE Information Service 1,956,041 1.22<br />
37,500 OCI 4,394,109 2.74<br />
39,800 POSCO 10,378,063 6.49<br />
30,000 Pungkuk Alcohol Industry 139,040 0.09<br />
87,040 SAMHWA Paints Industrial 447,465 0.28<br />
45,500 Samsung C&T 2,138,565 1.34<br />
7,050 Samsung Electronics 8,254,772 5.16<br />
12,000 Samsung Electronics GDR 144A 7,008,000 4.38<br />
94,000 Samsung Engineering 6,075,447 3.79<br />
42,400 Samsung Securities 1,705,126 1.07<br />
156,800 Shinhan Financial Group 5,142,453 3.22<br />
13,100 Shinsegae 2,409,707 1.51<br />
14,700 Shinsegae Food 1,211,838 0.76<br />
27,400 Shinyoung Securities 898,617 0.56<br />
19,800 SK Innovation 2,337,372 1.46<br />
55,800 S-Oil 3,562,655 2.23<br />
21,200 S-Oil Preference Shares 997,355 0.62<br />
69,800 Young Poong Precision 616,845 0.39<br />
Cash Equivalents<br />
Time Deposits<br />
UNITED KINGDOM<br />
7,001,775 Standard Chartered Bank 02.07.13/0.150% 7,001,775 4.38<br />
7,001,775 4.38<br />
Total Time Deposits 7,001,775 4.38<br />
Total Cash Equivalents 7,001,775 4.38<br />
Total Investments plus Total Cash Equivalents 153,016,924 95.69<br />
Cash 6,112,743 3.82<br />
Other <strong>Asset</strong>s/(Liabilities) 785,995 0.49<br />
Total Net <strong>Asset</strong>s 159,915,662 100.00<br />
Allocation of Portfolio as at 30 June 2013<br />
% of<br />
Net <strong>Asset</strong>s<br />
Shares<br />
Consumer Discretionary 20.97<br />
Materials 16.73<br />
Industrials 16.62<br />
Financials 15.86<br />
Information Technology 9.54<br />
Energy 5.49<br />
Consumer Staples 4.79<br />
Utilities 0.81<br />
Telecommunication Services 0.50<br />
Total Shares 91.31<br />
Cash Equivalents, Cash and Other <strong>Asset</strong>s/(Liabilities) 8.69<br />
Total 100.00<br />
Allocation of Portfolio as at 31 December 2012 (Unaudited)<br />
% of<br />
Net <strong>Asset</strong>s<br />
Shares<br />
Consumer Discretionary 26.07<br />
Industrials 18.83<br />
Financials 16.10<br />
Materials 15.17<br />
Information Technology 8.79<br />
Consumer Staples 2.53<br />
Energy 1.84<br />
Telecommunication Services 0.97<br />
Total Shares 90.30<br />
Cash and Other <strong>Asset</strong>s/(Liabilities) 9.70<br />
Total 100.00<br />
146,015,149 91.31<br />
Total Shares 146,015,149 91.31<br />
Total Transferable Securities Admitted to an<br />
Official Exchange Listing<br />
146,015,149 91.31<br />
Total Investments 146,015,149 91.31<br />
157