Manchester - National Genetics Reference Laboratories
Manchester - National Genetics Reference Laboratories
Manchester - National Genetics Reference Laboratories

Create successful ePaper yourself
Turn your PDF publications into a flip-book with our unique Google optimized e-Paper software.
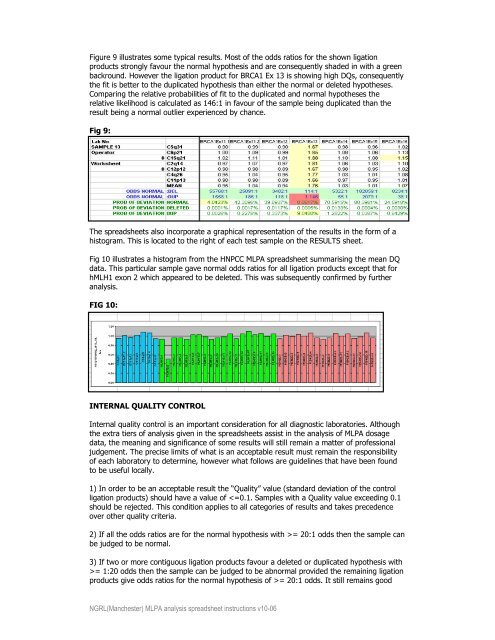
Figure 9 illustrates some typical results. Most of the odds ratios for the shown ligation<br />
products strongly favour the normal hypothesis and are consequently shaded in with a green<br />
backround. However the ligation product for BRCA1 Ex 13 is showing high DQs, consequently<br />
the fit is better to the duplicated hypothesis than either the normal or deleted hypotheses.<br />
Comparing the relative probabilities of fit to the duplicated and normal hypotheses the<br />
relative likelihood is calculated as 146:1 in favour of the sample being duplicated than the<br />
result being a normal outlier experienced by chance.<br />
Fig 9:<br />
The spreadsheets also incorporate a graphical representation of the results in the form of a<br />
histogram. This is located to the right of each test sample on the RESULTS sheet.<br />
Fig 10 illustrates a histogram from the HNPCC MLPA spreadsheet summarising the mean DQ<br />
data. This particular sample gave normal odds ratios for all ligation products except that for<br />
hMLH1 exon 2 which appeared to be deleted. This was subsequently confirmed by further<br />
analysis.<br />
FIG 10:<br />
INTERNAL QUALITY CONTROL<br />
Internal quality control is an important consideration for all diagnostic laboratories. Although<br />
the extra tiers of analysis given in the spreadsheets assist in the analysis of MLPA dosage<br />
data, the meaning and significance of some results will still remain a matter of professional<br />
judgement. The precise limits of what is an acceptable result must remain the responsibility<br />
of each laboratory to determine, however what follows are guidelines that have been found<br />
to be useful locally.<br />
1) In order to be an acceptable result the “Quality” value (standard deviation of the control<br />
ligation products) should have a value of = 20:1 odds then the sample can<br />
be judged to be normal.<br />
3) If two or more contiguous ligation products favour a deleted or duplicated hypothesis with<br />
>= 1:20 odds then the sample can be judged to be abnormal provided the remaining ligation<br />
products give odds ratios for the normal hypothesis of >= 20:1 odds. It still remains good<br />
NGRL(<strong>Manchester</strong>) MLPA analysis spreadsheet instructions v10-06