2013 - Geoinformatics
2013 - Geoinformatics
2013 - Geoinformatics

You also want an ePaper? Increase the reach of your titles
YUMPU automatically turns print PDFs into web optimized ePapers that Google loves.
Magazine for Surveying, Mapping & GIS Professionals<br />
4<br />
June<br />
2 0 1 3<br />
Volume 16<br />
Bentley Pointools V8i Esri <strong>2013</strong> Developer Summit<br />
Going for Gold with LiDAR Intergraph Geospatial <strong>2013</strong>
www.euspaceimaging.com<br />
W<br />
We’<br />
e ve Got<br />
Y Covered<br />
o You Covered<br />
with the most capable constellation available<br />
Expanded<br />
Available from June <strong>2013</strong><br />
Satellite e Const<br />
onstellation<br />
agility<br />
capability<br />
flexibi<br />
lity<br />
2,460 m Millau Viaduct, France, April <strong>2013</strong>, 50 cm, true colour.<br />
Imaged by WorldView-2 satellite.
3<br />
GeoInformatics is the leading publication for Geospatial<br />
Professionals worldwide. Published in both hardcopy and<br />
digital, GeoInformatics provides coverage, analysis and<br />
commentary with respect to the international surveying,<br />
mapping and GIS industry.<br />
GeoInformatics is published<br />
8 times a year.<br />
Editor-in-chief<br />
Eric van Rees<br />
evanrees@geoinformatics.com<br />
Copy Editor<br />
Elaine Eisma<br />
Editor<br />
Remco Takken<br />
rtakken@geoinformatics.com<br />
Contributing Writers:<br />
Paul Ramsey, David Dubovsky Stephen Wood,<br />
Shay Har-Noy, Monica Pratt, Xavier Torret Requena,<br />
Josep Lluís Sala Sanguino, Carlos López Quintanilla,<br />
Robert Widz, Kevin P. Corbley, Urmi Bhattacharjee,<br />
Rick Tingey, John Timar.<br />
Columnists<br />
James Fee, Matt Sheehan, Bart De Lathouwer.<br />
Finance<br />
finance@cmedia.nl<br />
Marketing & Sales<br />
Ruud Groothuis<br />
rgroothuis@geoinformatics.com<br />
Subscriptions<br />
GeoInformatics is available against a yearly<br />
subscription rate (8 issues) of € 89,00.<br />
To subscribe, fill in and return the electronic reply<br />
card on our website www.geoinformatics.com<br />
Webstite<br />
www.geoinformatics.com<br />
Graphic Design<br />
Sander van der Kolk<br />
svanderkolk@geoinformatics.com<br />
ISSN 13870858<br />
© Copyright <strong>2013</strong>. GeoInformatics: no material may<br />
be reproduced without written permission.<br />
P.O. Box 231<br />
8300 AE<br />
Emmeloord<br />
The Netherlands<br />
Tel.: +31 (0) 527 619 000<br />
Fax: +31 (0) 527 620 989<br />
E-mail: services@geoinformatics.com<br />
About present and future<br />
LiDAR technology<br />
LiDAR is short for light detection and ranging. This technology has been around<br />
for about twenty years and, what was initially a technology for topographic mapping,<br />
is now used by many different groups of end users and for many different<br />
applications; a number of which will be covered in this issue. I hasten to add that<br />
these stories are really only the tip of the iceberg. There is a huge amount of additional<br />
information from offline and online sources about the technology, as well as<br />
its applications and related organizations. Additionally, there are special LiDAR<br />
publications, forums, corporate user groups and general events, and much more.<br />
Giving a summarized overview of this whole sector in one issue of this magazine<br />
would be impossible.<br />
The popularity of LiDAR (whether relating to mobile, terrestrial or airborne laser<br />
scanning) is also reflected in the popularity of events such as SPAR Europe, SPAR<br />
International and the International LiDAR Mapping Forum, Intergeo, as well as<br />
corporate events such as Optech, Riegl and Hexagon. Last April the SPAR Group<br />
announced the acquisition of both the International and European LiDAR Mapping<br />
Forum, which means that both these European events will be held together from<br />
11th-13th November in Amsterdam (the North American conferences will be separate<br />
events next year at two different locations).<br />
What is worth a mention is how much the interest in LiDAR has broadened substantially<br />
over the last few years. Take for instance the support for LiDAR in the latest<br />
version of Esri’s ArcGIS software, which undoubtedly will result in greater interest<br />
in LiDAR from a mapping community which used to be preoccupied only with<br />
2D. Another example is Bentley’s software tools geared towards the use of point<br />
clouds. For this issue, I had a chat with Bentley’s Faraz Ravi and discussed Bentley’s<br />
Pointools V8i software, which provides preprocessing of point clouds for downstream<br />
distribution. A recently announced strategic agreement with Trimble makes<br />
sense from a LiDAR view point and seems a very good fit when you look at<br />
Bentley’s position in the virtual design world and Trimble’s very strong presence in<br />
the physical world. Time will tell how this collaboration will work out, but it’s definitely<br />
something of great significance to the community.<br />
When looking at airborne laser scanning, the popularity of UAVs has<br />
given a boost to this technology and will probably continue to do so in<br />
the future. The data volumes are huge and, when considering software<br />
and data standards, it’s impossible to ignore facts on how to effectively<br />
transfer, access, manage and exchange LiDAR data. Yes, this means<br />
data standards will have to be established, and the choice between<br />
proprietary and open source software, as well as limitations of current<br />
IT when talking about performance.<br />
But there’s more. The industry is, on the one hand digesting all the<br />
possibilities that current LiDAR technology provides, but on the<br />
other hand asking for a broader education. This is to ensure<br />
that tomorrow’s workforce will know how to merge data from<br />
a broad range of different sensor types and bring these<br />
together through data fusion. This is a whole other side of<br />
the industry which is of a more academic nature and<br />
will show its commercial applications sooner or<br />
later. In addition to this, your contributions on the<br />
topics discussed in this editorial and the rest of the<br />
magazine are very much welcome in the form of<br />
columns, articles, emails and tweets.<br />
Enjoy your reading,<br />
Photography: www.bestpictures.nl<br />
GeoInformatics has a collaboration with<br />
the Council of European Geodetic<br />
Surveyors (CLGE) whereby all individual<br />
members of every national Geodetic<br />
association in Europe will receive the<br />
magazine.<br />
Eric van Rees
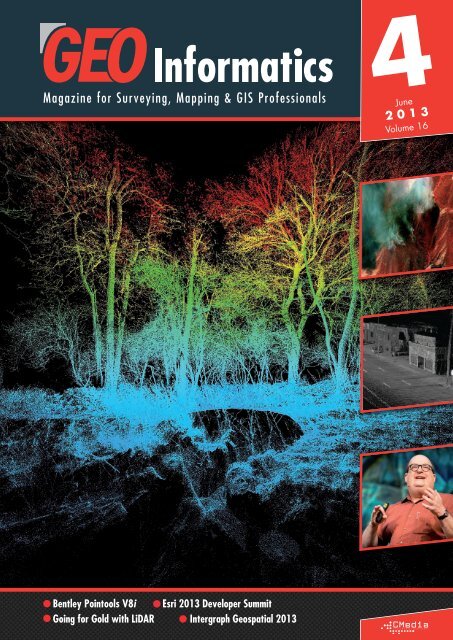
On the cover:<br />
Point cloud colored by height, data acquired with RIEGL VZ-400 Terrestrial Laser Scanner. Multiple<br />
target capability of RIEGL V-Line Laser Scanners enables even detection of small branches and inner<br />
tree structures. Source: Riegl.<br />
A r t i c l e s<br />
A Better World with Enhanced Analytics Capabilities 6<br />
Bentley Pointools V8i 10<br />
Open Source Tools 14<br />
Powering Smarter Decisions 18<br />
Going for Gold with LiDAR 22<br />
Ensuring Seismic Safety 26<br />
Preserving Patagonia National Park 32<br />
Geospatial Software’s Open Future 34<br />
Innovative Mapping in India 44<br />
C o l u m n s<br />
Open GIS Means What? 31<br />
Stars Aligned, finally, for CAD/Civil/Geo Convergence? 37<br />
Mobile, Web and Desktop Apps - Collaborative & Complimentary 49<br />
E v e n t<br />
Esri <strong>2013</strong> Developer Summit 42<br />
I n t e r v i e w<br />
New Appointment at Pitney Bowes Software 28<br />
N e w s l e t t e r<br />
CLGE 46<br />
C a l e n d a r / A d v e r t i s e r s I n d e x 50
The commercial geospatial<br />
6<br />
industry has excelled in meeting<br />
customers’ need for the<br />
quick delivery of satellite imagery,<br />
whether for military, environmental<br />
or humanitarian efforts.<br />
The use of these types of techno-<br />
14<br />
logies provides the user with<br />
technological authority, as well<br />
as transforming him or her into<br />
a provider with added value<br />
and a source of innovation and<br />
development.<br />
Bentley Pointools<br />
10<br />
V8i is a new<br />
software product from Bentley<br />
Systems providing preprocessing<br />
of point clouds for downstream<br />
distribution. It was recently<br />
used in a different context<br />
– a heritage project at<br />
Stonehenge in the United<br />
Kingdom.<br />
Today’s organizations require<br />
18<br />
a new generation of geospatial<br />
solutions that<br />
encompass the full life cycle<br />
of capabilities, from sensors<br />
to apps in the field.<br />
22<br />
McElhanney Consulting Services<br />
Ltd. of Vancouver, B.C.,<br />
Canada, has introduced two<br />
new bare-earth mapping services<br />
developed specifically for<br />
the exploration and exploitation<br />
phases of the mining industry.<br />
Pacific Gas and Electric<br />
Company (PG&E) required<br />
detailed geologic information<br />
of the land around the Diablo<br />
Canyon Power Plant. WSI<br />
conducted an orthophotogra-<br />
26<br />
phy and LiDAR survey of the<br />
area by using the Microsoft<br />
UltraCam Eagle large-format<br />
digital aerial camera and<br />
state-of-the-art LiDAR sensors.<br />
42<br />
Nearly 1,600 members of the<br />
software development community<br />
got a chance to see what’s<br />
under the hood at the Esri<br />
International Developer Summit<br />
(DevSummit), held March<br />
25–28, <strong>2013</strong>, in Palm Springs,<br />
California.<br />
Conservacion Patagonia and<br />
32<br />
its partner organization<br />
Round River Conservation<br />
Studies needed to create a<br />
comprehensive map of the<br />
Patagonia National Park.
6<br />
A r t i c l e<br />
The damage of Hurricane Sandy from Oct.<br />
31, 2012 in Seaside Heights, NJ.<br />
T u r n i n g I m a g e s i n t o A n s w e r s<br />
By Stephen Wood and<br />
Shay Har-Noy<br />
The commercial geospatial industry has excelled in meeting customers’ need for<br />
the quick delivery of satellite imagery, whether for military, environmental or<br />
humanitarian efforts. However, the analytics side of the geospatial industry is<br />
growing in importance. DigitalGlobe’s constellation of five satellites can collect<br />
more than 1 billion square kilometers of imagery per year, but the company is<br />
taking it a step further by applying critical thinking and problem solving to turn<br />
its images into answers.<br />
June <strong>2013</strong>
7<br />
Excelling in the era of analytics<br />
DigitalGlobe keeps a constant eye on the<br />
world to help customers gain an early<br />
insight into the business, military, environmental<br />
and political changes that impact<br />
people around the world. But moving forward,<br />
it is clear that the insight derived from<br />
imagery will become as important as the<br />
pixels themselves. The insight provided by<br />
imagery, geospatial and all source analysts<br />
can make a significant difference in evacuation<br />
planning, disaster response, recovery,<br />
and rebuilding in regions worldwide.<br />
DigitalGlobe plans to continue enhancing<br />
its analytical capabilities to excel in the<br />
increasingly important era of analytics.<br />
As a result of DigitalGlobe’s recent combination<br />
with GeoEye and its acquisition of<br />
Tomnod, a crowdsourced intelligence pioneer,<br />
DigitalGlobe is now a driving force<br />
in the analytics industry. Equipped with a<br />
more advanced satellite collection system<br />
and some of the world’s best geospatial<br />
production and analysis professionals,<br />
Digital Globe can provide timely insights<br />
and information about critical events worldwide.<br />
Using analytics to support disaster<br />
management<br />
DigitalGlobe has a long history of providing<br />
imagery for disasters and crises across<br />
the globe, ranging from war crimes in<br />
Sudan to the wildfire devastation in<br />
Colorado. Satellite images provide an effective<br />
way to gauge the damage from disasters<br />
through comparisons of before-duringand-after<br />
images that geospatial analysts<br />
can use to provide answers to the right people.<br />
In fact, DigitalGlobe’s FirstLook service,<br />
which monitors disasters and crises worldwide,<br />
leverages its satellite constellation<br />
and ground infrastructure to collect and<br />
deliver up-to-date imagery of an event to<br />
customers in as little as four hours.<br />
Before Hurricane Sandy hit the east coast<br />
last October, DigitalGlobe satellites captured<br />
images of the affected areas,<br />
enabling the employment of change detection<br />
to narrow in on the most damaged<br />
areas. After the storm hit, DigitalGlobe’s<br />
analysts quickly staged the before and after<br />
imagery within hours of collection so rescue<br />
workers and relief personnel could<br />
quickly understand the most affected areas<br />
and how to route first responders and relief<br />
supplies.<br />
High Park Fire, Colorado from June 13, 2012.<br />
This image shows the fire’s west and northwest<br />
extents and areas where beetle kill is evident.<br />
In this image the burnt areas are dark blue and<br />
red is healthy vegetation, smoke from the fire is<br />
mostly white.<br />
June <strong>2013</strong>
8<br />
A r t i c l e<br />
DigitalGlobe is driven by its purpose, vision<br />
and values and plans to continue growing<br />
and bringing attention to world issues<br />
through satellite imagery and analysis, helping<br />
first responders on the ground after<br />
major world events.<br />
Tajalei village, Sudan-March 8, 2011: At least 300 buildings at Tajalei village in Sudan’s Abyei region were intentionally destroyed by fire, according<br />
to Satellite Sentinel Project analysis of this DigitalGlobe satellite image, taken March 8 and analyzed by UNITAR/UNOSAT and the Harvard<br />
Humanitarian Initiative, with additional analysis by DigitalGlobe. Roughly two-thirds of those buildings appear to be consistent with civilian residential<br />
structures, known as tukuls.<br />
Adding predictive analytics and crowdsourcing<br />
capabilities<br />
Satellite images can have an incredible<br />
impact in the aftermath of natural disasters<br />
and crises. As satellites get better and better,<br />
mapping accuracy becomes more<br />
important - it’s a central part of what<br />
DigitalGlobe and other industry leaders<br />
have been doing. The data DigitalGlobe<br />
provides is accurate enough for end users<br />
to build maps and projects remotely. This<br />
enables the company to move beyond providing<br />
only raw data to now being able to<br />
deliver insight and analysis that can be integrated<br />
with the imagery. DigitalGlobe has<br />
a constellation of five high-resolution satellites,<br />
a worldwide network of polar and<br />
equatorial remote ground terminals, and billions<br />
of square kilometers of archived, highresolution<br />
imagery. DigitalGlobe analysts<br />
are also capable of examining a crisis situation<br />
and predicting possible outcomes<br />
before and after an event occurs.<br />
Additionally, by acquiring Tomnod, Digital -<br />
Globe can add crowdsourced human analysis<br />
and deliver even more value to customers.<br />
Tomnod has been at the forefront of<br />
innovation in the growing field of crowdsourcing<br />
of earth observation imagery.<br />
Tomnod’s advanced data reliability algorithm,<br />
CrowdRank, ensures that contributions<br />
from the crowd are properly filtered and<br />
weighted to maximize accuracy. By tracking<br />
crowd members’ contributions over time,<br />
CrowdRank is able to rank the individual<br />
members of the crowd by tracking the areas<br />
of agreement and disagreement. This<br />
enables the system to identify inaccurate<br />
and even malicious contributions to truly<br />
leverage the wisdom of the crowd. Digital -<br />
Globe will continue offering Tomnod’s rapid<br />
information capture and validation services<br />
directly to customers. In addition, information<br />
gained by the service will increasingly<br />
act as a key data source for DigitalGlobe’s<br />
analytics team, enabling them to provide<br />
more accurate insight and analysis to customers<br />
faster.<br />
These improvements to DigitalGlobe Ana -<br />
lytics are in support of the company’s vision<br />
of being the indispensable source of information<br />
about our changing planet by 2020.<br />
Seeing a better world with a global<br />
team of experts<br />
DigitalGlobe’s analytics team isn’t only<br />
engaged in times of crisis. Satellite mapping,<br />
imagery and analysis play an important<br />
role in preserving important historical<br />
sites, conserving natural resources and helping<br />
governments in developing countries create<br />
food and water sustainability. Digital -<br />
Globe’s analysts can assist several other<br />
industries beyond government disaster relief,<br />
such as the oil, gas and insurance industry<br />
to determine oil inventory and monitor<br />
insured assets.<br />
Last year, DigitalGlobe delivered high resolution<br />
satellite imagery of significant heritage<br />
sites for the Global Heritage Network,<br />
an early warning monitoring system for<br />
endangered cultural sites. In addition,<br />
DigitalGlobe is currently monitoring 16<br />
glaciers for Extreme Ice Survey and has<br />
been working with the Jane Goodall<br />
Institute for several years, providing satellite<br />
imagery of areas in Tanzania, Uganda and<br />
Congo in order to make effective conservation<br />
decisions.<br />
The new DigitalGlobe analytics team<br />
includes expert analysts from all over the<br />
globe who have experience in disaster management,<br />
predictive analytics and now<br />
crowdsourcing. DigitalGlobe is looking forward<br />
to expanding its value with World -<br />
View-3, which is expected to launch in mid-<br />
2014. The enhanced capabilities of the<br />
WorldView-3 satellite will enable a wider<br />
range of new automated applications in<br />
industries, such as defense, intelligence,<br />
land use, water management, mining, oil<br />
and gas, environmental monitoring, disaster<br />
and humanitarian relief.<br />
Ultimately, DigitalGlobe is equipped to provide<br />
even more answers to customers, helping<br />
them save time, resources and lives.<br />
Every day, the company strives to see a better<br />
world by giving customers the power to<br />
see the Earth clearly and in new ways and<br />
enabling them to make our world a better<br />
place.<br />
Stephen Wood, Vice President of DigitalGlobe Analytics.<br />
Shay Har-Noy, Director of Research and Development at DigitalGlobe.<br />
June <strong>2013</strong>
Complete Solutions<br />
for Mobile Mapping<br />
Lynx Mobile Mapper M1<br />
URBAN ASSETS<br />
UTILITIES<br />
RAILWAY<br />
. - , +* ) ( , ' - +& % $ # +" ! , +" ) ) , +" + +( - , + $ ( % + ! , , ' ( $ ' , + ' , + $ + , ( , + , - ' , +( ' <br />
( , ( + $ + ! ( +, ' , $ ( + ! , + + ) ) $ + % $ ( , +) + ! $ ( +' ! + ) % +' ! $ +( - ( +% ! , + , ( ( $ + - <br />
( - + $ ' , , + , ( + $ + , , , $ ( + ( , +! + ) % +( ! ! + +, # ) , ' ( + $ +( - , + , % + ( , $ , + ( + $ + +<br />
! $ , + ! $ + , , , $ ( +) , + , ' ! $ +. - + ' - , , ' ! , $ )( + ' ( +) ! , ' ( + , , , +<br />
, +( - , + % + $ +( ! % + + $ , ( ) + ('-,<br />
+ % +<br />
! +) ! , ' ( + $ , +* ) ( , ' - + , , +) , ' , + ' ' <br />
' , + ' $ $ , + $ + ' , +' ! $ ( ! $ + ,<br />
<br />
<br />
$<br />
<br />
<br />
,<br />
+ ,<br />
<br />
!<br />
+<br />
, , , $ ' , + ) ( + ( + ! + , % ! + ! <br />
( - , + , ( +$ , , , + ! +( - , + ! ( + , $ $ +) ! , ' ( * ) ( , ' - + , , + , +- , + ( - + , , + ) ) !<br />
, # ( % + + , % + ( - +' ! $ , + ' $ $ , + ! $ ( $ + $ + <br />
! , $ ( ( ! $ +& % $ # + ) ( + ' % +( ! + ) , ' , + ( - , + $ ( % + , $ + ! + +<br />
, , , $ ( + , $ , ( $ + ' - + , % , + + $ ) ) ! + ( <br />
, + ( + ! + ! ( + $ % + ! $ + , - ' , + $ ' <br />
Engineered.<br />
$ +<br />
Integrated. Supported.<br />
! ( +. $ ) , $ ( +' ( ! $ + $ + ! , - ( $ + , ( +% ! +<br />
$ , ( $ +( - , + ' ' ' % +! +% ! + % ( , + ( +, , % + ( , ) +<br />
, + ' $ $ $ + , , + ) , , + , ( + ! +<br />
June 25-27<br />
Toronto, Canada<br />
www.optech.com/<br />
ilsc<strong>2013</strong><br />
www.optech.com
10<br />
A r t i c l e<br />
By Eric van Rees<br />
Bentley Pointools V8i is a new software product from Bentley Systems providing<br />
preprocessing of point clouds for downstream distribution. It was recently<br />
used in a different context – a heritage project at Stonehenge in the United<br />
Kingdom – that resulted in the discovery of 71 carvings of Bronze Age axes not<br />
previously seen for more than three thousand years.<br />
Bentley Pointools V8i<br />
P o i n t C l o u d s , A p p s , a n d M o r e<br />
An important feature of Bentley Pointools V8i is its ability to layer the data into different, more logical layers, making it much easier to visualize and work with them.<br />
Recently, Bentley Systems an -<br />
nounced a new release of Bentley<br />
Pointools V8i and two new iWare<br />
apps, followed by a new release<br />
of Bentley Descartes in April.<br />
Faraz Ravi, Bentley director, product management<br />
for point-cloud technology,<br />
explains how these product offerings complement<br />
each other and discusses the<br />
Pointools V8i release and its complementary<br />
iWare apps. Also covered are issues with<br />
navigating point clouds and a recent heritage<br />
project at the Stonehenge site in the<br />
United Kingdom.<br />
Bentley Pointools V8i and iWare Apps<br />
Point clouds have become both vital and<br />
pervasive in infrastructure design and man-<br />
June <strong>2013</strong>
11<br />
Faraz Ravi<br />
Object animation in Bentley Pointools V8i.<br />
agement use cases. Bentley Systems has<br />
acknowledged this and created a number<br />
of product offerings that facilitate the use of<br />
point cloud files in various ways. A new,<br />
recent offering is Bentley Pointools V8i,<br />
which was released in January <strong>2013</strong> and<br />
is geared towards point-cloud-centric workflows.<br />
The product now includes point-cloud<br />
differencing and clash detection functionality.<br />
This makes differences and clashes easy<br />
to detect and visualize. Commenting on the<br />
release, Ravi says: “Bentley Pointools V8i is<br />
a stand-alone product that offers a very highperformance<br />
environment in which users<br />
perform editing operations, and produce<br />
communication and simulation content from<br />
the point clouds.”<br />
But the most important feature of Bentley<br />
Pointools V8i is the ability to arrange the<br />
data into different, more logical layers, making<br />
it much easier to visualize and work with<br />
them. Says Ravi: “For example, if you have<br />
an oil rig and want to be able to separate<br />
out the different floors, or you have aerial<br />
LiDAR data and you grid that into different<br />
grid cells, this can be done with Bentley<br />
Pointools V8i.”<br />
Released simultaneously with Bentley<br />
Pointools V8i were two iWare apps: Bentley<br />
Pointools View and Bentley Pointools<br />
PODcreater. Bentley Pointools View is meant<br />
for point-cloud data visualization and sharing<br />
and Bentley Pointools PODcreator for<br />
converting laser scans to the POD file format.<br />
Ravi: “The Bentley Pointools POD -<br />
creater app is geared towards the batch<br />
conversion of different file formats into the<br />
POD format. This is for users who don’t necessarily<br />
want to consume a Pointools V8i<br />
license with a conversion process that can<br />
take time when the files are large. To enable<br />
users to do that offline, take advantage of<br />
When asked how this product relates to<br />
Bentley’s existing product offerings that<br />
involve point-cloud use (Bentley Descartes,<br />
ProjectWise Point-cloud Services, and<br />
Bentley Map), Ravi answers that Bentley<br />
Pointools V8i is being used higher up in the<br />
workflow than the other three product offerings,<br />
which are for infrastructure design<br />
workflows. Ravi: “Bentley Pointools V8i is<br />
perhaps slightly closer to collecting and processing<br />
and using point-cloud data, which<br />
can then be used in design workflows in<br />
Bentley Map and Bentley Descartes, and<br />
can be shared through and integrated with<br />
ProjectWise Point-cloud Services. This is possible<br />
as all the applications are using the<br />
POD file format.”<br />
Clash detection<br />
June <strong>2013</strong>
12<br />
A r t i c l e<br />
the ability to batch the process, and have a<br />
repeatable process, we offer Bentley<br />
PODcreater.”<br />
POD File Format<br />
Bentley Systems uses the POD file format for<br />
all of its point-cloud offerings, so that these<br />
can be used in different environments. Ravi<br />
points out that the POD file format was<br />
designed for extremely fast access from disk<br />
and is structured in that way.<br />
Since point-cloud files tend to be very large,<br />
the question arises as to how Bentley<br />
Systems achieved such high performance in<br />
rendering point-cloud files. Ravi points out<br />
that this is achieved by focusing on various<br />
bottlenecks in the disk to screen visualization,<br />
in particular file read speed. Ravi: “In<br />
order to be able to load the data quickly,<br />
we have to employ techniques like compression<br />
and structure the data correctly so we<br />
can access the parts that we need when we<br />
need them.”<br />
Thus, many factors influence the user experience.<br />
But there’s also another element to<br />
this issue, which is very important and often<br />
overlooked – user perception. Ravi: “This is<br />
about how the user experiences the performance<br />
and usability of the product. As you<br />
navigate around a point cloud, Bentley<br />
Pointools is maintaining visual density by<br />
“If you have surface normals from the point cloud, you can<br />
apply lighting to that. In Bentley Pointools, you can virtually<br />
move an object around at different angles to the light and<br />
balancing point density and point size while<br />
maintaining a high frame rate to deliver the<br />
fluid experience.”<br />
The Stonehenge Heritage Project<br />
Bentley Pointools’ visualization technology<br />
was recently used for a heritage project at<br />
Stonehenge, one of the world’s oldest built<br />
environments. The technology was used to<br />
visualize and analyze the most detailed<br />
laser scan survey ever conducted of this historic<br />
site.<br />
The laser scan resulted in an enormous data<br />
resource of 850 gigabytes. Preliminary<br />
to help interpret the geometry.”<br />
examination of the meshed models identified<br />
individual tool marks over 5,000 years<br />
old, but it was evident that the data contained<br />
more prehistoric artwork carved onto<br />
the surface of the stones. The research team<br />
decided to visualize the original point-cloud<br />
data and created a workflow using Bentley<br />
Pointools for the preprocessing of point<br />
clouds. The software’s shading function was<br />
instrumental in visualizing the most subtle<br />
features, which resulted in the discovery of<br />
71 carvings of Bronze Age axes not seen<br />
for more than three thousand years.<br />
The project received a lot of press. Ravi<br />
explains that Pointools has a proven track<br />
record in the heritage field: “The Stone -<br />
henge project was quite interesting and<br />
unique because of the level of detail<br />
reached, and the project team specified a<br />
very dense point cloud on those stones. It<br />
was important to use a tool that could work<br />
effortlessly with large amounts of data, and<br />
that’s why Bentley Pointools was selected.”<br />
What the researchers were looking for was<br />
deviation from the surface of the stones,<br />
which would not be visible to the naked eye,<br />
but could possibly be picked up computationally.<br />
The shading tools that they used<br />
would shade across human distance and on<br />
any plane. They were able to pick up patterns<br />
of heathen markings, which would<br />
have been impossible to do using other techniques.<br />
Finally, another shading tool was<br />
used for lighting. Ravi: "If you have surface<br />
normals from the point cloud, you can apply<br />
lighting to that. In Bentley Pointools, you can<br />
virtually move an object around at different<br />
angles to the light and to help interpret the<br />
geometry."<br />
Rock art on stones from the Stonehenge project<br />
For more information, have a look at www.bentley.com/pointools<br />
June <strong>2013</strong>
14<br />
A r t i c l e<br />
By Xavier Torret<br />
Requena, Josep Lluís Sala<br />
Sanguino and Carlos<br />
López Quintanilla<br />
This article presents a management model about open source technologies for<br />
the consideration of the government. The use of these types of technologies provides<br />
the user with technological authority, as well as transforming him or her<br />
into a provider with added value and a source of innovation and development.<br />
In addition, in Public Administration, when attempting to implement these types<br />
of tools, a new framework is created whereby new relationships with suppliers,<br />
based on information sharing, is established. The training of the municipal manager<br />
is a key element in implementing this change.<br />
Open Source Tools<br />
A R e a l i t y f o r L o c a l M a n a g e m e n t<br />
3. Freedom to study. The source code is available. How it has been<br />
created can be studied and an understanding of all of its structure<br />
can be obtained.<br />
4. Freedom to Modify. As there is access to the source code, it can be<br />
changed for improvements or customizations, and the new code will<br />
also be free and accessible.<br />
The only restriction imposed by free software is that it cannot be privatized.<br />
Free software will always be free.<br />
There are many examples of free software, from technology for Apache<br />
servers to operating systems such as Linux corporate databases such<br />
as MySQL, Postgre SQL, Desktop programs such as Openoffice, gvSIG,<br />
or Mozilla Firefox, as well as other types of content management technologies<br />
such as Moodle, Drupal or Joomla.<br />
Interface gvSIG Management System of Urban Pavement<br />
Introduction<br />
The objective of this paper is to present public officials with as much<br />
information as possible on open source technologies and the benefits<br />
obtained by opting for this type of technology. This document focuses<br />
on the management of urban services, where a great deal of responsibility<br />
is assigned to the manager, rather than the city, and where the<br />
efficiency and quality of service can be monitored by the public.<br />
Open Source Tools<br />
Open Source Tools are applications whose sources are freely released:<br />
– only software that is free can be freely released, and this is carried<br />
out through licenses that comply with the following four freedoms:<br />
1. Freedom of use. They can be used as many times, as often and for<br />
as long as desired.<br />
2. Freedom of distribution. They can be distributed to as many others<br />
as want to use them and as many copies as desired.<br />
Advantages of using open source tools<br />
These tools are a reality of the present, but more importantly the choice<br />
of the future; an option which will allow us to put effort into what really<br />
matters. In this sense, the software which will manage the information<br />
will not be as relevant as the data generated. Without a doubt, the<br />
data will be the most important.<br />
As these tools are open source and comply with interoperability standards,<br />
they provide us with the independence of the supplier, and thus<br />
we can have a broad professional structure at our disposal which<br />
always offers the best technical service possible.<br />
As they are free sources, they allow for scalable implementation, which<br />
will allow us non-convulsive migration living with proprietary models.<br />
Additionally, we can align the functionalities to the necessary services,<br />
which means that we will have software adapted to our needs.<br />
As there are no license costs, the savings we make will allow us to<br />
change spending into investment, enabling the training of employees<br />
or contracting businesses and local personnel. This approach will provide<br />
new opportunities. Free software provides opportunities.<br />
Finally, we should point out some further ideas to break away from the<br />
myths which have historically been associated with free software.<br />
June <strong>2013</strong>
15<br />
- Free software is of poor quality. A program will be good or<br />
bad depending on how it is made. This has nothing to do with whether<br />
this software is then freely released or not.<br />
- Free software is not professional. Free software generates a<br />
business model based on sharing knowledge, innovation and supporting<br />
the development and implementation of the software. This business<br />
model facilitates the proliferation of a business network with added<br />
value and a high degree of professionalism. Although this structure<br />
exists, there is no doubt that it is difficult to measure and quantify. In<br />
any case, a clear example is the gvSIG. Association with its 40 associate<br />
members, doing business around the ecosystem generated by Free<br />
Geographic Information Systems gvSIG.<br />
-With free software I will not get good technical support.<br />
This doubt can be cleared up not only by taking into account the professional<br />
structure discussed in the previous point, but also by simply<br />
signing up to any mailing list and, thereby observing the technological<br />
sovereignty of this software. This is apparent in the number of professionals<br />
within the community, who are using it and, thereby, making it<br />
become the best service imaginable.<br />
- Not everything can be done with free software. This is,<br />
indeed, true and currently there are some applications which cannot<br />
be replaced with the level of demand and usability that may be<br />
required, but this isn’t a reason not to freely use what is available<br />
for use. In this regard, it is important to be aware of our needs and,<br />
above all, to begin to use technology based on our real requirements<br />
and the objectives we want to achieve.<br />
Components of an integrated management system<br />
Urban services are those whose aims are to provide a service for the<br />
public welfare and to serve the community in any public aspect. There<br />
are areas of software application where free technology already has<br />
the same or a better level of development and usability than private technology.<br />
Corporate Databases or technologies which publish maps are<br />
examples of this scenario.<br />
This breakthrough in technology makes us want and even foresee that<br />
this equalization in the short and medium term can be complete in all<br />
modalities. However, in applications areas where further development is<br />
required, such as Geographic Information Systems (GIS), it is worth noting<br />
that currently there are free professional tools available which are of<br />
high value and have enormous potential use, as is the case in gvSIG.<br />
Below, a series of concepts are defined which will be used in this paper<br />
and which should be clarified and explained in further detail:<br />
Geographic Information Systems (GIS).<br />
Geographic Information Systems are a highly valued tool for managing<br />
information linked to territory. In this sense, they are being used in<br />
different fields where the analysis of spatial information has had special<br />
importance. These fields include the relationship with the environment,<br />
forestry, socio-economic applications, etc.<br />
In this sense, 80% of the information managed by the local administration<br />
can be georeferenced.<br />
Corporate Databases<br />
A dataset is made of one context and stored systematically for later<br />
use. There are programs called database management systems (DBMS)<br />
to store and subsequently access data quickly and in a structured way.<br />
The main features of these technologies are that they have multiple<br />
users, they can apply SQL statements, allow for simultaneous work,<br />
allow synchronization and backup, and the information is stored in<br />
one format and in a centralized format.<br />
gvSIG Interface of our Network<br />
Publication of maps services<br />
A publication service is a tool to connect GIS to share information with<br />
the community, whether externally or internally. The type of information<br />
which can be shared has to be placed in a relational database. All types<br />
of technology related to the publication of maps can be connected and<br />
integrated to this type of database, for example Web Map Service<br />
(WMS), Web Feature Service (WFS) Web Coverage Service (WCS),<br />
Catalogue Web Systems (CWS) or Web Map Tile Service (WMTS).<br />
Management Systems<br />
With a relational database, we can connect and integrate all kinds of<br />
management technologies such as acquisition systems and data acquisition<br />
(SCADA) systems, content management (CMS), the customer management<br />
systems (ERP and CRM) or the maintenance and management<br />
systems (CMMS).<br />
Introduction to Municipal Management<br />
Before delving into the world of municipal services, it is interesting to<br />
take into account other opportunities provided by GIS that pertain to<br />
Local Government. In this sense we can efficiently manage categories<br />
of information such as those explained below:<br />
Cartography and Map of the city<br />
GIS is useful to access, visualize and consult all kinds of map information<br />
and the map of a city in a simple and ordered fashion, which will<br />
always be georeferenced. We could have, for example Cadastre,<br />
Urban Planning Information, property, goods catalogs, orthophotomaps<br />
of topographic maps, etc.; all in different series and different scales<br />
and several possibly in published map service (WMS or WFS).<br />
Urban Management<br />
It will also be useful for urban management, including discipline, planning,<br />
and licensing. In this sense we can have land use or zoning with<br />
information from each of the zones and, for example, produce statistics<br />
of numeric fields such as area, population, height, etc.<br />
The gvSIG 3D module allows for three-dimensional volumetric management<br />
on the basis of an elevation model. Therefore, we can plan the<br />
city in height, taking into consideration the orography terrain by analyzing<br />
the view shed from different points and thus design the city volumetrically<br />
and scenically.<br />
Inventory activities<br />
Another interesting field to include is the economic activities that occur<br />
in the municipality. For example, there can be a layer with the industrial<br />
activities and another with the commercial activities, each one with<br />
its own data base.<br />
June <strong>2013</strong>
16<br />
A r t i c l e<br />
EPA SWMM Interface of our network<br />
This offers the possibility of a global analysis of all of the activities, as<br />
well as a level of compliance with various regulatory aspects which<br />
can store all kinds of information.<br />
In this sense we can provide municipal inspectors with this tool for fieldwork,<br />
which will enable them to instantly analyze and edit information.<br />
Application in Urban Service Management<br />
There is no doubt that we are emerging from an era with a solid investment<br />
in new infrastructures, and that we are entering into another era<br />
where there will be a demand for optimal management of economic<br />
resources in order to maintain them. GIS will allow us to manage assets,<br />
through careful planning and analysis, monitor operations and enable<br />
their interaction with other technologies.<br />
For asset management, we will have to know what we have (inventory<br />
of each of the different elements). Once inventoried, we can plan and<br />
analyze; in this case performing multi-scenario analysis (levels of service,<br />
conservation, regulatory compliance, efficiency) in order to plan<br />
investments in operation and maintenance based on this analysis.<br />
We may also include monitoring operations with query interfaces and<br />
custom forms for this purpose, and finally make a documentary record<br />
of all events and actions that occur to the infrastructure, whether they<br />
interact or not with other technologies.<br />
Below, we can observe in detail how GIS can provide support in each<br />
of the different areas of urban service management.<br />
• Public roadway services<br />
With regard to public roadway services, a Management System of<br />
Urban Pavements can be found in gvSIG. Each of the elements that<br />
comprise this system, such as sidewalks or curbs, can be inventoried in<br />
pieces to later provide the user with a comprehensive and customized<br />
data model. This data model can have tables with characteristics, such<br />
as the dimensions, materials or geometries and also tables to store<br />
information that may evolve over time, such as the state of conservation<br />
or cleanliness, etc.<br />
All of this information will allow us to obtain an overview of the infrastructure<br />
to determine some service indexes of these services. These service<br />
indexes are based on all of the information of the pathologies<br />
gathered in the field, which will apply to evolution models. This makes<br />
planning conservation actions possible, with technical criteria, by optimizing<br />
the economic resources available for this purpose.<br />
Finally, it is also possible to have information on the degree of accessibility<br />
of the routes. This can be obtained by simply incorporating the<br />
necessary information, such as the minimum dimensions or elements<br />
which could limit such access into the data model when performing an<br />
inventory in the field.<br />
• Sewerage and Urban Drainage<br />
As for the infrastructure, our elements’ catalogue will be comprised of<br />
the major entities such as: wells, pipes, scuppers, water supply or singularities,<br />
as well as the elements necessary for mathematical modeling.<br />
Our topological construction will be carried out with the classical<br />
arc-node GIS that will provide us with a series of management facilities,<br />
including being able to use network extensions developed in gvSIG<br />
for any network analysis with this topology.<br />
For this purpose, using the 'connectivity' tool, we can analyze the sections<br />
of network to remain upstream or downstream from a given point<br />
and, in this way, plan various maintenance operations.<br />
Additionally, it would be useful if this infrastructure was connected with<br />
technologies for mathematical calculations of our network. In this specific<br />
case, this will be possible with gvSIG and EPA SWMM, as our<br />
team has specifically developed the INPcom communication extension<br />
that will allow for this.<br />
EPA SWMM is a calculating code developed by the U.S. E.P.A.,. The<br />
first version was released in 1971. One of its main advantages is being<br />
able to calculate up to an unlimited number of sections and to have a<br />
stable and robust code for hydrology, hydraulic or water quality. It<br />
does have a drawback, however, and this is that it does not have a<br />
GIS interface. With the developed extensions we can overcome this<br />
weakness, by combing both programs into a powerful tool for calculating<br />
and analyzing all types of sewerage and urban drainage.<br />
• Drinking Water Supply and non-consumption use<br />
The drinking water service supply can also be integrated into gvSIG,<br />
and as with the sewerage and urban drainage, we can outline our<br />
installation over the topographic base and communicate with EPANET<br />
code a program that is also USEPA, to analyze the networks of drinking<br />
water supply, provided that this exportation is also possible thanks<br />
to the INPcom extension.<br />
Based on Arc-node topology with which we will be working, all of the<br />
analysis potential of the gvSIG network extensions will also be operational<br />
for this service. Obviously the management of a drinking supply<br />
network can incorporate a lot of complicated technical technology<br />
depending on the information that you want to manage with it. It is<br />
important to mention that the tracking of operations can be carried out,<br />
such as communicating customer management software (CMS) with<br />
our database, which will give us access to the full potential of geographical<br />
management of such networks.<br />
Starting is easy<br />
The degree of complexity which can be achieved with this management<br />
system depends on the needs of the service be covered. The fact<br />
that we can carry out a scalable implementation, allows us to propose<br />
the first step, in which we only use a Geographic Information System<br />
(GIS) and to add technologies at a later date, as needs dictate.<br />
In this sense, after a GIS, we can consider implementing a relational<br />
database to connect field elements, publish maps, or connect with<br />
advanced management systems at a later date. We would like to make<br />
it clear that beginning is easy. It can be done at no cost, where the<br />
only investment is in education. Most importantly, we can get you started<br />
and we can do it now.<br />
Xavier Torret Requena, xtorret@tecnicsassociats.com.<br />
Josep Lluís Sala Sanguino, jlsala@tecnicsassociats.com,<br />
TECNICSASSOCIATS, ARQUITECTURA, ENGINYERIA I GIS<br />
Carlos López Quintanilla carlos.lopez@psig.es<br />
June <strong>2013</strong>
18<br />
A r t i c l e<br />
By Robert Widz<br />
Today’s organizations require a new generation of geospatial solutions that<br />
encompass the full life cycle of capabilities, from sensors to apps in the field.<br />
Such geospatial solutions are founded on one simple premise, namely connecting<br />
users to the right tools and information they need to make smarter decisions –<br />
whether as a member of the public needing a service or as an engineer reducing<br />
water leakage.<br />
Powering Smarter Decisions<br />
I n t e r g r a p h G e o s p a t i a l 2 0 1 3<br />
This shows a classified LiDAR dataset of a power line corridor with the ground class turned off. We see the planimetric view and 3 profile views,<br />
and we are measuring encroaching vegetation.<br />
Changing the Status Quo<br />
Throughout past decades, incremental evolution<br />
of departmental systems has given rise<br />
to information silos. This unintentional separation<br />
delays or limits the delivery and use<br />
of valuable information. Intergraph’s <strong>2013</strong><br />
Geospatial Portfolio eliminates these information<br />
and processing silos that have existed<br />
between conventional GIS, remote sensing,<br />
and photogrammetry software, and<br />
provides the flexibility demanded of modern<br />
ICT.<br />
The portfolio combines best-in-class, end-use<br />
products for all three disciplines with enterprise<br />
geospatial information management<br />
and flexible delivery across desktop, web,<br />
and mobile. This enables organizations to<br />
simplify and control how data and workflows<br />
are maintained, shared, accessed,<br />
and applied – satisfying the most demanding<br />
and diverse user base.<br />
Embracing a Changing Marketplace<br />
The past decade has seen the predictable,<br />
albeit accelerating, cycle of computing platform<br />
evolution, which has given way to an<br />
explosion of operating systems, networks,<br />
and devices. Unlike its IT peers, GIS solution<br />
providers have been slower to adapt to<br />
marketplace changes. This is a risky strategy<br />
in such a dynamic industry awash with<br />
new and disruptive offerings – the cloud,<br />
new mobile platforms, open source, and<br />
consumer mapping, just to name a few. To<br />
survive an increasingly crowded and commoditized<br />
sector, GIS providers need to<br />
embrace change and develop specialized<br />
capabilities that closely match specific enduse<br />
needs.<br />
To move with the rapidly changing market,<br />
Hexagon AB acquired Intergraph in 2010<br />
at a time when Intergraph was building<br />
more depth to its product offerings – both in<br />
core geospatial capabilities, but also in their<br />
application to specific industry needs, from<br />
asset infrastructure operation to public safety<br />
incident management. The foundation of<br />
Hexagon’s strategy was for it to complete<br />
its own geospatial software offering,<br />
expanding upon the remote sensing and<br />
photogrammetry expertise in its existing<br />
companies, ERDAS and Leica Geosystems.<br />
The overall capabilities of the collected businesses<br />
under Hexagon can now address<br />
complete enterprise workflows previously<br />
only conceivable as large-scale, custom integration<br />
projects. The collaborative effort<br />
between the various Hexagon companies is<br />
focused on increasing automation, effectiveness,<br />
and efficiency. The objective is to cut<br />
the cost and time between detecting change<br />
in the real world and making that information<br />
readily available to decision-makers.<br />
For example, Leica Geosystems has long<br />
been a leader in the machine control field,<br />
automating farm equipment such as tractors<br />
and applicators via guidance and control<br />
systems. By adding Intergraph’s GIS and<br />
data analysis capabilities, the workflow is<br />
expanded, allowing farmers in the field to<br />
June <strong>2013</strong>
19<br />
not only collect information, but also perform<br />
in-depth crop yield analysis, transforming<br />
massive amounts of data into useable<br />
information.<br />
The acquisition also transformed Intergraph<br />
internally. Hexagon already owned the leading<br />
remote sensing software provider, ERDAS,<br />
and its integration into Intergraph created a<br />
unique scope of capabilities (spanning GIS,<br />
remote sensing, and photogrammetry). The<br />
new <strong>2013</strong> Geospatial Portfolio represents<br />
the culmination of this work, unifying both<br />
the ERDAS and GeoMedia product families<br />
as a great enterprise solution.<br />
A Changing User Base –<br />
Creating a Modern<br />
Geospatial Experience<br />
Today, user expectations for software<br />
applications change at a<br />
dramatic pace. End-users now<br />
demand simple solutions that<br />
are dynamic and work in any<br />
environment. Simply put, users<br />
expect clever and well-designed<br />
desktop, web, and mobile products.<br />
In addition, a new and young<br />
generation of users is entering<br />
the workforce, bringing change<br />
to mature markets and driving<br />
emerging markets. With<br />
advanced and different expectations<br />
of how software applications<br />
should work and operate,<br />
this new generation has been<br />
moulded by the proliferation of<br />
This shows a Mobile LiDAR dataset in 3D colored by Intensity.<br />
This shows a LiDAR dataset that has been RGB encoded in 2D and 3D.<br />
elegant and highly intuitive “apps.”<br />
When presented with conventional GIS<br />
package designed for niche, specialized<br />
users, this new generation disengages, productivity<br />
suffers, and projects get delayed.<br />
To meet this need, geospatial providers need<br />
to embrace a rebirth, and essentially reinvigorate<br />
systems initially created in the<br />
1990s.<br />
With this in mind, Intergraph has adopted<br />
a modern and fresh approach for its geospatial<br />
portfolio – essentially redefining how<br />
geospatial workflows can be streamlined to<br />
improve productivity, lower training costs,<br />
and increase utilization. The refined, yet simple,<br />
experience makes it faster for users to<br />
both create reliable data and gain greater<br />
insight from multi-source content.<br />
Dynamic GIS in a Dynamic World<br />
Global events are continually shifting. From<br />
natural disaster to economic crisis to international<br />
conflict, organizations need to be nimble<br />
to stay ahead of changes that could result<br />
in severe financial, social, or political<br />
impacts. Geospatial solutions are the fundamental<br />
underpinning for all organizations’<br />
decision-making. Whether it is tracking assets<br />
in the field or gaining full situational awareness<br />
during a hurricane, smart organizations<br />
look to dynamic geospatial tools that can be<br />
leveraged across the entire enterprise.<br />
With this in mind, the Intergraph <strong>2013</strong><br />
Geospatial Portfolio supports critical decision-making<br />
in time-sensitive situations by<br />
providing powerful solutions for creating,<br />
analyzing, and extracting information from<br />
dynamic, multi-source content. The complete<br />
portfolio allows organizations to securely<br />
manage and rapidly deliver geospatial<br />
information products integrated with other<br />
forms of business data – both inside and outside<br />
of the organization.<br />
Recognizing the significance of this in<br />
today’s rapidly transforming world has<br />
resulted in new expectations for information<br />
on-demand, delivered in a context and<br />
application-relevant form to the field, office,<br />
or online. Contemporary geospatial solutions<br />
are designed to meet this expectation<br />
and allow organizations to be more agile<br />
and respond effectively when faced with<br />
change.<br />
June <strong>2013</strong>
20<br />
A r t i c l e<br />
The Emergence of “Smart Maps”<br />
With this unified, modern, and dynamic<br />
approach to developing and integrating our<br />
full product portfolio, Intergraph fully supports<br />
the development and use of “smart<br />
maps.”<br />
This next-generation approach to GIS breaks<br />
down all barriers and unleashes the power<br />
of geospatial solutions to anyone, anywhere.<br />
For example, smart maps draw from<br />
the most current sources of information available<br />
to synthesize a multi-dimensional view<br />
of the world. They are also highly accurate,<br />
enabling smarter decisions from high-fidelity<br />
content sources fused together.<br />
The information contained within a smart<br />
map is application and context specific,<br />
enabling it to reflect the needs of a customer’s<br />
unique workflow. As the world<br />
changes, smart maps are actively updated<br />
by combining multi-source content from sensors,<br />
business intelligence, databases, web<br />
services, social media, and multimedia.<br />
Ultimately, we live in a completely mobile<br />
world where smart maps can be taken anywhere<br />
and accessed everywhere.<br />
Successful geospatial solutions need to be<br />
dynamic, easy to use, and accessible across<br />
entire organizations. As the world keeps<br />
changing, so, too, will the right solutions that<br />
enable global organizations to be more<br />
effective in meeting mission requirements,<br />
GeoMedia <strong>2013</strong> introduces the user to a new<br />
ribbon interface styled after other professional<br />
applications like Microsoft Office.<br />
The ability to customize the toolbar makes<br />
it easier for users to define the specific<br />
workflows.<br />
addressing their customers’ needs, and realizing<br />
their business goals.<br />
Intergraph’s aim with the Intergraph <strong>2013</strong><br />
Geospatial Portfolio is to do precisely this,<br />
and the company looks forward to an exciting<br />
time ahead.<br />
Robert Widz, Executive Director, Geospatial for Europe, the Middle<br />
East and Africa at Intergraph SG&I.<br />
Perspective views of the new Semi Global Matching Algorithm output, available in the latest release of ImageStation Automatic Elevations Extended, displayed in ERDAS IMAGINE’s Point Cloud viewer<br />
June <strong>2013</strong>
THE FORCE THAT<br />
DRIVES SMARTER<br />
DECISIONS<br />
Welcome to Intergraph Geospatial <strong>2013</strong><br />
WE ARE<br />
UNITED.<br />
Whether it’s by desktop,<br />
server, web,<br />
or<br />
cloud – our integrated geospatial portfolio delivers what you<br />
need, where you need it.<br />
Less hassle.<br />
Complete workflow.<br />
One partner.<br />
WE ARE<br />
MODERN.<br />
Our fresh and intuitive interfaces and<br />
automated technology transform the way you see and share<br />
your data. This world has new challenges.<br />
Combat them with<br />
a smarter design.<br />
WE ARE<br />
DYNAMIC.<br />
Leverage our single integrated, dynamic<br />
environment for spatial modeling.<br />
Our core geospatial tools<br />
enable you to exploit the wealth of information found in data<br />
from any source.<br />
GEOSPATIAL.INTERGRAPH.COM/<strong>2013</strong><br />
GRAPH.COM/<strong>2013</strong><br />
TEAM GEO-FORCE<br />
INTERGRAPH RAPH GEOSPATIAL <strong>2013</strong><br />
Experience the force that’s driving smarter<br />
decisions at a road show near you.<br />
© <strong>2013</strong> Intergraph Corporation.<br />
All rights reserved. Intergraph is part of<br />
Hexagon. Intergraph and the Intergraph logo<br />
are registered trademarks of Intergraph Corporation or its subsidiaries in<br />
the<br />
United States<br />
and in other<br />
countries. .
22<br />
A r t i c l e<br />
Going for Gold with LiDAR<br />
M a p p i n g S e r v i c e s f o r t h e M i n i n g I n d u s t r y<br />
Airborne LiDAR is a fast and relatively inexpensive means of gathering topographic<br />
information critical to the success and safety of mining operations.<br />
McElhanney Consulting Services Ltd. of Vancouver, B.C., Canada, has introduced<br />
two new bare-earth mapping services developed specifically for the exploration<br />
and exploitation phases of the mining industry. In the first application,<br />
McElhanney used LiDAR to find surface structures and lineaments that have been<br />
missed by aerial photography and satellite imaging because of dense vegetative<br />
cover. McElhanney, an engineering, mapping and surveying company, verified the<br />
use of LiDAR bare-earth digital elevation models (DEMs) for lineament and fault<br />
identification in a gold mining district of British Columbia.<br />
By Kevin P. Corbley<br />
Surface lineaments are<br />
linear ground features<br />
associated with complex<br />
subsurface geological<br />
structures, inclu -<br />
ding faults, fractures, and other<br />
features such as contacts<br />
between different rock types.<br />
Sometimes just a half meter<br />
wide, lineaments may extend for<br />
hundreds of meters in length.<br />
Due to their large scale, these<br />
features can be difficult to spot<br />
from ground level, and they can<br />
be even harder to see in most<br />
remotely sensed imagery if<br />
obscured by vegetation or loose<br />
sediment.<br />
“Lineaments provide clues to<br />
underground geology and are a<br />
valuable aide to geological mapping<br />
- a crucial part of any gold<br />
exploration or mine engineering<br />
project”, said Azadeh Koohzare,<br />
Ph.D., P.Eng. “Geologists can<br />
interpret the pattern and direction<br />
of these surface features<br />
and, as many gold deposits are associated with geological structures,<br />
use this information when selecting and prioritizing exploration<br />
targets.”<br />
Colour image of Kitimat Arm, British Columbia<br />
High Point Density Required<br />
The key to revealing the hidden surface geology is a powerful multipulse<br />
airborne laser scanner, or LiDAR, explained Koohzare.<br />
June <strong>2013</strong>
23<br />
Composite of Kitimat Arm and LiDAR data with shaded relief<br />
McElhanney, which owns three Leica Geosystems LiDAR scanners<br />
and two Leica Geosystems ADS digital cameras, initiated the lineament<br />
mapping project using the Leica ALS60 and is upgrading to<br />
the more powerful 500 kHz ALS70-HP system.<br />
This LiDAR systems provide the minimum 2 points per square-meter<br />
(2 points per 2.4 square yards) density required to generate bareearth<br />
DEMs with the accuracy and resolution sufficient for revealing<br />
the narrow linear surface features. In the British Columbia pilot project,<br />
McElhanney operated the LiDAR at an altitude of 2500-3000<br />
meters above mean sea level to collect the data set. Standard processing<br />
removed the returns associated with vegetation to generate<br />
a bare-earth DEM with 10-cm (4 in) vertical and 30 to 50 cm (12 to<br />
20 in) horizontal accuracy.<br />
“The Leica Geosystems ALS LiDAR operates with a high pulse rate<br />
to ensure the vegetation is penetrated with a point density that is<br />
sufficient to find surface lineaments measuring just 50 centimeters<br />
(20 inches) in width,” said Koohzare. “And the high power of the<br />
unit means the dense point data can be captured at high aircraft<br />
speed, which saves time and money.”<br />
Ground Subsidence<br />
McElhanney devised its idea for ground subsidence monitoring in<br />
Saskatchewan where potash deposits are mined and used for fertilizer.<br />
Potash extraction poses a higher risk of ground subsidence than<br />
many other types of mining because the evaporate deposits are<br />
found in soft rock formations that are structurally less than ideal for<br />
tunneling. As a result, potash mines must be continually monitored<br />
for subsidence or sinking, of ground above and around the excavation<br />
site.<br />
“Subsidence above the mine gives advance warning that personnel<br />
inside may be at risk of a cave-in or collapse,” said Koohzare,<br />
adding that subsidence and uplift can cause problems for up to five<br />
kilometers in any direction from the mine site. In addition to dangers<br />
inside the mine, the ground movement can also sever pipelines, damage<br />
roads, and crack building foundations in the affected region.<br />
Monitoring subsidence around potash mines – and other mineral<br />
extraction projects – is typically carried out using traditional ground<br />
survey techniques, which are expensive and time consuming. Based<br />
on LiDAR operations in hundreds of projects, many involving energy<br />
June <strong>2013</strong>
24<br />
A r t i c l e<br />
and mining clients, McElhanney says that<br />
airborne LiDAR is the fastest and most<br />
cost-effective way to monitor ground subsidence.<br />
The 10-cm ((4 in) vertical accuracy of<br />
bare-earth DEMs routinely generated from<br />
the firm’s Leica ALS60 and ALS70 laser<br />
scanners can identify significant shifts in<br />
the ground surface – either up or down –<br />
that may signal dangerous conditions in<br />
the mine. McElhanney recommends collecting<br />
an initial baseline data set above<br />
each mine site and then continuing to collect<br />
new data every year. Once subsidence<br />
is revealed, monitoring flights should be repeated while steps<br />
are taken inside the mine to minimize the danger.<br />
As is the case with the lineament mapping, the high-pulse rate of<br />
the LiDAR sensor is crucial to penetrating the vegetative canopy<br />
around the mine site to get extremely accurate elevation measurements<br />
of the ground surface, or bare earth, according to Kooh zare.<br />
With vegetation removed from LiDAR data, geologists can identify possible gold deposits by viewing the bare-earth surface structures.<br />
The Leica ALS70 is one of the few airborne laser scanners with the<br />
power and multi-pulse capability able to provide the quality of bareearth<br />
DEM required for these mining applications.<br />
Kevin Corbley is president of X-Media and principal of Corbley Communications, a firm that provides business<br />
development and strategic communications services to high-tech organizations worldwide.<br />
(kevin.corbleycommunications).<br />
This article was first published in Leica Reporter 67.
26<br />
A r t i c l e<br />
By PG&E Geosciences<br />
and WSI<br />
Pacific Gas and Electric Company (PG&E) required detailed geologic information<br />
of the land around the Diablo Canyon Power Plant. WSI conducted an orthophotography<br />
and LiDAR survey of the area by using the Microsoft UltraCam Eagle<br />
large-format digital aerial camera and state-of-the-art LiDAR sensors. The<br />
high-resolution imagery, fused with high point density LiDAR data, highlights<br />
the complex terrain and will ultimately make a difference for PG&E scientists<br />
who analyze the land for regulatory reporting.<br />
Ensuring Seismic Safety<br />
Detailed Geologic Information<br />
A Global Focus on Earthquakes and<br />
Utilities<br />
In the wake of the devastating Fukushima<br />
nuclear power plant incident that occurred<br />
in Japan in 2011, utility companies are<br />
more sensitive than ever to the potential<br />
impact of seismic activity on power plants.<br />
Companies that own power plants in active<br />
seismic zones take particular care to ensure<br />
that their facilities are resilient to natural<br />
hazards, and regulatory bodies require<br />
proof of seismic safety.<br />
That’s certainly true for the Diablo Canyon<br />
Power Plant (DCPP), located on the<br />
California coast and owned by Pacific Gas<br />
and Electric Company (PG&E). In 2010,<br />
PG&E began advanced seismic testing at<br />
Diablo Canyon to verify that it continues to<br />
meet the safety requirements necessary for<br />
operating the two units at DCPP. To map the<br />
approximately 380,000 acres, PG&E relied<br />
on its long-term relationship with Watershed<br />
Sciences (WSI), which uses state-of-the-art<br />
technology to provide remote sensing and<br />
analysis with a focus on aerial imagery and<br />
high-resolution LiDAR data.<br />
The Right Tools for the Job<br />
The PG&E geosciences group worked with<br />
WSI on a three-phased, detailed study of the<br />
Diablo Canyon area. The first two phases<br />
involved seismic surveys of portions of the<br />
area in 2010 and 2011. In <strong>2013</strong>, PG&E and<br />
WSI launched the third phase, an in-depth<br />
survey focused on the San Simeon and<br />
A map of the San Simeon and Cambia fault areas.<br />
Cambria fault regions within the Diablo<br />
Canyon area (Figure 1). For that phase, WSI<br />
designed the project to take advantage of<br />
high point density and high-resolution<br />
imagery by using the latest sensors commercially<br />
available.<br />
WSI used the Microsoft UltraCam Eagle 260-<br />
megapixel large-format digital aerial camera<br />
to capture the considerable amount of photographic<br />
data it needed. The system is gyrostabilized<br />
and simultaneously collects<br />
panchromatic and multispectral (RGB, NIR)<br />
imagery. Combining raw image data from<br />
the panchromatic lens with the multispectral<br />
image data yields crisp 4-band orthoimagery<br />
with 3-inch pixel resolution (Figure 2).<br />
Although it used multiple medium-format digital<br />
cameras in the past, WSI appreciated the<br />
efficiencies that came with the large-format<br />
camera. “The larger UltraCam Eagle footprint<br />
meant that we could make fewer<br />
flights, which equates to less time in the air<br />
and less fuel,” says Susan Jackson, Chief<br />
Marketing Officer at WSI. “Plus, because<br />
we could take fewer pictures, we didn’t<br />
have to stitch together as many images<br />
back at the lab, so there was less data<br />
management involved. All that saved us<br />
time and reduced costs for both WSI and<br />
PG&E.”<br />
Blending Technologies for Greatest<br />
Clarity<br />
The next step involved fusing the orthoimagery<br />
with LiDAR data (Figure 3). WSI<br />
acquired the LiDAR data at an overall point<br />
cloud resolution of greater than 15 pulses per<br />
square meter (ppsm), rather than the 8 ppsm<br />
it had used in previous surveys of the area.<br />
The horizontal accuracy of the UltraCam<br />
Eagle was 21 cm, and the LiDAR absolute<br />
accuracy was 3 cm.<br />
The combination of the 3-inch orthophotos and<br />
15-ppsm LiDAR data illuminates subtle geologic<br />
and geomorphic features that might not<br />
be visible with lower-density data. This<br />
enables geologists to find small fault splays<br />
and lesser known areas of movement. Higher<br />
data density also reveals other seismically<br />
induced features, such as landslides, which<br />
can affect dams, pipelines, and other infrastructure,<br />
creating safety concerns that extend<br />
beyond the power plant.<br />
June <strong>2013</strong>
27<br />
“Upgrading the pulse density and<br />
using a large-format camera like the<br />
UltraCam Eagle resulted in unparalleled<br />
image quality and spectacular<br />
photo clarity,” says Jackson.<br />
“Anything less than this high-quality<br />
imagery wouldn’t have sufficed.<br />
Using it, PG&E can examine all<br />
potentially affected infrastructure<br />
within the region and base its decisions<br />
on extremely accurate, defensible<br />
data.”<br />
For optimal mapping of the intertidal<br />
zones of the San Simeon and<br />
Cambria fault regions, WSI acquired<br />
LiDAR data of the coastline during maximum<br />
seasonal low tides. Sensitive to environmental<br />
impacts, WSI operated all aircraft and<br />
equipment in accordance with the regulations<br />
of the Monterey Bay National Marine<br />
Sanctuary. Because flights below 1,000 feet<br />
above ground level violate regulations from<br />
the National Oceanic and Atmospheric<br />
Administration (NOAA), WSI aircraft<br />
remained at 2,000 feet while within the<br />
sanctuary.<br />
Making Seismic Data Accessible<br />
Working with regulatory agencies to make<br />
survey data available in the public domain<br />
is also a key focus for PG&E. Therefore, WSI<br />
worked with PG&E to deliver full-resolution<br />
A 3-inch pixel resolution orthophoto (from the UltraCam Eagle) of Morro Rock<br />
(Morro Bay, CA) and adjacent jetty.<br />
LiDAR points and bare-earth and highest-hit<br />
rasters of the Diablo Canyon Power Plant<br />
study areas to OpenTopography, a datahosting<br />
service supported by the National<br />
Science Foundation. OpenTopography provides<br />
community access to high-resolution<br />
topographic data; this is the first time that it<br />
has hosted orthoimagery on its site. It is also<br />
a first for PG&E facility data to be hosted.<br />
WSI has other high-density LiDAR data hosted<br />
on the site, but the Diablo Canyon Power<br />
Plant data is now the highest-point density<br />
LiDAR data hosted (see URL underneath the<br />
article).<br />
Continued Analysis for Future Peace of Mind<br />
The survey data will help PG&E further<br />
define the level of seismic activity that<br />
earthquake faults in the area are<br />
capable of producing. The company<br />
is finishing its evaluation of the<br />
onshore survey data and the lowenergy<br />
offshore survey data for a<br />
comprehensive understanding of the<br />
entire area. It also plans to install<br />
seismometers to detect seismic activity<br />
on the ocean floor.<br />
About PG&E Geosciences www.pge.com: PG&E employs a<br />
seismic department staffed with experts who continually<br />
study earthquake faults in the region of the power plant<br />
and global seismic events as part of the plant’s comprehensive<br />
safety program. PG&E remains focused on ensuring<br />
that Diablo Canyon continues, and improves upon, its strong<br />
record of safe operations. This includes making the facility resilient to<br />
natural hazards, such as earthquakes and tsunamis.<br />
About WSI www.wsidata.com: WSI brings a wealth of collective industry<br />
experience working with utilities and in the integration of imagery<br />
and LiDAR with other technologies. WSI specializes in applied airborne<br />
remote sensing and analysis, including LiDAR, orthophotography,<br />
ground surveying, feature extraction/analysis, high-definition videography,<br />
planimetric mapping, multispectral and hyperspectral imagery,<br />
thermal infrared imagery, software development, and various assessment<br />
and visualization tools.<br />
For more information, have a look at:<br />
http://opentopo.sdsc.edu/gridsphere/gridsphere?cid=geonlidarframeportlet&gs_action=lidarDataset&opentopoID=OTLAS.03<strong>2013</strong>.2<br />
6910.2.<br />
A shaded digital elevation model (DEM)<br />
superimposed on an orthoimage that<br />
illustrates the San Simeon Fault within<br />
the project area.<br />
June <strong>2013</strong>
28<br />
I n t e r v i e w<br />
By Eric van Rees<br />
The changing nature of retail, a new partnership with Autodesk and how location<br />
is being adopted by new markets, thus providing new business opportunities<br />
for Pitney Bowes Software. Newly appointed Director & GM Location<br />
Intelligence EMEA James Brayshaw explains all.<br />
New Appointment at Pitney Bowes Software<br />
P r o v i d i n g L o c a t i o n - e n a b l e d S o l u t i o n s<br />
Population density map of Reading in the U.K. Created in MapInfo Professional v11.5<br />
Introduction<br />
James Brayshaw has recently been appointed<br />
to lead Pitney Bowes Software’s GIS and<br />
Location Intelligence (LI) business in EMEA<br />
to meet the growing demand for location<br />
software and data solutions. Having nearly<br />
30 years of experience in this field, most<br />
recently as the main board Director of<br />
Ordnance Survey, he is able to put the<br />
recent changes in the geospatial area into<br />
context and to predict where the future is<br />
headed. Also, the announced strategic<br />
alliance between Autodesk and Pitney<br />
Bowes Software is discussed, as well as the<br />
interesting market areas where Pitney Bowes<br />
has a strong presence such as retail and<br />
insurance.<br />
James Brayshaw<br />
Pitney Bowes Software provides desktop<br />
products, enterprise solutions, software<br />
tools, as well as services and data and is<br />
known for its use in retail, insurance and<br />
commercial businesses. Its user base is also<br />
very strong in telecom and public sector,<br />
and particularly in local government within<br />
the highways area. At the same time, Pitney<br />
Bowes Software’s customers also work very<br />
extensively with business partners around<br />
the globe in areas such as health, banking<br />
and specialist markets such as mining and<br />
natural resources.<br />
“With the MapInfo brand and MapInfo<br />
Professional software we have very strong,<br />
well-respected software suite of desktop and<br />
server applications, but we also have a<br />
June <strong>2013</strong>
29<br />
Site analysis example in Dubai, incorporating driving regions, street data and business data<br />
whole range of additional software tools,<br />
platforms and services that reach out into<br />
the broader marketplace in terms of enterprise<br />
GIS. On top of that, we have an enterprise<br />
platform that embeds location intelligence<br />
within customer solutions, which is<br />
increasingly where location intelligence<br />
enabled services are heading”, says<br />
Brayshaw.<br />
Location-enabled solutions<br />
Brayshaw’s role will be to provide some<br />
strong market insight into the capabilities<br />
and uses for Location Intelligence and GIS<br />
solutions, as well as his thoughts on what,<br />
in his experience and observation, could be<br />
the upcoming trends in this space.<br />
Brayshaw: “we’re now seeing a shift in the<br />
market to location-enabled solutions in the<br />
non-core GIS market, areas that wouldn’t<br />
think of GIS but are interested in what location<br />
and intelligence can provide to add<br />
value to the business’s bottom line. It is not<br />
just about maps. That to me is really where<br />
the market is shifting to and where the<br />
growth is going to come from. This is why<br />
my role is about location intelligence in the<br />
wider context, not just geographic information<br />
and GIS. Most leading technology companies<br />
are getting excited by the power of<br />
location.”<br />
He continues: “increasingly, a lot of our<br />
major clients are using our technology and<br />
solutions to support their customers on mission-critical<br />
communications and to provide<br />
insight into their customers’ behaviours and<br />
buying patterns. This is what everyone<br />
wants to know and why it is about how their<br />
data and our software can provide real business<br />
intelligence. Our business brings location<br />
to this marketplace which is where we<br />
are unique as we span across customer communications<br />
management, analytics and<br />
location intelligence.”<br />
Facebook is one of these new breed of<br />
clients. Brayshaw: “they are using our technology<br />
primarily for geocoding and<br />
reversed geocoding and other location intelligence<br />
applications and data for integration<br />
into their applications and services. It’s<br />
all about location-enabling data which is<br />
increasingly happening in the server end at<br />
the enterprise, rather than from a traditional<br />
GIS point of view.”<br />
Retail and Insurance<br />
Retail is an important market for Pitney<br />
Bowes, since location has always been<br />
important for site selection. But today, retailing<br />
is more about customers than it is about<br />
site selection, says Brayshaw. Brayshaw<br />
says retail is about how organizations fulfill<br />
a retail function, and that organizations<br />
have started to recognize that the power of<br />
location is not just about a physical building:<br />
“every organization that has a wide<br />
customer base and is selling products and<br />
services in a traditional retailing way is looking<br />
at better ways of understanding who’s<br />
buying what, why and where and how to<br />
improve their bottom line. The use of our<br />
location enabled solutions with customer<br />
data is really where the power comes.”<br />
It is about the intelligence that one gains<br />
from location that provides a different perspective:<br />
“Analysing my customers behavior<br />
with a location perspective, paints a different<br />
picture and can answer very different<br />
questions. In insurance for example, location<br />
intelligence is used to drive better business<br />
and to understand the risks from a global<br />
perspective down to a local level.<br />
Many leading organisations are looking at<br />
location to provide them with that bottomline<br />
advantage, cost savings and other efficiencies.<br />
Retail, insurance, banking and telecoms<br />
are definitely moving in that way to<br />
tailor and personalise their customer offerings<br />
more effectively. The key is to understand<br />
how better to interact with your customers.”<br />
Autodesk<br />
Last year Pitney Bowes Software and<br />
Autodesk announced a strategic alliance.<br />
This will serve as a framework for both companies<br />
to provide resources, services and<br />
solutions to help infrastructure owners and<br />
architecture, engineering and construction<br />
(AEC) organizations make more informed<br />
decisions. This will drive greater efficiencies<br />
across the plan, design, build, manage lifecycle<br />
of infrastructure. From a user’s perspective<br />
this partnership enables the coordination<br />
of the existing applications and the<br />
integration of data from both companies.<br />
Having been involved in civil engineering<br />
and in the Autodesk world since 1986,<br />
Brayshaw is excited to come back to this<br />
relationship. He sees great opportunities for<br />
both companies in bringing together the<br />
spatial context that infrastructural projects<br />
need through the different phases of the<br />
management lifecycle: “bringing together<br />
June <strong>2013</strong>
30<br />
Interview<br />
The MapInfo GIS suite includes desktop GIS, web mapping and spatial data management capabilities<br />
Autodesk and MapInfo technology, will<br />
seamlessly provide a single source of information<br />
across the management lifecycle.”<br />
For instance, GIS capabilities come in<br />
handy when doing spatial querying, demographic<br />
analysis or optimization of routes<br />
and placing a project in a mapping context<br />
as a part of the planning process of an<br />
infrastructural project. When this becomes<br />
a real project, Autodesk’s BIM enabled IDS<br />
solutions are the preferred choice to provide<br />
the information flows through the project lifecycle.<br />
Brayshaw: “before I joined Pitney Bowes<br />
Software, I’d been doing some work for the<br />
BIM UK taskforce around data flows, processes<br />
and data management. Effectively,<br />
what this alliance does is bring BIM and<br />
geographic information together to provide<br />
the context of the project right from planning,<br />
through the construction phase and<br />
then more importantly into the asset-management<br />
phase. Imagine you have one set<br />
of data that Autodesk’s 3D Design technology<br />
and our MapInfo Suite can talk to. No<br />
more headaches of data conversion. That’s<br />
where core benefits are going to come.”<br />
For more information, have a look at www.pb.com<br />
June <strong>2013</strong>
31<br />
Open GIS Means What?<br />
C o l u m n<br />
If you want to argue about something over beers or on Twitter,<br />
“Open GIS” is a great subject to pick.<br />
When someone uses the word<br />
open to describe something in<br />
the GIS world people<br />
inevitably argue on its applicability.<br />
Here in the United<br />
States, generally government data is open (public<br />
domain) but you still see local governments selling<br />
data to “recoup development costs”. There is a<br />
whole organization (OGC) devoted to making<br />
data sharing open, yet most GIS software either<br />
supports the standards poorly or most likely not at<br />
all. There are open source GIS projects that give<br />
technologists freedom to develop applications their<br />
way, yet most are unapproachable to average<br />
users. Even the largest GIS software company has<br />
embraced open as a way to describe using their<br />
products but most users disagree with Esri’s definition<br />
of open. If you want to argue about something<br />
over beers or on Twitter, “Open GIS” is a great<br />
subject to pick. When I think “open” in relationship<br />
to GIS I break it up into 3 areas; open data,<br />
open standards and open technology.<br />
use when it’s shelf life should have expired years<br />
ago. The Open Geospatial Consortium (OGC)<br />
was founded to address these concerns. I’m going<br />
to say besides WMS, I can’t think of any standard<br />
that they’ve created that I’ve seen people use. The<br />
OGC is littered with 3 letter acronyms that are<br />
implemented in one place or another, but most are<br />
not across platforms. Even when companies say<br />
they support WMS/WFS/etc., it is usually so poorly<br />
that you can’t leverage it in production applications.<br />
I think it has come to the point where GIS<br />
professional just expect new OGC standards to<br />
fail and in turn it becomes a self fulfilling prophecy<br />
of defeat. I see some hope though in the web<br />
mapping world. GeoJSON and the newer extension,<br />
TopoJSON have given web developers community<br />
standards to develop web map applications<br />
across platforms and browsers. I think there<br />
is a ton of innovation happening in this space and<br />
the compact TopoJSON format might be usable in<br />
areas outside the browser (especially since it is<br />
topology aware).<br />
James blogs about geospatial technology<br />
at his blog http://spatiallyadjusted.com<br />
and has a weekly video hangout<br />
http://spatiallyadjusted.com/video<br />
where he talks about what it means to be<br />
a cutting edge GIS professional. He is<br />
owner of Spatially Adjusted, LLC<br />
http://www.spatiallyadjusted.com/consulting,<br />
a GIS consulting company that<br />
helps organizations get better value out of<br />
the geospatial data and applications.<br />
As I mentioned earlier the United States has a history<br />
of public domain government data. We’re all<br />
familiar with the TIGER data project, which gives<br />
somewhat detailed mapping of the USA freely<br />
without any limitations. There are other examples<br />
but I think this is a great way to show what I think<br />
is a truly open dataset. One of the biggest datasets<br />
to ever appear in the history of the world is the<br />
OpenStreetMap (OSM) project. Given that the<br />
word open is in the project title, clearly it is an<br />
open dataset. It has some restrictions on sharing<br />
compared to true public domain datasets. See how<br />
quickly open gets dirty? OSM is in my mind an<br />
open datasets, but I know people who view it as<br />
a closed repository and wish it was all public<br />
domain. Compare that license with the Natural<br />
Earth Data project’s public domain data to see the<br />
difference. I don’t like to get too twisted around<br />
with data licenses because for most of my professional<br />
GIS life I had to deal with close, proprietary<br />
datasets so the freedom provided by “share alike”<br />
licensing is so open to me.<br />
Lastly the one area in GIS that I use “open” is for<br />
software. Projects such as QGIS, PostGIS, and<br />
GDAL/OGR are well known to all GIS users. Each<br />
one is licensed so that you can take the code and<br />
have the freedom to use it the way you wish. That<br />
said, it is not just applications that are open. The<br />
Leaflet mapping library and Data-Driven<br />
Documents (D3) are great visualization tools that<br />
are completely open to users. I don’t need to go<br />
over the reasons why open source software benefits<br />
the user, but it’s a big difference between proprietary<br />
projects such as ArcGIS, Oracle or<br />
Google Maps. I’ve transitioned my professional<br />
life from using closed source applications for my<br />
clients and customers to one of open source projects<br />
that not only give us the freedom to implement<br />
them to best solve problems but also give<br />
them the ability to extend it further into their workflows<br />
without fear of getting into a licensing nightmare<br />
down the road. That’s the key to open GIS<br />
software for me, freedom to innovate without limitations.<br />
That’s liberating!<br />
Now sharing spatial data is still something that I<br />
think we as a community have failed. The<br />
Shapefile and its archaic DBF database format is<br />
the standard that we’ve all agreed upon and still<br />
So that’s my open thoughts on open GIS. I encourage<br />
you to let me know on twitter (@cageyjames)<br />
how you feel about these points.<br />
Latest News? Visit www.geoinformatics.com
32<br />
A r t i c l e<br />
Patagonia National Park<br />
By Rick Tingey and<br />
John Timar<br />
Conservacion Patagonia and its partner organization Round River Conservation<br />
Studies needed to create a comprehensive map of the Patagonia National Park,<br />
a 650,000-acre expanse of mountains, grasslands, forests, wetlands, rivers and<br />
alpine lakes located in Chile’s Aysen Region. With numerous independent<br />
scientific researchers uncovering new information about the landscape, the organizations<br />
needed a shareable system for recording data about the region in a<br />
geospatial context. They turned to a geospatial collaboration software solution<br />
which finally yielded a rich and detailed information base that any collaborator<br />
and view and edit.<br />
Preserving Patagonia National Park<br />
U s i n g G e o s p a t i a l C o l l a b o r a t i o n S o l u t i o n s<br />
With a commitment to the<br />
wild future of Patagonia,<br />
a region located at the<br />
southern end of South<br />
America, Conservacion<br />
Patagonica is an organization that works to<br />
create national parks that save and restore<br />
wildlands and wildlife, inspire care for the natural<br />
world, and generate healthy economic<br />
opportunities for local communities.<br />
Created by Conservacion Patagonica, the<br />
future Patagonia National Park is a 650,000-<br />
acre expanse of mountains, grasslands,<br />
forests, wetlands, rivers and alpine lakes located<br />
in Chile’s Aysen Region. When<br />
Conservacion Patagonica began the<br />
Patagonia National Park project, it set off into<br />
uncharted territory to create comprehensive<br />
and functional maps of the landscape.<br />
Through its partner organization Round River<br />
Conservation Studies, which provides student<br />
study abroad programs and extensive field<br />
research and community planning, the organizations<br />
needed to generate baseline mapping<br />
data about wildlife and plants in<br />
Patagonia National Park. The organization<br />
found that while government survey maps provided<br />
an accurate rendering of the terrain,<br />
they did not offer collaboration and data customization<br />
capabilities. In addition, Web map<br />
services could only provide so much in a<br />
region where Internet connectivity is scarce.<br />
Collaboration and information sharing<br />
With numerous independent scientific<br />
researchers uncovering new information about<br />
the landscape, the project required a shared<br />
and shareable system for recording place<br />
data. As such, Round River Conser vation<br />
Studies set out to create a platform that encouraged<br />
and supported collaboration and information-sharing<br />
among the various people<br />
working on the ground in the park: the wildlife<br />
recovery team, independent scientists, the trail<br />
building team, historians and archeologists<br />
and others.<br />
Round River Conservation Studies needed the<br />
right geospatial collaboration solution to help<br />
create a central repository for all work that is<br />
being done in the region, and that could be<br />
shared with the larger scientific community<br />
and beyond. More importantly, the solution<br />
needed to be easy to manage, update and<br />
ultimately, enable everyone on the team share<br />
this data.<br />
The organization turned to TerraGo’s geospatial<br />
collaboration software for creating cus-<br />
June <strong>2013</strong>
33<br />
RIEGL<br />
LMS-Q780<br />
The RIEGL LMS-Q780 airborne laser scanner<br />
offers great versatility, accuracy, and data<br />
quality. The scanner enables you to<br />
successfully deliver your projects with<br />
industry leading efficiency.<br />
Students with iPad<br />
tomizable GeoPDF maps that allowed users to create their own custom<br />
spatially referenced data (map layers) in the form of point, line, or polygon<br />
features and that could be added to the map using simple drawing<br />
tools within the software. These could then attribute the geo-located data<br />
layers with descriptive information about plant, wildlife and other features.<br />
Grassland survey<br />
Using GeoPDF maps and imagery produced by TerraGo Publisher, a<br />
team of Round River students conducted a grassland survey in the park<br />
during the summer of 2012. Over the course of the semester, they identified<br />
and catalogued the composition of grass species at nearly one<br />
hundred sites, along a gradient from east to west across the Chacabuco<br />
Valley, which is part of the park.<br />
These study site locations were recorded as waypoints in a GPS, and<br />
easily added to the GeoPDF files for collaboration and sharing. The students<br />
then added photos, text, and other media directly to these map<br />
locations, which helped to build a rich and detailed information base<br />
that any collaborator can view and edit. Round River Conservation<br />
Studies then shared these custom map layers with other interested parties.<br />
The use of TerraGo’s collaboration solutions is playing a key role for<br />
both organizations’ staff and independent scientists who come regularly<br />
to study the region’s ecosystems. Prior to using TerraGo, there was no<br />
central repository for updating and managing all geospatial data regarding<br />
the park.<br />
As this is a major project, Round River Conservation Studies needed to<br />
use the right tools for sharing with the scientific community at large the<br />
lessons they’re are learning about what is being protected in this delicate<br />
ecosystem. Moving forward, they want anyone to easily, no matter<br />
where they are in the park, make notes on the GeoPDF and share them<br />
instantly with other scientists and collaborators. This solution will be used<br />
for tracking and monitoring very rare species like the Austral Vizcacha,<br />
a large, endangered rodent that only lives in the Patagonia region.<br />
Leading Technology<br />
in Airborne Scanning<br />
The RIEGL LMS-Q780, with up to 10 simultaneous pulses in the air, results<br />
in the best point spacing on the ground. This eliminates the need<br />
of terrain following while retaining a high effective rate. Industry<br />
leading digital signal processing, combined with the comprehensive<br />
RIEGL software suite, delivers best in class results.<br />
Wide Effective<br />
Swath Width<br />
Matrix<br />
Scan Pattern<br />
The RIEGL LMS-Q780, operated at up to<br />
10,000 feet above ground with its full FOV of<br />
60 degrees, provides both a wide effective<br />
swath width and a narrow point spacing<br />
simultaneously.<br />
The RIEGL LMS-Q780 delivers straight parallel<br />
scan lines and more equally spaced laser<br />
footprints on the ground. Even small objects<br />
can be detected by the high-resolution<br />
matrix scan pattern.<br />
RIEGL<br />
FOV<br />
60°<br />
One Versatile LIDAR Sensor<br />
The RIEGL LMS-Q780 is the versatile airborne<br />
LIDAR sensor for all projects: from corridor to<br />
wide-area, and large-scale national mapping.<br />
RIEGL delivers unrivaled efficiency at low<br />
operating costs.<br />
Others<br />
colored point cloud<br />
Rick Tingey, Conservation Geographer at<br />
Round River Conservation Studies<br />
John Timar, Vice President, Worldwide Sales at TerraGo<br />
For more information on Conservacion Patagonica visit:<br />
www.conservacionpatagonica.org<br />
For more information on Round River Conservation Studies: www.roundriver.org<br />
www.riegl.com<br />
RIEGL LMS GmbH, Austria RIEGL USA Inc. RIEGL Japan Ltd.
34<br />
A r t i c l e<br />
By Paul Ramsey and<br />
David Dubovsky<br />
Although modern open source geospatial software is known to have a lot of<br />
advantages over proprietary, closed source systems, often enterprises find<br />
themselves asking from whom and where they will get support. The emergence<br />
of companies offering enterprise class, commercial support, combined with open<br />
source growth outpacing closed, has enterprises everywhere replacing legacy<br />
software with modern web-based solutions. OpenGeo, and their flagship<br />
product, OpenGeo Suite, has become the choice for those looking for a<br />
comprehensive spatial data platform for the web.<br />
Geospatial Software’s Open Future<br />
O p e n G e o S u i t e 3 . 0<br />
The technology TriMet used— the OpenGeo Suite —packages several<br />
open source projects into a modular enterprise spatial IT solution:<br />
TriMet<br />
In 2007, Portland TriMet was facing a technology conundrum:<br />
though they served a technology-savvy metropolitan population,<br />
which was rapidly adopting transit use, their trip-planning system<br />
presented an old fashioned user interface, backed by proprietary<br />
technology which was difficult to customize and expensive<br />
to scale. To drive and support transit ridership they needed a<br />
quick, easy-to-use trip-planning system that both looked modern to<br />
their users and was built with a modern design, anticipating growth<br />
and adaptation.<br />
TriMet utilized the commercial open source OpenGeo Suite when<br />
building their new public facing maps, including those used in the<br />
online schedules and trip planner. Additionally, TriMet has adopted<br />
open source and open data as central tenets of their systems philosophy:<br />
the data behind those web maps is now all open; and the trip<br />
planning algorithms themselves come from an open source algorithm<br />
which TriMet co-funded.<br />
The reasons TriMet went open source are simple: open source provides<br />
the flexibility to adapt systems to new requirements; open<br />
source provides the scalability necessary to support public facing<br />
web sites; and finally, open source provides the velocity of development<br />
to keep up with the leading edge of technology.<br />
• PostGIS, a spatial database extension for the PostgreSQL database<br />
• GeoServer, a geospatial server capable of connecting to a variety<br />
of data back-ends (e.g., Oracle Spatial, Microsoft SQL Server,<br />
Esri ArcSDE) and publish as OGC services (e.g., WMS, WFS,<br />
WCS, WPS)<br />
• GeoWebCache, a robust caching engine to improve the speed<br />
and performance of serving map tiles<br />
• OpenLayers, a JavaScript library for displaying map data in web<br />
browsers<br />
• GeoExt, a JavaScript library for creating rich map applications in<br />
web browsers<br />
The flexibility of the Suite comes from the ability to incrementally<br />
integrate with existing infrastructures, as TriMet integrated the Suite<br />
with their systems:<br />
• First by bringing in GeoServer to render maps from existing data<br />
formats and database.<br />
• Then building a web interface with OpenLayers/GeoExt, to provide<br />
public web applications for trip planning and map viewing.<br />
• And finally moving the data persistence layer to the<br />
PostGIS/PostgreSQL database.<br />
Unlike many technology platforms, the OpenGeo Suite doesn’t<br />
require organizations to completely re-architect their back-office data<br />
management to start building new applications, and that flexibility<br />
has suited TriMet, and many others.<br />
OpenGeo Suite 3.0<br />
OpenGeo recently released version 3.0 of the Suite, building on the<br />
existing web services, web application toolkit and spatial database,<br />
updating the capabilities of the core components and adding new<br />
features:<br />
June <strong>2013</strong>
35<br />
USGS<br />
pipelines much cross flow lines either above or below the line; and<br />
so on.<br />
OpenGeo stack diagram<br />
• OGC Web Processing Service (WPS) provides a standard for<br />
inputs and outputs (requests and responses) for geospatial processing<br />
services such as polygon overlays, buffers, or custom processes.<br />
• Rendering transformations make processing operations easier<br />
in browser-based visualizations by enabling just-in-time use of<br />
any WPS process as part of any layer’s style.<br />
• Server-side scripting in Python and JavaScript allows users to<br />
easily deploy their own server-side processes using concise and<br />
straightforward APIs.<br />
• PostGIS 2.0 brings vector and raster analysis into the database.<br />
• GeoServer security now supports user groups as well as a number<br />
of new authentication mechanisms including LDAP, digest and<br />
X.509 certificate authentication.<br />
• OGC Web Feature Service 2.0 (WFS) adds some interesting new<br />
capabilities, including paging, stored queries, and extended operators.<br />
While improved security support and WFS services will be welcome<br />
news for administrators, the feature that will find most use in complex<br />
applications is server-side processing via the “Web Processing<br />
Service”.<br />
What’s the big deal about Web Processing Service (WPS)?<br />
WPS allows any calculation to be exposed via a web services interface.<br />
The classic trivial example of a WPS is a service that takes in<br />
a simple point, line or polygon and returns a buffered version of the<br />
input. Buffering can be handy, but the really exciting processes are<br />
ones that make use of rich back-end data stores.<br />
For example, the US Geological Survey manages a rich database<br />
of hydrological data; the National Hydrologic Database (NHD).<br />
NHD data is useful because it conforms to a large number of strict<br />
structure rules about how features can interact: flow obstruction<br />
points must be on flow lines; flow lines much join up end-to-end;<br />
Editing the NHD requires a special desktop environment loaded with<br />
all the structural rules in place. Every potential change is checked<br />
against the rules after editing and before the data is pushed to the<br />
central database. This workflow sharply limits the number of people<br />
who can edit NHD; if more people could edit, with simpler tools, it<br />
would be easier to spread out the load of maintaining this useful<br />
data.<br />
What if you could edit the NHD over the web, while still maintaining<br />
the structural rules?<br />
Using WPS, the USGS built a demonstration application that does<br />
exactly that. Each rule set is codified in a WPS script running in<br />
GeoServer. When an edit is completed, the rule sets for the changed<br />
features are run on the server, checking the new web feature against<br />
the data in the back-end database. If it passes, it is committed. If it<br />
does not, the user has the option of fixing it, or for easy cases (snapping,<br />
vertical displacements) having the system auto-fix it for them.<br />
With the web editing system, more users are able to work on data<br />
management, with lower licensing overhead. And by utilizing the<br />
auto-fixing facility, each user can get more productive work done.<br />
We can find another interesting implementation of WPS within the<br />
GLOBE project. For over a decade, students at schools around the<br />
world have been taking meteorological observations and entering<br />
them into the GLOBE database. As a result GLOBE also has a rich<br />
database, not of hydrology, but of weather observations. The<br />
GLOBE system is supposed to turn those point-by-point observations<br />
into a compelling visual representation of weather data.<br />
Rather that writing a custom piece of software to produce color<br />
ramps from raw data, the GLOBE project chose to add incremental<br />
capabilities to GeoServer via the WPS system. The GLOBE<br />
database had points with measurements (temperature, air pressure,<br />
etc). To get to a colorful output, the system needed to:<br />
• Convert the irregular point data into a regular grid via interpolation.<br />
• Convert the regular grid of values into a colorful image via a color<br />
ramp.<br />
• Convert the regular grid of values into a contour map via contouring.<br />
June <strong>2013</strong>
36<br />
A r t i c l e<br />
WPS, server-side scripting and the others available in<br />
OpenGeo Suite 3.0 enable you to break free of the<br />
traditional notion that spatial data must be routed<br />
through a specialized GIS workflow<br />
GLOBE system<br />
By chaining the interpolation process to the color ramp process, or<br />
the interpolation process to the contouring process, the GLOBE could<br />
generate attractive outputs that were calculated in real time, so a<br />
contour map for the world or any smaller region could be generated<br />
for any day that the GLOBE system had data (over a decade’s<br />
worth!).<br />
Because the GLOBE solution was WPS chaining inside GeoServer it<br />
could take advantage of existing facilities to:<br />
• Read the data out of the database-agnostic backend.<br />
• Convert the value grid into a color grid with existing styling mechanisms.<br />
• Convert the grid into contours with an existing contouring WPS.<br />
So the only net new code required was the interpolation WPS. This<br />
code would read data from any GeoServer data source (files,<br />
databases, remote WFS services) and build an interpolated grid<br />
using the Barnes interpolation scheme. The results are both attractive<br />
and impressively fast. In addition to the interpolation process,<br />
the OpenGeo Suite 3.0 ships with a WPS for heat map generation.<br />
It works the same way as the interpolation WPS, reading from any<br />
data source, and building a value grid that can then be arbitrarily<br />
colored using the standard GeoServer styling system.<br />
The GLOBE example shows the power of chaining processes together,<br />
particularly as the library of available processes grows over time.<br />
For upcoming releases of the OpenGeo Suite, additional user interfaces<br />
to chain processes visually, as well as clustering capabilities,<br />
will be added. This ensures that high loads will be easily distributed<br />
between multiple back-end servers.<br />
General adoption of open source geospatial and in<br />
particular the OpenGeo Suite is being driven by organizations<br />
like TriMet, USGS and GLOBE, which require<br />
a stable, enterprise ready platform on which to build<br />
innovative applications. The transparency of the open<br />
source code base and the speed with which fixes and<br />
changes can be added, allow organizations building<br />
new systems to get beyond the usual routine of working<br />
around limitations and waiting for upcoming<br />
releases.<br />
For the organizations who are wondering, “where will we get support<br />
for this software?” and “who is going to fix my bugs?” we also<br />
have a ready answer: OpenGeo. Commercial open source providers<br />
fill in the gaps between the raw code available from the open source<br />
community and the enterprise needs of customers. Until recently, a<br />
closed source provider has dominated geospatial web services, but<br />
increasingly open source alternatives have been closing the gap.<br />
Companies like RedHat and OpenGeo provide an enterprise face<br />
and offer a reliable partner to work with on issues from feature development<br />
to security enhancements. This cuts software development<br />
costs and gives customers a chance to share and optimize resources<br />
by working with an expert to steer the software development<br />
roadmap. The OpenGeo Suite 3.0 provides enterprises with superior<br />
value in delivering geospatial web services, whilst simultaneously<br />
increasing the reach and functionality of enterprise systems and controlling<br />
costs.<br />
Paul Ramsey, GeoSpatial Architect, OpenGeo<br />
David Dubovsky, Marketing Manager, OpenGeo<br />
URLs<br />
http://trimet.org/ - Portland TriMet’s website<br />
http://opengeo.org/products/suite/ - The OpenGeo Suite<br />
http://blog.opengeo.org/2012/10/03/opengeo-suite-3-0-released/ - OpenGeo Suite 3.0 details<br />
http://opengeo.org/publications/commercialopensource/ - Commercial Open Source Whitepaper<br />
All of these processes occur on the server, which in effect, designates<br />
the server as the place where new processes are defined.<br />
Although this is not a new idea, this is a major deviation from the<br />
status quo. Additionally, the combination of WPS and server-side<br />
scripting allows developers to create processes that perform complex<br />
analysis (like those previously mentioned) or any other processes<br />
a developer may write. All this is possible using familiar scripting<br />
languages like Python and JavaScript. Together these features enable<br />
IT professionals to build web applications that can run spatial processes<br />
against data in real time, from anywhere, using straightforward<br />
web development practices. This is especially exciting for those<br />
who recognize that spatial data has become just one aspect of the<br />
increasingly complex information technology ecosystem. Tools like<br />
June <strong>2013</strong>
37<br />
Stars Aligned, finally, for<br />
CAD/Civil/Geo Convergence?<br />
C o l u m n<br />
As the Architecture/Engineering/Construction (AEC) community, and also<br />
owners and managers of buildings, find new ways to use information technology,<br />
the lack of interoperability among systems becomes increasingly<br />
burdensome.<br />
Bart De Lathouwer, Director,<br />
Interoperability Programs, Open<br />
Geospatial Consortium (OGC)<br />
In March, the Open Geospatial Consortium<br />
(OGC) Land Development Domain Working<br />
Group in partnership with buildingSMART<br />
International hosted the inaugural Civil &<br />
Land Development Summit <strong>2013</strong> as part of<br />
the OGC Technical and Planning Committee meeting<br />
in Abu Dhabi. Representatives from building -<br />
SMART International, Geonovum, Oranjewould<br />
(representing Dutch engineering & construction<br />
companies), Esri, ViaNova, Autodesk, iScope<br />
(FP7 research project), Cyclomedia and OGC<br />
spoke on a variety of topics.<br />
Representatives from buildingSMART International<br />
(bSI) spoke about OpenINFRA, a fast track initiative<br />
to develop bSI/BIM compatible standards for<br />
Infrastructure and Civil Works. The openINFRA<br />
steering group under chair Christophe Castaing<br />
has been laying the groundwork for expanding<br />
the scope of bSI standards beyond buildings.<br />
OpenINFRA was started by several large infrastructure<br />
design, management and construction<br />
companies, especially in France, following on<br />
from the IFC Bridge project.<br />
budgeted over five years. The goal is to eventually<br />
have all UK government projects, including<br />
infrastructure and civil works, be designed, procured<br />
and managed as integrated BIM projects,<br />
starting in 2016 with high priority projects.<br />
In recognition of the amount of work to be accomplished,<br />
bSI has renewed and strengthened its<br />
memorandum of understanding with OGC. OGC<br />
and bSI are committed to coordinate and collaborate,<br />
to avoid duplication of effort and to develop<br />
interoperability between bSI and OGC standards<br />
in overlapping areas. The goal is to have<br />
transparent interoperability from the user perspective.<br />
Additionally, the new version of IFC has been<br />
released. IFC4 is significant in that it has for the<br />
first time a native as well as a simple ifcXML full<br />
equivalent. The important point is that this will<br />
enable, with some caveats, IFC in-flow data compatibility<br />
with new ifcXML-based software for<br />
infrastructure. Esri has expressed plans to enable<br />
input from IFCBIM to Esri tools.<br />
There are growing demands from several governments<br />
for integrated BIM that includes Infra -<br />
structure design, procurement and operation. The<br />
government groundswell is spearheaded by the<br />
UK government, but governments in France,<br />
Germany, Finland, Norway, the Netherlands and<br />
several others also have similar bSI/BIM for<br />
Infrastructure initiatives. The UK government is<br />
eager to help fund international standards and<br />
has officially invited high-level government officials<br />
from several countries for a meeting in<br />
London, in order to help bSI grow further support<br />
and coordinate the work.<br />
The UK government's BIM initiative has high-level<br />
cabinet support and funding of 50 million pounds<br />
The bSI Infrastructure work is being organized as<br />
a virtual Room, where several, or hopefully, many<br />
projects will simultaneously work on aspects of<br />
Infrastructure work. There will be small projects,<br />
such as standards for snapping building footprints<br />
into coordinates, and larger projects needed to<br />
define processes of design and alignments of<br />
roads, railways, waterways; linear construction,<br />
geotechnical, GIS and system related aspects such<br />
as environmental, traffic, control electronics etc.<br />
One concrete action agreed at the meeting is for<br />
the OGC Land Development Standards Working<br />
Group to work with OpenINFRA to create a joint<br />
use case repository to inform LandXML evolution<br />
and civil engineering standards in general.<br />
Latest News? Visit www.geoinformatics.com
38<br />
R e v i e w<br />
By Eric van Rees<br />
Esri Press recently published an updated version of the second part of its GIS<br />
Tutorial series, offering exercises and data for the latest version of its ArcGIS<br />
software.<br />
U p d a t e d E s r i G I S T u t o r i a l<br />
Spatial Analysis Workbook for ArcGIS 10.1<br />
Contents and target audience<br />
This book was published early <strong>2013</strong> and<br />
has been updated for ArcGIS 10.1, which<br />
is the latest version of this software. It offers<br />
nine tutorials or hands-on exercises for performing<br />
spatial analysis, and comes with a<br />
DVD that includes data and a 180-day trial<br />
of ArcGIS 10.1 for Desktop Advanced software.<br />
The book’s key objective is to assist<br />
the reader in developing their knowledge<br />
of the analysis tools of ArcGIS and teaching<br />
them how to design the right sequences to<br />
bring the big picture into view. The tutorials<br />
focus on data representation and equip<br />
readers with the skills to build ‘big picture’<br />
maps. As stated in the preface of this book,<br />
the user won’t create new data, but will create<br />
new files based on existing data.<br />
The contents can roughly be divided into<br />
two categories: tutorials 1-6 correspond<br />
with another Esri publication, called ‘The<br />
Esri Guide to GIS Analysis, Volume 1’, and<br />
tutorials 7-9 correspond with the second<br />
volume. It is recommended that the user of<br />
this book reads the corresponding chapters<br />
of these two volumes before each tutorial.<br />
Some of the tutorials require the ArcGIS<br />
10.1 Spatial Analyst for Desktop extension,<br />
which accompanies the book.<br />
Title: GIS Tutorial 2: Spatial Analysis Workbook for ArcGIS 10.1<br />
Author: David W. Allen<br />
Publisher: Esri Press<br />
Language: English<br />
Number of pages: 344<br />
ISBN: 9781589483378<br />
The book starts off with relatively easy instructions, but the tasks gradually<br />
become more complex and involve multiple steps in order to obtain<br />
the final results for analysis. The first four chapters are more about map<br />
visualization than complex spatial analysis, but from then on things get<br />
more interesting: creating buffers, performing distance analysis, measuring<br />
geographic distribution, and finally, analyzing patterns and identifying<br />
clusters through statistical analysis tools.<br />
In each tutorial, the reader has to fulfill a task that requires a number of<br />
steps for analysis. These are shown step-by-step, through helpful screenshots<br />
of the final results. In addition, there are tasks which support independent<br />
skill demonstration, as well as study questions and review sections<br />
after the exercises. At the end of the book there are a number of<br />
extra independent projects which combine the analysis functions described<br />
in the previous chapters.<br />
This publication is geared towards a more advanced readership than<br />
the first part of this series (‘GIS Tutorial 1:<br />
Basic Workbook) and requires use of<br />
ArcGIS and ArcGIS extensions, knowledge<br />
of ArcMap and ArcCatalog, as well as thirdparty<br />
tools and scripts.<br />
Verdict<br />
For a hands-on do-it-yourself course in performing<br />
GIS analysis with ArcGIS 10.1, or<br />
as material for a face-to-face course in a classroom,<br />
this book is an excellent choice. It<br />
has everything you could possibly need: you<br />
get the data, the software and helpful tutorials<br />
all in one package. The book is wellwritten,<br />
the layout is very good, the imagery<br />
is helpful in working your way through<br />
the exercises and the review sections are<br />
useful. You don’t get the answers to the extra<br />
tasks, but this isn’t a major issue.<br />
Although the book has information on the<br />
theoretical background of the analysis functions<br />
which are covered, this is not the key<br />
objective of the book. This becomes a problem<br />
in the last few chapters, which cover<br />
complex mathematical methods used in statistics,<br />
for instance when it comes to interpreting<br />
results after applying a certain function.<br />
The Help function of ArcGIS provides a lot<br />
of information on spatial analysis, as does<br />
the online Esri Resource Center, so there’s no need to pay for an additional<br />
publication offering this information.<br />
Since the book does cover a lot of ground, it can be a good thing to<br />
read through the whole tutorial again after finishing it to get ‘the big picture’<br />
and distinguish between multiple analysis functions which may seem<br />
very similar, but should be used under specific circumstances and for<br />
specific purposes only. This is important, because if you’re not aware of<br />
what you’re doing, you might end up drawing the wrong conclusions<br />
from your dataset. What is a plus about this book is that the data provided<br />
on the DVD is ready for use, which is good for a learning environment.<br />
It’s important to remember, however, that the real world situation<br />
might be a bit more complex than shown in the book.<br />
For more information, have a look at: esripress.esri.com.<br />
June <strong>2013</strong>
40<br />
R e v i e w<br />
By Eric van Rees<br />
A new edition of Esri’s guide to map projections has been published by Esri Press,<br />
providing a practical working manual for lining up data in ArcGIS and a basic<br />
introduction to working with coordinate systems and map projections.<br />
Lining Up Data in ArcGIS<br />
S e c o n d E d i t i o n f o r A r c G I S 1 0 . 1<br />
with coordinate systems. It presents practical<br />
techniques to help readers identify data<br />
projections, create custom projections to<br />
align data, and resolve common issues. This<br />
most recent, second edition of the book is<br />
compatible with ArcGIS 10.1 and includes<br />
new sections on using CAD data and the<br />
appropriate use of the web Mercator projections.<br />
Title: Lining Up Data in ArcGIS: A Guide to Map Projections<br />
Author: Margaret M. Maher<br />
Publisher: Esri Press<br />
Language: English<br />
Number of pages: 200<br />
ISBN: 978-1589483422<br />
About the book<br />
Last February, Esri published the second edition<br />
of ‘Lining Up Data in ArcGIS: A Guide<br />
to Map Projections’, written by Margaret M.<br />
Mahee; a veteran member of Esri's support<br />
services team. The book is a troubleshooting<br />
reference for any GIS user who works<br />
Contents<br />
The book has 200 pages, divided into ten<br />
chapters, which tackle the problems and<br />
questions ‘most heard ‘over the last few<br />
years in phone calls and emails to Esri<br />
Support Services’. These include lining up<br />
data in a map projection in ArcMap and the<br />
application for making maps and analyzing<br />
data within ArcGIS for Desktop. When new<br />
data is received from sources outside one’s<br />
organization or department, problems often<br />
occur, which explains the need for this book.<br />
The book also covers the basics about working<br />
with coordinate systems and map projections<br />
and is written for users of ArcGIS<br />
working with vector data. As the basic principles<br />
also apply for working with raster<br />
image formats, it is useful for these users too.<br />
The book is meant to be a practical working<br />
manual. For the most part, the book is<br />
arranged so that each chapter addresses a<br />
specific question or problem and provides<br />
a solution for that issue. Each chapter is part<br />
of the whole, but also stands alone, addressing<br />
specific issues related to working with<br />
coordinate systems. The book includes three<br />
appendices, which contain references to a<br />
number of Knowledge Base articles from the<br />
Esri Support Center and to default installa-<br />
June <strong>2013</strong>
41<br />
tion locations and profile paths: necessary<br />
if you want to copy projection files installed<br />
on your computer.<br />
Topics discussed in the book include: how<br />
to resolve alignment issues reflected in common<br />
error messages and warnings, how<br />
(and when) to perform geographic transformations<br />
and which transformation to use,<br />
how to decide which map projection to use,<br />
what do the parameters in a projection file<br />
mean and what do they do, how to add x,y<br />
data to a map and much more.<br />
Verdict<br />
As the author writes in the introduction of<br />
the book, understanding coordinate systems<br />
is a challenge. A practical guide like this is,<br />
therefore, indispensable. The decision to<br />
write a practical working manual which isn’t<br />
overly lengthy was a very wise one, since<br />
there are already many theoretical sources<br />
available, which tackle the mathematical<br />
theories behind map projections. Although<br />
this is not a theoretical book, of course there<br />
is theoretical information available, but it’s<br />
not the chief focus of the book.<br />
One could criticize the decision to repeat<br />
certain information provided in some chapters,<br />
but I didn’t find this distracting, since it<br />
allows you to read the parts of the book you<br />
need most in order to complete your work<br />
or solve a specific problem. This is not a<br />
book you probably will read from cover to<br />
cover, but will use as a reference guide or<br />
as a gateway, leading you to other sources.<br />
Anything more detailed would be information<br />
overload.<br />
What makes this publication so valuable, is<br />
the amount of experience reflected on every<br />
page of the book – the author undoubtedly<br />
has years of experience in solving problems<br />
about coordinate systems in ArcGIS. This<br />
book is clearly written by an expert and written<br />
and presented in an accessible way. As<br />
with all Esri books, there are many large<br />
illustrations, which clarify text examples.<br />
What is worth mentioning, however, is the<br />
amount of information on aligning CAD<br />
data, which is not an easy task, according<br />
to the author.<br />
The downside of this book is that the examples<br />
of coordinate systems and illustrations<br />
of sample data are taken from the United<br />
States. Given the scope of this book, this<br />
choice is understandable, but a missed<br />
opportunity in some way. Apart from this<br />
criticism, I found this a very informative and<br />
practical book to read, with tons of information,<br />
which should prove useful to every person<br />
working with coordinate systems in<br />
ArcGIS.<br />
For more information, have a look at: http://esripress.esri.com<br />
<br />
<br />
<br />
<br />
<br />
<br />
<br />
<br />
<br />
<br />
<br />
<br />
<br />
<br />
<br />
<br />
<br />
<br />
<br />
<br />
<br />
<br />
<br />
<br />
<br />
<br />
<br />
<br />
<br />
<br />
<br />
<br />
<br />
<br />
<br />
<br />
<br />
<br />
<br />
<br />
<br />
<br />
<br />
<br />
<br />
<br />
<br />
<br />
<br />
<br />
<br />
<br />
<br />
<br />
<br />
<br />
<br />
<br />
<br />
<br />
<br />
<br />
<br />
<br />
<br />
<br />
<br />
<br />
<br />
<br />
<br />
<br />
<br />
<br />
<br />
<br />
<br />
<br />
<br />
<br />
<br />
<br />
<br />
<br />
June <strong>2013</strong>
42<br />
E v e n t<br />
By Monica Pratt<br />
Nearly 1,600 members of the software development community got a chance to<br />
see what’s under the hood at the Esri International Developer Summit<br />
(DevSummit), held March 25–28, <strong>2013</strong>, in Palm Springs, California. The attendees,<br />
more than a third of whom came from outside the United States, were<br />
made privy to Esri’s immediate and long-term software development strategies.<br />
Esri <strong>2013</strong> Developer Summit<br />
L i v e b y t h e C o d e<br />
Esri shared its software development strategies with nearly 1,600 members of the software development community at the <strong>2013</strong><br />
Esri International Developer Summit.<br />
The focus of the event, now in its eighth<br />
year, was tech, coding, and the people<br />
who live for both. Attendees<br />
learned about the latest developments,<br />
competed in hackathons, and played<br />
hard during four busy days. Mainstream developers<br />
and those who primarily work on GIS<br />
development came in nearly equal numbers:<br />
approximately 600 for each group. The balance<br />
of the attendees was made up of academics,<br />
managers, and business owners. For<br />
those actively writing code, JavaScript was the<br />
most popular language.<br />
Whatever their day job or favorite programming<br />
language, the DevSummit gave attendees<br />
the opportunity to build community. Esri sees<br />
tremendous value in building relationships<br />
between its developers and the larger developer<br />
community. As Esri president Jack Danger -<br />
mond noted, “You are the people who can think<br />
through what is needed and wanted.”<br />
Interacting with the more than 300 members of<br />
Esri’s development staff in attendance continues<br />
to be one of the event’s main attractions.<br />
Dangermond described the company’s new<br />
generation of development tools as “transformational.”<br />
ArcGIS has become a platform that<br />
integrates across mobile, web, cloud, server,<br />
and desktop to “take geography and geographic<br />
understanding everywhere.”<br />
Big Data, Real Time<br />
The ability to handle the flood of sensor data<br />
in real time was one of the major announcements<br />
made at the DevSummit. “There probably<br />
are more sensors in this room than there<br />
are people. As a developer, leveraging these<br />
sensors in your applications can provide<br />
tremendous value to your end users,” said<br />
Adam Mollenkopf, product lead for ArcGIS<br />
GeoEvent Processor for Server during the<br />
Plenary Session.<br />
Available with the ArcGIS 10.2 release, this<br />
extension lets ArcGIS for Server ingest realtime<br />
data. It can handle feeds from a variety<br />
of data sources, from Twitter to Sierra Wireless<br />
devices, and work with Hadoop and Mongrel<br />
DD. Continuous processing and analysis are<br />
performed on events as they are received. The<br />
stream processing logic can filter streams<br />
based on event attributes or the current location<br />
of sensors inside or outside an area of<br />
interest. Output can be integrated with operations<br />
dashboards or custom apps created with<br />
any ArcGIS API or ArcGIS Runtime to use realtime<br />
data for more immediate response. The<br />
popularity of Mollenkopf’s presentation and<br />
other sessions on GeoEvent Processor was predictable<br />
and overwhelming.<br />
During the plenary, Esri technology evangelist<br />
Mansour Raad introduced GIS Tools for<br />
Hadoop, another Esri technology for dealing<br />
with “volume, velocity, and variety of the<br />
data.” With these tools, big data can be spatially<br />
analyzed, visualized, and interactively<br />
queried.<br />
Disconnected but Productive<br />
Disconnected mode for web maps on mobile<br />
devices was another much-requested and<br />
anticipated capability, which will be available<br />
at ArcGIS 10.2, and was demonstrated during<br />
the Plenary Session. Project engineer lead<br />
Will Crick accessed a map authored in the<br />
cloud on a modest smartphone. After putting<br />
the phone in airplane mode, he queried and<br />
edited data, performed reverse geocoding,<br />
and did some routing—all with the airplane<br />
icon prominently displayed on-screen.<br />
He could do this because data and functionality<br />
were downloaded to the device as a geodatabase<br />
implemented using SQLite. In addition,<br />
if connectivity becomes available, the<br />
device can be synchronized with the cloud.<br />
“We’re going to release this across all the runtime<br />
SDKs at 10.2, and when we do that, we<br />
believe we’re going to be the first mapping<br />
API that has this offline capability,” said Crick.<br />
June <strong>2013</strong>
43<br />
Designing Great Products<br />
Beyond sharing the new capabilities of Esri<br />
software that will be incorporated in imminent<br />
ArcGIS releases, summit presentations focused<br />
on software design that promotes productive<br />
and pleasant user experiences. Interface and<br />
design in general were also the topic of summit<br />
keynote speaker Jared M. Spool. The<br />
founder of the world’s largest usability<br />
research organization, User Interface<br />
Engineering, Spool has spent a lifetime trying<br />
to figure out what makes great designs. He<br />
observed that “the best products are made up<br />
of decisions, lots of decisions,” but his challenge<br />
has been figuring out how design decisions<br />
are made.<br />
Using numerous examples drawn from web<br />
design, Spool showed how designs fall into<br />
one of five styles: unintended, self-design,<br />
genius, activity-focused, and experiencefocused.<br />
Over decades of studying how successful<br />
companies design, Spool has found<br />
that activity-focused and experience-focused<br />
design—neither is based on rules or dogma—<br />
yield far superior results. In design work,<br />
“exception cases far outnumber normal cases.<br />
So you’re always designing for exceptions,”<br />
he said. “You’re always designing for constraints.<br />
You’re always designing for trade-offs.<br />
So this is key.”<br />
Keynote speaker Jared Spool, founder of the world’s largest usability<br />
research organization, discussed how design decisions are made.<br />
The Elegant and Evaporating Interface<br />
In a subsequent presentation, Amber Case,<br />
former CEO of the recently acquired Geoloqi<br />
and now head of the Esri R&D Center in<br />
Portland, Oregon, approached interface<br />
design from another angle. A cyborg anthropologist,<br />
she is deeply interested in the interaction<br />
of humans and computers. She took the<br />
plenary stage to discuss the intersection of<br />
location and the future of interface development.<br />
Case noted that tools have moved from being<br />
extensions of our physical selves (for example,<br />
a knife being a better version of a tooth)<br />
to extensions of our mental selves. However,<br />
unlike physical tools that retain the same size<br />
and function, mental tools are much less constrained<br />
and are changing form and function<br />
rapidly.<br />
For some applications, with the addition of<br />
location, buttons disappear entirely and the<br />
user becomes the button. Interaction with these<br />
applications is less intrusive because the user’s<br />
location is the input that causes certain actions<br />
based on the locational context that anticipates<br />
the user’s needs and wants.<br />
In closing, Case urged developers to use location.<br />
“I’d encourage all of you to think a little<br />
bit wider—how you can solve real-world problems<br />
by adding locations and how you can<br />
actually bring more of what was formally stuck<br />
on the web as static content to life [by] assigning<br />
location to it and delivering it to where it<br />
actually is, where people actually are.”<br />
Learning, Working, Playing<br />
This year’s DevSummit featured additional,<br />
shorter, and more focused technical sessions<br />
that described how to work most effectively<br />
with Esri development tools in incorporating<br />
location into applications. Even shorter and<br />
less formal tech-transfer events occupied the<br />
late afternoon and evening hours. Speed<br />
geeking, introduced last year, was a roundrobin<br />
of five-minute sessions presented on the<br />
first evening by Esri staff on aspects of the technology<br />
to constantly changing groups of 8–10<br />
attendees. At Lightning Talks, attendees got<br />
quick bites of knowledge on a range of topics.<br />
Mingling poolside with Esri developers at<br />
the Meet the Team event, attendees chatted<br />
In addition to killer dodgeball, Dev Summit attendees could<br />
play a giant game of Jenga.<br />
with team members about technology interests<br />
in a relaxed setting.<br />
Developers also had opportunities to highlight<br />
their accomplishments and skills. User presentations,<br />
voted on by the community, were interspersed<br />
with tech sessions throughout the summit.<br />
Developers could also show off their<br />
coding prowess by participating in two<br />
hackathons associated with the summit.<br />
On March 24 at 1:00 p.m., the clock began<br />
ticking for teams participating in the Esri<br />
DevSummit Hackathon. Gathered in one of<br />
the large meeting rooms on-site, teams used<br />
the new ArcGIS for Developers website; Esri<br />
web and/or mobile APIs; and data from<br />
Riverside County, California, to come up with<br />
innovative, location-based projects during the<br />
24-hour contest. With dinner and snacks provided,<br />
contestants toiled through the night.<br />
Entries were judged on creative use of technology,<br />
user experience, and potential for<br />
real-world application.<br />
The Animal Spotter App—developed by<br />
Christopher Moravec, Mara Stoica, and Ryan<br />
Colburn—won first place and a set of<br />
DevSummit passes. Michael van der Veeken<br />
and Paul Kaiser won second place, and<br />
Christoph Sporri, Andry Joos, and Michael<br />
Faulcon earned third place.<br />
For the other hackathon, the100 Lines or Less<br />
ArcGIS JavaScript Code Challenge (ArcGIS.js<br />
44<br />
A r t i c l e<br />
By Urmi Bhattacharjee<br />
SECON, a GIS driven multidiscipline engineering company, developed a mapping<br />
system that was used for rapid generation of accurate base maps with a DTM<br />
for planning and designing irrigation projects in India.<br />
Innovative Mapping in India<br />
U s i n g T e c h n o l o g i c a l A d v a n c e s i n G e o m a t i c s<br />
Digital Terrain Model derived from HRSI<br />
Introduction<br />
With a population of 1.2 billion people and the vagaries of monsoon,<br />
India needs to develop its water resources to meet the growing<br />
demand for food production and security. The use of technological<br />
advances in geomatics for rapid generation of accurate base<br />
maps with Digital Terrain Model (DTM), to plan and design irrigation<br />
projects, is imperative.<br />
SECON is an Indian, GIS driven multidiscipline engineering company,<br />
who developed its own unique system to provide appropriate<br />
ground control, DTM and ortho from stereo high resolution satellite<br />
images (HRSI), thereby saving substantial ground input. This will<br />
serve as a forerunner for the development of further Water Resource<br />
projects.<br />
The map, which was generated using this system, was invaluable<br />
for demarcating catchment area, locations of interventions, sizing of<br />
storages, planning, design of a canal distribution network, structures<br />
and evaluation of Land Use/Land Classification.<br />
A base map for 16,000 sq.km was prepared within 18 months. An<br />
extensive PILOT test was carried out to confirm the accuracy and<br />
suitability of the method of hybrid combination of Ground and 3D<br />
(HRSI). The results were found to be satisfactory as a cost and time<br />
effective solution. The accuracy derived from this method is a benchmark<br />
even for the satellite image provider.<br />
SECON’s hybrid method combining High Resolution 3D Stereo<br />
Satellite Imagery (HRSI), in the planning and design of 10<br />
Watersheds for the Narmada River in Madhya Pradesh India, for<br />
Base Maps on 1:2500, 4000, 10000 scales, proved successful.<br />
Longitudinal and cross sections were also developed for optimizing<br />
canal corridors and a distribution network.<br />
This method is more cost effective and faster compared to purely<br />
Aerial or Ground method in developing countries, where the economics,<br />
logistics and security issues for aerial photography/ LiDAR<br />
are the main constraints.<br />
The project, after completion, will provide water for millions of people<br />
and irrigate an area of around 2200 sq. km of fertile land. The<br />
base maps prepared by SECON will also be used for the rehabilitation<br />
and resettlement of affected people in this project area.<br />
Study Area<br />
The Study area encompasses the 10 Watersheds (sub basins) of the<br />
Narmada River in the state of Madhya Pradesh, India. It is the fifth<br />
largest river in the Indian subcontinent. It is one of the few rivers in<br />
June <strong>2013</strong>
45<br />
India that flows from West to East. It flows through the states of<br />
Madhya Pradesh, Maharashtra and in Gujarat. The Narmada Valley<br />
Development Authority (NVDA) is the Government Agency responsible<br />
for the management of the Narmada River and its River Basin.<br />
The total length of the river from the head to the outfall into the sea<br />
is 1312 km.<br />
Objective<br />
The study was carried out with the following objectives:<br />
• Mapping the area for an extent of 16000 Sq Km.<br />
• Contour map preparation to obtain the contours of 0.50 m intervals<br />
so as to plan the medium and minor projects (Micro Water<br />
Sheds) in the 10 sub basins/Water Sheds.<br />
• Geo referencing<br />
• Establishing Ground Control Points.<br />
• Digitizing and Editing<br />
• DEM generation.<br />
• Ground Truth validation<br />
• Base Map preparation.<br />
• Screening of the projects.<br />
• Identifying and locating the projects (Location of Dam sites)<br />
• Water Availability Studies, Water Balance, Basin Plan<br />
• Assess Submergence and Command Area for 1300 Sq Km of<br />
Cultivable Command Area.<br />
• Size of storage<br />
• Planning and Design of Canal Network and associated structures<br />
• Classification of Land use/Land cover<br />
Data Use<br />
The different types of data used for the project purpose;<br />
• 0.50 m High resolution, Stereo Satellite Imagery<br />
• Topographical Maps.<br />
• Ground data obtained from field survey.<br />
Methodology - Case Study<br />
The basic requirement for Engineering Design, for a project of such<br />
magnitude, which must include Water Shed Management, Flood<br />
Control Studies and Rain Water harvesting, is the generation of an<br />
accurate Base Map. This must have extensive mapping and contours<br />
providing the details of 3D Terrain configuration, catchment area,<br />
Forest cover, Land use, Utilities, places of inhabitation etc, of sub<br />
Basin area.<br />
By the conventional ground survey method, the volume of work to be<br />
executed was estimated to require about 100 land surveyors working<br />
for 8 to 10 years in undulating and forested terrain on each of<br />
the Sub Basins.<br />
There are restrictions and limitations on successfully and rapidly executing<br />
Aerial Surveys in India because of security clearance, customs<br />
delay, and weather conditions. The High Resolution Stereo Satellite<br />
Image (HRSI) Mapping Method combined with ground control and<br />
validation was chosen as the fastest and most cost effective technique<br />
possible. The option of extracting 3D ground features from HRSI using<br />
a combination of suitable software, along with photogrammetric software,<br />
was implemented. The stability, speed and the user friendly<br />
interface of the software helped to extract the required information<br />
accurately from the large Stereo pair Images; each over 2 GB in size.<br />
In order to compile data from stereo HRSI, Differential Global<br />
Positioning System (DGPS) control was established. It was post pointed<br />
and processed to achieve the desired accuracy. Topographic compilation<br />
was performed and an automatic DTM was created. The<br />
Map compiled from Stereo HRSI Photogrammetry<br />
DTM was edited to eliminate any spikes or error points. Orthorectified<br />
images were generated. Planimetric details were digitized from<br />
Orthorectified imagery by on-screen digitization. Contours were generated<br />
from the DTM after generation of Triangulated Irregular<br />
Network (TIN). All data was merged to create a map on the desired<br />
scale with contours at 0.50 m intervals. CAD editing was carried out<br />
to create a map as per Cartographic Standards. Suitable software<br />
was used as a drafting tool during Photogrammetry compilation and<br />
CAD editing.<br />
The output produced by using modern methods was used for further<br />
planning for the design of medium and minor projects in the 10 sub<br />
basins. This combination of Ground Survey and Planimetric Topo -<br />
ºgraphic compilation in Photogrammetry work station using HRSI has<br />
helped the project authority to complete the desired tasks in a shorter<br />
time period than that required by conventional Ground Survey alone.<br />
Macro level mapping can be developed using Stereo HRSI followed<br />
with LiDAR mapping for micro level and more detailed and higher<br />
accuracy. Maps are utilized to support Flood Insurance and Flood<br />
plain management activities. The maps can also be used for a variety<br />
of applications including disaster preparation, response, recovery,<br />
risk assessment and diverse mitigation measures.<br />
Conclusion<br />
Modern technology using Stereo High Resolution Satellite Images<br />
was very helpful in this project. Remote Sensing and GIS proved to<br />
be very comprehensive in the study of large areas like Watershed,<br />
Flood plain studies and Rain Water Harvesting, where integrated<br />
and simultaneous activities have to be executed. Water preservation<br />
will remain incomplete if preventive measures are not undertaken. It<br />
is predicted that water scarcity is imminent in the future and this<br />
could also lead to conflicts and social unrest.<br />
It would be advisable, therefore, to explore Remote Sensing and<br />
GIS techniques and implement them appropriately. Merging conventional<br />
methods with modern techniques can be used for all Water<br />
Resource projects without compromising on the desired quality. This<br />
method is more cost effective and faster compared to purely Aerial<br />
or Ground method in developing countries, where the economics,<br />
logistics and security issues for Aerial Photography/LiDAR are the<br />
main constraints.<br />
Urmi Bhattacharjee, Manager - Business Development,<br />
SECON Private Limited<br />
Internet: www.secon.in<br />
June <strong>2013</strong>
46<br />
C L G E n e w s l e t t e r<br />
Francis Gäbele<br />
For a second consecutive year, the Council of European Geodetic Surveyors decided<br />
to organize the Day of the European Surveyor and GeoInformation in cooperation<br />
with sister organisations, such as EuroGeographics. The celebration took<br />
place on the 22nd March <strong>2013</strong> in Budapest, Hungary, during the first CLGE<br />
General Assembly of the year. Moreover, many other festivities were held<br />
throughout the European capitals by CLGE member organizations, from the 16th<br />
to the 24th March <strong>2013</strong>.<br />
U n d e r t h e a u s p i c e s o f G a l i l e o G a l i l e i<br />
The Day of the European Surveyor and<br />
GeoInformation <strong>2013</strong><br />
André Flahaut, President of the Belgian House of Representatives (© Quentin Van der Vennet,<br />
www.quentinvdv.com)<br />
FIG Vice President Rudolf Staiger during his opening address at the European Space Expo in Budapest<br />
(© Mark Wijngaarde)<br />
On the 18th March <strong>2013</strong>, a reception was organized in<br />
Europe’s capital, Brussels, in the House of the European<br />
Surveyor and GeoInformation, in the presence of distinguished<br />
guests. These included the President of the<br />
Belgian House of Representatives, Minister of State,<br />
André Flahaut, the President of the European Economic and Social<br />
Committee, Henri Malosse and the President of EuroGeographics,<br />
Ingrid Vanden Berghe.<br />
On the 22nd March <strong>2013</strong>, CLGE solemnly announced who would be<br />
the European Surveyor of the Year and would hold this honoured position<br />
until the next celebration in March 2014.<br />
This time, Galileo Galilei (we use the Italian spelling on purpose) was<br />
declared European Surveyor of the year <strong>2013</strong>. He follows Mercator,<br />
European Surveyor in 2012, honoured during the first Day of the<br />
European Surveyor and Geo-Information by CLGE, in the presence of<br />
Cheehai Teo, FIG President.<br />
On the 21st March, on the eve of Surveyors’ Day, the poster of Galileo<br />
Galilei was unveiled to the general public. This took place in the<br />
European Space Expo, organized in the Hungarian capital, in a joint<br />
effort by the European GNSS Agency (GSA), CLGE and the local<br />
Hungarian branch of Surveyors’ Associations.<br />
Rudolf Staiger, FIG vice-president, represented his organisation, together<br />
with John Hohol, president of the FIG Foundation. The latter also<br />
represented the National Society of Professional Surveyors from the<br />
USA (NSPS). The FIG Young Surveyors’ Network sent its secretary and<br />
incoming chair, Eva-Maria Unger, from Austria. The aim of this network<br />
is to establish a European Branch that will integrate with CLGE.<br />
CLGE, joined by NSPS, have decided to promote the creation of a<br />
worldwide Surveyors’ Day.<br />
This was confirmed in the Budapest Declaration, signed by John Hohol<br />
for NSPS, Gyorgy Domokos, delegate to CLGE for the Hungarian<br />
Umbrella Organisation and Jean-Yves Pirlot, CLGE president, who took<br />
this initiative.<br />
June <strong>2013</strong>
47<br />
Enrico Rispoli, Italian CLGE delegate and Secretary General of the<br />
Consiglio Nationale di Geometri e Geometri Laureati, had prepared a<br />
passage reminding us of the life and work of our illustrious predecessor,<br />
Galileo Galilei. We would like to thank him and Maria Grazia<br />
Scorza for this work, as well as Muiris de Buitléir and Judith & Maurice<br />
Barbieri for their proof reading. The text is available on our website<br />
www.clge.eu.<br />
A film produced by Enrico Rispoli is also available. It can be obtained<br />
by simply addressing a request to our secretary general,<br />
Michelle.Camilleri@clge.eu.<br />
All of this has been made possible due to the support of our partners<br />
and sponsors. CLGE wants to thank them sincerely. A special mention<br />
is due to Omar Pierre Soubra from Trimble who has committed his company,<br />
as primary sponsor, for these European events. Additionally, we<br />
would like to thank Steven Berglund, President and CEO of TRIMBLE<br />
and the rest of the entire company.<br />
We would also like to express our gratitude to Marie Ménard and<br />
Reinhard Blasi, from the European GNSS Agency GSA, and our<br />
Hungarian delegate Gyorgy Domokos, as well their respective teams.<br />
They did some excellent work in the preparation of the European Space<br />
Expo and our General Assembly. Our gratitude also goes to all the<br />
CLGE delegates who have celebrated this Day in their own way.<br />
W i t h d e e p r e g r e t , w e m u s t s a y o u r g o o d b y e s t o<br />
t h e h o n o r a r y m e m b e r o f C L G E a n d B D V I<br />
Dipl.-Ing. Klaus-Dieter Rürup<br />
Öffentlich bestellter Vermes sungs in gen ieur<br />
(Publicly Appointed Surve yor, Germany)<br />
2 nd April 1947 – 11 th March <strong>2013</strong><br />
In Klaus Rürup we lose a man who was able to<br />
move things along in professional politics, as well<br />
as on a personal level. He had his own individual<br />
way of doing things and we shall always remember<br />
his concern for people, his open mind and his<br />
kindness.<br />
His influence will continue to be felt, due to how he<br />
conducted himself in the associations with which he<br />
was connected and how he worked for the profession.<br />
Also the strides he made for the benefit of<br />
human relations, in his home country, as well as in<br />
Europe and the rest of the world.<br />
Klaus Rürup during the CLGE<br />
General Assembly in Porto,<br />
September 2005 (© Jyp)<br />
Klaus Rürup has always been part of public life. His attachment to those<br />
around him led him into many voluntary positions, where he was always<br />
sensitive to and ready to act for, and with, his peers.<br />
From the beginning he was not limited by the restrictions of his day job. He<br />
was not afraid of working for noble causes and not just within the German<br />
BDVI. Klaus Rürup did far more than talking; he was a man of action and<br />
committed himself in the interest of the younger generation, to the technological<br />
development of the profession and for the vast community of surveyors.<br />
John Hohol, Gyorgy Domokos and Jean-Yves Pirlot signing the Budapest Declaration (© MW)<br />
The Budapest Declaration<br />
The honourable and historic profession of surveying has been in<br />
existence since the beginning of civilisation. Surveying is recognised<br />
as the world’s oldest legal profession.<br />
From the rope stretchers of ancient Egypt through to modern society,<br />
the surveyor has been an essential foundation in civilisation’s development.<br />
They are qualified and ready to take on the same responsibilities<br />
in the future.<br />
Whether on land, in water or space, surveyors are always at the<br />
forefront.<br />
In recognition of the essential role surveyors play in all aspects of<br />
today’s world and to honour and publicise the surveying profession<br />
and the important work done by surveyors we hereby declare:<br />
22 March <strong>2013</strong> as SURVEYOR’S DAY<br />
Moreover, we ask the international Surveyors Federation, FIG, to<br />
consider the creation of a common worldwide Surveyors’ Day.<br />
He was not only active in the interest of private surveyors: his membership<br />
in the umbrella organisations DVW and CLGE allowed him to engage with<br />
and work for, the profession as a whole. For him, the important factor was<br />
the surveyor, regardless of his or her status as employee, civil servant or private<br />
surveyor.<br />
In 1998 he became vice-president of the CLGE and vice- chair of FIG<br />
Commission 1. Some years later, in 2001, he was appointed president of<br />
CLGE , where he obtained impressive results, such as the “Accord<br />
Multilateral”, which he achieved in cooperation with Geometer Europas,<br />
signed by professional associations from 15 countries.<br />
The well-known Market Report was published under his patronage. Important<br />
European meetings were marked by his signature. With his negotiation skills<br />
and linguistic abilities he united people. Collegiality, friendship and kindness<br />
were his “weapons”. Since his departure younger generations have<br />
come forward to take over the tasks he performed in his inimitable way.<br />
We will honour him with sincerity and great respect and would like it to be<br />
known that we will certainly never forget him.<br />
In silent remembrance,<br />
Jean-Yves Pirlot Michael Zurhorst Rudolf Wehmeyer<br />
CLGE President BDVI President BDVI Nordrhein Westfalen, Chair<br />
April/May <strong>2013</strong>
48<br />
C L G E n e w s l e t t e r<br />
The CLGE Students’ Contest <strong>2013</strong><br />
As every year, CLGE organizes a European Students’ Contest for bachelor and master students in three<br />
categories. The slightly adapted regulations are available on the homepage of www.clge.eu. Papers must<br />
be submitted before 5th August <strong>2013</strong>!<br />
European students can take part in two categories:<br />
• Geodesy and Topography (supported<br />
by Trimble);<br />
• GIS, Mapping and Cadastre (supported<br />
by ESRI).<br />
The third category is open to European students,<br />
but also to young surveyors (aged up<br />
to 35 years). Papers in this category should<br />
propose new approaches addressing the<br />
question of How to attract young people to<br />
the profession and young surveyors to professional<br />
associations (self-supported). If possible,<br />
the winner of this Prize will be asked to<br />
implement his or her project.<br />
Papers must be submitted before the 5th of<br />
August <strong>2013</strong> to contest@clge.eu.<br />
The winners in each of the three categories<br />
will receive a diploma and €1000, - prize<br />
money. It is probable that the sponsors will<br />
invite the winners to a special event.<br />
Eva Maria Unger, Austrian Secretary and future chair of the FIG<br />
Young Surveyors Network, during the Budapest CLGE GA. She is<br />
eager to cooperate with CLGE and to develop a European Branch of<br />
the Network. She welcomes the opening of the third category to<br />
young surveyors (© MW)<br />
All the nominated papers will be published<br />
on the CLGE website (the 2012 papers are<br />
still visible).<br />
The award ceremony will be organized<br />
during INTERGEO in Essen, Germany, in<br />
October <strong>2013</strong>, for the two first categories.<br />
The awarding of the third prize is planned<br />
during the first FIG Young Surveyors Meeting<br />
– European Branch, in Portugal, in September<br />
<strong>2013</strong>.<br />
All submissions will receive an acknowledgement.<br />
If you haven’t received an acknowledgment<br />
of receipt after 5 days, please send<br />
again!<br />
Currently, PhD students are not allowed to use<br />
their PhD theses when applying for categories<br />
1 and 2. We are working on another<br />
prize for this.<br />
Posters Galileo Galilei<br />
Those who want to get this poster in<br />
a ± A0 format can obtain it on request<br />
at poster<strong>2013</strong>@clge.eu for the price<br />
of €80,– shipment within Europe<br />
included. This may become a collectors’<br />
item.<br />
The 2012 poster can be added to this<br />
shipment, in which case the total price<br />
becomes €150,–.<br />
Please do not forget to mention your<br />
surname, first name, snail-mail<br />
address + poster <strong>2013</strong> (and if need<br />
be 2012).<br />
Conclude your order by confirming<br />
that you will pay the invoice by money<br />
transfer on receipt of invoice.<br />
Design of Both Posters: Arianne Weyrich<br />
June <strong>2013</strong>
49<br />
Mobile, Web and Desktop Apps -<br />
Collaborative & Complimentary<br />
C o l u m n<br />
Columnist Matt Sheehan discusses a collaborative, complimentary system<br />
for web, mobile, desktop and complimentary apps.<br />
Remember the dot com boom in the 90’s,<br />
when the Internet went from being a tool<br />
only known to academics to ubiquity. We<br />
all began feverishly buying computers,<br />
and installing Web browsers to access<br />
network based applications. The world of GIS was<br />
then a world filled with desktop nerds working with<br />
ArcInfo, ArcMap and the like. With Esri getting wind<br />
of this new shift to networked computing the IMS<br />
products were released; we remember fondly<br />
MapObjects IMS and ArcIMS. Using the Internet<br />
we began to be able to build networked GIS apps<br />
which allowed developers to share with everybody<br />
interactive maps.<br />
Exciting times indeed. But for those developing<br />
Internet GIS apps there were two major frustrations:<br />
1) Geo-data was hard to find; in particular base<br />
maps.<br />
2) There were no good API’s or tools for developers<br />
to use. Many older developers remember well building<br />
Internet GIS applications from scratch in Flash;<br />
cool output which took an age to build. For those<br />
unfamiliar with API’s, these are the building blocks<br />
for developing applications, they make the process<br />
easier. In the same way as constructing a car is the<br />
process of combining pre-built components; wheels,<br />
engine etc., this is the same process developers walk<br />
through to build an application. Imagine how long<br />
and painful car making would be if you had to build<br />
every component - wheel, engine - from scratch!<br />
Then along came Google. Gobs of data and API’s<br />
galore. Suddenly the world changed; slippy maps,<br />
easy to find data and no more reinventing the wheel<br />
when it came to coding. It was a joyous time. But<br />
for those of us in the GIS world, we were between<br />
a rock and a hard place; Google Maps was not<br />
GIS. Esri were shocked into action. The mid 2000’s<br />
was Google catch up time. Then came the cloud<br />
and mobile.<br />
The cloud provided server based services hosted by<br />
third party organizations. What does that mean in<br />
English? That organisations no longer need to host,<br />
maintain and configure services and servers in house.<br />
No set up, no load balancing and 24x7 access to<br />
data and apps. And mobile; access to this data and<br />
these apps from anywhere at any time. No longer<br />
were we limited to office or home based computing.<br />
Together mobile and the cloud have set the stage for<br />
a new paradigm, as impactful as the Internet.<br />
The Cloud and ArcGIS Online<br />
So now we can interact with data in 3 ways; via<br />
home and office PC’s using the Web and desktop<br />
applications respectively, and from mobile devices.<br />
For GIS this means different tools for different uses.<br />
Before we delve deeper here, let’s step back and<br />
discuss again the cloud. For those using Esri software,<br />
it is now possible to have ArcGIS Server hosted<br />
and maintained by the third part organisations<br />
in the cloud; all that is required is a license and<br />
monthly hosting fee. But, an organisation still needs<br />
experts familiar with ArcGIS Server to publish data.<br />
Now suppose this process was made simpler.<br />
Suppose publishing geo-data needed no special<br />
skills; imagine data being published in ArcGIS<br />
Server without the need to directly interact with<br />
Server. Welcome ArcGIS Online.<br />
Web, Mobile and Desktop and<br />
Complimentary Apps<br />
Using ArcGIS Online as the central platform, for<br />
storage and access to data, let’s look at collaboration<br />
using mobile, Web and desktop applications.<br />
Imagine a team of field workers. They each have<br />
iPads with an installed mobile ArcGIS Online editing<br />
app. Their task is to collect point data based on<br />
current location, to edit the attributes of each point<br />
and add an image attachment to the new point feature.<br />
When done, each new point feature is uploaded<br />
and stored in a (hosted feature) service in ArcGIS<br />
Online. Next an office based GIS analyst, through<br />
ArcMap 10.1, now has access directly to this new<br />
data. She can perform analysis on this and other<br />
organisational data. Finally, an executive loads a<br />
Web application in his browser. He is presented<br />
with a dashboard, which allows him to view this<br />
data, search and query based on specific criteria,<br />
and visualize the data in map, or chart form to better<br />
see patterns and help with decision making. This<br />
is truly a collaborative, complimentary system. One<br />
day in the not too distant future we will wonder how<br />
we ever used GIS in the isolated vertical way we<br />
use it today.<br />
Matt Sheehan is Principal and Senior<br />
Developer at WebmapSolutions.<br />
The company build location focused<br />
mobile applications for GIS, mapping<br />
and location based services (LBS).<br />
Matt can be reached at<br />
matt@webmapsolutions.com.<br />
Latest News? Visit www.geoinformatics.com
50<br />
C a l e n d a r 2 0 1 3 / A d v e r t i s e r s I n d e x<br />
May<br />
28 May FME World Tour <strong>2013</strong><br />
Hong Kong<br />
Internet: www.gis.com.my/fme<strong>2013</strong>.php<br />
28 May FME World Tour <strong>2013</strong><br />
Brussels, Belgium<br />
E-mail: kristin@gim.be<br />
Internet: www.gim.be<br />
29-31 May UDMS <strong>2013</strong>, 29TH Urban Data<br />
Management Symposium<br />
University College London, London, U.K.<br />
E-mail: info@udms.net<br />
Internet: www.udms.net<br />
30 May FME World Tour <strong>2013</strong><br />
Malmö, Sweden<br />
E-mail: mikael.mansson@sweco.se<br />
Internet: www.fmedagarna.se<br />
June<br />
03 June UAVveek <strong>2013</strong><br />
Siegen, Germany<br />
E-mail: info@hauspatmos.de<br />
Internet: www.microdrones.com/UAVveek/civil/index.<br />
php?goback=%2Egde_2938051_member_212842569<br />
06-07 June 4th EARSeL Workshop on Natural and<br />
Cultural Heritage<br />
Matera, Italy<br />
Internet: www.earsel.org/SIG/NCH/4thworkshop/index.php<br />
06-07 June 6th EARSeL Workshop on Remote<br />
Sensing of the Coastal Zone<br />
Matera, Italy<br />
Internet: www.earsel.org/SIG/CZ/6th-w orkshop/<br />
index.php<br />
08-09 June State of the Map US<br />
Mission Bay Conference Center, San Francisco, CA,<br />
U.S.A.<br />
Internet: http://stateofthemap.us<br />
10 June OpenStreetMap Professional Large Users<br />
Summit<br />
Marriott Union Square, San Francisco, CA, U.S.A.<br />
Internet: http://osm.co<br />
11 June FME World Tour <strong>2013</strong><br />
Vienna, Austria<br />
Internet: www.axmann.at/fme_world_tour_<strong>2013</strong>.en.<br />
114.htm<br />
11 June FME World Tour <strong>2013</strong><br />
Belo Horizonte, Brazil<br />
Internet: http://inovacaogis.com.br/index.php?option=<br />
com_content&view=article&id=170&Itemid=366&lang=pt<br />
18-20 June MundoGEO#Connect LatinAmerica<br />
<strong>2013</strong><br />
São Paulo, Brasil<br />
Internet: http://mundogeoconnect.com<br />
21-22 June 3rd WhereCamp Berlin <strong>2013</strong>, Geo-<br />
”Unconference”<br />
Beuth University, Berlin, Germany<br />
Internet: www.wherecamp.de<br />
23-27 June INSPIRE Conference <strong>2013</strong><br />
Florence, Italy<br />
Internet: http://inspire.jrc.ec.europa.eu/events/conferences/inspire_<strong>2013</strong><br />
25-26 June MapInfo Professional Foundation Level<br />
Training Course<br />
CDR Group, Hope, Derbyshire, U.K.<br />
E-mail: sales@cdrgroup.co.uk<br />
Internet: www.cdrgroup.co.uk/train_mi2info.htm<br />
25-27 June ILSC <strong>2013</strong>, 3rd Imaging and Lidar<br />
Solutions Conference<br />
Holiday Inn Toronto Yorkdale, Toronto, Canada<br />
Internet: www.optech.com/ilsc<strong>2013</strong><br />
2 5-27 June RIEGL International Airborne, Mobile,<br />
Terrestrial, and Industrial User Conference <strong>2013</strong><br />
Marriott, Vienna, Austria<br />
E-mail: userconference<strong>2013</strong>@rieglusa.com<br />
Internet: www.riegl.com<br />
03-06 June Hexagon <strong>2013</strong> (ERDAS, Intergraph,<br />
Leica, Metrology)<br />
Las Vegas, NV, U.S.A.<br />
Internet: http://2012.hexagonconference.com<br />
03-06 June 33rd EARSeL Symposium “Towards<br />
Horizon 2020: Earth Observation and Social<br />
Perspectives”<br />
Matera, Italy<br />
Internet: www.earsel.org/symposia/<strong>2013</strong>-symposium-<br />
Matera or www.earsel.org/welcome.html<br />
03-07 June 11th Vespucci Institute “Ontologies<br />
and models for integrated assessments of multiple-scale<br />
processes”<br />
Fiesole, Italy<br />
E-mail: info@vespucci.org<br />
Internet: www.vespucci.org<br />
04 June 4th EARSeL Workshop on Remote Sensing<br />
in Education and Training<br />
Matera, Italy<br />
Internet: www.earsel.org/SIG/ET/4th-workshop/index.php<br />
04 June FME World Tour <strong>2013</strong><br />
Barcelona, Spain<br />
E-mail: fme@conterra.de<br />
Internet: www.fme-wt.es<br />
04 June FME World Tour <strong>2013</strong><br />
Sao Paolo, Brazil<br />
Internet: http://inovacaogis.com.br/index.php?option=<br />
com_content&view=article&id=170&Itemid=366&lang=pt<br />
06 June FME World Tour <strong>2013</strong><br />
Rio de Janeiro, Brazil<br />
Internet: http://inovacaogis.com.br/index.php?option=<br />
com_content&view=article&id=170&Itemid=366&lang=pt<br />
06 June FME World Tour <strong>2013</strong><br />
Madrid, Spain<br />
E-mail: fme@conterra.de<br />
Internet: www.fme-wt.es<br />
11-12 June MapInfo Professional Advanced Level<br />
Training Course<br />
CDR Group, Hope, Derbyshire, U.K.<br />
E-mail: sales@cdrgroup.co.uk<br />
Internet: www.cdrgroup.co.uk/train_mi3info.htm<br />
12-13 June Geointelligence India <strong>2013</strong><br />
New Delhi, India<br />
E-mail: info@geointelligenceindia.org<br />
Internet: http://geointelligenceindia.org<br />
12-14 June FOSSGIS <strong>2013</strong><br />
Gelände der HSR Hochschule für Technik, Rapperswil,<br />
Switzerland<br />
Internet: www.fossgis.de/konferenz/<strong>2013</strong><br />
13 June FME World Tour <strong>2013</strong><br />
Brasilia, Brazil<br />
Internet: http://inovacaogis.com.br/index.php?option=<br />
com_content&view=article&id=170&Itemid=366&lang=pt<br />
13-14 June FARO 3D Documentation User Meeting<br />
<strong>2013</strong><br />
Strasbourg Convention and Conference Centre,<br />
Strasbourg, France<br />
E-mail: Stefanie.Meier@faroeurope.com<br />
Internet: http://user-meeting.faro.com<br />
16-22 June 13th International Multidisciplinary<br />
Scientific GeoConference & EXPO SGEM<strong>2013</strong><br />
Albena Resort & SPA, Bulgaria<br />
E-mail: sgem@sgem.org<br />
Internet: www.sgem.org<br />
17 June FMEdays <strong>2013</strong><br />
Berlin, Germany<br />
E-mail: fme@conterra.de<br />
Internet: www.fmedays.de/index_en.shtm<br />
17-21 June FMEdays <strong>2013</strong><br />
ABION Hotel, Berlin, Germany<br />
E-mail: fme@conterra.de<br />
Internet: www.fme-days.com<br />
July<br />
02-05 July GI_Forum <strong>2013</strong><br />
Salzburg, Austria<br />
Internet: www.gi-forum.org<br />
07-11 July The 9th European Conference on<br />
Precision Agriculture<br />
Lleida, Catalonia, Spain<br />
Internet: www.ecpa<strong>2013</strong>.udl.cat/registration_acomodation.html<br />
08-12 July Esri International User Conference<br />
San Diego Convention Center, San Diego, U.S.A.<br />
Internet: www.esri.com/events<br />
23-24 July MapInfo Professional Foundation Level<br />
Training Course<br />
CDR Group, Hope, Derbyshire, U.K.<br />
E-mail: sales@cdrgroup.co.uk<br />
Internet: www.cdrgroup.co.uk/train_mi2info.htm<br />
August<br />
13-14 August MapInfo Professional Foundation<br />
Level Training Course<br />
CDR Group, Hope, Derbyshire, U.K.<br />
E-mail: sales@cdrgroup.co.uk<br />
Internet: www.cdrgroup.co.uk/train_mi2info.htm<br />
25-29 August SPIE Optics + Photonics <strong>2013</strong><br />
San Diego Convention Center, San Diego, CA, U.S.A.<br />
Internet: http://spie.org/optics-photonics.xml?WT.mc_ -<br />
id=RCal-OPW<br />
25-30 August 26th International Cartographic<br />
Conference<br />
Dresden, Germany<br />
E-mail: manfred.buchroithner@tu-dresden.de<br />
Internet: www.icc<strong>2013</strong>.org<br />
Please feel free to e-mail your calendar notices to: calendar@geoinformatics.com<br />
Advertisers Index<br />
DATEM Systems www.datem.com 24<br />
ERDAS www.erdas.com 21<br />
Esri www.esri.com 51<br />
European Space Imaging www.euspaceimaging.com 2<br />
Global Geo Supplies www.soft-mouse-3D.com 13<br />
GSDI Afrika www.gsdi.org 41<br />
Intergeo www.intergeo.de 39<br />
Leica Geosystems www.leica-geosystems.com 52<br />
Microsoft UltraCam www.UltraCamOsprey.com 25<br />
Optech www.optech.com 9<br />
Racurs www.racurs.ru/France<strong>2013</strong> 30<br />
Riegl www.riegllidar.com 33<br />
Topcon www.topcon.eu 17<br />
June <strong>2013</strong>
Join us:<br />
discovermore.leica-geosystems.com<br />
Change is coming