08 July 2013 - Liberty
08 July 2013 - Liberty
08 July 2013 - Liberty

You also want an ePaper? Increase the reach of your titles
YUMPU automatically turns print PDFs into web optimized ePapers that Google loves.
<strong>08</strong> <strong>July</strong> <strong>2013</strong>
Contents<br />
Contents .................................................................................................................................... 2<br />
Newsflash .................................................................................................................................. 3<br />
Market Comment............................................................................................................................................................ 3<br />
Other Commentators:..................................................................................................................................................... 5<br />
Economic Update ....................................................................................................................... 7<br />
Weekly Market Analysis ............................................................................................................. 9<br />
Rates ....................................................................................................................................... 10<br />
Standard Bank Money Market Fund ............................................................................................................................. 10<br />
STANLIB Enhanced Yield Fund ...................................................................................................................................... 10<br />
STANLIB Income Fund ................................................................................................................................................... 10<br />
STANLIB Extra Income Fund .......................................................................................................................................... 11<br />
<strong>Liberty</strong> Investments’ Life Annuities .............................................................................................................................. 11<br />
Glossary of terminology ........................................................................................................... 12<br />
Disclaimer ................................................................................................................................ 15
Newsflash<br />
South Africa’s ten year yield has averaged 11.1% since 1994, versus the current 7.8%<br />
Market Comment<br />
• The 2.1% loss in the JSE’s All Share Index on Friday made no sense, so it is good to see a strong recovery (so<br />
far, as of 9.43am) this Monday morning, with the ALSI up 1.7%.<br />
• We all want the US economy to gather steam, to create new jobs like the 195,000 it created in June, plus the<br />
extra 70,000 jobs now added to May and April’s jobs report.<br />
• Why? Because a stronger US economy implies that other economies, including ours, should also pick up,<br />
which in turn leads to more jobs, higher company earnings and better share prices.<br />
• Higher bond yields are a mild negative, but coming off such a low base, are not a game changer, especially as<br />
short-term interest rates look set to stay low for at least another year, in the US, Europe, UK, Japan and<br />
probably in SA too.<br />
• As for the dollar’s move upwards against most currencies on the back of stronger growth there, it is putting<br />
pressure on our rand and therefore on our inflation rate, as well as many other emerging market currencies<br />
and inflation rates.<br />
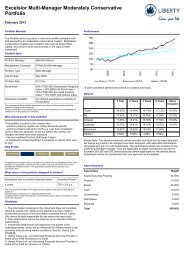
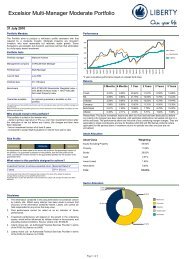
• Below we show a chart of the US Dollar Index, which is a composite index derived from the proportion of its<br />
trade with its trading partners:<br />
Source: I-Net Bridge<br />
• On the whole, we would prefer a firmer rand, although a weaker rand has its positives, such as dampening<br />
imports, stirring exports and helping the mines survive.<br />
• The rand went down to 16 to the pound recently and is currently at 15.27; it fell to 13.75 to the euro and is<br />
currently at 13.16, so the latest weakness has mostly been against the dollar.<br />
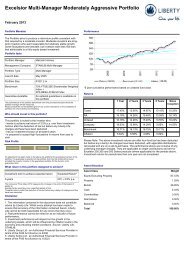
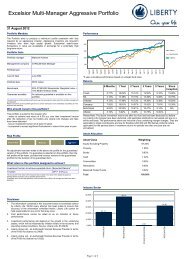
• Meanwhile the US stock market has behaved well since its recent dip towards the end of June (fell 7.5%), as<br />
has the Japanese stock market (up 14% from its recent low). These two markets have helped the MSCI World<br />
Index turn around to show a 10% dollar return so far in <strong>2013</strong> (including dividends). See chart below. This<br />
equates to a mammoth 33.5% in rand terms!!!<br />
• This is after gaining 21.3% in 2012 in rand terms (global developed market equities).
• By comparison the MSCI Emerging Markets Index is down around 11% in dollars so far in <strong>2013</strong>, while the JSE<br />
All Share Index is down a whopping 17.2% in dollars (total return).<br />
• Our Financial & Industrial Index is down 9.8% in dollars so far in <strong>2013</strong> (total return), while the JSE Resources<br />
Index is down a huge 33.5% in dollars so far in <strong>2013</strong> (also total return, including dividends)<br />
• So the developed markets continue to outperform thus far and there does not as yet seem to be any sign of a<br />
turnaround in mining shares.<br />
Equals 33.5% in rands<br />
Source: I-Net Bridge<br />
• UBS notes that the MSCI World Index of mostly developed market equities is trading at around 12.7 times<br />
earnings of the next 12 months (forward price-to-earnings or PE ratio), compared to the long-run average<br />
(excluding the 2000 bubble) of closer to 15 times, i.e. the market is cheaper than its long-term average.<br />
• Also, although bond yields are rising, they are coming off a very low base.<br />
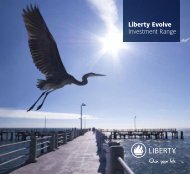
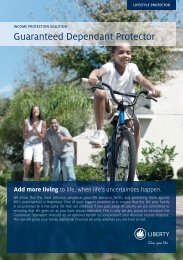
• See the chart below of the long-term US government ten-year bond yield, showing just how low yields<br />
remain, even after the 1% jump of the past 6 weeks (from 1.7% to 2.7%).<br />
Source: I-Net Bridge
• As the chart shows, the long-term average yield has been 6.9%, compared with today’s 2.7%.<br />
• Also the yield is now bumping-up against the down-trend line form 2009, when it was 5%. This implies that it<br />
could struggle to break higher, at least in the short-term, especially as short-term interest rates remain<br />
anchored, with the official rate at 0%-0.25%.<br />
• South Africa’s ten year yield has averaged 11.1% since 1994, versus the current 7.8%.<br />
• Meanwhile, since 1994 the SA prime overdraft rate has averaged 3.1% more than the SA government longterm<br />
bond rate, whereas now it is only 0.7% higher. So if one assumes that the overdraft rate is unlikely to<br />
rise for a while yet, because the economy is soft, then it seems that the bond yield could be more likely to<br />
drift lower from current levels - if it is to move back towards the mean relative to the prime rate.<br />
Other Commentators:<br />
Elaine Garzarelli<br />
• Although Goldman Sachs has brought forward their forecast for tapering to begin to September this year<br />
(cutting back of the $85bn of monthly bond purchases by the US Fed), Garza is not convinced it will happen in<br />
<strong>2013</strong>, despite the good employment number on Friday.<br />
• After all, if the labour force participation rate (people looking for jobs) returned to its 2011 level, the<br />
unemployment rate would currently be 8.6%, not 7.6% and the US Fed said it would start tapering<br />
approximately when the unemployment rate hits 7.2%.<br />
• She notes that over the past 2 months of rising bond yields, US mortgage interest rates have risen by 1% to<br />
4.6% for a 30-year fixed mortgage, causing applications for home mortgages to fall by 31% year-on-year,<br />
which is a negative for the property market.<br />
• The positive news is that the percentage of home-owners having trouble paying their mortgage interest has<br />
fallen by 52% in the last 3 years as the economy has recovered.<br />
• She says good company profits in the US have seen companies raise their dividends by 15% year-on-year in<br />
the 2 nd quarter of <strong>2013</strong>.<br />
• Her proprietary stock market indicator composite remains high at 79.5%.<br />
• Her quantitative indicators are weighted and grouped by economic cycle (20%), monetary (24% weight),<br />
valuation (25%) and sentiment (31%). She remains bullish and unhedged with full exposure to equities.<br />
BCA Research<br />
• Chen Zhao says the world economy is still in a low inflationary, or even deflationary, expansion phase.<br />
Headline inflation in both the US and in Europe is 1.4% currently.<br />
• Inadequate demand, or excess savings, remains a key problem behind the slow recovery.<br />
• There are signs of improvement in the US and Japan and even Europe’s economy seems to be consolidating.<br />
• Meanwhile the stock markets of the developed world are consolidating - and this may persist for a while.<br />
The cyclical bull market remains intact.<br />
• Chen expects bond yields to decline soon after their big run, but sees no long-term value in government<br />
bonds, as long-term yields should converge to nominal GDP over time (i.e. economic growth plus inflation),<br />
approximately 4%.<br />
• He says that although some have been spooked by the sell-off in bonds (rising bond yields), the rise in real<br />
bond yields in tandem with falling inflation expectations is a bullish signal for the world economy and for<br />
share prices.
• In the US private sector growth has averaged 3% for the past 4 years, while public sector spending has been<br />
declining by 2% per year (austerity).<br />
• The bear market in commodities remains intact, even though there may be a relief rally soon. So he<br />
recommends continuing to underweight emerging market shares.<br />
Paul Hansen<br />
Director: Retail Investing
Economic Update<br />
Last week, the Kagiso PMI manufacturing index improved further to 51.6 in June from 50.4 in May and 50.5 in April.<br />
This was better than market expectations for the index to ease to 50.2, suggesting that manufacturing activity has<br />
improved during the second quarter of <strong>2013</strong>, after a very disappointing start to the year. The improvement in the PMI<br />
during June was relatively broad-based including an upturn in business activity and new orders. There was a sharp falloff<br />
in purchasing commitments, but this may have been due to excess inventories. Unfortunately, the employment<br />
index remains desperately weak at a mere 44.9 index level. Overall, this is encouraging news for manufacturing<br />
activity, which was exceptionally weak in Q1 <strong>2013</strong>, but recorded a welcome improvement at the start of Q2 <strong>2013</strong>.<br />
Although the prices paid component of the PMI eased to 82.2 in June <strong>2013</strong>, from 82.4 in May <strong>2013</strong>, it remains<br />
relatively high suggesting a build-up of underlying costs pressures at the production level. This includes high energy,<br />
transport and labour. The recent weakness in the currency is likely to add to pressure over the coming months. On a<br />
trend basis, SA manufacturing activity remains under pressure (see chart showing trend line), but we remain hopeful<br />
that SA industrial activity will improve somewhat into 2014, supported by an expansion of SA business activity into<br />
southern Africa, increased infrastructural investment activity and a steady improvement in world economic<br />
conditions. The June PMI data in many other parts of the world also rose more than expected today.<br />
The FNB/BER Construction Confidence Index released last week indicates that after rising to a four-year high of 51<br />
index points (jumping 15 index points) in Q1 <strong>2013</strong>, the index shed 6 points to 45 in Q2 <strong>2013</strong>. Confidence fell despite<br />
higher activity level. The higher activity was in all likelihood as a result of general government capex on construction<br />
supported by municipal spending which has, in the past, picked up in the second quarter as municipalities hurry to<br />
spend allocated funds before the end of their financial year in June. However, this was sadly not enough to offset<br />
concerns about profitability, which came under some pressure. Rising construction material costs, combined with a<br />
mild uptick in tendering competition and higher employment would also have weighed on overall profitability, causing<br />
confidence to decline. Looking ahead, the outlook for the construction sector has improved with respondents more<br />
upbeat about future prospects. This is in line with reports from a number of listed construction companies that their<br />
order books have improved in recent months.<br />
Offshore, In June <strong>2013</strong>, the US unemployment rate remained unchanged at 7.6%. This was slightly worse than<br />
market expectations for the rate to fall to 7.5%. The unchanged unemployment rate included a further rise in the<br />
labour market participation rate to 63.5% from 63.4% in May. The participation rate remains extremely low by<br />
historical standards, but has been trending slightly higher in the past three months. The low participation rate is most<br />
likely indicating a higher level of structural unemployment in the US, than what existed prior to the financial market<br />
crisis. But if it continues to rise it would make the Fed’s target level of unemployment of 6.5% difficult to achieve over<br />
a relatively short time-horizon of 2 years.<br />
Non-farm payrolls rose by a very solid 195 000 in June <strong>2013</strong>. The market was expecting a rise of 165 000. The change<br />
in total nonfarm payroll employment for April was revised from +149 000 to +199 000, and the change for May was<br />
revised from +175 000 to +195 000. With these revisions, employment gains in April and May combined were 70 000<br />
higher than previously reported, which is very significant. Overall, the level of employment remains 2.15 million jobs<br />
below the previous peak (The US economy lost 8.7 million jobs during the recession). During 2010 as a whole, the US<br />
economy created 1 022 000 jobs, or an average of 85 000 jobs per month. In 2011, the job gains averaged a far more<br />
respectable 175 000 a month, while in 2012 job gains averaged 180 000 a month. In the six months of <strong>2013</strong><br />
employment has risen by an average of 202 000 jobs a month. The private sector added 202 000 jobs in June <strong>2013</strong>,<br />
after adding a revised 207 000 jobs in May <strong>2013</strong>.<br />
The private sector has added 2.357 million jobs in the past year and has gained employment in each of the past 40<br />
months at an average of 196 000 jobs a month. In contrast, the government shed a further 7 000 jobs in June <strong>2013</strong>.<br />
Over the past year, the US government has shed a total of 64 000 jobs.<br />
The average workweek for all employees on private nonfarm payrolls was unchanged in June at 34.5 hours. In<br />
manufacturing, the workweek increased by 0.1 hour to 40.9 hours, and overtime was unchanged at 3.3 hours. The<br />
average workweek for production and nonsupervisory employees on private nonfarm payrolls were unchanged at<br />
33.7 hours. Very impressively, in June, average hourly earnings for all employees on private nonfarm payrolls rose<br />
by 10 cents to $24.01. Over the year, average hourly earnings have risen by 51 cents, or 2.2 percent. In June, average<br />
hourly earnings of private-sector production and nonsupervisory employees increased by 5 cents to $20.14.
Worryingly, the number of persons employed part time for economic reasons (sometimes referred to as involuntary<br />
part-time workers) increased by 322 000 to 8.2 million in June. These individuals were working part time because<br />
their hours had been cut back or because they were unable to find a full-time job. Please note this data series is<br />
extremely volatile.<br />
This month’s US labour market report is very encouraging with another solid gain, especially the upward revision to<br />
the previous two months data. The private sector appears able to gain around 200 000 jobs a month on a regular<br />
basis, which is very good news for a sustainable economic recovery. The gain in hourly earnings (see discussion above)<br />
is also very good news given the low inflation environment. This would suggest that the consumer has some spending<br />
power. Equally, the survey data on hiring plans remains reasonably optimistic, while the weekly jobless claims are still<br />
trending lower. Overall, the labour market data helps to confirm that the US economy continues to recover at a<br />
respectable pace. It also suggests that the Fed’s projection on beginning QE tapering by year-end remains on-track.<br />
In the emerging markets, China’s interbank interest rates have moved noticeably lower after spiking sharply from<br />
4.6% at the beginning of June to over 13% on 20 June. This spike in short-term interest rates caused increased global<br />
concerns about the stability of China’s banking system. While the increase in interest rates may have initially been in<br />
sympathy with the global financial market reaction to the prospective withdrawal of quantitative easing in the US, the<br />
surge reflects a change in China’s monetary policy. More specifically the central bank has become concerned that<br />
because the economic slowdown in China is occurring within an environment of abundant liquidity and strong credit<br />
growth, they are simply aiding the expansion of bank balance sheets, rather than having funds channeled to<br />
productive uses. China’s broad measure of money supply, M2, expanded by 145% between the first quarter of 20<strong>08</strong><br />
and the first quarter of <strong>2013</strong>. This easily exceeded nominal GDP growth of 79% over the same period. This ‘imbalance’<br />
between the growth of money and real economic activity is partly a legacy of the massive stimulus program adopted<br />
by the authorities in the immediate aftermath of the global financial crisis, when the government directed the banks<br />
to sharply increase lending to counter the economic slowdown. However, the authorities (Central Bank) have<br />
increasingly viewed the widening discrepancy between economic growth and liquidity (money supply) as the<br />
emergence of a financial bubble.<br />
Correspondingly, China’s central bank has made it clear that it does not intend to provide endless low-cost funds for<br />
banks to expand their balance sheets into a growing pool of higher yielding and potentially riskier assets. Without<br />
going into significant detail, this increase in financial activity by the banking sector has been partly fueled by the<br />
explosive growth in wealth management products (WMPs). A recent report by China Banking Regulatory Commission<br />
shows that the value of outstanding WMPs has risen by 500% since the end of 2009, reaching $1.3 trillion in March<br />
<strong>2013</strong>. By using WMPs financial market participants can broaden the use of instruments not subject to interest rate<br />
controls, including the use of entrusted and trust-loans. The recent spike in interbank rates means that banks can no<br />
longer assume the central bank will provide a limitless amount of low-cost short-term funding to rapidly expand credit<br />
or accumulate higher yielding assets. Despite the shock to the interbank market from the central bank’s latest action,<br />
these financial activities do not seem to pose a systemic risk to China’s financial system. This is partly because of the<br />
apparent absence of derivative instruments, plus the authorities have the ability to provide considerable financial<br />
support to the interbank market if needed. Nevertheless, the recent monetary policy actions are likely to slow the<br />
expansion of credit and further dampen economic growth.<br />
Please follow our regular economic updates on twitter @lingskevin<br />
Kevin Lings, Laura Jones and Xhanti Payi<br />
(STANLIB Economics Team)
Weekly Market Analysis<br />
Currencies/ Indices/ Commodities<br />
Friday’s Close<br />
05/07/13<br />
Weekly Move<br />
(%)<br />
YTD<br />
(%)<br />
Indices<br />
*MSCI World – US Dollar 1449.05 1.<strong>08</strong> 8.26<br />
*MSCI World – Rand 14771.17 4.38 30.55<br />
*MSCI Emerging Market – US Dollar 917.58 -2.42 -13.09<br />
*MSCI Emerging Market – Rand 9353.52 0.76 4.81<br />
All Share Index – US Dollar 3843.95 -4.14 -17.76<br />
All Share Index – Rand 39169.83 -1.03 -0.20<br />
All Bond Index 424.10 -0.89 -2.28<br />
Listed Property J253 1353.26 -3.35 5.11<br />
Currencies<br />
US Dollar/Rand 10.19 3.25 20.57<br />
Euro/Rand 12.68 -1.28 13.70<br />
Sterling/Rand 15.16 0.94 10.21<br />
Euro/US Dollar 1.28 -1.35 -2.77<br />
Commodities<br />
Oil Brent Crude Spot Price ($/bl) 107.30 4.43 -3.43<br />
Gold Price $/oz 1223.11 -0.90 -26.94<br />
Platinum Price S/oz 1329.00 -0.89 -13.65<br />
Source: I-Net Bridge<br />
* MSCI - Morgan Stanley Capital International
Rates<br />
These rates are expressed in nominal and effective terms and should be used for indication purposes ONLY.<br />
Standard Bank Money Market Fund<br />
Nominal:<br />
Effective:<br />
4.97% per annum<br />
5.<strong>08</strong>% per annum<br />
STANLIB is required to quote an effective rate which is based upon a seven-day rolling average yield for Money<br />
Market Portfolios. The above quoted yield is calculated using an annualised seven-day rolling average as at 05 <strong>July</strong><br />
<strong>2013</strong>. This seven- day rolling average yield may marginally differ from the actual daily distribution and should not be<br />
used for interest calculation purposes. We however, are most happy to supply you with the daily distribution rate on<br />
request, one day in arrears. The price of each participatory interest (unit) is aimed at a constant value. The total return<br />
to the investor is primarily made up of interest received but, may also include any gain or loss made on any particular<br />
instrument. In most cases this will merely have the effect of increasing or decreasing the daily yield, but in an extreme<br />
case it can have the effect of reducing the capital value of the portfolio.<br />
STANLIB Enhanced Yield Fund<br />
Effective Yield: 5.64%<br />
STANLIB is required to quote a current yield for Income Portfolios. This is an effective yield. The above quoted yield<br />
will vary from day to day and is a current yield as at 05 <strong>July</strong> <strong>2013</strong>. The net (after fees) yield on the portfolio will be<br />
published daily in the major newspapers together with the “all-in” NAV price (includes the accrual for dividends and<br />
interest). This yield is a snapshot yield that reflects the weighted average running yield of all the underlying holdings<br />
of the portfolio. Monthly distributions will consist of dividends (currently tax exempt) and taxable interest. Interest<br />
will also be exempt from tax to the extent that investor’s are able to make use of the applicable interest exemption as<br />
currently allowed by the Income Tax Act. The portfolio’s underlying investments will determine the split between<br />
dividends and interest.<br />
STANLIB Income Fund<br />
Effective Yield: 6.34%<br />
Collective Investment Schemes in Securities (CIS) are generally medium to long term investments. The value of<br />
participatory interests may go down as well as up and past performance is not necessarily a guide to the future. A<br />
schedule of fees and charges and maximum commissions is available on request from the company/scheme. CIS can<br />
engage in borrowing and scrip lending. Commission and incentives may be paid and if so, would be included in the<br />
overall costs.” The above quoted yield will vary from day to day and is a current yield as at 05 <strong>July</strong> <strong>2013</strong>.
STANLIB Extra Income Fund<br />
Effective Yield: 5.80%<br />
Collective Investment Schemes in Securities (CIS) are generally medium to long term investments. The value of<br />
participatory interests may go down as well as up and past performance is not necessarily a guide to the future. A<br />
schedule of fees and charges and maximum commissions is available on request from the company/scheme. CIS can<br />
engage in borrowing and scrip lending. Commission and incentives may be paid and if so, would be included in the<br />
overall costs.<br />
Fluctuations or movements in exchange rates may cause the value of underlying international investments to go up or<br />
down.” The above quoted yield will vary from day to day and is a current yield as at 05 <strong>July</strong> <strong>2013</strong>.<br />
<strong>Liberty</strong> Investments’ Life Annuities<br />
Current Rates for 8 th <strong>July</strong> <strong>2013</strong> – 12 th <strong>July</strong> <strong>2013</strong><br />
Payments are assumed to be paid monthly in advance with no guarantee period or annual escalation in income. Ages<br />
indicated assume client is the exact age shown. No tax has been deducted.<br />
Gender Male Female<br />
Age last birthday 55 60 65 55 60 65<br />
Contribution R 100,000 R 770 R 811 R 871 R 695 R 730 R 781<br />
R 250,000 R 2 0<strong>08</strong> R 2 111 R 2 262 R 1 821 R 1 9<strong>08</strong> R 2 034<br />
R 500,000 R 4 072 R 4 277 R 4 579 R 3 698 R 3 871 R 4 122<br />
R 1,000,000 R 8 200 R 8 609 R 9 214 R 7 452 R 7 797 R 8 299<br />
The table above shows the monthly annuity that an annuitant will receive for life in return for the single premium in<br />
the left hand column. Note that the annuity depends on the annuitant’s exact age and gender.<br />
The rates above were calculated assuming maximum commission and will be enhanced if a commission discount is<br />
selected.
Glossary of terminology<br />
Bonds<br />
Cash<br />
Collective<br />
Investments<br />
Compound Interest<br />
Dividend Yields<br />
Dividends<br />
Earnings per share<br />
A bond is an interest-bearing debt instrument, traditionally issued by governments as part of<br />
their budget funding sources, and now also issued by local authorities (municipalities),<br />
parastatals (Eskom) and companies. Bonds issued by the central government are often<br />
called “gilts”. Bond issuers pay interest (called the “coupon”) to the bondholder every 6<br />
months. The price/value of a bond has an inverse relationship to the prevailing interest rate,<br />
so if the interest rate goes up, the value goes down, and vice versa. Bonds/gilts generally<br />
have a lower risk than shares because the holder of a gilt has the security of knowing that<br />
the gilt will be repaid in full by government or semi-government authorities at a specific<br />
time in the future. An investment in this type of asset should be viewed with a 3 to 6 year<br />
horizon.<br />
An investment in cash usually refers to a savings or fixed-deposit account with a bank, or to<br />
a money market investment. Cash is generally regarded as the safest investment. Whilst it is<br />
theoretically possible to make a capital loss investing in cash, it is highly unlikely. An<br />
investment in this type of asset should be viewed with a 1 to 3 year horizon.<br />
Collective investments are investments in which investors‟ funds are pooled and managed<br />
by professional managers. Investing in shares has traditionally yielded unrivalled returns,<br />
offering investors the opportunity to build real wealth. Yet, the large amounts of money<br />
required to purchase these shares is often out of reach of smaller investors. The pooling of<br />
investors’ funds makes collective investments the ideal option, providing cost effective<br />
access to the world’s stock markets. This is why investing in collective investments has<br />
become so popular the world over and is considered a sound financial move by most<br />
investors.<br />
Compound interest refers to the interest earned on interest that was earned earlier and<br />
credited to the capital amount. For example, if you deposit R1 000 in a bank account at 10%<br />
and interest is calculated annually; your balance will be R1 100 at the end of the first year<br />
and R1 210 at the end of the second year. That extra R10, which was earned on the interest<br />
from the first year, is the result of compound interest ("interest on interest"). Interest can<br />
also be compounded on a monthly, quarterly, half-yearly or other basis.<br />
The dividend yield is a financial ratio that shows how much a company pays out in dividends<br />
each year relative to its share price. The higher the yield, the more money you will get back<br />
on your investment.<br />
When you buy equities offered by a company, you are effectively buying a portion of the<br />
company. Dividends are an investor’s share of a company’s profits, given to him or her as a<br />
part-owner of the company.<br />
Earnings per share is a measure of how much money the company has available for<br />
distribution to shareholders. A company’s earnings per share is a good indication of its<br />
profitability and is generally considered to be the most important variable in determining a<br />
company’s share price.
Equity<br />
Financial Markets<br />
Fixed Interest Funds<br />
Gross Domestic<br />
Product (GDP)<br />
Growth Funds<br />
Industrial Funds<br />
Investment Portfolio<br />
JSE Securities<br />
Exchange<br />
Price to earnings<br />
ratio<br />
Property<br />
Resources and Basic<br />
Industries Funds<br />
A share represents an institution/individual’s ownership in a listed company and is the<br />
vehicle through which they are able to “share” in the profits made by that company. As the<br />
company grows, and the expectation of improved profits increases, the market price of the<br />
share will increase and this translates into a capital gain for the shareholder. Similarly,<br />
negative sentiment about the company will result in the share price falling. Shares/equities<br />
are usually considered to have the potential for the highest return of all the investment<br />
classes, but with a higher level of risk i.e. share investments have the most volatile returns<br />
over the short term. An investment in this type of asset should be viewed with a 7 to 10 year<br />
horizon.<br />
Financial markets are the institutional arrangements and conventions that exist for the issue<br />
and trading of financial instruments.<br />
Fixed interest funds invest in bonds, fixed-interest and money market instruments. Interest<br />
income is a feature of these funds and, in general, capital should remain stable.<br />
The Gross Domestic Product measures the total volume of goods and services produced in<br />
the economy. Therefore, the percentage change in the GDP from year to year reflects the<br />
country's annual economic growth rate.<br />
Growth funds seek maximum capital appreciation by investing in rapidly growing companies<br />
across all sectors of the JSE. Growth companies are those whose profits are in a strong<br />
upward trend, or are expected to grow strongly, and which normally trade at a higher-thanaverage<br />
price/earnings ratio.<br />
Industrial funds invest in selected industrial companies listed on the JSE, but excluding all<br />
companies listed in the resources and financial economic groups.<br />
An investment portfolio is a collection of securities owned by an individual or institution<br />
(such as a collective investment scheme). A funds‛ portfolio may include a combination of<br />
financial instruments such as bonds, equities, money market securities, etc. The theory is<br />
that the investments should be spread over a range of options in order to diversify and<br />
spread risk.<br />
The primary role of the JSE Securities Exchange is to provide a market where securities can<br />
be freely traded under regulated procedures.<br />
Price to earnings ratio or p: e ratio is calculated by dividing the price per share by the<br />
earnings per share. This ratio provides a better indication of the value of a share, than the<br />
market price alone. For example, all things being equal, a R10 share with a P/E of 75 is much<br />
more “expensive” than a R100 share with a P/E of 20.<br />
Property has some attributes of shares and some attributes of bonds. Property yields are<br />
normally stable and predictable because they comprise many contractual leases. These<br />
leases generate rental income that is passed through to investors. Property share prices<br />
however fluctuate with supply and demand and are counter cyclical to the interest rate<br />
cycle. Property is an excellent inflation hedge as rentals escalate with inflation, ensuring<br />
distribution growth, and property values escalate with inflation ensuring net asset value<br />
growth. This ensures real returns over the long term.<br />
These funds seek capital appreciation by investing in the shares of companies whose main<br />
business operations involve the exploration, mining, distribution and processing of metals,<br />
minerals, energy, chemicals, forestry and other natural resources, or where at least 50<br />
percent of their earnings are derived from such business activities, and excludes service<br />
providers to these companies.
Smaller Companies<br />
Funds<br />
Value Funds<br />
Growth Funds<br />
Smaller Companies Funds seek maximum capital appreciation by investing in both<br />
established smaller companies and emerging companies. At least 75 percent of the fund<br />
must be invested in small- to mid-cap shares which fall outside of the top 40 JSE-listed<br />
companies by market capitalisation.<br />
These funds aim to deliver medium- to long-term capital appreciation by investing in value<br />
shares with low price/earnings ratios and shares which trade at a discount to their net asset<br />
value.<br />
Growth funds seek maximum capital appreciation by investing in rapidly growing companies<br />
across all sectors of the JSE. Growth companies are those whose profits are in a strong<br />
upward trend, or are expected to grow strongly, and which normally trade at a higher-thanaverage<br />
price/earnings ratio.<br />
Sources: Unit Trust and Collective Investments (September 2007), The Financial Sector Charter Council, Personal Finance (30 November 2002),<br />
Introduction to Financial Markets, Personal Finance, Quarter 4 2007, Investopedia (www.investopedia.com) and The South African Financial<br />
Planning Handbook 2004.
Disclaimer<br />
The price of each unit of a domestic money market portfolio is aimed at a constant value. The total return to the investor is primarily made up of<br />
interest received but, may also include any gain or loss made on any particular instrument. In most cases this will merely have the effect of<br />
increasing or decreasing the daily yield, but in an extreme case it can have the effect of reducing the capital value of the portfolio. Collective<br />
Investment Schemes in Securities (CIS) are generally medium to long term investments. The value of participatory interests may go down as well as<br />
up and past performance is not necessarily a guide to the future. An investment in the participations of a CIS in securities is not the same as a<br />
deposit with a banking institution. CIS are traded at ruling prices and can engage in borrowing and scrip lending. A schedule of fees and charges and<br />
maximum commissions is available on request from STANLIB Collective Investments Ltd (the Manager). Commission and incentives may be paid and<br />
if so, would be included in the overall costs. A fund of funds is a portfolio that invests in portfolios of collective investment schemes, which levy<br />
their own charges, which could result in a higher fee structure for these portfolios. Forward pricing is used. Fluctuations or movements in exchange<br />
rates may cause the value of underlying international investments to go up or down. TER is the annualised percent of the average Net Asset Value<br />
of the portfolio incurred as charges, levies and fees. A higher TER ratio does not necessarily imply a poor return, nor does a low TER imply a good<br />
return. The current TER cannot be regarded as an indication of future TERs. Portfolios are valued on a daily basis at 15h30. Investments and<br />
repurchases will receive the price of the same day if received prior to 15h30. <strong>Liberty</strong> is a full member of the Association for Savings and Investments<br />
of South Africa. The Manager is a member of the <strong>Liberty</strong> Group of Companies.<br />
As neither STANLIB Wealth Management Limited nor its representatives did a full needs analysis in respect of a particular investor, the investor<br />
understands that there may be limitations on the appropriateness of any information in this document with regard to the investor’s unique<br />
objectives, financial situation and particular needs. The information and content of this document are intended to be for information purposes only<br />
and STANLIB does not guarantee the suitability or potential value of any information contained herein. STANLIB Wealth Management Limited does<br />
not expressly or by implication propose that the products or services offered in this document are appropriate to the particular investment<br />
objectives or needs of any existing or prospective client. Potential investors are advised to seek independent advice from an authorized financial<br />
adviser in this regard. STANLIB Wealth Management Limited is an authorised Financial Services Provider in terms of the Financial Advisory and<br />
Intermediary Services Act 37 of 2002 (Licence No. 26/10/590)<br />
Compliance No.: 1476DR<br />
17 Melrose Boulevard, Melrose Arch, 2196<br />
P O Box 202, Melrose Arch, 2076<br />
T <strong>08</strong>60123 003 (SA Only)<br />
T+27(0)11 448 6000<br />
E contact@stanlib.com<br />
Website www.stanlib.com<br />
STANLIB Wealth Management Limited<br />
Reg. No. 1996/005412/06<br />
Authorised FSP in terms of the FAIS Act, 2002 (Licence<br />
No. 26/10/590)<br />
24 Ameshoff Street, Braamfontein, 2001<br />
P O Box 10499, Johannesburg, 2000<br />
T <strong>08</strong>60 456 789<br />
E info@liberty.co.za<br />
Website www.liberty.co.za<br />
<strong>Liberty</strong> Group Limited<br />
Reg. No. 1957/002788/06<br />
Authorised FSP in terms of the FAIS Act (Licence No.<br />
2409)<br />
STANLIB Collective Investments Limited<br />
Reg. No. 1969/003468/06