FREE PDF Report - Automotive Industries Association of Canada
FREE PDF Report - Automotive Industries Association of Canada
FREE PDF Report - Automotive Industries Association of Canada
You also want an ePaper? Increase the reach of your titles
YUMPU automatically turns print PDFs into web optimized ePapers that Google loves.
2010 CANADIAN AUTOMOTIVE SERVICE & REPAIR SHOP SURVEY<br />
BENCHMARKING PERFORMANCE MARCH 2010<br />
CONCLUSION<br />
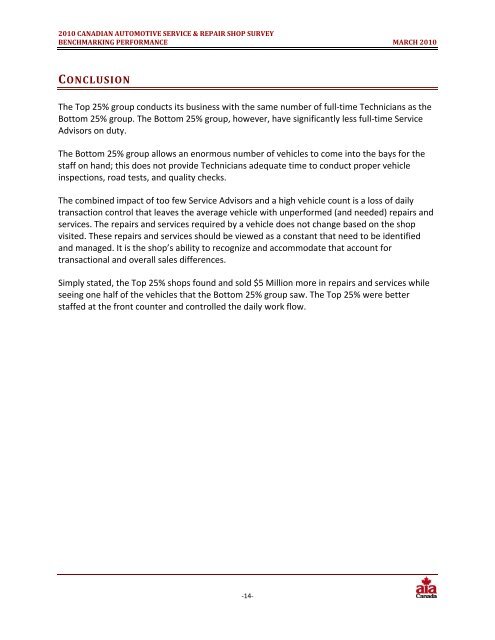
The Top 25% group conducts its business with the same number <strong>of</strong> full‐time Technicians as the<br />
Bottom 25% group. The Bottom 25% group, however, have significantly less full‐time Service<br />
Advisors on duty.<br />
The Bottom 25% group allows an enormous number <strong>of</strong> vehicles to come into the bays for the<br />
staff on hand; this does not provide Technicians adequate time to conduct proper vehicle<br />
inspections, road tests, and quality checks.<br />
The combined impact <strong>of</strong> too few Service Advisors and a high vehicle count is a loss <strong>of</strong> daily<br />
transaction control that leaves the average vehicle with unperformed (and needed) repairs and<br />
services. The repairs and services required by a vehicle does not change based on the shop<br />
visited. These repairs and services should be viewed as a constant that need to be identified<br />
and managed. It is the shop’s ability to recognize and accommodate that account for<br />
transactional and overall sales differences.<br />
Simply stated, the Top 25% shops found and sold $5 Million more in repairs and services while<br />
seeing one half <strong>of</strong> the vehicles that the Bottom 25% group saw. The Top 25% were better<br />
staffed at the front counter and controlled the daily work flow.<br />
‐14‐


