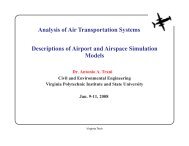
Review of Airport Runway Capacity Airport Capacity
Review of Airport Runway Capacity Airport Capacity
Review of Airport Runway Capacity Airport Capacity

You also want an ePaper? Increase the reach of your titles
YUMPU automatically turns print PDFs into web optimized ePapers that Google loves.
<strong>Review</strong> <strong>of</strong> <strong>Airport</strong> <strong>Runway</strong> <strong>Capacity</strong><br />
<strong>Airport</strong> <strong>Capacity</strong><br />
Dr. Antonio A. Trani<br />
Associate Pr<strong>of</strong>essor <strong>of</strong> Civil and Environmental Engineering<br />
Virginia Polytechnic Institute and State University<br />
Falls Church, Virginia<br />
June 9-12, 2003<br />
Virginia Tech 1
Methodologies to Assess <strong>Airport</strong> <strong>Capacity</strong><br />
The capacity <strong>of</strong> an airport is a complex issue. Several<br />
elements <strong>of</strong> the airport facility have to be examined.<br />
Namely: a) Airside and b) Landside components.<br />
Access Road<br />
<strong>Runway</strong><br />
Landside<br />
Gates<br />
Taxiways<br />
Airside<br />
Terminal<br />
<strong>Runway</strong><br />
Virginia Tech 2
<strong>Airport</strong> and Airspace Components<br />
The following components <strong>of</strong> NAS need to be<br />
examined:<br />
a) Airside<br />
- Airspace<br />
- <strong>Runway</strong>s<br />
- Taxiways<br />
b) Landside<br />
- Gates<br />
- Terminal<br />
- Access road<br />
Virginia Tech 3
Factors Affecting <strong>Runway</strong> <strong>Capacity</strong><br />
There are numerous factors that affect runway capacity.<br />
Here are some <strong>of</strong> the most relevant:<br />
• <strong>Runway</strong> configuration (number <strong>of</strong> runways in use,<br />
location <strong>of</strong> runway exits, etc.)<br />
• Aircraft mix (percent <strong>of</strong> aircraft in various wake vortex<br />
categories)<br />
• Weather conditions (visibility, ceiling, wind direction<br />
and speed)<br />
• <strong>Airport</strong> equippage (type <strong>of</strong> navaids, ATC equipment)<br />
• Operating procedures (noise considerations, special<br />
approach and departure procedures)<br />
Virginia Tech 4
<strong>Runway</strong> Separations at <strong>Airport</strong>s Depend on<br />
<strong>Airport</strong> Surveillance Technology<br />
The same technology used to establish the position <strong>of</strong> aircraft in the<br />
airspace is used to perform surveillance activities near airports<br />
• Radar technology has inherent weaknesses for surveillance<br />
• The farthest from the antenna, the larger the uncertainty to<br />
determine accurate positions<br />
• Primary radar (skin paint)<br />
• Secondary radar (transponder inside aircraft - Modes C and S)<br />
Virginia Tech 5
Independent ILS or Precision Approaches<br />
• IFR operational conditions<br />
• 4,300 ft. between runway centerlines<br />
• Standard radar systems (scan rate <strong>of</strong> 4.8 seconds or more)<br />
• Radar surveillance is available<br />
Independent arrival streams<br />
<strong>Runway</strong> 1<br />
<strong>Airport</strong> Terminal<br />
4,300 ft. or more<br />
<strong>Runway</strong> 2<br />
Virginia Tech 6
Independent Parallel Approaches using the<br />
Precision <strong>Runway</strong> Monitor (PRM) in IFR<br />
• The purpose <strong>of</strong> this standard is to use the Precision <strong>Runway</strong><br />
Monitor (PRM) to allow independent ILS approaches to parallel<br />
runways separated down to 3,000 feet (FAA, 1998)<br />
• This standard currently applies with PRM (fast-scan technology)<br />
• Radar scan rate <strong>of</strong> 1 second or less<br />
Virginia Tech 7
What is a PRM - Precision <strong>Runway</strong> Monitor?<br />
Two pieces <strong>of</strong> s<strong>of</strong>tware and hardware comprise the PRM system:<br />
• Air Traffic Controller display (shows the aircraft blips plus the<br />
NTZ - No Transgression Zone (NTZ)<br />
• Fast scanning radar (with tau
Independent Triple and Quadruple<br />
Approaches To Parallel <strong>Runway</strong>s (IFR)<br />
• The idea behind this concept is to allow triple and quadruple<br />
parallel approaches to runways separated by 5,000 feet using<br />
standard radar systems (scan update rate <strong>of</strong> 4.8 seconds) at<br />
airports having field elevations <strong>of</strong> less than 1,000 feet<br />
• Increase to 5,300 ft. spacing between runways for elevations<br />
above 5,000 ft.<br />
p<br />
<strong>Runway</strong> 1<br />
<strong>Runway</strong> 2<br />
<strong>Runway</strong> 3<br />
5,000 ft. or more<br />
R 2<br />
Virginia Tech 9
Independent Departures in IFR Conditions and<br />
Standard Radar (τ => 4.8 s.)<br />
• Simultaneous departures can be conducted if two parallel<br />
runways are located 2,500 ft. p<br />
<strong>Runway</strong> 1<br />
2,500 ft.<br />
<strong>Runway</strong> 2<br />
Virginia Tech 10
Independent Departures and Arrivals in IFR<br />
Conditions and Standard Radar (τ => 4.8 s.)<br />
• Simultaneous departures and arrivals can be conducted if two<br />
parallel runways are located 2,500 ft.<br />
Departure<br />
Stream<br />
<strong>Runway</strong> 1<br />
2,500 ft.<br />
<strong>Runway</strong> 2<br />
Arrival<br />
Stream<br />
Virginia Tech 11
Staggered <strong>Runway</strong>s Rule (Decreasing Separation)<br />
If two parallel runways are staggered (i.e., their runway thresholds<br />
are <strong>of</strong>fset) use:<br />
• Decrease runway centerline separation by 100 ft. for every 500<br />
ft. <strong>of</strong> stagger<br />
<strong>Runway</strong> 1<br />
2,300 ft.<br />
1,000 ft.<br />
<strong>Runway</strong> 2<br />
Virginia Tech 12
Staggered <strong>Runway</strong>s Rule (Increasing <strong>Runway</strong><br />
Centerline Separation)<br />
If two parallel runways are staggered (i.e., their runway thresholds<br />
are <strong>of</strong>fset) use:<br />
• Increase runway centerline separation by 100 ft. for every 500 ft.<br />
<strong>of</strong> stagger<br />
<strong>Runway</strong> 1<br />
2,700 ft.<br />
1,000 ft.<br />
<strong>Runway</strong> 2<br />
Overlap<br />
Region<br />
Virginia Tech 13
Independent Arrivals under VFR Conditions<br />
Independent simultaneous arrivals can be conducted with at least<br />
700ft between runway centerlines if:<br />
• VFR conditions (visibility > 3 nm)<br />
• No wake vortex effect is present<br />
Independent arrival streams<br />
<strong>Runway</strong> 1<br />
<strong>Runway</strong> 2<br />
700 ft. or more<br />
No wake vortex<br />
effect (seldom<br />
the case)<br />
Increase to<br />
1,200 ft. if<br />
aircraft belong to<br />
Design groups V and VI<br />
Virginia Tech 14
Independent Simultaneous Approaches to<br />
Converging <strong>Runway</strong>s<br />
Procedures governing independent converging approaches require<br />
that the distance between the missed approach points be 3 n.m.<br />
apart and that the Terminal Instrument Procedures (TERPS)<br />
surfaces not overlap. Because <strong>of</strong> these restrictions, minimums are<br />
high, thereby limiting the number <strong>of</strong> airports<br />
NTZ - No Transgression Zone<br />
Assumes the Missed Approach<br />
Envelopes are Non-overlapping<br />
Virginia Tech 15
Dependent Approaches to Parallel <strong>Runway</strong>s<br />
(IFR)<br />
Procedures exist to conduct dependent arrivals when runway<br />
separation is below 4,300 ft. and above 2,500 ft. (standard radar).<br />
<strong>Runway</strong> 1<br />
Dependent arrival streams<br />
2,500 ft. or more 1.5 nm 1.5 nm<br />
<strong>Runway</strong> 2<br />
Virginia Tech 16
Methodologies to Study <strong>Airport</strong> <strong>Capacity</strong>/<br />
Delay<br />
• Analytic models<br />
- Easier and faster to execute<br />
- Good for preliminary airport/airspace planning<br />
(when demand function is uncertain)<br />
- Results are generally less accurate but appropriate<br />
• Simulation-based models<br />
- Require more work to execute<br />
- Good for detailed assessment <strong>of</strong> existing facilities<br />
- Results are more accurate and microscopic in nature<br />
Virginia Tech 17
Methodologies in Use to Study <strong>Capacity</strong>/<br />
Delay<br />
• Analytic models<br />
- Time-space analysis<br />
- Queueing models (deterministic and stochastic)<br />
• Simulation-based models<br />
- Monte Carlo Simulation<br />
- Continuous simulation models<br />
- Discrete-event simulation models<br />
Virginia Tech 18
Time-Space Analysis<br />
• A simple technique to assess runway and airspace<br />
capacity if the headway between aircraft is known<br />
• The basic idea is to estimate an expected headway,<br />
E(h), and then estimate capacity as the inverse <strong>of</strong> the<br />
expected headway<br />
<strong>Capacity</strong><br />
=<br />
1<br />
-----------<br />
Eh ( )<br />
Eh ( )<br />
is expressed in time units (e.g., seconds)<br />
Virginia Tech 19
Time-Space Analysis Nomenclature<br />
δ ij<br />
T ij<br />
δ<br />
is the minimum separation matrix (nm)<br />
is the headway between two successive aircraft (s)<br />
is the minimum arrival-departure separation (nm)<br />
ROT i<br />
is the runway occupancy time for aircraft i (s)<br />
σ 0<br />
(s)<br />
is the standard deviation <strong>of</strong> the in-trail delivery error<br />
V i<br />
is the speed <strong>of</strong> aircraft<br />
i<br />
(lead aircraft) in knots<br />
Virginia Tech 20
Time-Space Analysis Nomenclature<br />
V j<br />
γ<br />
is the trailing aircraft speed (knots)<br />
is the common approach length (nm)<br />
B ij<br />
q v<br />
(s)<br />
is the buffer times matrix between successive aircraft<br />
is the value <strong>of</strong> the cumulative standard normal at<br />
probability <strong>of</strong> violation<br />
p v<br />
p v<br />
is the probability <strong>of</strong> violation <strong>of</strong> the minimum<br />
separation criteria between two aircraft<br />
Virginia Tech 21
Final Approach and Landing Processes<br />
Space<br />
<strong>Runway</strong><br />
ROT i<br />
TD i<br />
ROT j<br />
T i<br />
T j<br />
Time<br />
γ<br />
V<br />
i<br />
V<br />
j<br />
Entry Gate<br />
Virginia Tech 22
Possible Outcomes <strong>of</strong> a Single <strong>Runway</strong> Time-<br />
Space Diagram<br />
Since aircraft approaching a runway arrive in a random<br />
pattern we distinguish between two possible scenarios:<br />
• Closing case - Instance when the approach <strong>of</strong> the lead<br />
aircraft is less than that <strong>of</strong> the trailing aircraft ( )<br />
• Opening Case - Instance when the approach speed <strong>of</strong><br />
lead aircraft is higher than trailing aircraft ( )<br />
V i<br />
V i<br />
><br />
≤<br />
V j<br />
V j<br />
Virginia Tech 23
Closing Case (Equations)<br />
Error Free Headway (assume no pilot and ATC<br />
controller error) assuming control is exercised as the<br />
lead aircraft passes the entry gate<br />
T ij<br />
=<br />
δ<br />
---<br />
ij<br />
V j<br />
(1)<br />
Position Error Consideration (with pilot and ATC<br />
controller error)<br />
B ij<br />
=<br />
σ o q v<br />
(2)<br />
(3)<br />
Virginia Tech 24
Opening Case Diagram (Arrivals Only)<br />
Space<br />
<strong>Runway</strong> ROT i<br />
ROT j<br />
Time<br />
γ<br />
δ ij<br />
1<br />
V<br />
i<br />
1<br />
T i<br />
T j<br />
V<br />
i<br />
V<br />
j<br />
V<br />
j<br />
><br />
Entry Gate<br />
Virginia Tech 25
Opening Case (Equations)<br />
Error Free Headway (no pilot and ATC controller error)<br />
assuming control is exercised as the lead aircraft passes<br />
the entry gate<br />
T ij<br />
=<br />
δ --- ij<br />
+<br />
V γ ⎛---<br />
1 V j<br />
⎝<br />
j<br />
–<br />
1<br />
--- ⎞<br />
⎠<br />
V i<br />
(4)<br />
Position Error Consideration (with pilot and ATC<br />
controller error)<br />
1 1<br />
B ij = σ o q v – δ ij<br />
⎛---<br />
– --- ⎞ B<br />
⎝ ⎠<br />
ij<br />
V j<br />
V i<br />
or zero if < 0. (5)<br />
Virginia Tech 26
Notes on Buffer Times<br />
• According to the model presented buffer times increase<br />
with larger values <strong>of</strong><br />
• For the opening case, the buffer time could become<br />
negative under some circumstances (see equation 6).<br />
B ij<br />
1 1<br />
B ij = σ o q v – δ ij<br />
⎛---<br />
– --- ⎞ B<br />
⎝ ⎠<br />
ij<br />
B ij < 0<br />
V j<br />
V i<br />
or zero if < 0. (6)<br />
if then use zero for the buffer time.<br />
Virginia Tech 27
Understanding Position Errors<br />
Distribution <strong>of</strong><br />
Aircraft Position<br />
No Buffer<br />
50% 50%<br />
Real Aircraft Position<br />
δ ij<br />
Distribution <strong>of</strong><br />
Aircraft Position<br />
<strong>Runway</strong><br />
With Buffer<br />
σ ο q v V j<br />
5%<br />
δ ij<br />
<strong>Runway</strong><br />
Virginia Tech 28
Closing Case Diagram (Arrivals Only)<br />
Space<br />
<strong>Runway</strong> ROT i ROT j<br />
γ<br />
V<br />
i<br />
1<br />
T i T j<br />
δ ij<br />
V < V i j<br />
Time<br />
V<br />
j<br />
1<br />
Entry Gate<br />
Virginia Tech 29
Closing Case (Equations)<br />
Error Free Headway (no pilot and ATC controller error)<br />
assuming control is exercised as the lead aircraft passes<br />
the entry gate<br />
T ij<br />
=<br />
δ<br />
---<br />
ij<br />
V j<br />
(7)<br />
Position Error Consideration (with pilot and ATC<br />
controller error)<br />
B ij<br />
=<br />
σ o q v<br />
(8)<br />
(9)<br />
Virginia Tech 30
Mixed Operations Diagram<br />
Space<br />
<strong>Runway</strong><br />
ROT i<br />
TD i<br />
ROT j<br />
T i<br />
T j<br />
T 1<br />
T 2<br />
T 2 = T j - δ / V j<br />
δ<br />
Time<br />
γ<br />
V<br />
i<br />
G<br />
V<br />
j<br />
T 1 = T i - RΟΤ ι<br />
Entry Gate<br />
G = T 2 - T 1 > 0<br />
E[T ij + B ij ] = E[δ / V j ] + E[ROT i ] + (n-1) E(TD i ) + σ g q vg<br />
Virginia Tech 31
ATC Arrival-Arrival Wake Vortex Separations (I)<br />
IFR In-trail Separations Near <strong>Runway</strong>s in nautical miles for Medium<br />
and Small Size Hub <strong>Airport</strong>s<br />
LEAD<br />
ACFT.<br />
Heavy<br />
Large<br />
Small<br />
Trailing Aircraft<br />
Heavy Large Small<br />
4.00<br />
3.00<br />
3.00<br />
5.00<br />
3.00<br />
3.00<br />
6.00<br />
4.00<br />
3.00<br />
NOTE: for Boeing 757 when taken as a separate class use 4/4/5 nm<br />
respectively (add one more row to the table above)<br />
Virginia Tech 32
ATC Arrival-Arrival Wake Vortex Separations<br />
(II)<br />
IFR In-trail Separations Near <strong>Runway</strong>s in nautical miles for Large<br />
Size Hub <strong>Airport</strong>s<br />
LEAD<br />
ACFT.<br />
Heavy<br />
Large<br />
Small<br />
Trailing Aircraft<br />
Heavy Large Small<br />
4.00<br />
2.50<br />
2.50<br />
5.00<br />
2.50<br />
2.50<br />
6.00<br />
4.00<br />
2.50<br />
NOTE: for Boeing 757 when taken as a separate class use 4/4/5 nm<br />
respectively (add one more row to the table above)<br />
Virginia Tech 33
Departure-Departure ATC Separations<br />
IFR In-trail Departure Separations Near <strong>Runway</strong>s in seconds<br />
LEAD<br />
ACFT.<br />
Heavy<br />
Large<br />
Small<br />
Trailing Aircraft<br />
Heavy Large Small<br />
90<br />
60<br />
60<br />
120<br />
60<br />
60<br />
120<br />
60<br />
60<br />
NOTE: for Boeing 757 when taken as a separate class use 90/90/120<br />
seconds respectively (add one more row to the table above)<br />
Virginia Tech 34
<strong>Review</strong> <strong>of</strong> <strong>Runway</strong> <strong>Capacity</strong> Excel Program<br />
• The Excel template provided in class attempts to<br />
illustrate how the time-space diagram technique can be<br />
“programmed” in a standard spreadsheet<br />
• You can extend the analysis provided in the basic<br />
template to more complex airport configurations<br />
• The program, as it stands now, can only estimate the<br />
saturation capacity <strong>of</strong> a single runway. The program<br />
provides a simple graphical representation <strong>of</strong> the arrival<br />
-departure saturation diagram (sometimes called<br />
capacity Pareto frontier in the literature)<br />
Virginia Tech 35
1<br />
Excel Template Flowchart<br />
Enter runway operation technical parameters<br />
- Arrival minimum separation matrix (δ ij )<br />
- Departure-departure separation matrix (ε ij )<br />
- Arrival-departure minimum separation (δ)<br />
- Common approach length (γ)<br />
- <strong>Runway</strong> occupancy times (ROT i )<br />
- <strong>Runway</strong> departure times (t d )<br />
- Aircraft mix (P i )<br />
- Standard deviation <strong>of</strong> intrail delivery error (s o )<br />
- Probability <strong>of</strong> separation violations (P v )<br />
2<br />
Compute Expected value <strong>of</strong> ROT times (E(ROT))<br />
- E(ROT i )<br />
3<br />
Estimate the “Error-Free” separation matrix<br />
- T ij values using opening and closing cases<br />
Compute expected value<br />
<strong>of</strong> the error-free matrix<br />
E(T ij )<br />
4<br />
Estimate the “Buffer” separation matrix<br />
- B ij values using opening and closing cases<br />
Compute expected value<br />
<strong>of</strong> the buffer matrix<br />
E(B ij )<br />
Virginia Tech 36
Excel Template Flowchart (continuation)<br />
5<br />
Compute augmented separation matrix<br />
- A ij = T ij + B ij (error-free + buffer)<br />
6<br />
Compute the probability matrix (i follows j)<br />
- P ij<br />
7<br />
8<br />
9<br />
Compute expected value <strong>of</strong> A ij matrix<br />
- E(A ij ) = E(T ij + B ij )<br />
Compute expected value <strong>of</strong> departuredeparture<br />
matrix - E(ε ij )<br />
Compute gaps for n departures (n=1,2,...,5)<br />
- E(G n )<br />
Compute arrivals-only<br />
runway saturation capacity<br />
C arr<br />
Compute departures-only<br />
runway saturation capacity<br />
C dep<br />
10<br />
Compute feasible departures per arrival gap<br />
(implemented as an Excel Macro)<br />
Virginia Tech 37
Excel Template Flowchart (continuation)<br />
11<br />
Compute number <strong>of</strong> departures per gap<br />
if arrivals have priority<br />
Departure capacity<br />
with arrival priority<br />
C dep-arr-priority<br />
12<br />
Draw the arrival-departure diagram using<br />
points:<br />
C arr<br />
C dep<br />
C dep-arr-priority<br />
End<br />
Virginia Tech 38
Computer Program Screen 1<br />
1<br />
2<br />
1<br />
Virginia Tech 39
Computer Program (Screen 2)<br />
3<br />
6<br />
4<br />
Virginia Tech 40
Computer Program (Screen 3)<br />
5<br />
1<br />
8<br />
9<br />
Virginia Tech 41
Computer Program (Screen 4)<br />
10<br />
11<br />
Virginia Tech 42
Computer Program (Screen 5)<br />
12<br />
Virginia Tech 43
Estimating <strong>Runway</strong> Saturation <strong>Capacity</strong> for<br />
Complex <strong>Airport</strong> Configurations<br />
• The methodology explained in the previous handout<br />
addresses a simple Time-Space diagram technique to<br />
estimate the runway saturation capacity<br />
• The time-space approach can also be used to estimate<br />
the saturation capacity <strong>of</strong> more complex runway<br />
configurations where interactions occur between<br />
runways<br />
• Example problems taken from the FAA <strong>Airport</strong><br />
<strong>Capacity</strong> benchmark document will be used to illustrate<br />
the points made<br />
Virginia Tech 44
Methodology<br />
• Understand the runway use according to ATC<br />
operations<br />
• Select a primary runway as the basis for your analysis<br />
• Estimate the saturation capacity characteristics <strong>of</strong> the<br />
primary runway using the known time-space method<br />
• Examine gaps in the runway operations at the primary<br />
runway. These gaps might exist naturally (i.e., large<br />
arrival-arrival separations) or might be forced by ATC<br />
controllers by imposing large in-trail separations<br />
allowing operations at other runways<br />
Virginia Tech 45
• If runway operations are independent you can<br />
estimate arrival and departure saturation<br />
capacities for each runway independently<br />
• If the operations on runways are dependent estimate the<br />
runway occupancy times (both for arrivals and<br />
departures) very carefully and establish a logical order f<br />
operations on the runways.<br />
Virginia Tech 46
Example 1 - Charlotte-Douglas Intl. <strong>Airport</strong><br />
Operational Conditions<br />
1) <strong>Runway</strong>s 18R/36L and 18L/36R<br />
are used in mixed operations mode<br />
2) <strong>Runway</strong> 5/23 is inactive<br />
3) Parallel runway separation > 4,3000 ft.<br />
4) ASR-9 airport surveillance radar<br />
(scan time 4.8 seconds)<br />
5) Aircraft mix<br />
a) Heavy - 20%<br />
b) Large - 30%<br />
c) Small - 50%<br />
6) Approach speeds<br />
a) Heavy - 150 knots<br />
b) Large - 140 knots<br />
c) Small - 110 knots<br />
Departures<br />
7) <strong>Runway</strong> occupancy times<br />
a) Heavy - 57 s.<br />
b) Large - 52 s.<br />
c) Small - 49 s.<br />
8) Common approach length - 7 nm<br />
9) In-trail delivery error standard deviation -18 s.<br />
10) Large hub separation criteria (2.5/4/5/6 nm)<br />
11) IMC weather conditions<br />
18R<br />
1,00 5,00 ft<br />
N 0 500<br />
3,000<br />
5<br />
36L<br />
Control<br />
Tower<br />
Terminal<br />
18L<br />
Arrivals<br />
36R<br />
23<br />
Virginia Tech 47
Some Intermediate Results<br />
Departure-Departure<br />
Separation Matrix<br />
Virginia Tech 48
Results <strong>of</strong> CLT Analysis<br />
Single runway analysis - mixed operations<br />
Arrivals (per hour)<br />
30<br />
25<br />
20<br />
15<br />
10<br />
5<br />
0<br />
0 10 20 30 40 50<br />
Departures (per hour)<br />
)<br />
Virginia Tech 49
Results <strong>of</strong> CLT Analysis<br />
Two-parallel runway analysis - mixed operations<br />
Arrivals per Hour<br />
54<br />
0<br />
23<br />
50% arrivals<br />
50% departures<br />
Departures per Hour<br />
95<br />
Virginia Tech 50
<strong>Capacity</strong> Benchmark Results<br />
The FAA capacity benchmarks <strong>of</strong>fer an assessment <strong>of</strong><br />
the estimated capacity by the FAA<br />
Reduced capacity = IMC conditions<br />
Virginia Tech 51
FAA Benchmark Results vs. Our Analysis<br />
Variations occur<br />
because the<br />
assumptions made<br />
in our example<br />
are not necessarily<br />
the same as those<br />
made by FAA<br />
Virginia Tech 52
Example 2 - Charlotte-Douglas Intl. <strong>Airport</strong><br />
Operational Conditions<br />
Departures<br />
1) <strong>Runway</strong> 18R/36L for departures<br />
<strong>Runway</strong> 18L/36R for arrivals<br />
2) <strong>Runway</strong> 5/23 is inactive<br />
3) Parallel runway separation > 4,3000 ft.<br />
4) ASR-9 airport surveillance radar<br />
(scan time 4.8 seconds)<br />
5) Aircraft mix<br />
a) Heavy - 20%<br />
b) Large - 30%<br />
c) Small - 50%<br />
6) Approach speeds<br />
a) Heavy - 150 knots<br />
b) Large - 140 knots<br />
c) Small - 110 knots<br />
7) <strong>Runway</strong> occupancy times<br />
a) Heavy - 57 s.<br />
b) Large - 52 s.<br />
c) Small - 49 s.<br />
8) Common approach length - 7 nm<br />
9) In-trail delivery error standard deviation -18 s.<br />
10) Large hub separation criteria (2.5/4/5/6 nm)<br />
11) IMC weather conditions<br />
18R<br />
1,00 5,00 ft<br />
N 0 500<br />
3,000<br />
5<br />
36L<br />
Control<br />
Tower<br />
Terminal<br />
18L<br />
23<br />
36R<br />
Arrivals<br />
Virginia Tech 53
Results <strong>of</strong> CLT Analysis<br />
Two-parallel runway analysis - segregated operations<br />
Original <strong>Runway</strong> Configuration<br />
Arrivals per Hour<br />
54<br />
27<br />
0<br />
23<br />
New <strong>Runway</strong> Configuration<br />
47<br />
95<br />
Departures per Hour<br />
Virginia Tech 54
Example 3 - Charlotte-Douglas Intl. <strong>Airport</strong><br />
Operational Conditions<br />
1) <strong>Runway</strong>s 18R/36L and 18L/36R<br />
are used in mixed operations mode<br />
2) <strong>Runway</strong> 5/23 is inactive<br />
3) Parallel runway separation > 4,3000 ft.<br />
4) ASR-9 airport surveillance radar<br />
(scan time 4.8 seconds)<br />
5) Aircraft mix<br />
a) Heavy - 20%<br />
b) Large - 30%<br />
c) Small - 50%<br />
6) Approach speeds<br />
a) Heavy - 150 knots<br />
b) Large - 140 knots<br />
c) Small - 110 knots<br />
7) <strong>Runway</strong> occupancy times<br />
a) Heavy - 57 s.<br />
b) Large - 52 s.<br />
c) Small - 49 s.<br />
8) Common approach length - 7 nm<br />
9) In-trail delivery error standard deviation -18 s.<br />
10) Large hub separation criteria (2/3/4/5 nm)<br />
11)VMC weather conditions<br />
Departures<br />
18R<br />
1,00 5,00 ft<br />
N 0 500<br />
3,000<br />
5<br />
36L<br />
Control<br />
Tower<br />
Terminal<br />
18L<br />
Arrivals<br />
36R<br />
23<br />
Virginia Tech 55
Results for CLT VMC Scenario<br />
Single runway analysis - mixed operations<br />
Arrivals (per hour)<br />
40<br />
30<br />
20<br />
10<br />
0<br />
0 20 40 60 80<br />
Departures (per hour)<br />
)<br />
Virginia Tech 56
Results <strong>of</strong> CLT VMC Analysis<br />
Two-parallel runway analysis - mixed operations<br />
Arrivals per Hour<br />
63<br />
54<br />
0<br />
23<br />
IMC<br />
26<br />
VMC<br />
95<br />
118<br />
Departures per Hour<br />
Virginia Tech 57
<strong>Airport</strong> <strong>Capacity</strong> Model (ACM)<br />
• Model developed by FAA to expedite computations <strong>of</strong><br />
runway saturation capacity<br />
• Later modified by John Barrer (at MITRE) to be more<br />
user friendly (using a Visual Basic Interface)<br />
• Inputs and output <strong>of</strong> the model are similar to those<br />
included in the spreadsheet shown in class<br />
• Provides 7-9 data points to plot the arrival-capacity<br />
saturation capacity envelope (Pareto frontier)<br />
Virginia Tech 58
Sample Enhanced ACM Results<br />
Virginia Tech 59
Summary <strong>of</strong> Results<br />
• The saturation capacity <strong>of</strong> an airport depends on the<br />
runway configuration used<br />
• The saturation capacity during VMC conditions is higher<br />
than during IMC conditions (due to shorter separation<br />
minima)<br />
• The variation in technical parameters such as γ and δ<br />
affects the results <strong>of</strong> saturation capacity<br />
• The estimation <strong>of</strong> departures with 100% arrival priority in<br />
our analysis seems very conservative<br />
• The time-space analysis does not provide with delay<br />
results (use deterministic queueing theory or FAA AC<br />
150/5060 to estimate delay)<br />
Virginia Tech 60