A Sharp Interface Cartesian Grid Method for Simulating Flows with ...
A Sharp Interface Cartesian Grid Method for Simulating Flows with ...
A Sharp Interface Cartesian Grid Method for Simulating Flows with ...

You also want an ePaper? Increase the reach of your titles
YUMPU automatically turns print PDFs into web optimized ePapers that Google loves.
374 UDAYKUMAR ET AL.<br />
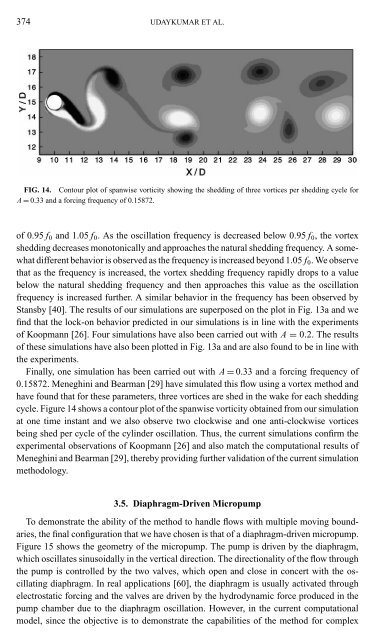
FIG. 14. Contour plot of spanwise vorticity showing the shedding of three vortices per shedding cycle <strong>for</strong><br />
A = 0.33 and a <strong>for</strong>cing frequency of 0.15872.<br />
of 0.95 f 0 and 1.05 f 0 . As the oscillation frequency is decreased below 0.95 f 0 , the vortex<br />
shedding decreases monotonically and approaches the natural shedding frequency. A somewhat<br />
different behavior is observed as the frequency is increased beyond 1.05 f 0 . We observe<br />
that as the frequency is increased, the vortex shedding frequency rapidly drops to a value<br />
below the natural shedding frequency and then approaches this value as the oscillation<br />
frequency is increased further. A similar behavior in the frequency has been observed by<br />
Stansby [40]. The results of our simulations are superposed on the plot in Fig. 13a and we<br />
find that the lock-on behavior predicted in our simulations is in line <strong>with</strong> the experiments<br />
of Koopmann [26]. Four simulations have also been carried out <strong>with</strong> A = 0.2. The results<br />
of these simulations have also been plotted in Fig. 13a and are also found to be in line <strong>with</strong><br />
the experiments.<br />
Finally, one simulation has been carried out <strong>with</strong> A = 0.33 and a <strong>for</strong>cing frequency of<br />
0.15872. Meneghini and Bearman [29] have simulated this flow using a vortex method and<br />
have found that <strong>for</strong> these parameters, three vortices are shed in the wake <strong>for</strong> each shedding<br />
cycle. Figure 14 shows a contour plot of the spanwise vorticity obtained from our simulation<br />
at one time instant and we also observe two clockwise and one anti-clockwise vortices<br />
being shed per cycle of the cylinder oscillation. Thus, the current simulations confirm the<br />
experimental observations of Koopmann [26] and also match the computational results of<br />
Meneghini and Bearman [29], thereby providing further validation of the current simulation<br />
methodology.<br />
3.5. Diaphragm-Driven Micropump<br />
To demonstrate the ability of the method to handle flows <strong>with</strong> multiple moving boundaries,<br />
the final configuration that we have chosen is that of a diaphragm-driven micropump.<br />
Figure 15 shows the geometry of the micropump. The pump is driven by the diaphragm,<br />
which oscillates sinusoidally in the vertical direction. The directionality of the flow through<br />
the pump is controlled by the two valves, which open and close in concert <strong>with</strong> the oscillating<br />
diaphragm. In real applications [60], the diaphragm is usually activated through<br />
electrostatic <strong>for</strong>cing and the valves are driven by the hydrodynamic <strong>for</strong>ce produced in the<br />
pump chamber due to the diaphragm oscillation. However, in the current computational<br />
model, since the objective is to demonstrate the capabilities of the method <strong>for</strong> complex