A Sharp Interface Cartesian Grid Method for Simulating Flows with ...
A Sharp Interface Cartesian Grid Method for Simulating Flows with ...
A Sharp Interface Cartesian Grid Method for Simulating Flows with ...

You also want an ePaper? Increase the reach of your titles
YUMPU automatically turns print PDFs into web optimized ePapers that Google loves.
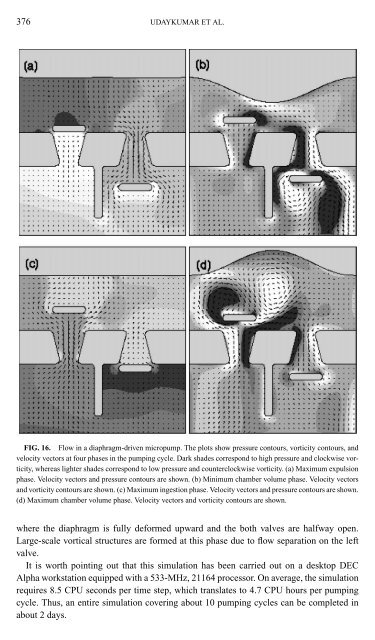
376 UDAYKUMAR ET AL.<br />
FIG. 16. Flow in a diaphragm-driven micropump. The plots show pressure contours, vorticity contours, and<br />
velocity vectors at four phases in the pumping cycle. Dark shades correspond to high pressure and clockwise vorticity,<br />
whereas lighter shades correspond to low pressure and counterclockwise vorticity. (a) Maximum expulsion<br />
phase. Velocity vectors and pressure contours are shown. (b) Minimum chamber volume phase. Velocity vectors<br />
and vorticity contours are shown. (c) Maximum ingestion phase. Velocity vectors and pressure contours are shown.<br />
(d) Maximum chamber volume phase. Velocity vectors and vorticity contours are shown.<br />
where the diaphragm is fully de<strong>for</strong>med upward and the both valves are halfway open.<br />
Large-scale vortical structures are <strong>for</strong>med at this phase due to flow separation on the left<br />
valve.<br />
It is worth pointing out that this simulation has been carried out on a desktop DEC<br />
Alpha workstation equipped <strong>with</strong> a 533-MHz, 21164 processor. On average, the simulation<br />
requires 8.5 CPU seconds per time step, which translates to 4.7 CPU hours per pumping<br />
cycle. Thus, an entire simulation covering about 10 pumping cycles can be completed in<br />
about 2 days.