Optimum Optical Conditions for Fluorescence Imaging Using a ...
Optimum Optical Conditions for Fluorescence Imaging Using a ...
Optimum Optical Conditions for Fluorescence Imaging Using a ...

You also want an ePaper? Increase the reach of your titles
YUMPU automatically turns print PDFs into web optimized ePapers that Google loves.
Journal of <strong>Imaging</strong> Science and Technology® 55(2): 020201-1–020201-8, 2011.<br />
© Society <strong>for</strong> <strong>Imaging</strong> Science and Technology 2011<br />
<strong>Optimum</strong> <strong>Optical</strong> <strong>Conditions</strong> <strong>for</strong> <strong>Fluorescence</strong> <strong>Imaging</strong><br />
<strong>Using</strong> a Confocal Laser Scanning Microscope to Determine<br />
Three-Dimensional Shape of Ink Jet Dots on Paper 1<br />
Toshiharu Enomae and Akira Isogai<br />
Graduate School of Agricultural and Life Sciences, The University of Tokyo, Yayoi 1-1-1, Bunkyo-ku, Tokyo<br />
113-8657, Japan<br />
E-mail: E-mail: enomae@psl.fp.a.u-tokyo.ac.jp<br />
Mikiko Naito, Yasushi Ozaki and Hisato Nagashima<br />
Research Institute, National Printing Bureau, Sakawa 6-4-20, Odawara Kanagawa 256-0816, Japan<br />
Abstract. A nondestructive and simple technique <strong>for</strong> determining<br />
the three-dimensional shape of fixed ink dots was developed, and<br />
the optimum conditions of laser excitation and filters to detect fluorescence<br />
were determined <strong>for</strong> both dye and pigment inks <strong>for</strong> ink jet.<br />
Most magenta and black dye inks emit fluorescence at around 580<br />
and 667 nm through laser excitations at 543 and 633 nm, respectively.<br />
Yellow dye and pigment inks and a magenta pigment ink were<br />
also detected under this condition. The cyan dye ink was excited by<br />
405 nm laser radiation, and the fluorescence was observed by<br />
bandpass filtering ranging from 510 to 650 nm discriminately from<br />
the paper with no fluorescent brightening agent. Cyan and black<br />
pigment inks did not emit detectable fluorescence. <strong>Fluorescence</strong><br />
emitted from the ink jet inks by laser excitation successfully provided<br />
three-dimensional ink distributions with the optical slicing function of<br />
a confocal laser scanning microscope. © 2011 Society <strong>for</strong> <strong>Imaging</strong><br />
Science and Technology.<br />
DOI: 10.2352/J.<strong>Imaging</strong>Sci.Technol.2011.55.2.020201<br />
<br />
IS&T Member.<br />
1<br />
This work was presented in part at the 58th APPITA Annual Conference<br />
and Exhibition in Canberra, Australia, April 2004, at IS&T’s NIP20: International<br />
Conference on Digital Printing Technologies in Salt Lake City,<br />
UT, October 2004, and IS&T’s NIP23: International Conference on Digital<br />
Printing Technologies in Anchorage, AK, September 2007.<br />
Received Oct. 19, 2010; accepted <strong>for</strong> publication Nov. 11, 2010; published<br />
online Mar. 10, 2011.<br />
1062-3701/2011/552/020201/8/$20.00.<br />
INTRODUCTION<br />
The visual appearance of printed images determines the<br />
print quality and depends on the morphology of the fixed<br />
ink as well as its optical per<strong>for</strong>mances. There<strong>for</strong>e, the<br />
mechanisms of ink penetration and setting are very important<br />
<strong>for</strong> all kinds of printing methods. Unlike pigment inks,<br />
dye inks used <strong>for</strong> ink jet printing have no shape at a visible<br />
level after drying, and their distributions cannot be determined<br />
by solid morphology. In this work, attention was first<br />
paid to fluorescence from dye inks to facilitate the observation<br />
of ink geometry—shape, size, location in paper, etc. of<br />
ink dots—using a confocal laser scanning microscope<br />
(CLSM) in routine analyses.<br />
CLSM application is an efficient and in<strong>for</strong>mative technique<br />
<strong>for</strong> observing ink jet ink distribution. It has also been<br />
utilized in other areas of paper science. The most common<br />
applications involve geometrical measurements such as surface<br />
profiles and fiber network structures. Beland et al. 1<br />
measured the surface profiles of a matte-coated paper three<br />
dimensionally using the confocal function and related the<br />
perception of gloss to the surface topography. Aggelidis et<br />
al. 2 visualized the fiber network de<strong>for</strong>mation caused by calendering<br />
to correlate the changes with the macroscopic compressible<br />
elastoviscoplastic response of paper coatings. Xu et<br />
al. 3 determined paper layer structures from discrete layers<br />
created by optical sectioning followed by a dynamic<br />
thresholding method <strong>for</strong> separating fibers from air and artifacts.<br />
Enomae et al. 4 calculated the fiber orientation degree<br />
<strong>for</strong> optically sectioned layers of paper. Observation of the<br />
trace constituents contained in paper is also within the scope<br />
of CLSM.<br />
Khantayanuwong et al. 5 used a CLSM to observe that<br />
the unbonded area between fibers of handsheets increased<br />
with recycling. Ozaki et al. selectively stained polyamide epichlorohydrin<br />
resin in paper with sul<strong>for</strong>hodamine 101 and<br />
observed the resin distribution in the sheet, 6,7 and dyed a<br />
latex binder with Rhodamine B to image coating layers. 8,9<br />
Suominen et al. 10 found that bacteria were mainly localized<br />
in the interface area between the polyethylene layer and the<br />
cellulose fiber web of a food-packaging paperboard stained<br />
with acridine orange. Hamada et al. 11 used a CLSM to compare<br />
the distributions of aqueous and solvent inks on nonwoven<br />
sheets, and the hydrophilicity of the fiber surfaces and<br />
the dispersion of ink pigment particles were found to determine<br />
the evenness of the distributions.<br />
With regard to the analysis of ink penetration into paper,<br />
the most popular method involves the cross sectioning<br />
of a printed sheet <strong>for</strong> microscopic observation. This sectioning<br />
requires manipulative skills, and it is almost impossible<br />
to pinpoint a targeted dot of ink. Microscopic offset ink<br />
locations can also be determined by stereoscopic backscatter<br />
imaging utilizing scanning electron microscopy. 12 The cross<br />
sectioning of a paper sheet with a focused ion beam without<br />
J. <strong>Imaging</strong> Sci. Technol. 020201-1<br />
Mar.-Apr. 2011
Enomae et al.: <strong>Optimum</strong> optical conditions <strong>for</strong> fluorescence imaging using a confocal laser scanning microscope…<br />
Key<br />
Table I. List of ink jet paper samples.<br />
Grade<br />
Basis weight<br />
g/m 2 <br />
60° gloss<br />
A Photo quality 295.9 39<br />
B Photo quality 232.3 32<br />
C High gloss type 183.5 57<br />
D Medium 108.6 3<br />
E Photo quality 261.1 37<br />
any destruction is one of the latest techniques <strong>for</strong> the clear<br />
observation of a thin printed ink layer on paper. 13–15 Timeof-flight<br />
secondary ion mass spectrometry is a powerful tool<br />
to determine the extent of ink penetration with the element<br />
distribution with depth and to create cross-sectional images<br />
of a printed sheet. 16,17<br />
This work introduces a much simpler method <strong>for</strong> obtaining<br />
the three-dimensional (3D) shape of any targeted dot<br />
of a magenta or black dye ink without any particular sample<br />
preparation skills using a CLSM first. This study explores the<br />
extension of this technique to all four primary colors: cyan,<br />
magenta, yellow, and black dye and pigment inks in addition<br />
to the magenta dye ink.<br />
EXPERIMENT<br />
Paper Samples, Printers, and Inks<br />
Photo-quality papers A and B, high-gloss-type paper C, and<br />
medium-grade paper D, all of which have a silica coating <strong>for</strong><br />
ink jet, were used. Table I lists the paper samples used.<br />
Specular gloss at 60° was measured using a glossmeter<br />
(GM-268, Konica Minolta). The mean values in the machine<br />
and cross directions are presented in the table. Homogeneous<br />
color patterns with a dot area ratio of 10% or 20%<br />
were printed on each sheet with magenta and black inks<br />
from ink jet printer A.<br />
In order to analyze other inks, commercially available<br />
photo-grade glossy paper E was used. A 1-mm-wide line was<br />
output onto a paper sheet at a resolution of 600600 dpi<br />
with each of the two ink jet printers B and C. For printer B,<br />
cyan, magenta, and yellow inks were dye-based; only the<br />
black ink was pigment-based. For printer C, all inks were<br />
pigment-based. Each ink was taken out of the ink cartridge<br />
to determine the fluorescence properties.<br />
Laser Scanning Microscope and Observation<br />
A CLSM (LSM 510) with an upright body (Axioplan 2, Carl<br />
Zeiss, Germany) was utilized. This type of optical microscope<br />
obtains 3D images by optical slicing in the thickness<br />
direction using the confocal system, employing the power of<br />
laser beams to compensate <strong>for</strong> the resultant insufficient illumination.<br />
Laser beams fall on the front side of the sample.<br />
The fluorescent light emitted from the fluorescent components<br />
of the coloring material included in the ink enters the<br />
detector to provide a fluorescence image. A 3D image is<br />
reconstructed from a series of digitally accumulated single<br />
Table II. <strong>Optical</strong> condition applied <strong>for</strong> measuring dye ink dot shape by fluorescence<br />
method.<br />
Color of ink jet ink emitting fluorescence Magenta Black<br />
<strong>Optimum</strong> exciting wavelength nm 550 green 650 reddish-yellow<br />
Maximum fluorescence wavelength nm<br />
580 greenishyellow<br />
667 red<br />
Wavelength of irradiation laser nm 543 633<br />
Wavelength of color filter <strong>for</strong> detection<br />
nm 560–615 650<br />
Default pseudocolor in fluorescence<br />
image <strong>for</strong> LSM-510 Red Blue<br />
confocal images. The magenta and black dye inks from<br />
printer A were subjected to observation with the a<strong>for</strong>ementioned<br />
system.<br />
A piece of printed sample cut to approximately<br />
1515 mm 2 was mounted on a slide glass. Next, a drop of<br />
fluid paraffin was placed on its corner or edge to allow it to<br />
penetrate the sample spontaneously to the other end, leaving<br />
as few air bubbles as possible. A cover glass was then<br />
mounted on it, and the specimen was subjected to observation.<br />
As an impregnation liquid in the case of silica-based<br />
ink jet coatings, fluid paraffin was selected because its refractive<br />
index is approximately 1.47, which is close to that of<br />
silica (approximately 1.45). Less light refraction occurs between<br />
substances with closer refractive indices, and even porous<br />
materials appear transparent when such a liquid fills the<br />
pores.<br />
For observation, the objective lens selected was mainly<br />
Plan-Neofluar 40 /0.75. At this magnification, one<br />
XY-plane image corresponds to 230.3230.3 m 2 with a<br />
thickness of a single confocal plane of 0.60 m. The speed<br />
of laser scanning was approximately 30 or 60 s per single<br />
image of 10241024 pixels. The laser intensity ranged between<br />
30% and 80% of the maximum outputs. The duration<br />
of laser irradiation at the same location was as short as 2.3<br />
ms at most if 40 slices were assumed to be accumulated.<br />
There<strong>for</strong>e, fluorescence degradation could be ignored, although<br />
it should be always considered in fluorescent observation.<br />
The choice of laser beams was adjusted to the FITC/<br />
Rhod/Cy5 mode from the fluorescence probe database.<br />
Rhod and Cy5 modes, respectively, suit the magenta and<br />
black dye ink dots well <strong>for</strong> observation. Table II presents a<br />
default condition with regard to the wavelength ranges of<br />
exciting and fluorescent lights <strong>for</strong> the magenta and black<br />
inks. The ink jet ink dyes appear to have fluorescence properties<br />
similar to those registered in the database.<br />
For analyses of cyan and yellow dye inks and all pigment<br />
inks, fluorescence images were obtained using another<br />
type of CLSM (TCS-SP5, Leica, Germany) equipped with a<br />
63 oil-immersion objective lens (HCX PL APO, numerical<br />
aperture of 1.40) that suits an immersion oil with a refractive<br />
index of 1.518 supplied by Leica. For observation in the<br />
oil-immersion mode, paraffin oil was not applied. Instead,<br />
the immersion oil recommended by Leica was applied to<br />
J. <strong>Imaging</strong> Sci. Technol. 020201-2<br />
Mar.-Apr. 2011
Enomae et al.: <strong>Optimum</strong> optical conditions <strong>for</strong> fluorescence imaging using a confocal laser scanning microscope…<br />
prevent the lens from damage that may be caused by the<br />
direct contact with oil. The Z (thickness) resolution of the<br />
oil-immersion lens is improved to less than 0.6 m, which<br />
is threefold better than that in a lens with air between the<br />
sample and the objective lens. 18 Excitation wavelengths of<br />
488 nm specific <strong>for</strong> an Ar laser and 405 nm from a diode<br />
laser were primarily used <strong>for</strong> observation of the printed paper<br />
samples by the CLSM. The pinhole diameter was adjusted<br />
to 151.6 m. Confocal images were obtained using<br />
both XYZ and XZY scan modes. In the XYZ mode, a sequence<br />
of XY (plane of the paper) frames was obtained at<br />
0.15 m intervals in the Z-direction. In the XZY mode, XZ<br />
images were obtained through rapid depth scanning. A series<br />
of XZ (paper cross section) frames were taken at<br />
3.6 m intervals in the Y-direction. The frame size was<br />
512512 pixels throughout. The measurement time depended<br />
on the number of steps and accumulations and the<br />
sequential scan mode; it ranged between 3 and 10 min. In<br />
most reconstructed images in the following sections, colors<br />
of fluorescence are represented in pseudocolors or white <strong>for</strong><br />
best contrast; these differ from the true colors of emitted<br />
fluorescence.<br />
Determination of <strong>Fluorescence</strong> from Ink Jet Inks<br />
To determine the optimum excitation and fluorescence<br />
wavelengths, 3D fluorescence spectra of excitation and fluorescence<br />
were measured using a fluorescence spectrophotometer<br />
(F-2500, Hitachi). The 3D measurement technique<br />
was applied to measure the emission spectrum of a sample<br />
as the excitation wavelength was scanned. <strong>Fluorescence</strong><br />
properties were determined with an ink solution of the magenta<br />
pigment ink from printer C diluted well with deionized<br />
water. The fluorescence spectra obtained with other<br />
inks were measured using the function of TCS-SC5.<br />
Quantitative Dot Shape Analysis<br />
In order to analyze dot shape quantitatively, a relatively large<br />
dot of the black dye ink from printer A was <strong>for</strong>med using a<br />
testing ink jet head (HEK-1, Konica-Minolta, Japan) on the<br />
general-grade ink jet paper E.<br />
RESULTS AND DISCUSSION<br />
Determination of 3D Structure of Ink Dots<br />
Figure 1 presents example images of ink jet dots composed<br />
of four colors: cyan, magenta, yellow, and black acquired<br />
using a CLSM. All inks were of the dye type from printer A.<br />
The images on the left and right sides are regular white light<br />
reflected images and fluorescence images, respectively. Although<br />
the two images were not acquired from the same<br />
location, it was found that the magenta ink emits fluorescence<br />
in greenish-yellow, the black ink emits fluorescence in<br />
red, and neither cyan nor yellow ink emits fluorescence under<br />
this optical condition. This observation demonstrated<br />
that fluorescence emitted by magenta and black dye inks<br />
could be measured to determine the 3D ink dot distribution.<br />
Black<br />
Magenta<br />
20 µm<br />
Cyan<br />
20 µm 20 µm<br />
Figure 1. Ink jet dots of cyan, magenta, yellow, and black in reflected<br />
light left and fluorescence right images, not in identical locations. Preset<br />
pseudocolors are presented <strong>for</strong> fluorescence. Practically, the blue and<br />
red colors represent greenish-yellow and red, respectively.<br />
Figure 2. Reconstructed images of magenta ink dots on photo-quality<br />
paper A. Greenish-yellow fluorescence emitted by magenta ink is assigned<br />
to white to enable clear discernment from the paper background<br />
in black.<br />
Dye inks of the same colors used <strong>for</strong> ink jet printers of other<br />
manufacturers were found to exhibit the same fluorescence<br />
patterns.<br />
Figures 2 and 3 present reconstructed images of the<br />
orthogonal projection <strong>for</strong> magenta ink dots on photoquality<br />
papers A and B, respectively. In each combined image,<br />
the largest (bottom left) picture is the front elevational<br />
view in the XY-plane at height Z, sectioning the vertical<br />
center of most dots. The top picture is <strong>for</strong> the XZ-plane<br />
when the sample is sectioned virtually along the horizontal<br />
line in the XY-plane image. The bottom right picture is <strong>for</strong><br />
the YZ-plane when the sample is sectioned virtually along<br />
the vertical line in the XY-plane image. In addition to planar<br />
dot shape and size, these combined images offer individual<br />
dot thickness in<strong>for</strong>mation from the XZ- and YZ-plane images.<br />
The thickness is estimated to be constantly approximately<br />
4 m <strong>for</strong> both papers. The density distribution inside<br />
the dots in the XY-plane <strong>for</strong> paper B is less<br />
homogeneous than that <strong>for</strong> paper A, suggesting lower homogeneity<br />
of either coating pigment or ink distribution <strong>for</strong><br />
paper B.<br />
J. <strong>Imaging</strong> Sci. Technol. 020201-3<br />
Mar.-Apr. 2011
Enomae et al.: <strong>Optimum</strong> optical conditions <strong>for</strong> fluorescence imaging using a confocal laser scanning microscope…<br />
20 µm<br />
20 µm<br />
Figure 3. Reconstructed images of magenta ink dots on photo-quality<br />
paper B. Greenish-yellow fluorescence emitted by magenta ink is assigned<br />
to white to enable clear discernment from the paper background<br />
in black.<br />
Figure 5. Reconstructed images of dye black ink dot on medium-grade<br />
paper D in orthogonal projection with the dark blue zone indicating<br />
black ink dot.<br />
Depth,µm<br />
0<br />
-10<br />
-20<br />
-50 -40 -30 -20 -10 0 10 20 30 40 50<br />
Diameter of area-equivalent circles, µm<br />
Figure 6. Distribution of diameters of circles that are area-equivalent to<br />
each slice of optically sectioned dot along the depth from the paper<br />
surface <strong>for</strong> the black dye ink dot shown in the previous figure.<br />
20 µm<br />
Figure 4. Reconstructed images of dye magenta ink dots on high-glosstype<br />
paper C. Greenish-yellow fluorescence emitted by magenta ink is<br />
assigned to white to enable clear discernment from the paper background<br />
in black.<br />
Figure 4 presents reconstructed images <strong>for</strong> the highgloss-type<br />
paper C. Bright curved lines are visible around<br />
some dots. These are a part of the ink dye that spread over<br />
the surfaces of crevices present in the coating surface layer<br />
and became concentrated there. Cast coating is often applied<br />
to manufacture this gloss-type paper; however, it tends to<br />
incur defects such as these surface crevices. The ink appeared<br />
to spread over the crevice surfaces twofold to threefold<br />
farther than normal penetration, judging from the long<br />
bright legs observed in dot cross sections in the XZ- and<br />
YZ-planes. This undesirable ink penetration may decrease<br />
the color density.<br />
Approach to Quantitative Analysis<br />
Figure 5 is a composite image of fluorescent light and transmitted<br />
white light <strong>for</strong> a single dot of the black dye ink on<br />
paper D. This image in the XY-plane is one of the 32 slices<br />
across which the ink dot extends vertically. The composite<br />
image shows that the ink appears to have spread out, avoiding<br />
large secondary particles of silica. One of the typical<br />
problems of CLSM is the attenuation of fluorescence with<br />
depth in a 3D image construction. The deeper the location<br />
in the sample, the weaker the fluorescence. This is because<br />
the laser beam has a longer path to reach a location due to<br />
light absorption, scattering, and excitation. Resultant fluorescence<br />
also comes through a longer path from that location<br />
with light absorption and scattering. <strong>Fluorescence</strong> was<br />
previously detected 150 m below the top surface in the<br />
case of uncoated paperboard. 19 Ink dots approximately<br />
20 m deep appear to emit enough fluorescence to permit<br />
image reconstruction.<br />
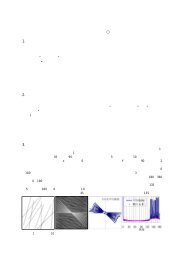
Figure 6 presents a schematic side view of a black ink<br />
dot as a stack of circles that have the same area with an ink<br />
region in each slice. Binary images were created <strong>for</strong> all slices<br />
in accordance with the following steps: The threshold level<br />
was determined <strong>for</strong> the central slice by applying discrimination<br />
analysis to the Laplacian (secondary differentiation) histogram;<br />
the relevant ink dot region within the slice was extracted;<br />
and, finally, this procedure was applied to all slices.<br />
Xu and Parker 20 applied a method of fitting a curve to the<br />
experimental intensity versus depth data and realized an<br />
easier and more intimate assessment of cross sections of<br />
wood fibers and paper sheets. In our work, however, much<br />
less fluorescence reduction was realized to determine locations<br />
of ink dot fragments even in deep slices with fluid<br />
paraffin that has a refractive index of 1.47 applied to impreg-<br />
J. <strong>Imaging</strong> Sci. Technol. 020201-4<br />
Mar.-Apr. 2011
Enomae et al.: <strong>Optimum</strong> optical conditions <strong>for</strong> fluorescence imaging using a confocal laser scanning microscope…<br />
700<br />
(a)<br />
Exciting<br />
wavelength, nm<br />
400 0<br />
400 <strong>Fluorescence</strong> wavelength, nm 700<br />
Relative intensity, %<br />
100<br />
(a)<br />
80<br />
60<br />
40<br />
20<br />
0<br />
500 550 600 650<br />
Wave length, nm<br />
700<br />
(b)<br />
Exciting<br />
wavelength, nm<br />
400 400 <strong>Fluorescence</strong> wavelength, nm 700<br />
0<br />
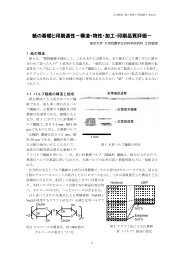
Figure 7. Three-dimensional fluorescence spectra of a de-ionized water<br />
and b magenta pigment ink.<br />
nate coatings to provide improved transparency as well as<br />
limited ink location near the surface layer of paper.<br />
In counting the number of pixels, the ink region of each<br />
slice was found to have an irregular shape, sometimes having<br />
inside holes and small discrete fractions away from the main<br />
part. The hole areas were excluded from the ink region, but<br />
all discrete fractions were included. The number of pixels<br />
was converted to exact volume in micrometers cubed based<br />
on the practical 3D pixel size. In the figure, every circle is<br />
shown justified to the center. This 3D area-equivalent stack<br />
suggests that the tapering top of the ink dot derives from<br />
surface roughness, and the tapering bottom derives from<br />
inhomogeneous ink penetration with feathering. The largest<br />
circle is located slightly higher than the through-thickness<br />
center, meaning that longer feathering occurred during the<br />
ink penetration to a greater extent than the surface roughness<br />
level.<br />
Pigment Inks and Dye Inks <strong>for</strong> Ink Jet<br />
Figure 7 presents the 3D fluorescence spectra of the deionized<br />
water and the magenta pigment ink from printer C.<br />
The linear raised part in the center does not indicate fluorescence;<br />
it simply shows the reflection of exciting (illuminating)<br />
light. Compared to the spectrum of water with no<br />
fluorescence emission observed [Fig. 7(a)], the magenta ink<br />
had fluorescence on wavelengths between 550 and 600 nm<br />
<strong>for</strong> the excitation wavelength range from 500 to 580 nm<br />
[Fig. 7(b)].<br />
Figures 8 and 9 present the fluorescence spectra of dye<br />
and pigment inks, respectively. The most efficient excitation<br />
wavelength (405 or 488 nm) was selected <strong>for</strong> each ink from<br />
the several diode laser wavelengths. Each spectrum is presented<br />
in reference to the highest fluorescence response in<br />
the spectrum. The magenta and yellow of both dye and pigment<br />
inks emit fluorescence at an excitation wavelength of<br />
Relative intensity, %<br />
Relative intensity, %<br />
100<br />
80<br />
60<br />
40<br />
20<br />
(b)<br />
0<br />
500 550 600 650<br />
Wave length, nm<br />
100<br />
80<br />
60<br />
40<br />
20<br />
(c)<br />
0<br />
500 550 600 650<br />
Wave length, nm<br />
Figure 8. <strong>Fluorescence</strong> spectra of dye inks: a magenta at excitation<br />
wavelength of 488 nm, b yellow at excitation wavelength of 488 nm,<br />
and c cyan at excitation wavelength of 405 nm.<br />
488 nm. The magenta dye exhibited a strong fluorescence<br />
peak at around 590 nm, which is close to the maximum<br />
fluorescence wavelength already known, as shown in Table<br />
II. The magenta pigment ink exhibited two peaks at 548 and<br />
590 nm as shown in Fig. 9(a). The yellow dye ink exhibited<br />
a small peak at around 525 nm. The yellow pigment ink<br />
exhibited a broad fluorescence peak at around 550 nm as<br />
shown in Figs. 8(b) and 9(b), respectively. The cyan inks<br />
exhibited a fluorescence peak at around 460 nm <strong>for</strong> the dye<br />
ink and at around 480 nm <strong>for</strong> the pigment ink, both at an<br />
excitation wavelength of 405 nm, as shown in Figs. 8(c) and<br />
9(c), respectively. Black pigment inks from both printers B<br />
and C exhibited no fluorescence at any excitation wavelength,<br />
although the black dye ink exhibited a clear fluorescence,<br />
as mentioned in the previous section. Black pigments<br />
commonly consisting of carbon black have no chromophores;<br />
however, black dye inks consist of mixed several<br />
dyes, one or some of which have chromophores.<br />
Figure 10 presents reconstructed images of the yellow<br />
dye ink printed samples that were obtained in the XYZ scan<br />
mode of the CLSM. The deepest ink penetration depth of<br />
each dot was evaluated to range between 6 and 11 m from<br />
dot to dot, resulting in widely distributed penetration. Consequently,<br />
the inks tended to penetrate more deeply as the<br />
diameter of the ink dot increased. Within one ink dot, the<br />
ink appears to have penetrated more deeply in the central<br />
J. <strong>Imaging</strong> Sci. Technol. 020201-5<br />
Mar.-Apr. 2011
Enomae et al.: <strong>Optimum</strong> optical conditions <strong>for</strong> fluorescence imaging using a confocal laser scanning microscope…<br />
Relative intensity, %<br />
Relative intensity, %<br />
100<br />
(a)<br />
80<br />
60<br />
40<br />
20<br />
0<br />
500 550 600 650<br />
Wave length, nm<br />
100<br />
(b)<br />
80<br />
60<br />
40<br />
20<br />
0<br />
500 550 600 650<br />
Wave length, nm<br />
Figure 11. Reconstructed image of cyan dye ink dots on paper E obtained<br />
in the XZY scan mode of CLSM.<br />
Line 1<br />
Line 2<br />
16.4 µm<br />
Relative intensity, %<br />
(c)<br />
100<br />
80<br />
60<br />
40<br />
20<br />
0<br />
500 550 600 650<br />
Wave length, nm<br />
16.4 µm<br />
Figure 12. Reconstructed images of magenta pigment ink dots on paper<br />
E obtained in the XYZ scan mode of CLSM.<br />
Figure 9. <strong>Fluorescence</strong> spectra of pigment inks: a magenta at excitation<br />
wavelength of 488 nm, b yellow at excitation wavelength of 488<br />
nm, and c cyan at excitation wavelength of 405 nm.<br />
Line 2<br />
13.5 µm<br />
Line 2<br />
22.08 µm<br />
Line 1<br />
Line 1<br />
13.5 µm<br />
22.08 µm<br />
Figure 10. Reconstructed images of yellow dye ink dots on paper F<br />
obtained in the XYZ scan mode of CLSM.<br />
part than in the peripheral part, in contrast to the tendency<br />
found in Figs. 2 and 3. This appears to be due to the absence<br />
of an ink fixing layer on the top of ink jet paper E only or<br />
the lower speed of lateral spreading of an ink drop on the<br />
surface of ink jet paper E.<br />
Figure 11 presents an XZ-plane image of the cyan dye<br />
ink printed sample that was obtained directly in the XZY<br />
scan mode instead of the regular XYZ scan mode. The XZY<br />
scan mode was chosen because fluorescence from the cyan<br />
Figure 13. Reconstructed images of yellow pigment ink dots on paper E<br />
obtained in the XYZ scan mode of CLSM.<br />
dye ink might be degraded by laser irradiation <strong>for</strong> the duration<br />
of scanning. This technique seems to be effective <strong>for</strong><br />
coloring materials that tend to lose fluorescence properties<br />
rapidly. The cyan dye ink in the glossy photo-ink jet paper<br />
could be well observed by the CLSM because it maintained<br />
sufficient fluorescence intensity, and the ink jet paper had no<br />
competitive fluorescence. In the case of commercial woodfree<br />
paper or common ink jet paper, however, the cyan dye<br />
ink could not be observed successfully because the optical<br />
brightening agents contained in the paper emitted strong<br />
fluorescence at the excitation wavelength of 405 nm.<br />
Figure 12 presents reconstructed images <strong>for</strong> the magenta<br />
J. <strong>Imaging</strong> Sci. Technol. 020201-6<br />
Mar.-Apr. 2011
Enomae et al.: <strong>Optimum</strong> optical conditions <strong>for</strong> fluorescence imaging using a confocal laser scanning microscope…<br />
Table III. <strong>Optimum</strong> conditions of exciting wavelength and optical filter wavelength.<br />
Ink<br />
<strong>Optimum</strong> exciting laser<br />
wavelengthnm<br />
<strong>Optical</strong> filter wavelength<br />
rangenm<br />
Cyan dye ink 405 420–550<br />
Cyan pigment ink Not available Not available<br />
Magenta dye ink 1 543 560–615<br />
Magenta dye ink 2 488 510–650<br />
Magenta pigment ink 488 510–650<br />
Yellow dye ink 488 510–650<br />
Yellow pigment ink 488 510–650<br />
Black dye ink 633 650<br />
Black pigment ink Not available Not available<br />
pigment printed sample obtained in the XYZ scan mode of<br />
the CLSM. In comparison with the common light-reflection<br />
microscopic image at the same location, it was confirmed<br />
that the distribution of the ink pigment fixed on the ink jet<br />
paper appeared sharp in the fluorescence images. The fluorescence<br />
spectrum in Fig. 8(a) suggests that there are two<br />
fluorescent chromophore groups or compounds present in<br />
the ink. It is known that the ink-receptive layer of the paper<br />
emitted neither fluorescence corresponding to the two peaks.<br />
There<strong>for</strong>e, these fluorescence properties resulted in the distinguished<br />
images, although the relation with the molecular<br />
structure could not be discussed any further because the<br />
chromophore chemical structures and even Color Index<br />
numbers of all the inks are disclosed by the manufacturers.<br />
Figure 13 presents the reconstructed images <strong>for</strong> the yellow<br />
pigment printed sample obtained in the XYZ scan<br />
mode. The thickness of the ink layer was estimated to be<br />
approximately 4 m from the full Z-depth of 13.5 m.<br />
This thickness of the ink layer located limitedly near the<br />
surface was estimated to be lower than those of the yellow<br />
and cyan dye inks, as Desie et al. 21 clarified that the<br />
pigment-based inks create pigment filter cakes by aggregation<br />
of pigment particles on the top of the surface at initial<br />
imbibitions.<br />
A cyan pigment printed sample was searched <strong>for</strong> fluorescence,<br />
but appropriate optical conditions could not be<br />
found to discriminate it from paper. This is presumably because<br />
the absolute fluorescence intensity of the ink was very<br />
low, although the peak observed in Fig. 8(c) appears relatively<br />
intense. Consequently, this cyan pigment ink fixed on<br />
paper was one of the two inks that could not be observed by<br />
the CLSM (the other was the black pigment ink).<br />
<strong>Optical</strong> <strong>Conditions</strong> of Laser and Filter Wavelengths<br />
Table III lists the optimum conditions <strong>for</strong> the combination<br />
of wavelength between laser irradiation and optical bandpass<br />
filter to observe the dye and pigment inks using a CLSM<br />
obtained from the experiments thus far. The Leica microscope<br />
permits one to select the exciting wavelength and configure<br />
filter wavelengths arbitrarily and independently, while<br />
the Carl–Zeiss microscope permits one to select the combination<br />
from several default patterns. There<strong>for</strong>e, there were<br />
differences in the wavelength between the two microscopes.<br />
Although these conditions are expected to apply to many<br />
other kinds of inks of the same color <strong>for</strong> an ink jet, they will<br />
not apply to every ink.<br />
CONCLUSIONS<br />
Most magenta and black dye inks <strong>for</strong> ink jets emit fluorescence<br />
at around 580 and 667 nm by laser excitations at 543<br />
and 633 nm, respectively. These fluorescence properties are<br />
useful <strong>for</strong> providing three-dimensional ink distributions using<br />
a confocal laser scanning microscope. In applications to<br />
ink jet papers, the shape of ink dots on photo-quality paper,<br />
cast-coated high-gloss paper, and medium-grade paper was<br />
coinlike with a constant thickness, extensional due to spread<br />
over crevice surfaces, and rough with rugged edges, respectively.<br />
Three-dimensional image analysis applied to a single<br />
ink dot resulted in the largest cross section located slightly<br />
higher than the thickness center. Extension of this method<br />
was attempted using other inks. It was found that the<br />
method is applicable to all colors of dye and pigment inks<br />
except cyan pigment and black pigment inks. The cyan dye<br />
ink was excited by a 405 nm laser and could be observed<br />
discriminately from the paper with no fluorescent brightening<br />
agent. The magenta and yellow dye and pigment inks<br />
were excited by a 488 nm laser and were observed<br />
successfully.<br />
ACKNOWLEDGMENTS<br />
The authors wish to thank Kazumasa Matsumoto and Kenzo<br />
Nakanishi of the Konica Minolta Technology Center, Japan<br />
<strong>for</strong> permitting us to use the testing ink jet head and<br />
Fumihiro Fujimaki of Nakagawa Manufacturing Co., Ltd.,<br />
Japan <strong>for</strong> supplying ink jet printing paper samples.<br />
REFERENCES<br />
1 M. C. Beland, S. Lindberg, and P. A. Johansson, “<strong>Optical</strong> measurement<br />
and perception of gloss quality of printed matte-coated paper”, J. Pulp<br />
Pap. Sci. 26, 120 (2000).<br />
2 C. N. Aggelidis, M. Pasquali, and L. E. Scriven, “Calendering: Rheology,<br />
computations, and experiments”, Proc. of the 13th Int. Congress on<br />
Rheology (British Society of Rheology, Glasgow, 2000) Vol. 3, p. 425.<br />
3 L. Xu, I. Parker, and C. Osborne, “Technique <strong>for</strong> determining the fibre<br />
distribution in the z-direction using confocal microscopy and image<br />
analysis”, Appita J. 50, 325–328 (1997).<br />
4 T. Enomae, Y.-H. Han, A. Isogai, M. Hotate, and S. Hasegawa,<br />
“Mechanisms of perception of laid lines in Japanese paper”, J. of Wood<br />
Science 56, 395 (2010).<br />
5 S. Khantayanuwong, T. Enomae, and F. Onabe, “Effect of<br />
fiber hornification in recycling on bonding potential at interfiber<br />
crossings: Confocal laser-scanning microscopy”, Tappi J. 56, 79–85<br />
(2002).<br />
6 Y. Ozaki, “The observation of wet-strength resin in the paper by the<br />
confocal laser scanning microscope”, Fibers preprints, JAPAN 58, 176<br />
(2003) (in Japanese).<br />
7 Y. Ozaki, D. W. Bousfield, and S. M. Shaler, “The characterization of<br />
polyamide epichlorohydrin resin in paper—Relationship between<br />
beating degree of pulp and wet strength”, Appita J. 59, 326–329 (2003).<br />
8 Y. Ozaki, D. W. Bousfield, and S. M. Shaler, “Observation of the ink<br />
penetration into coated paper by confocal laser scanning microscope”,<br />
TAGA J. 3, 51–59 (2006).<br />
9 Y. Ozaki, D. W. Bousfield, and S. M. Shaler, “Three-dimensional<br />
observation of coated paper by confocal laser scanning microscope”,<br />
Tappi J. 5, 3–8 (2006).<br />
10 I. Suominen, M.-L. Suihko, and M. Salkinoja-Salonen, “Microscopic<br />
J. <strong>Imaging</strong> Sci. Technol. 020201-7<br />
Mar.-Apr. 2011
Enomae et al.: <strong>Optimum</strong> optical conditions <strong>for</strong> fluorescence imaging using a confocal laser scanning microscope…<br />
study of migration of microbes in food-packaging paper and board”, J.<br />
Ind. Microbiol. Biotechnol. 19, 104–113 (1997).<br />
11 H. Hamada, D. W. Bousfield, and W. T. Luu, “Absorption mechanism of<br />
aqueous and solvent inks into synthetic nonwoven fabrics”, J. <strong>Imaging</strong><br />
Sci. Technol. 53, 050201 (2009).<br />
12 T. Helle and P. O. Johnsen, “<strong>Using</strong> stereoscopic and SEM backscatter<br />
imaging <strong>for</strong> studying ink distribution details on paper and fiber<br />
surfaces”, J. Pulp Pap. Sci. 20, 189–192 (1994).<br />
13 H. Uchimura and M. Kimura, “A sample preparation method <strong>for</strong> paper<br />
cross-sections using a focused ion beam”, Sen’i Gakkaishi 54, 360–366<br />
(1998) (in Japanese).<br />
14 H. Uchimura, “Preparation method of paper and printed paper crosssections<br />
using a focused ion beam to observe it with microscope”, Nihon<br />
Gazo Gakkaishi (J. of the <strong>Imaging</strong> Society of Japan) 42, 168–172 (2003)<br />
(in Japanese).<br />
15 H. Uchimura, Y. Ozaki, and M. Kimura, “Observation of dyed ink<br />
penetrated into ink jet printing paper”, J. of Printing Science and<br />
Technol. 38, 216–224 (2001) (in Japanese).<br />
16 J. Pinto and M. Nicholas, “SIMS studies of ink jet media”, inRecent<br />
Progress in Ink Jet Technologies II (IS&T, Springfield, VA, 1999), pp.<br />
383–389.<br />
17 M. Shibatani, T. Asakawa, T. Enomae, and A. Isogai, “Approach <strong>for</strong><br />
detecting localization of inkjet ink components using dynamic-SIMS<br />
analysis”, Colloids Surf., A 326, 61–66 (2008).<br />
18 E. H. K. Sterlzer, Handbook of Biological Confocal Microscopy (Plenum,<br />
New York, 1995), pp. 139–153.<br />
19 T. Enomae, Y.-H. Han, and A. Isogai, “Z-Directional distribution of fiber<br />
orientation of Japanese and western papers determined by confocal laser<br />
scanning microscopy”, J. of Wood Science 54, 300–307 (2008).<br />
20 L. Xu and I. Parker, “Correction of fluorescence attenuation with depth<br />
in fibre and paper images collected by confocal laser scanning<br />
microscopy”, Appita J. 52, 41–44 (1999).<br />
21 G. Desie, G. Deroover, F. De Voeght, and A. Soucemarianadin, “Printing<br />
of dye and pigment-based aqueous inks onto porous substrates”, J.<br />
<strong>Imaging</strong> Sci. Technol. 45, 389–397 (2004).<br />
J. <strong>Imaging</strong> Sci. Technol. 020201-8<br />
Mar.-Apr. 2011