DFS Resource Assessment - Delaware Department of Agriculture
DFS Resource Assessment - Delaware Department of Agriculture
DFS Resource Assessment - Delaware Department of Agriculture

Create successful ePaper yourself
Turn your PDF publications into a flip-book with our unique Google optimized e-Paper software.
Thousands <strong>of</strong> Acres<br />
Criterion 2: Maintenance <strong>of</strong> Productive Capacity<br />
<strong>of</strong> Forest Ecosystems<br />
Importance: Healthy forests provide a wide variety <strong>of</strong><br />
services and benefits including enhanced water<br />
quality, oxygen, wildlife habitat, recreational<br />
opportunities, and wood. Forests must be managed<br />
sustainably, and all <strong>of</strong> these benefits must be<br />
considered, if we are to continue to enjoy productive<br />
forest ecosystems. Tracking not only the amount <strong>of</strong><br />
forestland available for producing goods and services<br />
but also the productivity <strong>of</strong> that land and the<br />
resources harvested is important to ensure their<br />
sustainable management.<br />
Indicator 5: Area <strong>of</strong> timberland.<br />
Introduction: Timberland is defined as any forestland<br />
capable <strong>of</strong> producing trees that may be pr<strong>of</strong>itably and<br />
legally harvested. The amount <strong>of</strong> timberland in the<br />
State defines the total forest land base available to<br />
produce goods and services for the benefit <strong>of</strong> society.<br />
Of the state’s 376,000 forested acres in 2002, over 98<br />
percent were classified as timberland. The remaining two<br />
percent <strong>of</strong> the state’s forestland is located in areas where<br />
regulations prohibit timber harvest or, in very few cases,<br />
the soil is not capable <strong>of</strong> producing a viable timber crop<br />
(such as pockets <strong>of</strong> upland within tidal marshes).<br />
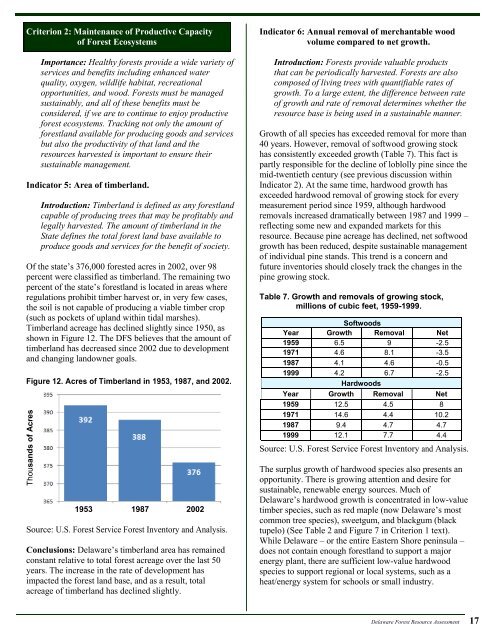
Timberland acreage has declined slightly since 1950, as<br />
shown in Figure 12. The <strong>DFS</strong> believes that the amount <strong>of</strong><br />
timberland has decreased since 2002 due to development<br />
and changing landowner goals.<br />
Figure 12. Acres <strong>of</strong> Timberland in 1953, 1987, and 2002.<br />
Indicator 6: Annual removal <strong>of</strong> merchantable wood<br />
volume compared to net growth.<br />
Introduction: Forests provide valuable products<br />
that can be periodically harvested. Forests are also<br />
composed <strong>of</strong> living trees with quantifiable rates <strong>of</strong><br />
growth. To a large extent, the difference between rate<br />
<strong>of</strong> growth and rate <strong>of</strong> removal determines whether the<br />
resource base is being used in a sustainable manner.<br />
Growth <strong>of</strong> all species has exceeded removal for more than<br />
40 years. However, removal <strong>of</strong> s<strong>of</strong>twood growing stock<br />
has consistently exceeded growth (Table 7). This fact is<br />
partly responsible for the decline <strong>of</strong> loblolly pine since the<br />
mid-twentieth century (see previous discussion within<br />
Indicator 2). At the same time, hardwood growth has<br />
exceeded hardwood removal <strong>of</strong> growing stock for every<br />
measurement period since 1959, although hardwood<br />
removals increased dramatically between 1987 and 1999 –<br />
reflecting some new and expanded markets for this<br />
resource. Because pine acreage has declined, net s<strong>of</strong>twood<br />
growth has been reduced, despite sustainable management<br />
<strong>of</strong> individual pine stands. This trend is a concern and<br />
future inventories should closely track the changes in the<br />
pine growing stock.<br />
Table 7. Growth and removals <strong>of</strong> growing stock,<br />
millions <strong>of</strong> cubic feet, 1959-1999.<br />
S<strong>of</strong>twoods<br />
Year Growth Removal Net<br />
1959 6.5 9 -2.5<br />
1971 4.6 8.1 -3.5<br />
1987 4.1 4.6 -0.5<br />
1999 4.2 6.7 -2.5<br />
Hardwoods<br />
Year Growth Removal Net<br />
1959 12.5 4.5 8<br />
1971 14.6 4.4 10.2<br />
1987<br />
9.4 4.7 4.7<br />
1999 12.1 7.7 4.4<br />
Source: U.S. Forest Service Forest Inventory and Analysis.<br />
1953 1987 2002<br />
Source: U.S. Forest Service Forest Inventory and Analysis.<br />
Conclusions: <strong>Delaware</strong>’s timberland area has remained<br />
constant relative to total forest acreage over the last 50<br />
years. The increase in the rate <strong>of</strong> development has<br />
impacted the forest land base, and as a result, total<br />
acreage <strong>of</strong> timberland has declined slightly.<br />
The surplus growth <strong>of</strong> hardwood species also presents an<br />
opportunity. There is growing attention and desire for<br />
sustainable, renewable energy sources. Much <strong>of</strong><br />
<strong>Delaware</strong>’s hardwood growth is concentrated in low-value<br />
timber species, such as red maple (now <strong>Delaware</strong>’s most<br />
common tree species), sweetgum, and blackgum (black<br />
tupelo) (See Table 2 and Figure 7 in Criterion 1 text).<br />
While <strong>Delaware</strong> – or the entire Eastern Shore peninsula –<br />
does not contain enough forestland to support a major<br />
energy plant, there are sufficient low-value hardwood<br />
species to support regional or local systems, such as a<br />
heat/energy system for schools or small industry.<br />
<strong>Delaware</strong> Forest <strong>Resource</strong> <strong>Assessment</strong> 17