Annual Report 2006 - Fairfax County Economic Development Authority
Annual Report 2006 - Fairfax County Economic Development Authority
Annual Report 2006 - Fairfax County Economic Development Authority

Create successful ePaper yourself
Turn your PDF publications into a flip-book with our unique Google optimized e-Paper software.
trends in real estate<br />
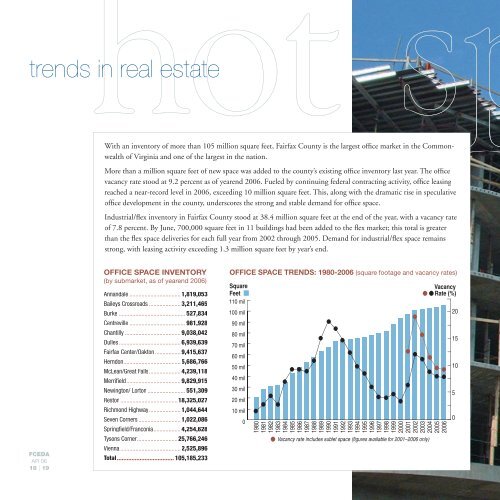
With an inventory of more than 105 million square feet, <strong>Fairfax</strong> <strong>County</strong> is the largest office market in the Commonwealth<br />
of Virginia and one of the largest in the nation.<br />
More than a million square feet of new space was added to the county’s existing office inventory last year. The office<br />
vacancy rate stood at 9.2 percent as of yearend <strong>2006</strong>. Fueled by continuing federal contracting activity, office leasing<br />
reached a near-record level in <strong>2006</strong>, exceeding 10 million square feet. This, along with the dramatic rise in speculative<br />
office development in the county, underscores the strong and stable demand for office space.<br />
Industrial/flex inventory in <strong>Fairfax</strong> <strong>County</strong> stood at 38.4 million square feet at the end of the year, with a vacancy rate<br />
of 7.8 percent. By June, 700,000 square feet in 11 buildings had been added to the flex market; this total is greater<br />
than the flex space deliveries for each full year from 2002 through 2005. Demand for industrial/flex space remains<br />
strong, with leasing activity exceeding 1.3 million square feet by year’s end.<br />
FCEDA<br />
AR 06<br />
18 | 19<br />
OFFICE SPACE INVENTORY<br />
(by submarket, as of yearend <strong>2006</strong>)<br />
Annandale .................................. 1,819,053<br />
Baileys Crossroads ..................... 3,211,465<br />
Burke ............................................ 527,834<br />
Centreville ..................................... 981,928<br />
Chantilly ..................................... 9,038,042<br />
Dulles ......................................... 6,939,639<br />
<strong>Fairfax</strong> Center/Oakton ................. 9,415,637<br />
Herndon ...................................... 5,686,766<br />
McLean/Great Falls ..................... 4,239,118<br />
Merrifi eld .................................... 9,829,915<br />
Newington/ Lorton ......................... 551,309<br />
Reston ......................................18,325,027<br />
Richmond Highway ..................... 1,044,644<br />
Seven Corners ............................ 1,022,086<br />
Springfi eld/Franconia .................. 4,254,628<br />
Tysons Corner ...........................25,766,246<br />
Vienna ........................................ 2,525,896<br />
Total ................................... 105,185,233<br />
OFFICE SPACE TRENDS: 1980-<strong>2006</strong> (square footage and vacancy rates)<br />
Square<br />
Feet<br />
110 mil<br />
100 mil<br />
90 mil<br />
80 mil<br />
70 mil<br />
60 mil<br />
50 mil<br />
40 mil<br />
30 mil<br />
20 mil<br />
10 mil<br />
0<br />
Vacancy<br />
Rate (%)<br />
1980<br />
1981<br />
1982<br />
1983<br />
1984<br />
1985<br />
1986<br />
1987<br />
1988<br />
1989<br />
1990<br />
1991<br />
1992<br />
1993<br />
1994<br />
1995<br />
1996<br />
1997<br />
1998<br />
1999<br />
2000<br />
2001<br />
2002<br />
2003<br />
2004<br />
2005<br />
<strong>2006</strong><br />
Vacancy rate includes sublet space (figures available for 2001–<strong>2006</strong> only)<br />
20<br />
15<br />
10<br />
5<br />
0