Outlook for the World Coffee Market - International Coffee Organization
Outlook for the World Coffee Market - International Coffee Organization
Outlook for the World Coffee Market - International Coffee Organization

Create successful ePaper yourself
Turn your PDF publications into a flip-book with our unique Google optimized e-Paper software.
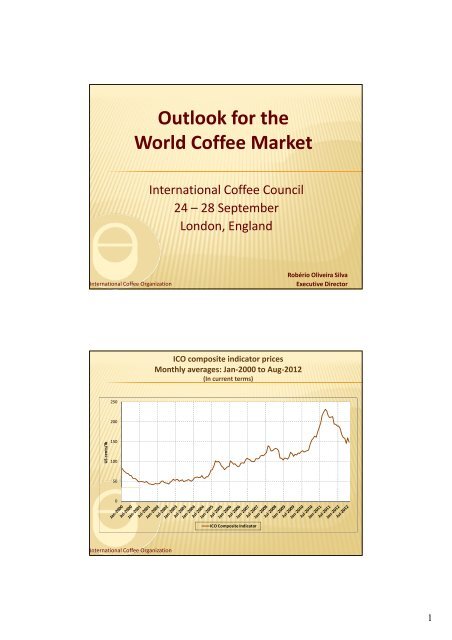
<strong>Outlook</strong> <strong>for</strong> <strong>the</strong><br />
<strong>World</strong> <strong>Coffee</strong> <strong>Market</strong><br />
<strong>International</strong> <strong>Coffee</strong> Council<br />
24 –28 September<br />
London, England<br />
<strong>International</strong> <strong>Coffee</strong> <strong>Organization</strong><br />
Robério Oliveira Silva<br />
Executive Director<br />
ICO composite indicator prices<br />
Monthly averages: Jan‐2000 to Aug‐2012<br />
(In current terms)<br />
250<br />
200<br />
US cents/lb<br />
150<br />
100<br />
50<br />
0<br />
ICO Composite Indicator<br />
<strong>International</strong> <strong>Coffee</strong> <strong>Organization</strong><br />
1
ICO composite indicator prices<br />
Monthly averages: Jan‐2000 to Aug‐2012<br />
(In current and constant terms)<br />
250<br />
200<br />
US cents/lb<br />
150<br />
100<br />
50<br />
0<br />
ICO Composite<br />
ICO Composite [Deflated]<br />
<strong>International</strong> <strong>Coffee</strong> <strong>Organization</strong><br />
ICO group indicator prices<br />
Monthly averages: Jan‐2000 to Aug‐2012<br />
(In current terms)<br />
350<br />
300<br />
250<br />
US cents/lb<br />
200<br />
150<br />
100<br />
50<br />
0<br />
Colombian Milds O<strong>the</strong>r Milds Brazilian Naturals Robustas<br />
<strong>International</strong> <strong>Coffee</strong> <strong>Organization</strong><br />
2
Group price dynamics<br />
(Jan‐2009 = 100)<br />
300<br />
250<br />
US cents/lb<br />
200<br />
150<br />
100<br />
50<br />
Colombian Milds O<strong>the</strong>r Milds Brazilian Naturals Robustas<br />
<strong>International</strong> <strong>Coffee</strong> <strong>Organization</strong><br />
Arbitrage: New York* ‐ London*<br />
Monthly averages: Jan‐2000 to Aug‐2012<br />
(In current terms)<br />
180<br />
160<br />
140<br />
US cents/lb<br />
120<br />
100<br />
80<br />
60<br />
40<br />
20<br />
0<br />
*Average price <strong>for</strong> <strong>the</strong> 2 nd and 3 rd positions<br />
<strong>International</strong> <strong>Coffee</strong> <strong>Organization</strong><br />
3
<strong>World</strong> production<br />
Crop years 2000/01 to 2011/12*<br />
160<br />
140<br />
120<br />
113.0<br />
107.7<br />
123.2<br />
106.3<br />
116.3<br />
111.3<br />
128.4<br />
116.8<br />
128.4<br />
122.7<br />
134.2<br />
132.7<br />
Million bags<br />
100<br />
80<br />
60<br />
40<br />
20<br />
2000/01 2001/02 2002/03 2003/04 2004/05 2005/06 2006/07 2007/08 2008/09 2009/10 2010/11 2011/12*<br />
*Estimated<br />
<strong>International</strong> <strong>Coffee</strong> <strong>Organization</strong><br />
Production: 10 leading producers<br />
(In thousand bags)<br />
2010/11 2011/12* % change<br />
Brazil 48 095 43 484 -9.6%<br />
Vietnam 19 467 21 000 7.9%<br />
Indonesia 9 129 8 620 -5.6%<br />
Colombia 8 523 7 800 -8.5%<br />
Ethiopia 7 500 6 500 -13.3%<br />
Peru 4 069 5 492 35.0%<br />
India 5 033 5 233 4.0%<br />
Honduras 4 326 4 500 4.0%<br />
Mexico 4 850 4 300 -11.3%<br />
Guatemala 3 950 3 750 -5.1%<br />
*Estimated<br />
<strong>International</strong> <strong>Coffee</strong> <strong>Organization</strong><br />
4
Total exports to all destinations<br />
October to July 2000/01 ‐ 2011/12<br />
100<br />
90<br />
80<br />
70<br />
76.0<br />
71.7<br />
74.9 75.2 76.6<br />
71.8<br />
82.8<br />
83.0<br />
80.3<br />
78.1<br />
89.1 90.4<br />
Million bags<br />
60<br />
50<br />
40<br />
30<br />
20<br />
10<br />
0<br />
2000/01 2001/02 2002/03 2003/04 2004/05 2005/06 2006/07 2007/08 2008/09 2009/10 2010/11 2011/12<br />
<strong>International</strong> <strong>Coffee</strong> <strong>Organization</strong><br />
<strong>World</strong> exports of Robustas<br />
(% share)<br />
40%<br />
35%<br />
30%<br />
% share<br />
25%<br />
20%<br />
15%<br />
10%<br />
5%<br />
0%<br />
2000/01 2001/02 2002/03 2003/04 2004/05 2005/06 2006/07 2007/08 2008/09 2009/10 2010/11 2011/12<br />
Robusta<br />
<strong>International</strong> <strong>Coffee</strong> <strong>Organization</strong><br />
5
Exports by group and type of coffee<br />
October to July 2010/11 and 2011/12<br />
(In thousand bags)<br />
2010/11 2011/12 % change<br />
TOTAL 89 052 90 357 1.5%<br />
Colombian Milds 8 180 7 081 ‐13.4%<br />
O<strong>the</strong>r Milds 21 633 22 664 4.8%<br />
Brazilian Naturals 27 592 25 139 ‐8.9%<br />
Robustas 31 647 35 473 12.1%<br />
Arabicas 57 405 54 884 ‐4.4%<br />
Robustas 31 647 35 473 12.1%<br />
<strong>International</strong> <strong>Coffee</strong> <strong>Organization</strong><br />
Stocks in exporting and importing countries<br />
1990 to 2011<br />
60<br />
50<br />
Million bags<br />
40<br />
30<br />
20<br />
10<br />
1990 1991 1992 1993 1994 1995 1996 1997 1998 1999 2000 2001 2002 2003 2004 2005 2006 2007 2008 2009 2010 2011<br />
Exporting countries<br />
Importing countries<br />
<strong>International</strong> <strong>Coffee</strong> <strong>Organization</strong><br />
6
<strong>World</strong> coffee consumption<br />
2001 – 2011<br />
(In thousand bags)<br />
2001 2011 % change<br />
Absolute<br />
change<br />
Average annual<br />
growth rate<br />
WORLD TOTAL 109 581 137 896 25.8% 28 315 2.3%<br />
Exporting countries 27 799 42 412 52.6% 14 613 4.3%<br />
Traditional markets 64 300 70 841 10.2% 6 540 1.0%<br />
Emerging markets 17 482 24 644 41.0% 7 162 3.5%<br />
<strong>International</strong> <strong>Coffee</strong> <strong>Organization</strong><br />
<strong>World</strong> consumption in 2011<br />
25<br />
20<br />
22.0<br />
19.6<br />
Million bags<br />
15<br />
10<br />
9.5<br />
5<br />
7.0<br />
6.0 5.7<br />
3.7 3.6 3.4 3.3 3.1 2.9<br />
24 2.4 22 2.2 2.0 1.8 1.8 1.8 1.7 1.6<br />
0<br />
<strong>International</strong> <strong>Coffee</strong> <strong>Organization</strong><br />
7
<strong>World</strong> consumption: Growth rates in traditional markets<br />
(In thousand bags)<br />
2001 2011 Average annual<br />
growth rate<br />
USA 19 554 22 043 1.4%<br />
Germany 9 059 9 460 0.4%<br />
Japan 6 936 7 015 0.1%<br />
France 5 253 5 960 1.3%<br />
Italy 5 243 5 689 0.8%<br />
Canada 2 535 3 574 3.5%<br />
Spain 2 795 3 149 1.1%<br />
United Kingdom 2 215 2 926 2.6%<br />
Sweden 1 251 1 125 ‐1.1%<br />
Austria 1 013 1 117 1.0%<br />
<strong>International</strong> <strong>Coffee</strong> <strong>Organization</strong><br />
<strong>World</strong> consumption: Growth rates in exporting countries<br />
(In thousand bags)<br />
2001 2011 Average annual<br />
growth rate<br />
Brazil 13 493 19 573 3.8%<br />
Ethiopia 2 041 3 383 5.2%<br />
Indonesia 1 919 3 333 5.7%<br />
Mexico 1 354 2 354 5.7%<br />
Philippines 821 2 150 10.1%<br />
India 1 017 1 763 5.7%<br />
Venezuela 1 197 1 650 3.3%<br />
Vietnam 416 1 583 14.3%<br />
<strong>International</strong> <strong>Coffee</strong> <strong>Organization</strong><br />
8
<strong>World</strong> consumption: Growth rates in emerging markets<br />
(In thousand bags)<br />
2001 2011 Average annual<br />
growth rate<br />
Russia 2 983 3 695 2.2%<br />
Poland 2 222 2 042 ‐0.8%<br />
Korea, Rep. of 1 258 1 801 3.6%<br />
Algeria 1 454 1 789 2.1%<br />
Australia 765 1 407 6.3%<br />
Ukraine 228 1 324 19.2%<br />
O<strong>the</strong>rs 8 570 12 586 3.9%<br />
<strong>International</strong> <strong>Coffee</strong> <strong>Organization</strong><br />
Retail prices: % change in Roast & Ground coffee<br />
(In national currencies)<br />
2010 2011 2012*<br />
Austria 0.9% 18.7% 8.4%<br />
Belgium 3.3% 19.3% 4.9%<br />
Denmark 8.0% 21.6% 5.9%<br />
Finland 10.1% 38.6% ‐0.3%<br />
France 0.4% 8.9% 3.2%<br />
Germany 5.2% 2.3% 3.6%<br />
Italy 0.4% 10.7% 4.7%<br />
Japan ‐1.3% 4.5% 3.4%<br />
Norway 7.7% 19.7% 1.3%<br />
Poland 1.3% 12.1% 12.4%<br />
Portugal ‐1.7% 3.5% 13.5%<br />
Spain ‐1.2% 7.6% 8.5%<br />
Sweden 6.1% 26.4% 1.2%<br />
United Kingdom 2.3% 16.6% 5.0%<br />
USA 6.5% 32.9% 6.9%<br />
* Partial average<br />
<strong>International</strong> <strong>Coffee</strong> <strong>Organization</strong><br />
9
Effect of retail prices on consumption<br />
(In thousand bags)<br />
2010 2011 % change<br />
Austria 903 1 117 23.8%<br />
Belgium 871 934 7.3%<br />
Denmark 847 790 ‐6.7%<br />
Finland 1 080 1 093 1.2%<br />
France 5 713 5 960 4.3%<br />
Germany 9 292 9 460 1.8%<br />
Italy 5 781 5 689 ‐1.6%<br />
Japan 7 192 7 015 ‐2.5%<br />
Norway 746 785 5.3%<br />
Poland 2 156 2 042 ‐5.3%<br />
Portugal 750 834 11.1%<br />
Spain 3 232 3 149 ‐2.6%<br />
Sweden 1 221 1 125 ‐7.9%<br />
United Kingdom 3 134 2 926 ‐6.7%<br />
USA 21 783 22 043 1.2%<br />
<strong>International</strong> <strong>Coffee</strong> <strong>Organization</strong><br />
<strong>World</strong> consumption outlook<br />
(1970 to 2020)<br />
200<br />
180<br />
160<br />
172.2<br />
164.8<br />
157.7<br />
Million bags<br />
140<br />
120<br />
100<br />
80<br />
1970‐1979<br />
1.1%<br />
1980‐1989<br />
1.3%<br />
1990‐1999<br />
1.6%<br />
2000‐2011<br />
2.5%<br />
60<br />
40<br />
20<br />
0<br />
Actual Low ‐ 1.5% Medium ‐ 2.0% High ‐ 2.5%<br />
<strong>International</strong> <strong>Coffee</strong> <strong>Organization</strong><br />
10
Thank you<br />
www.ico.org<br />
Robério Oliveira Silva<br />
Executive Director<br />
<strong>International</strong> <strong>Coffee</strong> <strong>Organization</strong><br />
11