Participatory Impact Assessment - Capacity4Dev
Participatory Impact Assessment - Capacity4Dev
Participatory Impact Assessment - Capacity4Dev

You also want an ePaper? Increase the reach of your titles
YUMPU automatically turns print PDFs into web optimized ePapers that Google loves.
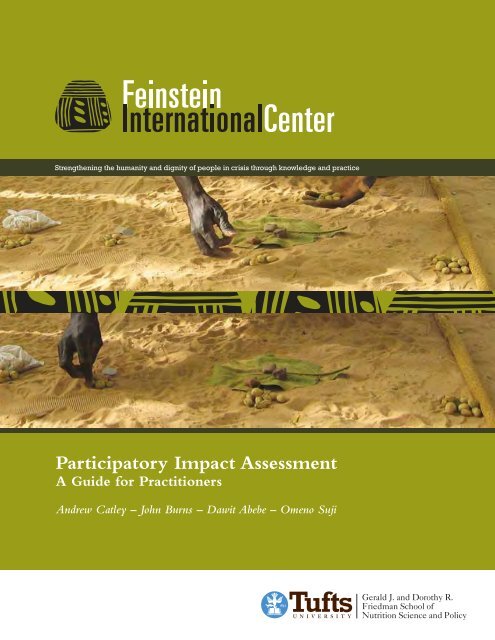
Strengthening the humanity and dignity of people in crisis through knowledge and practice<br />
<strong>Participatory</strong> <strong>Impact</strong> <strong>Assessment</strong><br />
A Guide for Practitioners<br />
Andrew Catley – John Burns – Dawit Abebe – Omeno Suji
CONTENTS<br />
ACKNOWLEDGEMENTS ..........................................................................................................................................................................4<br />
ABBREVIATIONS ......................................................................................................................................................................................5<br />
INTRODUCTION ........................................................................................................................................................................................6<br />
PURPOSEOFTHISGUIDE.....................................................................................................................................................6<br />
WHYBOTHERMEASURINGIMPACT?....................................................................................................................................7<br />
WHATISPARTICIPATORYIMPACTASSESSMENT?....................................................................................................................9<br />
AN EIGHT STAGE APPROACH TO DESIGNING A PARTICIPATORY IMPACT ASSESSMENT ........................................................11<br />
BACKGROUND ........................................................................................................................................................................................11<br />
STAGE ONE: IDENTIFYING THE KEY QUESTIONS ...................................................................................................................12<br />
STAGE TWO: DEFINING THE BOUNDARIES OF THE PROJECT IN SPACE AND TIME ......................................................... 13<br />
DEFININGTHEPROJECTBOUNDARY....................................................................................................................................13<br />
THEMETHOD................................................................................................................................................................14<br />
ExamplesofMaps.................................................................................................................................................16<br />
DEFININGTHEPROJECTPERIOD–TIMELINES........................................................................................................................18<br />
STAGE THREE: IDENTIFYING INDICATORS OF PROJECT IMPACT ............................................................................................20<br />
COMMUNITYDEFINEDINDICATORSOFPROJECTIMPACT.........................................................................................................21<br />
QUANTITATIVEANDQUALITATIVEINDICATORS.....................................................................................................................23<br />
CHANGESINCOPINGSTRATEGIES.......................................................................................................................................24<br />
STAGE FOUR: METHODS ...............................................................................................................................................................26<br />
RANKINGANDSCORINGMETHODS.....................................................................................................................................26<br />
BEFOREANDAFTERSCORING............................................................................................................................................30<br />
SCORINGAGAINSTANOMINALBASELINE.............................................................................................................................34<br />
SIMPLERANKING............................................................................................................................................................35<br />
PAIRWISERANKINGANDMATRIXSCORING........................................................................................................................36<br />
Exampleofarankingandmatrixscoringoffoodsourcepreferences..................................................................36<br />
IMPACTCALENDARSANDRADARDIAGRAMS........................................................................................................................39<br />
MeasuringParticipation.......................................................................................................................................40<br />
TimeSavingsBenefits...........................................................................................................................................41<br />
ASSESSINGUTILIZATIONANDEXPENDITURE.........................................................................................................................42<br />
STAGE FIVE: SAMPLING ..............................................................................................................................................................44<br />
GETTINGNUMERICALDATAFROMPARTICIPATORYTOOLS.......................................................................................................47<br />
STAGE SIX: ASSESSING PROJECT ATTRIBUTION ......................................................................................................................48<br />
ASSESSINGPROJECTANDNONPROJECTFACTORS.................................................................................................................50<br />
RANKINGASANATTRIBUTIONMETHOD..............................................................................................................................51<br />
MATRIXSCORINGASANATTRIBUTIONMETHOD....................................................................................................................53<br />
USINGSIMPLECONTROLSTOASSESSATTRIBUTION................................................................................................................55<br />
STAGE SEVEN: TRIANGULATION ...................................................................................................................................................57<br />
STAGE EIGHT:<br />
FEEDBACK AND VALIDATION ..............................................................................................................................58<br />
WHEN TO DO AN IMPACT ASSESSMENT ............................................................................................................................................59<br />
REFERENCES .........................................................................................................................................................................................60<br />
ANNEX 1:<br />
FURTHER READING ....................................................................................................................................................61<br />
2
List of Figures<br />
FIGURE2.1COMMUNITYMAPNEPAL.................................................................................................................................... 16<br />
FIGURE2.2GRAZINGMAPKENYA..........................................................................................................................................17<br />
FIGURE2.3TIMELINEETHIOPIA.............................................................................................................................................18<br />
FIGURE2.4TIMELINEZIMBABWE...........................................................................................................................................19<br />
FIGURE:3.1LIVESTOCKBENEFITSINDICATORS..........................................................................................................................22<br />
FIGURE4.1:WORKSHOPEVALUATIONSCORINGSHEET...............................................................................................................27<br />
FIGURE4.2:EXAMPLE–SCORINGOFFOODSOURCES.................................................................................................................28<br />
FIGURE4.2.1EXAMPLE–“BEFORE”AND“AFTER”SCORINGOFFOODSOURCES.............................................................................30<br />
FIGURE4.2.2EXAMPLEOFA“BEFORE”AND“AFTER”SCORINGOFFOODBASKETCONTRIBUTIONSFROMDIFFERENTCROPS(N=145).......31<br />
FIGURE4.2.3:EXAMPLE“BEFORE”AND“AFTER”SCORINGOFLIVESTOCKDISEASES.........................................................................32<br />
FIGURE4.2.4IMPACTSCORINGOFMILKPRODUCTION...............................................................................................................33<br />
FIGURE4.2.5:SCORINGCHANGESINCROPYIELDSAGAINSTANOMINALBASELINE............................................................................34<br />
FIGURE4.3CHANGESINTHENUMBEROFMONTHSOFFOODSECURITY..........................................................................................39<br />
FIGURE4.4PARTICIPATIONRADARDIAGRAMS..........................................................................................................................40<br />
FIGURE4.5MEASURINGTIMESAVINGBENEFITS........................................................................................................................41<br />
FIGURE4.6SCORINGUTILIZATIONOFMILK...............................................................................................................................42<br />
FIGURE4.7:SCORINGINCOMEUTILIZATION.............................................................................................................................43<br />
FIGURE5.1:EVIDENCEHIERARCHY.........................................................................................................................................45<br />
FIGURE5.2:RELIABILITYANDREPETITIONEXAMPLE...................................................................................................................47<br />
FIGURE6.1:EXAMPLEOFATTRIBUTIONFACTORS......................................................................................................................48<br />
FIGURE6.2HYPOTHETICALEXAMPLEOFRESULTSFROMANIMPACTSCORINGEXERCISE.....................................................................50<br />
FIGURE6.3USINGMATRIXSCORINGTOCOMPARESERVICEPROVISION..........................................................................................53<br />
FIGURE6.4MATRIXSCORINGCOMPARINGDIFFERENTDROUGHTINTERVENTIONS............................................................................54<br />
FIGURE6.5CAMELDISEASEIMPACTSCORING...........................................................................................................................55<br />
FIGURE6.6COMPARISONSBETWEENPROJECTANDNONPROJECTPARTICIPANTS.............................................................................56<br />
FIGURE7.1TRIANGULATINGDIFFERENTSOURCESOFINFORMATION.............................................................................................58<br />
<br />
List of Tables<br />
TABLE3.1EXAMPLESOFCOMMONCOPINGSTRATEGIES............................................................................................................24<br />
TABLE4.1MEASURINGIMPACTAGAINSTANOMINALBASELINE....................................................................................................34<br />
TABLE4.2:OVERALLPROJECTBENEFITSBYFOCUSGROUPPARTICIPANTS........................................................................................35<br />
TABLE4.3RANKINGOFLIVESTOCKASSETS...............................................................................................................................35<br />
TABLE4.4PAIRWISERANKINGSHOWINGFOODSOURCEPREFERENCES..........................................................................................36<br />
TABLE4.5REASONSGIVENFORFOODSOURCEPREFERENCES.......................................................................................................37<br />
TABLE4.6MATRIXSCORINGOFDIFFERENTFOODSOURCESAGAINSTINDICATORSOFPREFERENCE.......................................................38<br />
TABLE4.7FOODSECURITYIMPACTCALENDAREXAMPLEUSING25COUNTERS(1REPETITION)...........................................................39<br />
TABLE5.1:SAMPLINGOPTIONSFORIMPACTASSESSMENT..........................................................................................................46<br />
TABLE6.1SOMEPRACTICALANDETHICALCONCERNSWITHUSINGCONTROLGROUPS.......................................................................49<br />
TABLE6.2ATTRIBUTIONBYSIMPLERANKING/SCORING.............................................................................................................50<br />
TABLE6.3RANKINGOFPROJECTANDNONPROJECTFACTORS–ANIMALHEALTHPROJECT.................................................................51<br />
TABLE6.4EXAMPLEOFANATTRIBUTIONTALLYFORM...............................................................................................................52<br />
TABLE6.5REASONSGIVENFORIMPROVEMENTSINHOUSEHOLDFOODSECURITY.............................................................................52<br />
TABLE6.6COMPARISONOFLIVESTOCKMORTALITYRATES(SOURCE:BEKELE,2008).......................................................................55<br />
3
ACKNOWLEDGEMENTS<br />
This guide was made possible with the support of the Bill and Melinda Gates Foundation under the<br />
<strong>Impact</strong> <strong>Assessment</strong> of Innovative Humanitarian Assistance Projects initiative. The authors would<br />
like to thank Regine Webster, Kathy Cahill, Mito Alfieri, and Dr Valerie Bemo from the<br />
Foundation for their extraordinary support and encouragement. We would also like to thank the<br />
organizations participating in the project under the Bill and Melinda Gates funded Sub-Saharan<br />
Famine Relief Effort “Close to the Brink” for their willing participation and valuable<br />
contributions. In particular we would like to single out the Country Offices of Catholic Relief<br />
Services (CRS) in Mali, International Medical Corps (IMC) Office in Nairobi representing<br />
Southern Sudan, the Africare Country Offices in Niger and Zimbabwe, Save the Children (USA)<br />
Country Office in Malawi, Lutheran World Relief Office in Niger, and the Country Office of<br />
CARE International in Zimbabwe. To Ms Amani M’Bale Poveda, Mamadou Djire, Sekou Bore,<br />
Kabwayi Kabongo, Moussa Sangare, Michael Jacob, Robert Njairu, Charles Ayieko, Chris Dyer,<br />
Simon O’Connel, Abdelah Ben Mobrouk, Omar Abdou, Hawada Hargala, Halima tu Kunu<br />
Moussa, Ousmane Chai and Mahamout Maliki, Mme Ramatou Adamou, Mahamadou<br />
Ouhoumoudou, Jacque Ahmed, Heather Dolphin, Megan Armistead, Sekai Chikowero, Paul<br />
Chimedza, Stanley Masimbe, James Machichiko, Timm Musori , Dr Justice Nyamangara, Frank<br />
Magombezi, Paradza Kunguvas, Enock Muzenda, Godfrey Mitti, Kenneth Marimira, Swedi Phiri,<br />
Innocent Takaedza, Priscilla Mupfeki, Admire Mataruse, Lazarus Sithole, Stephen Manyerenye,<br />
Tess Bayombong, Stephen Gwynne-Vaughan, Mati Sagonda, Colet Gumbo, Zechias<br />
Mutiwasekwa, Calvin Mapingure, Shereni Manfred, Cuthbert Clayton, Lazarus and Andrew<br />
Mahlekhete, Mohamed Abdou Assaleh, Moustapha Niang’ Mousa Channo, Marie Aughenbaugh,<br />
Ibrahim Barmou, Alkassoum Kadade, Maman Maman Illa, Ousmane Issa, Sani Salissou<br />
Fassouma, Geraldine Coffi, Mariama Gadji Mamudou, Guimba Guero, Adamou Hamidou,<br />
Hamidu Idrissa, Alhassan Musa, Hamza Ouma, Amadu Ide, Adam Mohaman, Megan Lindstrom,<br />
Devon Cone, Alexa Reynolds, Julia Kent, Joseph Sedgo, Mohammed Idris and the SCF Malawi<br />
team, Carlisle Levine, Izola Shaw, Katelyn Brewer, Jessica Silverthorne, Amy Hilleboe, and Ryan<br />
Larrance many thanks for your participation, contributions and support. From the Feinstein Center<br />
many thanks go to Dr Peter Walker, Dr Helen Young, Katherine Sadler, Sally Abbot, Dr Daniel<br />
Maxwell, Yacob Aklilu, Dr Berhanu Admassu, Hirut Demissie, Haillu Legesse, Rosa Pendenza,<br />
Elizabeth O’Leary and Anita Robbins for providing technical and administrative support. And to<br />
Cathy Watson, many thanks for proof reading and edits.<br />
4
ABBREVIATIONS<br />
ALNAP<br />
CAHW<br />
CBO<br />
CI<br />
GIRA<br />
HAP-I<br />
HH<br />
IIED<br />
M&E<br />
NGO<br />
OLP<br />
PIA<br />
PRA<br />
Active Learning Network for Accountability and Performance<br />
Community Animal Health Worker<br />
Community Based Organization<br />
Confidence Interval<br />
Gokwe Integrated Recovery Action (project)<br />
Humanitarian Accountability Partnership<br />
Household<br />
Institute for Environment and Development<br />
Monitoring and Evaluation<br />
Non Governmental Organization<br />
Organizational Learning Partnership<br />
<strong>Participatory</strong> <strong>Impact</strong> <strong>Assessment</strong><br />
<strong>Participatory</strong> Rural Appraisal<br />
5
INTRODUCTION<br />
Purpose of this guide<br />
The Feinstein International Center has been developing and adapting participatory approaches to<br />
measure the impact of livelihoods based interventions since the early nineties. Drawing upon this<br />
experience, this guide aims to provide practitioners with a broad framework for carrying out<br />
project level <strong>Participatory</strong> <strong>Impact</strong> <strong>Assessment</strong>s (PIA) of livelihoods interventions in the<br />
humanitarian sector. Other than in some health, nutrition, and water interventions in which<br />
indicators of project performance should relate to international standards, for many interventions<br />
there are no ‘gold standards’ for measuring project impact. For example, the Sphere handbook has<br />
no clear standards for food security or livelihoods interventions. This guide aims to bridge this gap<br />
by outlining a tried and tested approach to measuring the impact of livelihoods projects. The guide<br />
does not attempt to provide a set of standards or indicators or blueprint for impact assessment, but<br />
a broad and flexible framework which can be adapted to different contexts and project<br />
interventions.<br />
Consistent with this, the proposed framework does not aim to provide a rigid or detailed step by<br />
step formula, or set of tools to carry out project impact assessments, but describes an eight stage<br />
approach, and presents examples of tools which may be adapted to different contexts. One of the<br />
objectives of the guide is to demonstrate how PIA can be used to overcome some of the inherent<br />
weaknesses in conventional humanitarian monitoring evaluation and impact assessment<br />
approaches, such as; the emphasis on measuring process as opposed to real impact, the emphasis<br />
on external as opposed to community based indicators of impact, and how to overcome the issue of<br />
weak or non-existent baselines. The guide also aims to demonstrate and provide examples of how<br />
participatory methods can be used to overcome the challenge of attributing impact or change to<br />
actual project activities. The guide will also demonstrate how data collected from the systematic<br />
use of participatory tools can be presented numerically, and can give representative results and<br />
provide evidence based data on project impact.<br />
ObjectivesoftheGuide<br />
<br />
1. Provideaframeworkforassessingtheimpactoflivelihoodsinterventions<br />
2. Clarifythedifferencesbetweenmeasuringprocessandrealimpact<br />
3. DemonstratehowPIAcanbeusedtomeasuretheimpactofdifferentprojectsin<br />
differentcontextsusingcommunityidentifiedimpactindicators<br />
4. Demonstratehowparticipatorymethodscanbeusedtomeasureimpactwhereno<br />
baselinedataexists<br />
5. Demonstratehowparticipatorymethodscanbeusedtoattributeimpacttoaproject<br />
6. Demonstratehowqualitativedatafromparticipatorytoolscanbesystematically<br />
collectedandnumericallypresentedtogiverepresentativeresultsofprojectimpact<br />
6
WHY BOTHER MEASURING IMPACT?<br />
Theabilitytodefineandmeasurehumanitarianimpactisessential<br />
toprovidingoperationalagencieswiththetoolstosystematically<br />
evaluatetherelativeefficacyofvarioustypesofinterventions.<br />
Aggregatinglessonslearnedacrossorganizations,operations,and<br />
timeiscriticaltothecreationofanevidencebasewhichcan<br />
continuetoinformthesectoraboutimprovement.<br />
Institutionalizinggoodpracticeinthesystemsandstructuresof<br />
relieforganizationsiscriticaltotheirabilitytomeetthegrowing<br />
demandsonthesectorandtheneedsofpeoplemadevulnerable<br />
bydisastersandhumanitariancrises.Similarly,communicatingthe<br />
effectivenessofimpactisnecessaryforthehumanitariansectorto<br />
respondtoincreasingpressurefromdonorsandthegeneralpublic<br />
todemonstratetheresultsofitsefforts(FritzInstitute,2007). © Kadede 2007<br />
Much of the academic literature suggests that in recent years there has been little incentive for<br />
humanitarian organizations to measure the impact of their work (Roche 1999, Hofmann et al 2004,<br />
Watson, 2008). However, the emergence of initiatives such as the Humanitarian Accountability<br />
Partnership (HAP-I) the Active Learning Network for Accountability and Performance (ALNAP)<br />
the Organizational Learning Partnership (OLP) and the Fritz Institute Humanitarian <strong>Impact</strong> Project<br />
have catalyzed a growing interest and demand for greater effectiveness, learning and<br />
accountability within the humanitarian sector. As a result of this interest, organizations are under<br />
growing pressure to demonstrate and measure the real impact of their projects on the livelihoods of<br />
the recipient communities.<br />
Although many if not all humanitarian agencies claim to be having an impact, these claims are<br />
rarely substantiated with rigorous evidence based data (Hofmann et al 2004, and Darcy 2005), and<br />
the ‘gap between the rhetoric of agencies and what they actually achieve is increasingly met with<br />
skepticism and doubt amongst donors and other stakeholders’ (Roche C, 1999). Evidence to<br />
support claims of project impact is largely supported by information from agencies’ own<br />
monitoring and evaluation (M&E) systems and anecdotes from project monitoring reports. Most<br />
organizations M&E systems focus on measuring the process of project implementation and service<br />
delivery, with the emphasis being on upward financial accountability. Although this monitoring of<br />
project activities is an important management function and the information is certainly useful in<br />
attributing impact to a given intervention, such M&E data rarely tells us much about the real<br />
impact of a project on the lives of project clients or participating communities.<br />
A well designed impact assessment can capture the real impacts of a project, be they positive or<br />
negative, intended or unintended on the lives of the project participants. An impact assessment can<br />
therefore demonstrate whether the money allocated to a project is actually having an effect on the<br />
lives of the project participants. This alone should create a greater demand from donors and greater<br />
incentives for implementing agencies to measure the results of their work. In the experience of the<br />
Feinstein Center, even where the results of an assessment show that impact is not as significant as<br />
expected, or where negative impacts are revealed, honesty in reporting can be appreciated by<br />
donors, as it suggests a willingness by the implementing agency to learn from its programming,<br />
whereas less transparent and defensive reporting tends to evoke skepticism.<br />
7
The experience of the Feinstein Center shows that where project participants are included in the<br />
impact assessment process, this can create an opportunity to develop a learning partnership<br />
involving the donor, the implementing partner, and the participating communities. The impact<br />
assessment process can create space for dialogue, and the results can provide a basis for<br />
discussions on how to improve programming and where best to allocate future resources. Results<br />
from some impact assessments supported by the Feinstein Center demonstrate unintended impacts<br />
that differ from, and are possibly more significant than the expected impact associated with the<br />
stated objectives of the project. If these assessments had not been carried out these impacts would<br />
not have been captured or documented, and the opportunity to use this information in designing<br />
future projects would have been lost.<br />
Aside from the internal organizational learning benefits derived from measuring impact, the results<br />
from impact assessments, when rigorously applied, can be used as a powerful advocacy tool to<br />
influence the formulation of policy and best practice guidelines for humanitarian programming.<br />
Experience from Ethiopia shows that evidence based data derived from impact assessments was<br />
successfully used to develop Government endorsed best practice guidelines for drought response<br />
interventions in the livestock sector (Behnke et al 2008).<br />
A more systematic approach to impact measurement in the humanitarian sector can only help to<br />
improve accountability, not only to donors and external stakeholders, but more importantly to the<br />
recipients of humanitarian aid. It will also answer the fundamental questions that are rarely asked,<br />
what impact are we really having, and do these aid interventions and activities really work? This<br />
can only lead to better programming and a more effective use of humanitarian funds. Overall, a<br />
greater emphasis on measuring and demonstrating impact can only enhance the image and<br />
credibility of donors, and humanitarian organizations within the sector. Indeed, as Chris Roche<br />
(1999, 3) argues; “In the long term the case for aid can only be sustained by more effective<br />
assessment and demonstration of its impact, by laying open the mistakes and uncertainties that are<br />
inherent in development work, and by an honest assessment of the comparative effectiveness of aid<br />
vis-à-vis changes in policy and practice”.<br />
8
What is <strong>Participatory</strong> <strong>Impact</strong> <strong>Assessment</strong>?<br />
<strong>Participatory</strong> <strong>Impact</strong> <strong>Assessment</strong> (PIA) is an extension of <strong>Participatory</strong> Rural Appraisal (PRA) and<br />
involves the adaptation of participatory tools combined with more conventional statistical<br />
approaches specifically to measure the impact of humanitarian assistance and development<br />
projects on people’s lives. The approach consists of a flexible methodology that can be adapted to<br />
local conditions. The approach acknowledges local people, or project clients as experts by<br />
emphasizing the involvement of project participants and community members in assessing project<br />
impact – and by recognizing that ‘local people are capable of identifying and measuring their own<br />
indicators of change’ (Catley, 1999).<br />
All the definitions of impact in either the development or humanitarian assistance field involve the<br />
concept of change, which can be positive or negative.<br />
Consistent with this, a project level PIA tries to answer the following three key questions (Watson,<br />
2008):<br />
1. Whatchangeshavetherebeeninthecommunitysincethestartoftheproject?<br />
2. Whichofthesechangesareattributabletotheproject?<br />
3. Whatdifferencehavethesechangesmadetopeople’slives?<br />
In contrast to many traditional project M&E approaches, PIA aims to measure the real impact of a<br />
project on the lives of the project participants. Most evaluations tend to focus on measuring aspects<br />
of project implementation, such as the delivery of inputs and services, the construction of project<br />
infrastructure, the number of trainings carried out or the number of people trained. PIA tries to go a<br />
step further by investigating if and to what extent these project activities actually benefited the<br />
intended recipients, and if these benefits can be attributed to the project activities.<br />
The use of participatory methods in PIA allows impact to be measured against qualitative<br />
indicators, such as changes in dignity, status, and well being, or changes in the level of community<br />
participation throughout the implementation of a given project. The use of participatory ranking<br />
and scoring methods enables these types of qualitative indicators, often based on opinions or<br />
perceptions to be presented numerically. Comparative scoring and ranking methods can be used in<br />
PIA to assess project attribution, by comparing both the project and non-project factors that<br />
contributed to any assessed change. This is particularly useful where the use of a control group is<br />
unethical or impractical, which is often the case in the context of humanitarian assistance projects.<br />
Comparative scoring methods used in PIA can also be used to develop a retrospective baseline<br />
against which to measure impact. Again the lack of baseline data is a common feature of<br />
humanitarian assistance projects, particularly those being implemented in an emergency setting.<br />
The PIA approach emphasizes the standardization and repetition of participatory methods, helping<br />
to improve the reliability of the information, but ideally leaving enough scope for the open-ended<br />
and flexible inquiry typical of PRA. In this respect PIA tries to find a balance between systematic<br />
methods and the richness of qualitative inquiry.<br />
In summary, a systematic, well designed PIA can assist communities and NGOs to measure impact<br />
using their own indicators and their own methods. It can also overcome the weaknesses inherent in<br />
9
many donor and NGO monitoring and evaluation systems which emphasize the measurement of<br />
process and delivery, over results and impact.<br />
© Burns 2007<br />
© Burns 2007<br />
© Burns 2007<br />
Focus Group Discussions during a PIA in Zimbabwe<br />
10
AN EIGHT STAGE APPROACH TO DESIGNING A PARTICIPATORY IMPACT ASSESSMENT<br />
BACKGROUND<br />
The Feinstein International Center’s approach to assessing impact emphasizes the participation of<br />
project households, and involves an eight step assessment process. The proposed approach to PIA<br />
aims to provide a generic, flexible methodology, adaptable to local conditions which is based on<br />
the notion of combining participatory approaches and some basic epidemiological or ‘good<br />
science’ principles. The PIA methodology draws on various bodies of experience such as:<br />
<br />
<br />
<br />
<br />
The ‘soft systems’ participatory assessment approaches of Action-Aid Somaliland during<br />
the mid nineties<br />
Reviews of PIA by the International Institute for Environment and Development (IIED)<br />
Feinstein International Center’s use of PIA, particularly in complex emergencies and as a<br />
strategy for informing policy reform<br />
Work on the reliability and validity of participatory epidemiology by IIED and the<br />
Feinstein International Center<br />
EightStagesofa<strong>Participatory</strong><strong>Impact</strong><strong>Assessment</strong><br />
Stage1:<br />
Stage2:<br />
Stage3:<br />
Definethequestionstobeanswered<br />
Definethegeographicalandtimelimitsoftheproject<br />
Identifyandprioritizelocallydefinedimpactindicators<br />
Stage4:<br />
Stage5:<br />
Stage6:<br />
Stage7:<br />
Stage8:<br />
Decidewhichmethodstouse,andtestthem<br />
Decidewhichsamplingmethodandsamplesizetouse<br />
Assessprojectattribution<br />
Triangulate<br />
Feedbackandverifytheresultswiththecommunity<br />
11
STAGE ONE:<br />
IDENTIFYING THE KEY QUESTIONS<br />
The most important and often the most difficult part of designing an impact assessment is deciding<br />
which questions should be answered. Defining the questions for an impact assessment is similar to<br />
defining the objectives of a project - unless you know specifically what you are trying to achieve,<br />
you are unlikely to achieve it. Many assessments try to answer too many questions and<br />
consequently produce poor quality results. Although it is tempting to try and capture as much<br />
information about a given project as possible, there is always a risk that in doing so, you will<br />
collect too much information to effectively manage and analyze. It is better to limit the assessment<br />
to a maximum of five key questions and answer these well.<br />
If you have already worked with communities to identify their impact indicators at the beginning<br />
of the project, the assessment will focus on the measurement of these indicators and assessment of<br />
project attribution. If you are using a retrospective approach, discuss the impact assessment with<br />
the project participants, and jointly define the questions with them.<br />
Example: Provision of sheep or goats to female headed households<br />
<br />
Forsuchaproject,theimpactassessmentmayonlyneedtoanswerthreequestions.<br />
<br />
1. Howhastheprojectimpacted,ifatall,onthelivelihoodsofthewomeninvolvedinthe<br />
project?<br />
2. Howhastheprojectimpacted,ifatall,onthenutritionalstatusofthewomen’schildren?<br />
3. Howmight,theprojectbechangedtoimproveimpactinthefuture?<br />
© Suji 2007<br />
12
STAGE TWO:<br />
DEFINING THE BOUNDARIES OF THE PROJECT IN SPACE AND TIME<br />
Defining the spatial or ‘geographical’ boundaries of a project aims to ensure that everyone understands<br />
the limits of the area in which impact is supposed to take place. Defining the project’s time boundaries<br />
aims to ensure that everyone is clear about the time period being assessed.<br />
Defining the project boundary<br />
<strong>Participatory</strong> Mapping is a useful<br />
visualization method to use at the beginning<br />
of an assessment to define the geographical<br />
boundary of the project area. It also acts as a<br />
good ice-breaker as many people can be<br />
involved. Maps produced on the ground<br />
using locally-available materials are easy to<br />
construct and adjust until informants are<br />
content that the information is accurate.<br />
9<br />
Mapping is a useful method for the following reasons:<br />
<br />
<br />
<br />
<br />
Both literate and non-literate people can contribute to the construction of a map (as it is not<br />
necessary to have written text on the map).<br />
When large maps are constructed on the ground, many people can be involved in the<br />
process and contribute ideas. People also correct each other and make sure that the map is<br />
accurate.<br />
Maps can represent complex information that would be difficult to describe using text<br />
alone.<br />
Maps can be used as a focus for discussion.<br />
13
© Suji, 2007<br />
AmapofZipwaProjectSite,Zimbabwe<br />
Drawingacommunitymapinthesand<br />
The Method<br />
1. Mapping is best used with a group of informants, say between 5-15 people. Find a clean piece<br />
of open ground. Explain that you would like the group to produce a picture showing features<br />
such as:<br />
- Geographical boundaries of the community. In pastoral areas, these should include the<br />
furthest places where people go to graze their animals.<br />
- Main villages or human settlements.<br />
- Roads and main foot paths.<br />
- Rivers, lakes, dams, wells and other water sources.<br />
- Crop production farmed areas, fishing areas, forests and other natural resources.<br />
- Market centers.<br />
- Services, clinics, schools, shops, seed and fertilizer distribution outlets, veterinary clinics,<br />
government offices.<br />
- Ethnic groups.<br />
- Seasonal and spatial human and livestock movements.<br />
- Areas of high risk, flooding, insecurity, tsetse flies, ticks and other parasites.<br />
Explain that the map should be constructed on the ground using materials that are to hand. For<br />
example, lines of sticks can be used to show boundaries, and stones may be used to represent<br />
human settlements. In some communities people may be more comfortable using flip charts<br />
and colored markers to construct the map. If in doubt ask the participants which option they<br />
prefer to use.<br />
2. When you are confident that the group understands the task they are being asked to perform, it<br />
is often useful to explain that you will leave them alone to construct the map and return in 30<br />
minutes. At that point, leave the group alone and do not interfere with the construction of the<br />
map.<br />
14
3. After 30 minutes, check on progress. Give the group more time if they wish.<br />
4. When the group is happy that the map is finished, ask them to explain the key features of the<br />
map. The process of “interviewing the map” enables assessors to learn more about the map<br />
and pursue interesting spatial features. As mentioned a map can be a useful focus tool for<br />
discussions and follow-up questioning. It is important that one member of the team takes notes<br />
during this discussion. During this part of the exercise ask the participants to include any<br />
project infrastructure on the map in relationship to the other features. For example if the project<br />
constructed wells or a cereal bank, or established a community vegetable garden, ask the<br />
participants to illustrate these on the map. In many cases these may already have been<br />
included, which already tells us something about the importance of the project from the<br />
perspective of the participants. Similar or other types of physical assets may have been<br />
established by the government or another NGO in the project area and it is important to also<br />
include these on the map.<br />
5. It is often useful to add some kind of scale to the map. This can be done by taking a main<br />
human settlement and asking how many hours it takes to walk to one of the boundaries of the<br />
map. In less remote communities people may already know how many kilometers it is from<br />
one settlement to another and can define this on the map. A north-south orientation can also be<br />
added to the map, or arrows pointing to a major urban center or natural feature lying outside of<br />
the boundary of the map.<br />
6. Make two large copies of the map on flip chart paper. Give one copy to the group of<br />
participants.<br />
When maps are used to show seasonal variations, such as flooding, livestock movements, or crop<br />
production, these can be cross-checked using seasonal calendars.<br />
The increasing use of computer scanners and digital cameras means that copies of maps can easily<br />
be added to reports.<br />
15
Examples of Maps<br />
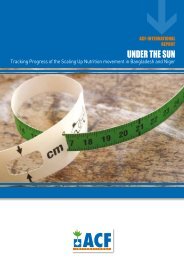
FIGURE2.1COMMUNITYMAPNEPAL<br />
MapofPyutarVillageCommitteearea,Ward9byKrishnaBahadurandImanSinghGhale<br />
<br />
ThismapwasproducedbytwofarmersinasedentarycommunityinNepal.The mapshowsthelocation<br />
ofthemainlivestocktypes,areasofcultivationandotherfeatures<br />
<br />
(source:Young,Dijkeme,Stoufer,ShresthaandThapa,1994,PRANotes20)<br />
16
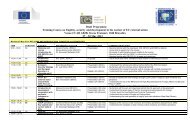
FIGURE2.2GRAZINGMAPKENYA<br />
MapofKipaovillage,GarsenDivision,TanaRiverDistrict.<br />
<br />
ThismapwasconstructedbyOrmaherders.Itshowsthedryseasongrazingareasforcattlearound<br />
Kipaoandproximitytotsetseinfestedareas.Duringthewetseason,theareabecamemarshyand<br />
cattleweremovedtoremotegrazingareas.<br />
<br />
(Source:Catley, A. and Irungu, P. (2000).<br />
17
Defining the project period – Timelines<br />
Defining the project boundaries in time, sometimes called the ‘temporal boundary’ aims to ensure<br />
that everyone is clear about the time period that is being assessed.<br />
A timeline is an interviewing method which captures the important historical events in a<br />
community, as perceived by the community themselves. In impact assessments, timelines can be<br />
used to define the temporal boundaries of a project. In other words, the timeline helps to clarify<br />
when the project started and when the project ended, or how long it has been going on for. This<br />
method is useful in helping to reduce recall bias.<br />
FIGURE2.3TIMELINEETHIOPIA<br />
<br />
Atimelineiscreatedby<br />
identifyinga<br />
knowledgeableperson<br />
(orpersons)ina<br />
communityandasking<br />
themtodescribethe<br />
historyofthe<br />
community.Inmany<br />
ruralcommunities,such<br />
descriptionsusually<br />
refertokeyeventssuch<br />
asdrought,periodsof<br />
conflictordisease<br />
epidemics.<br />
Afterthekeyevents<br />
havebeendescribed,<br />
thetimewhenthe<br />
projectstartedshould<br />
berelatedtothese<br />
events.Similarly,the<br />
timewhentheproject<br />
ended(orthetimeof<br />
theassessment)should<br />
alsoberelatedtothe<br />
keyevents.<br />
10<br />
Source: <strong>Participatory</strong> <strong>Impact</strong> <strong>Assessment</strong> Team, 2002<br />
18
ThefollowingtimelinewasproducedbyfivekeyinformantsinaruralcommunityinZimbabweparticipatingina<br />
droughtrecoveryprojectKeypoliticaleventswereusedasreferencepointsforthetimeline.Thetimelineshows<br />
whentheprojectstarted,andaconsequentimprovementinfoodsecurityshortlythereafter.Notethatthetimeline<br />
alsoshowsexternalfactorsthatmighthavecontributedtofoodsecurity,suchasimprovedrainfallandotherNGO<br />
interventions.Whereapplicableatimelineshouldhighlightnonprojectfactorsinordertohelpisolatetheimpactof<br />
theprojectfromotherrelevantvariables.<br />
FIGURE2.4TIMELINEZIMBABWE<br />
TimelineofrecenteventsNemangwe<br />
<br />
2000 National Referendum & Parliamentary Elections<br />
Okay Harvest<br />
Presidential<br />
Elections<br />
2002<br />
<br />
DROUGHT year, little or no harvest (March). Grains (maize) ran out by<br />
November. People started selling livestock to buy grain and eating fewer<br />
meals. They also started consuming ‘svovzo’. Some people moved to<br />
more productive neighboring areas in search of agricultural work.<br />
Concern started distributing in kind food assistance from December<br />
through to March 2003.<br />
2003<br />
<br />
Small Harvest in March. Grains (maize) ran out by November, people<br />
started exchanging household items for grain; some sold ox carts,<br />
ploughs, window frames and roofs in order to purchase maize.<br />
2004<br />
<br />
Good Harvest<br />
Parliamentary<br />
Elections<br />
GIRA Project<br />
Started in<br />
December05<br />
2005<br />
2006<br />
<br />
DROUGHT year, little or no harvest, people selling livestock and<br />
belongings to purchase grains. In August Africare started developing the<br />
GIRA project proposal in partnership with the community. Concern<br />
started distributing in kind food assistance in November through to<br />
April 2006. Africare initiated the GIRA project in December 2005-<br />
distributing soy bean, sorghum and sweet potato seeds. Although late in<br />
the planting season, many farmers managed to plant at least some of<br />
these seeds. Distributions continued through to January 2006<br />
2007<br />
<br />
Good harvest in March, particularly for sorghum, sweet potato and soy<br />
beans. This was attributed to high rainfall, and the seeds distributed by<br />
Africare. Two bad years and one medium year implied that most farmers<br />
either had no seeds left or at least no good quality seeds. Africare did a<br />
second round of seed distributions in September/October. (Soya beans,<br />
sweet potato, sunflower, maize and groundnuts)<br />
PIA May/Jun<br />
<br />
Bad maize harvest, as a result of poor rainfall. Soya beans and sweet<br />
potato did well, groundnuts did okay. By June people already having to<br />
purchase maize.<br />
<br />
GTZhavealsobeencarryingoutrestockinginterventionsinthesamewardsastheAfricareprojecthowever,thereisnoindicationofany<br />
overlapintermsofassistedcommunitiesorindividualhouseholdrecipients.<br />
Source: Burns and Suji, 2007<br />
19
STAGE THREE:<br />
IDENTIFYING INDICATORS OF PROJECT IMPACT<br />
A key feature of all types of project assessment is that inputs, activities, outputs, change or impact<br />
are measured. The things that we measure are usually called “indicators”.<br />
There are two types of indicators as follows:<br />
Process indicators sometimes called outcome indicators usually measure a physical aspect of<br />
project implementation, for example the procurement or delivery of inputs such as seeds, tools,<br />
fertilizer, livestock or drugs, the construction of project assets and infrastructure such as wells or<br />
home gardens, the number of training courses run by the project or the number of people trained.<br />
Process indicators are useful for showing that project activities are actually taking place according<br />
to the project work plan. However this type of indicator may not tell us much about the impact of<br />
the project activities on the participants or community.<br />
Processindicatorsmeasuretheimplementationoftheprojectactivities.Theseindicatorsare<br />
usuallyquantitativee.g.‘numberofgovernmentstafftrained’isaprocessindicatorwhich<br />
mightbereportedas’15agriculturalextensionofficerstrained’.<br />
<strong>Impact</strong> indicators measure changes that occur as a result of project activities. <strong>Impact</strong> indicators<br />
can be qualitative or quantitative, and usually relate to the end result of a project on the lives of the<br />
project participants. Most projects involve some sort of direct or indirect livelihoods asset transfer,<br />
such as infrastructure, knowledge, livestock, food or income. These asset transfers sometimes<br />
represent impact, but usually it is the benefits or changes realized through the utilization of these<br />
assets that represents a real impact on the lives of project participants.<br />
For example, if a project provides training in new and improved farming practices, a transfer of<br />
skills and knowledge or human capital would be expected. While this knowledge is all well and<br />
good, it is the utilization of the knowledge that will ultimately result in real impact on the lives of<br />
the participating farmers. If applied, this knowledge transfer may translate into improved crop<br />
yields, resulting in improved household food security. It may also lead to improved household<br />
income from increased crop sales. Therefore, the knowledge and the improved yields attributable<br />
to this knowledge are effectively only Proxy Indicators of impact. If some of the extra food<br />
produced is consumed by the farmer and his family, this utilization represents a real food security<br />
and nutritional benefit, or livelihoods impact. Alternatively, if increased income derived from crop<br />
sales allows for livelihoods investments in health, education, food and food production, or income<br />
generation, these expenditures would represent a real impact on the lives of the project<br />
participants.<br />
<strong>Impact</strong>indicatorslookattheendresultofprojectactivitiesonpeople’slives.Ideally,they<br />
measurethefundamentalassets,resourcesandfeelingsofpeopleaffectedbytheproject.<br />
Therefore,impactindicatorscanincludehouseholdmeasuresofincomeandexpenditure,food<br />
consumption,health,security,confidenceandhope.<br />
Most project M&E systems measure the process or delivery of inputs and activities as opposed to<br />
the real impact of the project on people’s livelihoods. Measuring process is no less important than<br />
20
measuring impact; process monitoring data is a valuable step in determining how impact relates to<br />
a specific project activity. For example if a food security project introduces high yielding crop<br />
varieties into a community and an impact assessment shows an overall improvement in food<br />
security, the process monitoring reports should tell us whether the improved seed varieties were<br />
indeed delivered and planted.<br />
In addition to measuring process indicators, some M&E systems do measure proxy indicators of<br />
impact such as livelihoods asset transfers. For example, knowledge transfers from a farmer training<br />
might be measured by testing the participants to see if they have learned the techniques that had<br />
been taught. Alternatively the project that introduced high yielding crop varieties might measure<br />
crop yields as a proxy for impact, assuming that increased production automatically translates into<br />
improved household food security. If the project was implemented in an insecure area, it is<br />
possible that the harvested crops never made it to the granary of the intended recipient, or that they<br />
were looted by militias shortly after the harvest. In some cases the transfer of project derived assets<br />
can and does actually put people at risk, resulting in a negative impact. Alternatively the farmer<br />
may have immediately sold his crops to pay taxes, loans, or debts, or to pay for school fees or<br />
medical expenses. In other words the food was not consumed in the household, and the project<br />
may not have provided the food security benefits anticipated under the project objectives. The<br />
project may well have had other impacts, possibly even more important than the food security<br />
benefits anticipated, but these would not be captured using the proxy indicator of improved yields.<br />
Although proxy indicators of impact can be useful and easy to quantify, they do not always<br />
provide an effective benchmark for measuring impact, as they do not go far enough in<br />
investigating the utilization of project asset transfers or the actual changes to people’s lives<br />
brought about by these transfers.<br />
Therefore, when identifying impact indicators it is useful to think about what livelihoods transfers<br />
are expected from the project in question. However, once you have identified these assets, it is<br />
useful to think about them in terms of utilization. In other words, how will the project participants<br />
use the knowledge, food, income and so on derived from the project, how will these assets help<br />
them, and what difference will this make to their lives?<br />
Community-defined indicators of project impact<br />
As far as possible, a PIA should use impact indicators which are identified by the community or<br />
intended project participants. Communities have their own priorities for improving their lives, and<br />
their own ways of identifying impact indicators and measuring change. Oftentimes these priorities<br />
and indicators are different from those identified by external actors. Traditional M&E systems tend<br />
to over emphasize ‘our indicators’ not ‘their indicators’. For example, selected drought response<br />
projects in Zimbabwe and Niger aimed to measure project impact against specific household food<br />
security indicators, such as increased crop production and dietary diversity. When project<br />
participants were asked to identify their own benchmarks of project impact, these included the<br />
following indicators.<br />
<br />
<br />
<br />
<br />
<br />
The ability to pay for school fees using project derived income (education benefits)<br />
The ability to make home improvements<br />
Improved skills and knowledge from the projects training activities<br />
Improved social cohesion<br />
Time saving benefits provided by the project<br />
21
One way of collecting community indicators of impact is simply to ask project participants what<br />
changes in their lives they expect to occur as a direct result of the project. Alternatively, in cases<br />
where the project has already been implemented you can ask what changes have already occurred.<br />
This should be done separately for each project activity that you plan to asses. If the project has a<br />
technical focus, for example natural resource management, the provision of agricultural inputs or<br />
livestock, ask the participants how they benefit from the ownership or use of the resources in<br />
question. Alternatively if the project focuses on training or skill transfers, ask how the training or<br />
improved skills will benefit them. These benefits are impact indicators.<br />
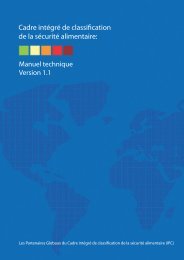
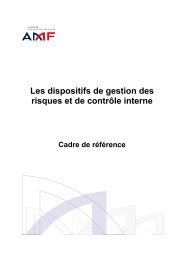
FIGURE:3.1LIVESTOCKBENEFITSINDICATORS<br />
Example: Benefits derived from Livestock, Dinka Rek Communities<br />
Community Animal Health Project, Tonj County Southern Sudan 1999<br />
Method: standardized<br />
proportional piling with 10<br />
community groups<br />
Some of these benefits<br />
can be used as impact<br />
monitoring indicators;<br />
For example an<br />
increase in milk<br />
production,<br />
consumption, or an<br />
increase in the number<br />
of marriages may be<br />
good indicators of<br />
improved livestock<br />
health that might be<br />
attributed to the project<br />
3%<br />
10%<br />
9%<br />
3%<br />
2% 1%<br />
7%<br />
25%<br />
34%<br />
6%<br />
milk<br />
meat<br />
marriage<br />
butter<br />
compensation<br />
manure<br />
ploughing<br />
sales/income<br />
hides/skins<br />
ceremonies<br />
Source: Catley, 1999<br />
One challenge that you may come across when collecting community indicators is that participants<br />
will assume you automatically know what livelihoods benefits will be derived from project<br />
activities or inputs. For example participants in a re-stocking intervention may tell you that they<br />
now have more goats as a result of the project. An increase in livestock would be a good<br />
community indicator of impact, however this alone doesn’t tell you how the goats will benefit that<br />
person or their household. When collecting these kinds of indicators it is important to follow up<br />
with additional questions. It may be that the actual benefit derived from the goats is an increase in<br />
milk production which ‘we feed to our children’. From this you can deduce that increased milk<br />
production, or increased household milk consumption are better indicators of impact than simply<br />
an increase in the number of livestock assets 1 . These indicators can easily be represented<br />
1 If the impact assessment takes place before the desired project impact is expected, you may have no choice but to use<br />
proxy indicators such as an increase in the number of livestock. Although not ideal, at least if these have been<br />
identified by project participants, they can to some extent be validated as community indicators.<br />
22
numerically. You can then go a step further and ask how milk is beneficial to their children, and<br />
the participant might mention the health and nutritional benefits that milk provides. Ultimately the<br />
best indicator of impact in this case may be an improvement in children’s health. Alternatively the<br />
participants may have received income from the sale of the goats or goat products. If this is the<br />
case you will want to ask how they used this extra income. Expenditures on food, education,<br />
clothes, medicine, ceremonies, and investments in livestock, agricultural inputs, or income<br />
generating activities are all good livelihoods indicators of impact that can be easily measured.<br />
Again, investigating how livestock, livestock products, and the income earned from these are<br />
utilized can be a useful way of unpacking and identifying livelihoods impact indicators.<br />
Example: A restocking project where project participants receive sheep and goats:<br />
Howdoyoubenefitfromgoats?<br />
<br />
“Ifeedthemilktoourchildren”<br />
<br />
<br />
<br />
<br />
<br />
<br />
“Iselltheoffspring,weusethemoneyforfood”<br />
“Inowhavemorestatusinthecommunity”<br />
“Icannowjointhelocalsavingandcreditgroup”<br />
These are all impact<br />
indicators<br />
When identifying the impact indicators try to be specific not general. For example, “The goats give<br />
me milk” is not very specific. A better and more specific indicator is “The children drink the goats<br />
milk” or “I use the income from selling milk to pay school fees”. Similarly, the indicator “I have<br />
more status in the community” is not very specific. A better indicator might be “I can now join the<br />
local savings and credit group in the village”.<br />
When collecting community indicators, it is important to capture the views of different groups of<br />
people within the community. Women will often have different priorities and expectations of<br />
project impact than men. The same might apply to different groups. For example Fulani<br />
pastoralists are likely to attach greater importance to the livestock health benefits from a project<br />
well than their Haussa neighbors in the same community, whose livelihoods practices focus on<br />
agricultural production.<br />
Quantitative and Qualitative Indicators<br />
Community impact indicators may be quantitative, such as income earned from crop sales, or<br />
qualitative, such as improved skills, knowledge or social status. People often believe that impact is<br />
difficult to capture because it is qualitative. However, any opinion, perception or feeling can be<br />
expressed numerically using participatory ranking or scoring methods. Having said this, it is<br />
important to apply these methods systematically and repetition improves reliability.<br />
23
Examplesofquantitativeimpactindicators:(increasedmilkconsumptionby<br />
children,incomefromcropsales)<br />
Examplesofqualitativeimpactindicators:(trustconfidencehope,status<br />
participation,security,dignity,socialcohesion,wellbeing)<br />
If the community or participants produce many impact indicators, ask them to prioritize the<br />
indicators using ranking. It is important not to have too many indicators: as with the key<br />
assessment questions, it is better to have a few good indicators than too many poor ones. Try to<br />
limit the number of indicators therefore to no more than five per project activity being assessed.<br />
Changes in coping strategies<br />
Often times during a humanitarian crisis, people will employ a variety of economic or livelihoods<br />
strategies to cope with the effects of a particular shock such as a drought. These strategies,<br />
sometimes called coping mechanisms are often good indicators by which to measure change or<br />
impact. For example during a drought people may sell most of their livestock (usually at a reduced<br />
price) in order to purchase food and cover other priority expenses. Once the situation has improved<br />
and people move into a recovery period, they will often restock by re-investing in livestock assets.<br />
By capturing these changes you can determine whether the situation has improved and to what<br />
extent the project played a role in facilitating this change. To identify these coping strategies,<br />
simply ask people what they did during the period leading up to and during the crisis.<br />
Table 3.1 Examples of Common Coping Strategies<br />
CopingMechanisms<br />
1 Destockingtosaveremaininglivestockandpurchasegrain(earlystagesofdrought)<br />
2 Stresssaleoflivestockatreducedpricesinordertopurchasegrain(laterstagesofdrought)<br />
3 Saleofhouseholdassets(includingroofing,doors,windows,andcookingutensils)inordertopurchasegrain.<br />
4 Migratetootherareasinsearchofbetterpastureforlivestock<br />
5 Increasevegetableproductionforconsumptionandsale<br />
6 Migrationofyoungmentourbanareasaswellastoothercountriesinsearchofemployment<br />
7 Expandoninformalincomegeneratingactivitiessuchasmatweaving,brickmaking,firewoodcollection<br />
8 Increaseproduction/collectionandconsumptionofwildfoods<br />
9 Reducethenumberofmealsconsumed(evendowntoonemealaday)<br />
10 Engageinagriculturalworkinneighboringcommunitieslessaffectedbythedrought,orforwealthierfarmers<br />
11 Participateinfoodforworkprojectsorpublicsafetynetprogram<br />
12 Permanentlymigratetourbanareasandgiveupagropastoralistlivelihoodspractices<br />
For most livelihoods projects, community indicators of project impact will often relate to changes<br />
or improvements in income, food security, health and education. <strong>Impact</strong> against these indicators as<br />
well as changes in coping strategies can often be broadly captured by looking at changes in income<br />
and food sources, as well as household expenditure. For example, using the strategies from the<br />
table above; in comparison to a normal year, after a poor cereal harvest, one might expect a greater<br />
portion of household food to come from wild foods (strategy #8) relative to cereals. One might<br />
also expect a greater portion of income to come from the sale of household assets (strategy # 3)<br />
relative to other income sources during this period. In terms of household expenditure, after a poor<br />
harvest you might expect a greater proportion of household income to be spent on food to<br />
compensate for the decline in farm production. During a ‘recovery’ period following a drought,<br />
24
one might expect households to spend more of their income on livestock assets, as they re-stock<br />
after suffering livestock losses due to death or stress sales. Therefore tracking changes in food,<br />
income and expenditure can often be a useful way of measuring impact against community<br />
indicators of impact and against coping strategies. Many livelihoods projects also have food<br />
security, income generating, or livelihoods diversification objectives and again food, income and<br />
expenditure changes can be a useful way to measure change against these objectives.<br />
It needs to be emphasized that an understanding of the context is essential to deriving meaning<br />
from these indicators, as livelihoods and coping strategies will vary depending on the kind of crisis<br />
being experienced. They will also change over time and between different communities. Simply<br />
measuring changes in livelihoods impact indicators will not tell you much about impact unless you<br />
understand the reasons behind those changes. An understanding of livelihoods and context is<br />
therefore an important part of any impact assessment.<br />
25
STAGE FOUR:<br />
METHODS<br />
This section provides both real life and hypothetical examples of how different methods have been<br />
or might be used to measure project impact on livelihoods. The exact tools used in these examples<br />
may or may not be transferable to other projects or assessments. However, they should provide an<br />
overview of how participatory tools can be adapted and applied in different contexts to measure<br />
the impact of different types of projects. For additional resource materials on participatory tools<br />
and methods see Annex 1.<br />
Once you have identified your impact indicators, you will need to decide which methods should<br />
be used to measure changes in these indicators. Some useful methods which can be used to<br />
measure impact or change numerically include, simple ranking and scoring, “before” and<br />
“after” scoring, pair-wise ranking and matrix scoring, impact calendars, radar diagrams, and<br />
proportional piling. All these methods involve the use of semi-structured interviews as part of the<br />
method. Each method has its strengths and weaknesses, and some methods are more appropriate<br />
for certain cultures and contexts. It is important to field test your methods with community<br />
members before the assessment.<br />
© Abebe 2007 © Burns 2007<br />
Ranking and scoring methods<br />
Ranking and scoring methods require informants to assess the relative importance of different<br />
items. Ranking usually involves placing items in order of importance (1 st , 2 nd , 3 rd etc.) whereas<br />
scoring methods assign a value or a score to a specific item. This is usually done by using<br />
counters such as seeds or stones, nuts or beans to attribute a specific score to each item or<br />
indicator. Proportional piling and scoring techniques can be used to assess the relationship<br />
between two or more given variables; these may include indicators of project impact. For<br />
proportional piling informants are asked to distribute one hundred counters amongst the different<br />
variables or indicators, with the largest number of counters being assigned to the most important<br />
indicator, and the smallest number of counters being assigned to the least important indicator.<br />
26
FIGURE4.1:WORKSHOPEVALUATIONSCORINGSHEET<br />
<br />
Thetableontherightisa<br />
photographofanevaluation<br />
formfilledoutbya<br />
participantatanimpact<br />
assessmenttraining<br />
workshop.Itprovidesan<br />
exampleofhowasimple<br />
scoringexercisewasusedto<br />
assesstheeffectivenessof<br />
thetrainingagainstthe<br />
workshopobjectivesand<br />
otherindicatorsidentified<br />
byparticipantsand<br />
facilitatorsduringthe<br />
workshop.Participantswere<br />
askedtoassignascoreto<br />
eachindicatoronascaleof<br />
15,withfivebeingthemost<br />
important,andonebeing<br />
theleast.<br />
<br />
<strong>Impact</strong>assessmentscoring<br />
methodsessentiallyfollow<br />
thesameprinciplesapplied<br />
inthisexample.<br />
27
If a food security project were to establish a community nutrition garden, you may want to measure<br />
the impact of the project garden on household food security using a simple scoring exercise. This<br />
could be done by asking project participants to identify all the food sources that contribute to the<br />
household food basket. Using visual aids to represent each of the different food sources, you would<br />
then ask the participants to distribute the counters amongst the different variables to illustrate the<br />
relative proportion of household food derived from each food source.<br />
FIGURE4.2:EXAMPLE–SCORINGOFFOODSOURCES<br />
<br />
Cereal<br />
Crops<br />
<br />
<br />
••••••••••<br />
••••••••••<br />
••••••••••<br />
<br />
<br />
Project<br />
Garden<br />
<br />
<br />
••••••••••<br />
<br />
Livestock<br />
<br />
<br />
••••••••••<br />
•••<br />
<br />
Poultry<br />
<br />
<br />
Fishing<br />
<br />
<br />
WildFoods<br />
<br />
<br />
Purchased<br />
<br />
<br />
FoodAid<br />
<br />
<br />
•••••••<br />
<br />
••••••••••<br />
<br />
••••••••••<br />
••••••••••<br />
•••••••<br />
<br />
•••<br />
<br />
<br />
3%<br />
17%<br />
10%<br />
10%<br />
7%<br />
13%<br />
30%<br />
10%<br />
CerealCrops<br />
ProjectGarden<br />
Livestock<br />
Poultry<br />
Fishing<br />
WildFoods<br />
Purchased<br />
FoodAid<br />
<br />
<br />
The results from this simple hypothetical example indicate that ten percent of household food comes<br />
from the community garden (figure 4.2). Assuming that this particular food source (community<br />
garden) was introduced by the project it represents a new food source and the ten percent contribution<br />
to the food basket represents an impact on household food security that can be directly attributed to the<br />
project.<br />
Note - although using a hundred counters makes it easier to automatically assign a percentage score to<br />
the results of scoring exercises, it is not essential that you use this many, and often it is quicker to use<br />
fewer counters when carrying out repetitive scoring exercises. As a general rule, if you are comparing<br />
many indicators, you will need more counters, if you are only comparing two variables, ten counters<br />
may be sufficient.<br />
28
TheuseofvisualaidsandindicatorcardsinPIA<br />
Whereseveraldifferentindicatorsarebeingcompareditisusefultousevisualaids,suchasthe<br />
picturecardsillustratedinthesephotos.Alternativelylocalmaterialscanbeusedtorepresent<br />
eachindicator.Forexampleaheadofsorghummightrepresentrainfedproduction,abroad<br />
<br />
greenleafmightrepresentvegetableproduction,andafeathermightbeusedtorepresent<br />
poultryproduction.Whereinformantsareliterateyoumaychoosetosimplywritethenameof<br />
theindicatoronacard.Theuseoftheseaidshelpstoavoidpilesofcountersbeingassignedto<br />
thewrongindicator.Whereindicatorshavealreadybeenidentifiedpriortotheassessment,itis<br />
usefultopreprepareindicatorcardsbeforehand,particularlywhenusingpicturecards.Itis<br />
alsoimportanttousestrongpiecesofcardthatwillnotgetdamagedinthefield.<br />
29
Before and After Scoring<br />
“Before and after” tools are an adaption of scoring methods which enable a situation before a project<br />
to be compared with a situation during or after a project. Definitions of “before,” “after” or “during”<br />
can be obtained from time-lines which provide a useful reference for establishing agreement between<br />
the investigator and assessment participants on these different points in time. With “before” and<br />
“after” scoring, rather than simply scoring items against indicators, each score is further subdivided to<br />
give a score “before” the project and a score “now” or “after” the project. This kind of tool is<br />
particularly useful in measuring impact where project baseline data is weak or non-existent.<br />
FIGURE4.2.1EXAMPLE–“BEFORE”AND“AFTER”SCORINGOFFOODSOURCES<br />
FoodSource<br />
(indicator)<br />
<br />
<br />
Rainfed<br />
Production<br />
<br />
Project<br />
Garden<br />
<br />
Livestock<br />
Production<br />
<br />
Poultry<br />
Fishing<br />
<br />
WildFood<br />
Collection<br />
<br />
Purchases<br />
<br />
FoodAid<br />
BEFORE<br />
AFTER<br />
BEFORE<br />
AFTER<br />
BEFORE<br />
AFTER<br />
BEFORE<br />
AFTER<br />
BEFORE<br />
AFTER<br />
BEFORE<br />
AFTER<br />
BEFORE<br />
AFTER<br />
BEFORE<br />
AFTER<br />
Counters(score)<br />
<br />
••••••••••••••••••••••••••••••••••••<br />
••••••••••••••••••••••••••••••<br />
••••••••••<br />
•••••••••••<br />
•••••••••••••<br />
••<br />
•••••••<br />
••••••••••<br />
••••••••••<br />
••••••••••••••<br />
••••••••••<br />
••••••••••••••••••••<br />
•••••••••••••••••<br />
•••••••<br />
•••<br />
Steps<br />
<br />
1. Usingthehypotheticalexampleof<br />
theprojectgarden;askthe<br />
participantstodistributethe<br />
counterstorepresenttheirfood<br />
sourcecontributionsbeforethe<br />
projectstarted.<br />
<br />
2. Oncetheyarehappywiththe<br />
distributionofthecounters,record<br />
theresults.<br />
<br />
3. Thenaskthemtorepeatthe<br />
exerciseforthecurrentor“after”<br />
situation.<br />
<br />
4. Ifyouobserveanychangesinthe<br />
scores(foodcontributions)from<br />
“before”and“after”–askthe<br />
participantstoexplainthereasons<br />
forthesedifferences,andrecord<br />
theexplanations.<br />
<br />
Interpretingtheresults<br />
<br />
Although“before”and“after”scoringexercisescanbeusefulforrecordingchange,thesechangesmayhaveoccurred<br />
foranynumberofreasons.Forexample,theresultsshowninfigure4.2.1mightbeexplainedasfollows:<br />
<br />
Intermsofimpact,theresultsindicatethatfoodproducedintheprojectgardenprovidesatenpercentcontribution<br />
tothehouseholdfoodbasket.Theyalsoillustratethattheprojecthasprovidedpeoplewithanewsourceoffood,<br />
representedbythe‘zero’contributionfromtheprojectgardenbeforetheprojectstarted.<br />
<br />
Therelativereductioninthecontributionsofrainfedcrops,wildfoods,andreliefaidmaybepartlyattributedto<br />
thefactthatthesecontributionshavebeenoffsetbyproductionfromtheprojectgarden,andthereforerepresenta<br />
reduceddependencyonthesefoodsources.<br />
<br />
Increasedwildfoodconsumptionisoftencitedasafoodsecuritycopingmechanism,andsoareduceddependency<br />
onthisfoodsource,aswellasonfoodaidmayalsorepresentapositiveimpactonfoodsecurity.<br />
<br />
30
However,itisalsopossiblethatareductioninfoodaidmayhavebeenduetosupplyissues,andthereductionin<br />
rainfedcropsandwildfoodsmayhavebeentheresultofinadequaterainfallandapoorharvest.Inthiscase<br />
productionfromtheprojectgardenmayhavehelpedpeopletocopewiththebadharvest,andprojectimpact<br />
wouldbeframedmoreintermsofimprovingpeople’sresiliencytofoodshocks,ratherthananimprovementinfood<br />
security.Consistentwiththis,theresultsdonotshowanoverallincreaseinfood,orevenanimprovementinfood<br />
security,onlytherelativechangeinthecontributionsofthedifferentfoodsources.<br />
<br />
Theincreaseinthefoodcontributionfrompoultryproductionmaybeduetothefactthattherespondentwasable<br />
toinvestinhensusingincomefromthesaleofcropsproducedintheprojectgarden.Thislivelihoodsinvestment<br />
wouldrepresentaprojectimpact,andtheincreaseinthecontributionfromthissourceisausefulindicatorofthis<br />
impact.<br />
<br />
Alternatively,theincometoinvestinpoultrymaybeattributedtoprojectrelatedsavingsasopposedtodirect<br />
projectderivedincome.Itispossiblethatbeforetheproject,peoplewouldhavetopurchasesomeofthefoodthey<br />
nowproduceintheprojectgarden.Thissavingmayaccountfortheresultsshowingarelativereductioninthe<br />
amountofhouseholdfoodnowbeingpurchased.<br />
<br />
Whileallornoneoftheseinterpretationsmaybetrue,thereisnowayofknowingunlessyouasktheinformantsto<br />
explainthechangesobserved.Althoughparticipatoryscoringmethodsareausefulwayofcollectingnumericaldata<br />
onprojectimpact,ontheirown,thenumbersproducedfromtheseexercisescanbefairlymeaninglesswithoutthe<br />
reasoningtoexplainthem.Therefore,itisessentialthattheseexercisesareconductedaspartofasemistructured<br />
interviewprocess,andnotdoneinisolation.<br />
FIGURE4.2.2EXAMPLEOFA“BEFORE”AND“AFTER”SCORINGOFFOODBASKETCONTRIBUTIONSFROMDIFFERENTCROPS(N=145)<br />
Source: Burns and Suji 2007<br />
The scoring exercises in the previous examples essentially measure relative as opposed to actual<br />
changes in the indicators being assessed. For example, if the contribution to household income from<br />
one income source were to increase over a period of time, this increase is only relative to contributions<br />
31
from the other income sources. For example, a farmer in Zimbabwe earns a hundred percent of his<br />
income from selling cotton and in a typical year can expect to earn the equivalent of $ US 900 from<br />
cotton sales. However, a fairly sudden decrease in the domestic and international demand for cotton<br />
brings down the price, and this year the farmer can only expect to earn the equivalent of $ US 500<br />
from cotton sales. During the same period, an international NGO started implementing a project in the<br />
area promoting crops such as soya and sweet potato with the objective of promoting household food<br />
security. The cotton farmer had participated in the training, and had received seeds and planting<br />
materials and had managed to produce a surplus which he sold locally for the equivalent of $ US 400.<br />
While the percentage of his income earned from other sources (soya and sweet potatoes) went from<br />
zero to almost forty five percent, and the percentage income earned from cotton almost halved, his<br />
actual income remained the same at $ US 900. Similarly if cotton prices had remained stable, and he<br />
had participated in the project and had earned $ US 900 from cotton sales and $ US 400 from soya and<br />
sweet potato sales, a scoring exercise would roughly show a thirty percent reduction in the<br />
contribution of cotton to his overall income. This does not represent a thirty percent reduction in<br />
income earned from cotton, as his overall income actually increased by forty five percent. These types<br />
of “before” and “after” scoring exercises therefore only show the relationship between different<br />
variables, and impact is measured in terms of the relative changes in the importance of these indicators<br />
in relationship to each other, not quantified in exact metric or monetary units.<br />
Having said this, it is possible to estimate an actual (comparative) percentage increase or decrease<br />
against certain indicators using participatory scoring tools. The following example shows how<br />
“before’ and “after” proportional piling was used to measure changes in cattle disease during a<br />
community based animal health project in South Sudan. Proportional piling was done with 6 groups of<br />
informants and the results were compiled. The “before” project situation was described first by<br />
dividing 100 stones according to the main cattle diseases at the time. The informants were then asked<br />
to increase or decrease or leave the hundred stones according to the “after” project situation. The areas<br />
of the two pie charts are proportional.<br />
FIGURE4.2.3:EXAMPLE“BEFORE”AND“AFTER”SCORINGOFLIVESTOCKDISEASES<br />
“Before”and“After”cattlediseasesinGanyiel,SouthSudan<br />
Before<br />
Now<br />
Gieng Liei Rut<br />
Doop Dat Duny<br />
Yieth Ping<br />
Source: Catley 1999<br />
32
FIGURE4.2.4IMPACTSCORINGOFMILKPRODUCTION<br />
<br />
Thisexample<br />
illustrateshow<br />
proportional<br />
pilingwasusedto<br />
comparemilk<br />
productionin<br />
healthycattleas<br />
opposedtothose<br />
sufferingfrom<br />
differenttypesof<br />
cattledisease.<br />
Theblackdots<br />
representthe<br />
pilesofcounters.<br />
<br />
Ahundred<br />
counters(inthe<br />
centerofthe<br />
diagram)were<br />
usedtorepresent<br />
milkproduction<br />
fromhealthy<br />
cattle.The<br />
smallerpileson<br />
theperiphery<br />
representmilk<br />
productionin<br />
infectedlivestock.<br />
<br />
Awet - Rinderpest<br />
Daat – Foot and mouth disease and foot rot<br />
Guak – Probably fascioliascis<br />
Joknhial - Anthrax<br />
Abuot – Contagious bovine pleuropneumonia<br />
Ngany – Internal parasites<br />
Liei – Disease characterized by weight loss, includes trypanosomiasis & fascioliascis<br />
Makieu – unknown; affected animal behaves abnormally and cries<br />
Source: Catley 1999<br />
33
Scoring against a nominal baseline<br />
Another way of capturing actual (comparative) as opposed to just relative change is by using a<br />
nominal baseline to represent a quantity of a given indicator at a certain point in time. The following<br />
example describes how this method was used to assess changes in income during an impact<br />
assessment of a project which was designed to achieve household income benefits.<br />
Table 4.1 Measuring impact against a nominal baseline<br />
Example:<br />
<br />
Projectparticipantswereaskedtoshowiftherehadbeenanyincreaseordecreaseinactualincome<br />
sincetheprojectstarted.Thiswasdonebyplacingtencountersinonebasketwhichrepresentedtheir<br />
incomebeforetheproject.Theparticipantswerethengivenanothertencountersandaskedtoshow<br />
anyrelativechangesinhouseholdincome,byeitheraddingcounterstotheoriginalbasketoften,or<br />
removingthem.Forexampleifsomeoneweretoaddfourcounterstotheoriginalbasketthiswould<br />
representafortypercentincreaseinincome.Alternativelyiftheyweretoremovefourcountersitwould<br />
representafortypercentdecreaseinincome.Theparticipantswerethenaskedtoaccountforthese<br />
changes.Thetablebelowshowstheaggregatedresultsindicatingbetween15%to16%averageincrease<br />
inincomeinthetwoprojectcommunities.<br />
<br />
Location Variable MeanScore(increase)95%CI<br />
Njelele(n=117) ChangesinHHIncome 16.3(15.9,16.8)<br />
Nemangwe(n=145) ChangesinHHIncome 15(14.3,15.7)<br />
Dataderivedbyscoringatotalof20countersagainstagivenbaselineof10counters.(Source,BurnsandSuji,2007)<br />
Scoring against a nominal baseline can be useful in estimating changes in certain indicators such as<br />
income, livestock numbers, and crop yields. In many cases, people will be unwilling to reveal certain<br />
types of information, and this method does not require exact income, or herd sizes to be quantified.<br />
Therefore, sensitive questions like ‘how much money did you make’, or ‘how many cattle do you<br />
own’ are not necessary.<br />
<br />
FIGURE4.2.5:SCORINGCHANGESINCROPYIELDSAGAINSTANOMINALBASELINE<br />
Thechartshows<br />
theresultsfroman<br />
exercisethat<br />
estimatedchanges<br />
incropyields<br />
againstanominal<br />
baseline.The<br />
projecthadbeen<br />
promoting<br />
productionof<br />
groundnuts,sweet<br />
potatoes,and<br />
droughtresistant<br />
varietiesof maize.<br />
MeanScore<br />
18<br />
16<br />
14<br />
12<br />
10<br />
8<br />
6<br />
4<br />
2<br />
0<br />
ProductionChangesinExistingCropsNemangwe(n=145)<br />
2005<br />
2007<br />
Dataderivedbyscoringwith20countersagainstanominalbaselineof10counters.(Source,BurnsandSuji,2007)<br />
34
Simple Ranking<br />
As the term implies, simple ranking involves asking participants to categorize or grade items in order<br />
of importance. This can be a useful way of prioritizing the impact indicators you wish to use in an<br />
assessment, or to get an understanding of which project benefits or activities are perceived to be of<br />
greatest importance to the community members.<br />
Table 4.2: Overall project benefits by focus group participants<br />
Benefit<br />
Betterfarmingskills<br />
Morefood(fewerhungermonths)<br />
Increasedvarietyoffood/dietarydiversity(improvednutrition)<br />
Improvedhealth<br />
Increasedincomefromsaleoffood<br />
RankinginorderofImportance<br />
(n=16)<br />
Dataderivedusingthesummaryofranksfrom16focusgroupdiscussions.Theoriginaldatawascollectedusingsimpleranking<br />
(Source,BurnsandSuji,2007)<br />
1 st <br />
2 nd <br />
3 rd <br />
4 th <br />
5 th <br />
Table 4.3 Ranking of livestock assets<br />
RankingofCommunityLivestock<br />
Assets<br />
Women<br />
Men<br />
Cattle 1 st Cattle 1 st <br />
Sheep 2 nd Goats 2 nd <br />
Goats 3 rd Sheep 3 rd <br />
Camels 4 th Camels 4 th <br />
Donkeys 5 th Donkeys 5 th <br />
Horses 6 th Horses 6 th <br />
(Source: Burns, 2006)<br />
Inthisexamplepastoralistswereaskedwhatbenefitsthey<br />
derivedfromdifferentlivestock.Theywerethenaskedtorank<br />
themintermsoftheoverallbenefitstheyprovided.Theexercise<br />
wasdonewithbothwomenandmen’sgroupstoensurethat<br />
anygendereddifferenceswerecaptured.Inthisexamplethe<br />
onlyvariationwasthatwomenrankedsheephigherthangoats<br />
astheyfetchedahighermarketprice.Themenvaluedgoats<br />
slightlyhigherthansheepastheyaremoreresilienttodrought.<br />
It is also possible to prioritize indicators by getting people to vote using a ballot scoring exercise. For<br />
an impact assessment of a food security project in Zimbabwe, indicators were prioritized by asking<br />
participants to vote using a secret ballot. After a discussion about all the potential impact indicators<br />
that applied to the project, participants then wrote down what they perceived to be the single most<br />
important indicator of project impact. These were then collected and tallied and disaggregated by<br />
gender. Needless to say this method would need to be adapted in non-literate communities.<br />
It is possible that other voting methods could be applied to impact measurement. In many ways project<br />
impact assessment is no different from a consumer survey or a polling exercise. Simple voting<br />
exercises include getting people to stand in lines or groups representing different indicators, or getting<br />
them to raise their hands in response to a specific question comparing two variables. These kinds of<br />
exercises lend themselves to focus group discussions. However, public voting can be problematic, as<br />
peer pressure may influence the vote, or the views of minority groups or less powerful individuals in<br />
the community may not come through. Nevertheless there is scope for experimentation with these<br />
kinds of exercises, particularly where the objective is to capture a quick vote on a non-sensitive issue.<br />
35
Pair-wise Ranking and Matrix Scoring<br />
Matrix scoring is a useful method in PIA. Primarily it is used to identify and prioritize impact<br />
indicators, and as a method for attributing impact to a project or a given project activity. Matrix<br />
ranking or scoring is essentially used to compare several items against a set of different indicators.<br />
Matrix scoring involves three main stages – a pair-wise comparison followed by the scoring of items,<br />
and finally ‘interviewing the matrix’.<br />
Example of a ranking and matrix scoring of food source preferences<br />
The following example describes how a pair-wise ranking and matrix scoring exercise was used to<br />
assess food source preferences during an assessment visit to an integrated livelihoods project in Niger.<br />
The project had several components -these included re-stocking of small ruminants and the<br />
establishment of cereal banks, and vegetable gardens.<br />
<br />
During a focus group discussion<br />
participants identified their existing<br />
food sources as follows:<br />
Own farm production (millet)<br />
Vegetable production<br />
Purchased food (excluding cereal bank)<br />
Livestock production (milk and meat)<br />
Cereal bank (millet) purchases<br />
© Kadede 2007<br />
They were asked to individually compare or rank each food source against each of the other food<br />
sources in terms of overall preference. The participants were asked to give reasons for their<br />
preferences. The name of the food source that ranked highest was then entered into the appropriate cell<br />
in the pair-wise matrix (Table 4.4)<br />
Table 4.4 Pair-wise ranking showing food source preferences<br />
FoodSource Millet Vegetables Purchases CerealBank Livestock<br />
Millet(ownproduction) Millet Millet Millet Millet<br />
Vegetables(ownproduction) Vegetables Vegetables Vegetables<br />
Purchases CerealBank Purchases<br />
CerealBank<br />
CerealBank<br />
Livestock<br />
Data collected from a pair wise ranking exercise with focus group participants during a field testing visit (Source: Burns, 2007)<br />
An overall preference score is then calculated by counting the number of times each food source was<br />
ranked highest and thus recorded in the matrix:<br />
Score:<br />
Rainfedcerealproduction: 4<br />
Vegetableproduction: 3<br />
CerealBanks: 2<br />
Purchase: 1<br />
Livestock: 0<br />
<br />
However, the objective of this exercise was not just to assign a<br />
rank or score to each of the food sources, but to identify<br />
indicators against which the food source could be scored against.<br />
These indicators were largely derived from the following reasons<br />
that were given for assigning a higher rank or preference to one<br />
food source over another:<br />
36
Table 4.5 Reasons given for food source preferences<br />
1 Milletvs.Vegetables Weprefermillet,asvegetablesrequirealotofwater,whichishardtocome<br />
byinthisarea,makingvegetablesdifficulttogrow.<br />
2 Milletvs.Purchase Milletiseasiertocomeby,inthatwecangrowitanditischeaperaswe<br />
don’thavetopayforit.<br />
3 Milletvs.Cerealbank Wedon’tpayforthemilletwegrow;thereforeit’scheaperthanthecereal<br />
bankmillet.<br />
4 Milletvs.Milk It’seasiertosellmilletthanmilk<br />
5 Vegetablesvs.Purchase Ifwegetagoodharvestwecanearngoodincomefromsellingthe<br />
vegetables.<br />
6 Vegetablesvs.Cerealbanks Vegetablesarecheaper<br />
7 Vegetablesvs.Milk: Vegetablesareeasiertosellthanmilk,andarethereforebetterat<br />
generatingincomeforthepoor.<br />
8 Cerealbankvs.Purchase Cerealbanksarecheapest<br />
(Source, Burns 2007)<br />
From these discussions it transpired that the overall preference for millet from own production was<br />
largely attributed to the volume or quantity of food that is produced from this source. The assessment<br />
team also asked participants what sources provided the most nutritious or healthy foods as opposed to<br />
just the largest quantities.<br />
Based on the discussion during and after the exercise, the assessors and participants agreed on four<br />
broad categories of food preference indicators:<br />
<br />
1. Availability (quantity/volume) 2. Accessibility (easy to come by/grow/cheap)<br />
2. Income earning or savings potential. 4. Nutritional /health value<br />
Participants were then asked to score the five food sources against each of the four food preference<br />
indicators identified. This was done using visual aids to represent each food source. A millet stem was<br />
used to represent rain-fed millet production, a broad green leaf was used to represent vegetable<br />
production, a handful of coins was used to represent food purchases (excluding cereal bank<br />
purchases), a bottle top was used to represent livestock production (milk and meat), and a small bag of<br />
groundnuts was used to represent cereal bank purchases. After carefully explaining what each visual<br />
aid symbolized, the assessors asked the participants to score each of the food sources against the first<br />
food preference indicator using fifty counters. The exercise was then repeated for each of the other<br />
three food preference indicators. The physical distribution of counters was done by one volunteer, but<br />
this was based on group consensus.<br />
37
© Kadede 2007 © Kadede 2007<br />
Table 4.6 Matrix scoring of different food sources against indicators of preference<br />
Millet Vegetables Purchases CerealBank Livestock<br />
Availability(Quantity/Volume) 15 12 5 13 5<br />
Access(Easytocomeby) 22 8 3 13 4<br />
Incomeearningandsavingspotential 12 13 0 8 17<br />
NutritionalValue 6 17 6 6 15<br />
Total 55 50 14 40 41<br />
Data derived from a matrix scoring exercise using 50 counters, collected during focus group discussions (Source: Burns, 2007)<br />
Note - Although livestock ranked lowest on the food source preferences during the pair-wise ranking<br />
exercise, against specific indicators such as income potential and nutritional value, it ranks much<br />
higher than some of the other food sources. Against the four indicator categories shown here, livestock<br />
comes out with the third highest overall score, illustrating how matrix scoring can be a valuable tool to<br />
measure against different indicators, and capture important information that otherwise may be<br />
overlooked.<br />
38
<strong>Impact</strong> Calendars and Radar Diagrams<br />
<strong>Impact</strong> calendars and radar diagrams can be useful in measuring impact against dimensional indicators<br />
such as time and distance. The following illustrations show an example of a tool that was used to measure<br />
the number of months of household food security “before” and “after” a project. Project participants were<br />
given twenty five counters representing a households’ post harvest food balance. Using twelve cards<br />
representing each month of the year, participants were asked to distribute the counters along a twelve<br />
month calendar to show the monthly household utilization of the harvested maize up until depletion. This<br />
exercise was done with project participants for the agricultural year before the project started, and again<br />
for the agricultural year after the project had started. The exercise was then repeated with community<br />
members who had not participated in the project.<br />
© Suji, 2007 © Burns, 2007<br />
Table 4.7 Food security impact calendar example using 25 counters (1 repetition)<br />
April May June July Aug Sept Oct Nov Dec Jan Feb Mar<br />
2004-2005<br />
•••••••••••• •••••• •••• •• •<br />
2006-2007 actual<br />
••••••••• •••• •••• ••• ••• ••<br />
2006-2007 (Control)<br />
•••••••••••••• ••••••• ••••<br />
FIGURE4.3CHANGESINTHENUMBEROFMONTHSOFFOODSECURITY<br />
DurationofHouseholdFoodSecurity(n=1)<br />
16<br />
14<br />
12<br />
10<br />
8<br />
6<br />
4<br />
2<br />
0<br />
Apr May Jun Jul Aug Sept Oct Nov Dec Jan Feb Mar<br />
20042005 2006/07ProjectParticipants 2006/07NonParticipants<br />
39
Measuring Participation<br />
FIGURE4.4PARTICIPATIONRADARDIAGRAMS<br />
Thisexamplefromtwentyyears<br />
agoshowshowradardiagrams<br />
wereusedtomeasurelevelsof<br />
communityparticipationina<br />
primaryhealthcareproject.<br />
Thisisagoodillustrationofhow<br />
aqualitativeindicatorsuchas<br />
participationcaneasilybe<br />
measured.<br />
<br />
Inthisexamplelevelsof<br />
participationaremeasured<br />
againstfivecomponentsofthe<br />
projectcycle.Thiswouldbe<br />
donebyaskingparticipantsto<br />
gaugetheirownlevelof<br />
participationineachofthe<br />
activitiesidentifiedonascaleof<br />
05eachlevelbeing<br />
representedbythespokeson<br />
theradardiagram.Theresults<br />
showincreasinglevelsof<br />
participationovertime.<br />
Resource mobilisation<br />
Organisation<br />
Management<br />
Leadership<br />
Needs <strong>Assessment</strong>s<br />
Year 1<br />
Resource mobilisation<br />
Organisation<br />
Management<br />
Leadership<br />
Needs <strong>Assessment</strong>s<br />
Year 3 Year 1<br />
Resourc e m obilis ation<br />
Organisation<br />
Management<br />
Leadership<br />
Needs <strong>Assessment</strong>s<br />
Year 5 Year 3 Year 1<br />
Source: Rifkin, S. B., Muller, F. and Bichmann, W. (1988). Primary healthcare: on measuring participation. Social Science<br />
and medicine 26 (9), 931-940<br />
40
Time Savings Benefits<br />
Time saved as a result of a project, or project activity is often cited as a key community impact<br />
indicator or project benefit. In the following example from a dam rehabilitation project, participants<br />
suggested that the time saved on domestic water collection was an important project benefit. Using the<br />
same concept as “before” and “after” scoring but without the counters, and using minutes as a standard<br />
unit of measurement, project participants were simply asked how much time they spent each day<br />
collecting water before the construction of the dam, and how much time they spent on this activity<br />
now. The responses were recorded, and the radar diagram below (figure 4.5) provides a visual<br />
illustration of the results from eight respondents.<br />
FIGURE4.5MEASURINGTIMESAVINGBENEFITS<br />
Numberofminutesspentondaily watercollectionbeforeandaftertheconstructionofthe<br />
projectdam(n=8/Disaggregated)<br />
Before After<br />
60 10<br />
60 60<br />
60 30<br />
30 10<br />
40 10<br />
60 20<br />
40 10<br />
10 10<br />
7<br />
8<br />
60<br />
50<br />
40<br />
30<br />
20<br />
10<br />
0<br />
1<br />
2<br />
3<br />
Before<br />
After<br />
6<br />
4<br />
5<br />
Time Spent on Domestic Water Collection at Zipwa/Aggregated<br />
Number of Minutes<br />
400<br />
350<br />
300<br />
250<br />
200<br />
150<br />
100<br />
50<br />
0<br />
1 3 5 7 9 11 13 15 17 19 21 23 25 27 29 31 33 35 37 39 41 43 45 47 49 51 53 55 57 59 61 63<br />
Household Number (n=64)<br />
Before<br />
After<br />
Source: Burns and Suji 2007<br />
41
Assessing Utilization and Expenditure<br />
The utilization of project asset transfers can often tell us a great deal about project benefits<br />
and looking at utilization can be a good way of measuring impact for a variety of<br />
interventions.<br />
FIGURE4.6SCORINGUTILIZATIONOFMILK<br />
Thesechartsshowthe<br />
resultsofaproportional<br />
pilingexercisewhichwas<br />
doneduringthe<br />
assessmentofare<br />
stockingprojectinNiger.<br />
Oneoftheproject<br />
benefitsidentifiedby<br />
participantswasan<br />
increaseinmilk<br />
production.Participants<br />
identifiedthreedifferent<br />
waysinwhichthemilk<br />
wasbeingutilized.They<br />
werethenaskedto<br />
distributetencounters<br />
amongstthethree<br />
categoriestoillustrate<br />
whatportionofthemilk<br />
wasutilizedineachway.<br />
Thewaysinwhichthe<br />
milkisbeingutilized<br />
impliesanutritional<br />
benefit(consumed),an<br />
incomebenefit(sold)<br />
andasocialbenefit<br />
(givenaway).<br />
Theseareallproject<br />
impacts.<br />
Source: Burns et al 2008<br />
MilkUtilizationfromRestocking<br />
FadamaVillage<br />
GivenAway<br />
20%<br />
Sold<br />
30%<br />
Consumed<br />
50%<br />
MilkUtilizationfromRestocking<br />
MarafaVillage<br />
GivenAway<br />
30%<br />
Sold<br />
30%<br />
Consumed<br />
40%<br />
42
The following example is from an impact assessment of a drought mitigation de-stocking intervention<br />
which was carried out in a pastoralist region of Ethiopia. The results are derived from the systematic<br />
application of a scoring exercise, and show the utilization of income derived from the de-stocking<br />
across 114 participating households.<br />
<br />
FIGURE4.7:SCORINGINCOMEUTILIZATION<br />
<br />
Proportion (%) use of income derived from a commercial de-stocking (n=114)<br />
Mean proportion (%) of expenditure (95% confidence interval)<br />
35<br />
30<br />
25<br />
20<br />
15<br />
10<br />
5<br />
27.7<br />
11.7<br />
8.8<br />
1.9<br />
3.2<br />
6.6<br />
18.8<br />
5.3<br />
6<br />
5.3<br />
4.3<br />
0<br />
buy food<br />
for<br />
people<br />
transport<br />
livestock<br />
buy<br />
human<br />
medicine<br />
pay off<br />
debts<br />
support<br />
relatives<br />
savings<br />
Type of expenditure<br />
buy<br />
animal<br />
feed<br />
school<br />
expenses<br />
buy<br />
veterinary<br />
care<br />
buy<br />
clothes<br />
others<br />
<br />
Source: Abebe et al 2008<br />
<br />
The results show that a considerable portion of the income was spent on human and animal food, and<br />
transporting livestock. Effectively the income earned from this de-stocking intervention allowed people to<br />
purchase animal feed and transport some of their remaining livestock to better grazing areas. The income<br />
also allowed them to purchase food for human consumption offsetting the food from livestock production<br />
that would have been lost during the drought. Expenditures on feed and livestock transport helped preserve<br />
people’s livestock asset base, protecting their livelihoods and helping them recover from the drought.<br />
Remembertofieldtestyourmethodswithcommunitymembersbeforetheassessment–most<br />
methodslookeasyonpaperbutrequirefinetuningonceyoustarttousetheminthefield.<br />
43
STAGE FIVE:<br />
SAMPLING<br />
Your sample size and method will ultimately be determined by the time and resources you have<br />
available for the assessment, and decisions and choices will have to be made depending on what<br />
level of representation and evidence you hope to achieve.<br />
Broadly speaking, there are three types of sampling method which can be used for a participatory<br />
impact assessment:<br />
1. Convenience Sampling (go to easily accessible villages)<br />
2. Purposive Sampling (go to villages “typical” of the project area)<br />
3. Random sampling (put all the names of the project villages in a hat and pick out the number<br />
you plan to assess)<br />
Although random sampling is considered to be the most scientific, and convenience sampling the<br />
least, each method has its strengths and weaknesses. For example, convenience sampling may save<br />
time, but all the selected villages being easily accessible may not be representative of the greater<br />
project area (road side bias). Alternatively random sampling may give more truthful results, but it<br />
can be costly and time consuming. With purposive sampling, there may be a tendency to go to<br />
villages where you think your project worked well, and where the results will show an impact that is<br />
not representative of other villages in the project area. One way of minimizing this tendency is to<br />
deliberately select equal numbers of good, bad and medium villages.<br />
Although, there is no right or wrong answer on sampling method, you do need to consider the end<br />
users of the assessment findings. If you wish to influence policy, or publish the findings in an<br />
academic journal, then it is important to use random sampling if you want the results to be accepted.<br />
If the results are for internal use only, then random sampling is probably not necessary. Although it<br />
is not essential to use a random sample, and it is often not practical, if you wish to extrapolate the<br />
results to make decisions that will apply to the entire project area, you need to use a random sample.<br />
For example, if you implement a project in 50 villages, and you plan on assessing only 10 villages,<br />
you would have to randomly select the 10 villages. The only other option would be to asses all 50<br />
villages. If on the other hand you decided to purposively select 10 villages, there is nothing wrong<br />
with this but the results would only be applicable to the villages assessed and could not be<br />
extrapolated to the other 40 project villages.<br />
Similarly there is no correct answer on the actual sample size. For most project impact assessments,<br />
the important thing is to capture the overall trend, and this can usually be done with a smaller sample<br />
size. As long as it is done systematically it can be representative. Nevertheless, there are a number of<br />
factors that need to be taken into consideration. Your sample size will depend on the type and<br />
number of questions you are trying to answer, and the number and type of assessment tools and<br />
attribution methods needed to answer these questions (see next section). For example, if you decide<br />
to use control groups for attribution, you may be able to get a greater level of evidence with a<br />
smaller sample, even though a control group immediately doubles the size of your sampling frame.<br />
Again some tools, such as “pair-wise” and “matrix” ranking are extremely time consuming, and will<br />
be more suitable for focus group discussions. To use these tools for household interviews would<br />
imply reducing your sample size considerably.<br />
44
You may also need to stratify your sample in order to capture the views of different groups within<br />
a project area. When thinking about stratification it is important to refer back to the key questions<br />
(Stage One) and only stratify in relation to those questions. For example, if a key question states<br />
that the assessment should examine whether impact varied by gender then both men and women<br />
should be sampled i.e. stratification by gender. Conversely, if no gender aspect is stated in the key<br />
questions there is no need to stratify by gender. Similarly, key questions may ask whether impact<br />
varied by wealth group and again, only stratify by wealth if you wish to answer this type of<br />
question. These are important considerations because each layer of stratification can have<br />
implications in terms of increased time, cost and analytical complexity. Similarly, if a project<br />
involves different activities, involving different people, you will need an independent sample for<br />
each activity to be assessed.<br />
FIGURE5.1:EVIDENCEHIERARCHY<br />
A hierarchy of evidence for the assessment of emergency livestock projects<br />
Blind randomised case control trials<br />
Evidence ++++++<br />
Use -<br />
A preferred option for some clinical research<br />
trials; can be blind or double-blind. Provides<br />
strong evidence of cause and effect<br />
(attribution) but very rarely used in the<br />
assessment of development or relief projects<br />
Randomised case control trials<br />
Evidence +++++<br />
Use +<br />
Randomised survey<br />
Evidence +++<br />
Use +<br />
Selected interviews<br />
Evidence +<br />
Use +++<br />
A common approach used in epidemiological<br />
studies; provides strong evidence of cause and<br />
effect (attribution). Rarely used for the<br />
assessment of relief or development projects,<br />
except for some human health and disease<br />
control projects<br />
Can produce useful descriptive information, but<br />
usually provides limited evidence of cause and<br />
effect.<br />
Often used in the assessment of development<br />
or relief projects. Involves interviews with<br />
purposively or conveniently selected people,<br />
including project beneficiaries. The case study<br />
material used by some NGOs can fall into this<br />
category, with best-case examples often used.<br />
E<br />
V<br />
I<br />
D<br />
E<br />
N<br />
C<br />
E<br />
Anecdote<br />
Evidence –<br />
Use +++<br />
Ad hoc informal pieces of information and<br />
stories which are not collected in any<br />
systematic way. Sometimes direct quotations<br />
in reports are anecdotal.<br />
On the hierarchy of evidence diagram developed for emergency livestock projects (figure 5.1),<br />
most PIAs should aim to fall in between the second and third highest levels in terms of<br />
evidence. The highest level on the scale would not apply to a PIA, as a blind approach could<br />
not be reconciled with the principle of participation. The second highest level can and has<br />
45
een used for PIA, although it tends to be less participatory, and in a humanitarian context, the<br />
practical and ethical implications of using a control group would generally exclude this option<br />
(see next section). Table 5.1 shows some sampling options that have been used to carry out<br />
PIAs. Mostly these have used purposive sampling, although in some cases random sampling<br />
has been used for village selection, participant selection, or both.<br />
Table 5.1: Sampling options for impact assessment<br />
Type of<br />
sampling<br />
Random<br />
(probability<br />
sampling)<br />
Purposive<br />
(nonprobability<br />
sampling)<br />
Convenience<br />
(nonprobability<br />
sampling)<br />
Description<br />
Based on the principle that any location or informant has an equal<br />
chance of being selected relative to any other location or informant<br />
Generally viewed as the most representative type of sampling and<br />
therefore, the most rigorous<br />
Allows results from the sample to be extrapolated to the wider<br />
project area<br />
Can be used in humanitarian contexts when lists of targeted<br />
households are available, and when all selected locations or<br />
households are accessible<br />
Sample size(s) are determined using mathematical formulae which<br />
include the level of statistical confidence (error) required and<br />
estimates of the amount of change expected in the population in<br />
question<br />
Tends to be less participatory than other approaches<br />
Randomization can miss key informants i.e. individuals who have<br />
particular knowledge about an area or project<br />
Uses the judgment of community representatives, project staff or<br />
the assessors to select representative locations and/or informants<br />
Useful if no sampling frame is available<br />
Results cannot be extrapolated to a wider area<br />
Moderately rigorous if conducted well, and clear criteria for<br />
sampling are described and followed<br />
Can include a comparison of impacts in areas judged to be ‘weak’,<br />
‘moderate’ or ‘strong’ in terms of implementation<br />
Can be participatory if community members are involved in<br />
selection of assessment sites and informants<br />
Subject to bias, particularly towards more successful project areas<br />
or households<br />
Easily accessible locations or informants are sampled<br />
The least rigorous sampling option and unlikely to be<br />
representative, particularly in larger projects<br />
Commonly used, especially during wet season with poor road<br />
access, or in insecure areas<br />
Examples of assessments<br />
using this approach fully, or<br />
in part<br />
Commercial de-stocking,<br />
Ethiopia (Abebe et al,<br />
2008)<br />
Restocking, Kenya<br />
(Lotira, 2004)<br />
Gokwe Recovery Action,<br />
Zimbabwe (Burns &<br />
Suji, 2007)<br />
Chical Recovery Action,<br />
Niger, (Burns & Suji,<br />
2007)<br />
Pastoralist Survival and<br />
Recovery, Niger, (Burns<br />
et al, 2008)<br />
Veterinary services,<br />
Ethiopia (Admassu et al.,<br />
2005 )<br />
Feed supplementation<br />
(Bekele and Abera,<br />
2008)<br />
Various – this type of<br />
sampling is commonly used<br />
in assessments<br />
46
Getting numerical data from participatory tools<br />
Directly related to the issue of representativeness and sampling is the systematic application of the<br />
participatory impact assessment tools. A fundamental principle of the PIA approach proposed here is<br />
that the same tool be applied consistently, using the same indicators, the same number of counters, and<br />
framing the questions in exactly the same way. One weakness of participatory methods is that people<br />
often only do it once. If consistently applied, even a limited set of results can show agreement or not, as<br />
few as 10-15 repetitions may be enough to get reliability. Needless to say, the more repetitions, or the<br />
larger the sample size, the more statistically reliable the results will be.<br />
It is also this process of standardizing and repeating the participatory exercises in a systematic way<br />
that enables us to derive representative results from qualitative participatory tools. Even though the<br />
data may be subjective, it is systematic and therefore scientifically rigorous.<br />
Developyourmethods,standardizeandrepeat<br />
FIGURE5.2:RELIABILITYANDREPETITIONEXAMPLE<br />
“Before” and “After” Scoring to Show Changes in the Prevalence of Disease X in Cattle<br />
1 Repetition 3 Repetitions 6 Repetitions 10 Repetitions<br />
Before After Before After Before After Before After<br />
10 4 10 4 10 4 10 4<br />
10 6 10 6 10 6<br />
10 5 10 5 10 5<br />
10 4 10 4<br />
10 7 10 7<br />
10 4 10 4<br />
10 5<br />
10 7<br />
10 8<br />
10 6<br />
Thereliabilityofthe<br />
resultsimproveswith<br />
thenumberof<br />
repetitions.<br />
Standardizeyour<br />
methods,andrepeat<br />
theexerciseoverand<br />
overagaintoimprove<br />
confidence<br />
47
STAGE SIX:<br />
ASSESSING PROJECT ATTRIBUTION<br />
In any community or area where a project is implemented, changes will take place over time. Some<br />
of these changes may have nothing to do with the project and would have happened regardless of<br />
whether or not the project ever existed. Other changes occur as a result of the project, and these<br />
changes can be attributed to the project.<br />
The assessment of attribution is an important aspect of project assessment that is often overlooked.<br />
For example, an organization implements an agricultural recovery project in a food insecure area<br />
affected by periodic drought and conflict. After a period of time a survey is carried out and the<br />
results show improvements in the food security and nutritional status of the participating<br />
community. The assessment concludes that the project was a success. Is this a correct assumption,<br />
or might other factors such as rainfall, seasonality, or security have been more important in<br />
influencing food security and nutrition outcomes? The objective of assessing attribution is to isolate<br />
and contextualize the impact of the project from non-project factors.<br />
FIGURE6.1:EXAMPLEOFATTRIBUTIONFACTORS<br />
Before<br />
Now<br />
ProjectFactors NonProjectFactors<br />
ImprovedSeeds ImprovedRainfall<br />
ProvisionofTools ImprovedSecurity<br />
ProvisionofFertilizer ImprovedGovernmentExtensionServices<br />
There are two main approaches for assessing project attribution:<br />
<br />
1. Withinaprojectarea,assesstherelativeimportanceofprojectandnonprojectfactors.<br />
<br />
2. Comparisonbetweenprojectandnonprojectpopulationswithintheprojectarea.<br />
The first approach aims to understand all the project and non-project factors which contributed to<br />
changes in the impact indicators identified. These factors should be listed. It also aims to<br />
understand the relative importance of these project and non-project factors. Methods such as simple<br />
ranking and scoring, or causal diagrams with scoring of causes can be used to measure the relative<br />
impact of both project and non-project factors.<br />
48
The second approach to attribution is the classic scientific approach and involves the use of control<br />
populations or groups. In this approach, the ‘treatment’ or ‘intervention’ populations are compared<br />
with control populations to determine statistical differences between the two groups, the assumption<br />
being that the control group has the same characteristics as the intervention population. The use of<br />
controls in participatory impact assessment might include the following:<br />
1. A comparison of areas where the project intervention took place against an area where<br />
there was no intervention.<br />
2. A comparison of project and non project participants within the same community.<br />
3. A comparison of different interventions in the same area.<br />
Although a good control can address the problem of attribution, there are a number of practical and<br />
ethical issues involved in using control groups, particularly in the context of a humanitarian<br />
intervention. Finding two population groups that share the same characteristics can be a challenge,<br />
and there is a high probability that the control population receives similar interventions from<br />
another agency during the same time period. The use of control groups may also imply doubling or<br />
more than doubling the time and resources needed for the assessment. From an ethical perspective,<br />
by definition, the use of a control or ‘non-project’ population means that decisions are made to<br />
exclude a population from an intervention which raises concerns in a humanitarian context. These<br />
concerns would also apply to a staggered control whereby the control group will be assisted during<br />
a second phase of an intervention, as there is also a temporal dimension to targeting exclusion. The<br />
decision to use or not to use a control group will ultimately have to be determined by weighing<br />
these practical and ethical considerations.<br />
Table 6.1 provides a summary of some practical and ethical concerns of using control groups<br />
identified by participants during a participatory impact assessment workshop in Addis Ababa in<br />
2006. The workshop was held as part of a Bill & Melinda Gates funded impact assessment initiative<br />
involving six international NGOs. The workshop participants included project staff, program<br />
managers and country representatives of the participating NGOs.<br />
Table 6.1 Some practical and ethical concerns with using control groups<br />
Identificationofacontrolpopulationwithsimilarcharacteristics<br />
Willingnessofcomparativegrouptoparticipateopenlyandhonestly– ifincentivesaregivenforparticipation,is<br />
thisreallyatruecontrolgroup?<br />
Howcanyoubesurethatthecontrolgroupwillnotreceiveassistancefromanothersource?<br />
PotentialsecurityrisktoNGOstaffforexcludingthecontrolgroupfromtheproject<br />
Ifacontrolgroupisselectedfromnonprojectparticipantsinthesamecommunity,howcanyoubesurethat<br />
theydonotindirectlybenefitfromtheproject?<br />
Increasedcostandtimeofincludingacontrolgroup,staff,vehicles*<br />
Exclusionofonecommunitygoesagainstthehumanitarianimperativeandtheprinciplesofparticipation<br />
It’sunethicaltousehumanplacebosinahumanitariancontext– goodresearchprotocolshouldnottake<br />
precedenceovertheprovisionofassistance<br />
Theuseofacontrolgroupisdisrespectfulofpeople’stime<br />
Raisingexpectationsofthecontrolgroup–willtheinformationbereliable?<br />
Theextraresourcesrequiredtoincludeacontrolgroupshouldbeusedtoassisttheexcludedcommunity*<br />
Usingcontrolscouldpotentiallycreatetensionsorevenfuelconflictbetweenrecipientandnonrecipient<br />
communities<br />
*Thisconcernmaybepartlyoffsetbythefactthatagoodcontrolmaymeanthatyougetthesameoragreater<br />
levelofevidencefromasmallersample<br />
49
Assessing Project and Non Project Factors<br />
Due to these practical and ethical concerns, most impact assessments of humanitarian projects will use<br />
the first approach to assessing attribution by comparing the relative importance of project and non<br />
project factors. This can be done by prioritizing, ranking, or scoring the different factors that<br />
contributed to any positive or negative changes that took place in the project area.<br />
Figure 6.2 shows (fictitious) results of a scoring exercise to assess changes in food security following<br />
an agricultural recovery project in a post conflict setting. The results show a positive change in food<br />
security status, and the participants have listed the key reasons effecting this change.<br />
FIGURE6.2HYPOTHETICALEXAMPLEOFRESULTSFROMANIMPACTSCORINGEXERCISE<br />
20<br />
18<br />
16<br />
14<br />
12<br />
10<br />
8<br />
6<br />
4<br />
2<br />
0<br />
ChangesinFoodSecurityStatus<br />
Before<br />
Now<br />
Reasons<br />
<br />
ProjectFactors<br />
ImprovedSeeds<br />
ProvisionofTools<br />
ProvisionofFertilizer<br />
<br />
NonProjectFactors<br />
ImprovedRainfall<br />
ImprovedSecurity<br />
GovernmentExtension<br />
Services(resumed)<br />
One way of attributing impact to the project activities would be to ask the participants to rank or<br />
score the different contributing factors in order of importance. The results may look something<br />
like this:<br />
Table 6.2 Attribution by Simple Ranking/Scoring<br />
Factor Rank Score<br />
ImprovedRainfall 1 st 33<br />
ImprovedSecurity 2 nd 26<br />
ImprovedSeeds 3 rd 19<br />
GovernmentExtensionServices 4 th 12<br />
ProvisionofFertilizer 5 th 8<br />
ProvisionofTools 6 th 2<br />
The results show that the two most important factors contributing towards an improvement in food<br />
security in fact had nothing to do with the project. However, they also show that the project had a<br />
considerable impact in contributing towards an overall improvement in Food Security. From the<br />
scoring exercise you might assign the project related factors a 29% relative contribution towards<br />
improved food security.<br />
50
Ranking as an Attribution Method<br />
<br />
Example:<br />
<br />
<br />
<br />
<br />
A PIA of an animal health project visits 10/30 locations with a project animal health<br />
worker<br />
Scoring in each location indicates improved animal health during the project period<br />
Simple ranking was used to understand the factors contributing to this change<br />
<br />
Factor<br />
Table 6.3 Ranking of project and non project factors – animal health project<br />
<br />
Increaseusageofmodernveterinarydrugsduetoattitudinalchangeofthe<br />
communityformodernveterinarymedicine<br />
<br />
BiannualvaccinationforcommunicablediseasebyCommunityAnimalHealth<br />
Workers<br />
<br />
Goodrainandbetteravailabilityofpasture(during2002)<br />
<br />
Reducedherdmobilityandherdmixingduetoincreasingsettlement<br />
<br />
<br />
Median<br />
Rank<br />
<br />
N=10informantgroups;therewasahighlevelofagreementbetweenthegroups(W=0.75;p
Another way of attributing impact to project related factors is by asking people to list all the factors<br />
that contributed to a particular impact and record each response. Every time the same reason is<br />
repeated put a check or a cross next to it. At the end of the assessment tally the number of times each<br />
factor was mentioned. The assumption here is that the most frequently mentioned factors hold a<br />
greater weight or importance than those less frequently mentioned. This method is a convenient way<br />
of quickly attributing impact when using a fairly large sample. Also, by not pre-defining the<br />
factors/indicators contributing to impact, in theory you should not influence people’s response. On<br />
the other hand, participants will be well aware that you are assessing the impact of a given project and<br />
may fail to mention other important (non-project) factors without being prompted.<br />
Table 6.4 Example of an Attribution Tally Form<br />
<strong>Impact</strong> <strong>Assessment</strong> Form – Attribution Tally Table<br />
© Kadede, 2007<br />
List Reasons Frequency Tally<br />
1 Improved Seeds 12<br />
2 Provision of 2<br />
Tools<br />
4 Provision of 4<br />
Fertilizer<br />
5 Improved<br />
21<br />
Rainfall<br />
6 Improved<br />
16<br />
Security<br />
7 Extension 9<br />
Services<br />
8<br />
9<br />
Table 6.5 shows the results from an impact assessment of a drought response project in Niger.<br />
The five most frequently mentioned factors contributing to improved food security were<br />
directly related to the project.<br />
Table 6.5 Reasons given for improvements in household food security<br />
Factors<br />
Number of<br />
Responses<br />
(n=74)<br />
Cereal Banks (available and affordable food supply) 68<br />
Better Farm Inputs (seeds and fertilizers, and fast maturing millet) 59<br />
More Income to Purchase Food (from Cereal Bank savings, micro credit and vegetable sales) 50<br />
Restocking (income from sales and milk from livestock) 46<br />
Vegetable Production (more diverse foods, less dependency on millet) 38<br />
Food Aid 10<br />
Decrease in Crop Infestations and Pests 8<br />
Improved Rainfall 5<br />
Data was derived using semi-structured interviews following the before and after scoring exercise on food sources. Some people gave<br />
more than one response others gave none. (Total number of responses = 284) – (Source: Burns and Suji, 2007)<br />
52
Matrix scoring as an attribution method<br />
Matrix scoring is another useful<br />
way of comparing project and<br />
non project factors. The<br />
photograph and corresponding<br />
table below illustrate how matrix<br />
scoring was used during a PIA of<br />
a community based animal health<br />
project. The exercise was used to<br />
compare different service<br />
providers including Community<br />
Animal Health Workers (CAHW)<br />
against different indicators of<br />
service provision. These included<br />
indicators such as convenience,<br />
reliability, affordability,<br />
effectiveness, and trust.<br />
22<br />
FIGURE6.3USINGMATRIXSCORINGTOCOMPARESERVICEPROVISION<br />
23<br />
Source: Admassu et al, 2005<br />
53
Figure 6.4 shows the use of matrix scoring in impact assessment: comparison of livestock and<br />
other interventions during a drought in southern Ethiopia (from Abebe et al., 2008)<br />
FIGURE6.4MATRIXSCORINGCOMPARINGDIFFERENTDROUGHTINTERVENTIONS<br />
Mean scores (95% CI) for interventions<br />
Indicators<br />
Commercial<br />
de-stocking<br />
Veterinary<br />
support<br />
Animal<br />
feed<br />
Food<br />
aid<br />
Water<br />
supply<br />
Labor<br />
(Safety net)<br />
Credit<br />
Others<br />
“Helps us to cope<br />
with the effect of<br />
drought”<br />
“Helps fast recovery<br />
and rebuilding<br />
herd”<br />
“Helps the livestock<br />
to survive”<br />
“Saves human life<br />
better”<br />
“Benefits the poor<br />
most”<br />
“Socially and<br />
culturally<br />
accepted”<br />
“Timely and<br />
available”<br />
<br />
<br />
<br />
<br />
<br />
<br />
<br />
<br />
<br />
<br />
<br />
<br />
<br />
9.1 (8.5, 9.7) 3.5 (3.2, 3.9) 5.7 (5.1, 6.2) 6.9 (6.5, 7.4) 3.0 (2.4, 3.6) 0.8 (0.5, 1.1) 0.5 (0.2, 0.8) 0.4 (0.2, 0.7)<br />
<br />
<br />
<br />
<br />
<br />
<br />
<br />
<br />
<br />
<br />
11.1 (10.5,11.7) 4.4 (3.9, 4.9) 5.7 (5.0, 6.3) 4.9 (4.4, 5.6) 1.9 (1.5, 2.4) 0.9 (0.5, 1.4) 0.6 (0.1, 1.1) 0.4 (0.1, 0.7)<br />
<br />
<br />
<br />
<br />
<br />
<br />
<br />
<br />
<br />
10.3 (9.5, 11.2) 4.9 (4.4, 5.4) 8.9 (8.1, 9.7) 2.3 (1.8, 2.8) 2.8 (2.2, 3.5) 0.2 (0.1, 0.4) 0.3 (0.1, 0.6) 0.2 (0.0, 0.4)<br />
<br />
<br />
<br />
<br />
<br />
<br />
<br />
<br />
<br />
<br />
<br />
<br />
<br />
9.8 (8.9, 10.6) 2.4 (1.9, 2.8) 3.7 (3.1, 4.3) 8.8 (8.1, 9.6) 3.6 (2.9, 4.3) 0.9 (0.5, 1.3) 0.5 (0.2, 0.9) 0.3 (0.1, 0.5)<br />
<br />
<br />
<br />
<br />
<br />
<br />
<br />
<br />
<br />
<br />
<br />
<br />
<br />
7.6 (6.7, 8.6) 1.9 (1.6, 2.3) 3.2 (2.5, 3.8) 11.0 (10.1,11.9) 3.7 (2.8, 4.3) 1.6 (0.9, 2.2) 0.7 (0.3, 1.1) 0.5 (0.1, 0.8)<br />
<br />
<br />
<br />
<br />
<br />
<br />
<br />
<br />
<br />
<br />
<br />
<br />
11.5 (10.6,12.4) 5.1 (4.7, 5.6) 5.8 (5.1, 6.4) 3.4 (2.8, 3.9) 2.6 (2.1, 3.2) 0.9 (0.5, 1.4) 0.3 (0.1, 0.5) 0.3 (0.1, 0.5)<br />
<br />
<br />
<br />
<br />
<br />
<br />
<br />
<br />
<br />
<br />
<br />
<br />
8.4 (7.8, 9.0) 3.3 (2.9, 3.7) 4.3 (3.9, 4.6) 8.5 (7.9, 9.1) 3.5 (2.8, 4.1) 1.2 (0.7, 1.7) 0.5 (0.2, 0.8) 0.3 (0.1, 0.5)<br />
<br />
<br />
<br />
<br />
<br />
Overall<br />
preference<br />
<br />
<br />
<br />
<br />
<br />
<br />
<br />
<br />
<br />
10.6 (9.9, 11.2) 4.2 (3.8, 4.6) 6.2 (5.5, 6.9) 4.7 (4.1, 5.2) 2.6 (2.1, 3.2) 1.0 (0.5, 1.5) 0.4 (0.1, 0.6) 0.3 (0.1, 0.6)<br />
n = 114 households; results derived from matrix scoring of each indicator using 30 stones; mean scores (95% CI)<br />
are shown in each cell. The black dots represent the stones used during the matrix scoring.<br />
<br />
<br />
<br />
54
Using simple controls to assess attribution<br />
Sometimes it is possible to use a control that allows for comparisons between an intervention and<br />
non-intervention group without the ethical concerns that typically apply with regards to control<br />
groups in a humanitarian context. The example below shows how a simple control was used in<br />
scoring disease amongst livestock handled by community animal health workers (CAHW) and<br />
livestock that were not.<br />
FIGURE6.5CAMELDISEASEIMPACTSCORING<br />
Source: Admassu et al 2005<br />
A similar type of control was used below to compare mortality rates in livestock that received<br />
supplementary feed with those that did not during a recent drought in Ethiopia (Bekele, 2008):<br />
Table 6.6 Comparison of livestock mortality rates (Source: Bekele, 2008)<br />
Location/Group<br />
Bulbularea–affectedbymoderatedrought Programmestartedon15 th March2008<br />
<br />
Unfedcattlemovedtograzingareas<br />
CowsfedusingSCUSfeed<br />
Cowsfedusingprivatefeed<br />
Webarea–affectedbyseveredrought Programmestarted9 th February2008<br />
<br />
Unfedcattlemovedtograzingareas<br />
CowsfedusingSCUSfeed<br />
Cowsfedusingprivatefeed<br />
Mortality<br />
<br />
<br />
108/425(25.4%)<br />
13/161(8.1%)<br />
56/151(37.1%)<br />
<br />
<br />
139/407(34.2%)<br />
49/231(21.2%)<br />
142/419(33.8%)<br />
<br />
55
Comparisons in the number of months of food security were also done between project and<br />
non-project participants attending a focus group discussion during assessments in Zimbabwe<br />
(Figure 6.6). In situations where non project participants attend focus groups, and are willing<br />
to provide comparisons there is a possibility of using them as a spontaneous control group.<br />
However, the fact that they were excluded from the intervention raises questions about their<br />
comparability.<br />
FIGURE6.6COMPARISONSBETWEENPROJECTANDNONPROJECTPARTICIPANTS<br />
Duration of HH Food Security Nemangwe (n=8)<br />
Mean Score<br />
14<br />
12<br />
10<br />
8<br />
6<br />
4<br />
2<br />
0<br />
Apr May Jun Jul Aug Sept Oct Nov Dec Jan Feb Mar<br />
2004-2005 2006/07 Project Participants<br />
2006/07 Non-Participants<br />
The data was collected using twenty five counters which were used to represent a households’ post harvest cereal balance. The counters were<br />
then distributed along a calendar to indicate utilization up until depletion. The data was collected during focus group discussions, and the<br />
distribution of the counters was agreed upon by consensus of participants from each group. (Source: Burns and Suji 2007)<br />
Although some of the attributions methods described are certainly more rigorous than others,<br />
they may require greater time and resources, and may not be practical. As with sampling, the<br />
type of attribution method used will be a judgment call in trying to balance scientific rigor<br />
with the practical realities of carrying out assessments in a challenging context. The important<br />
thing to remember is that whichever method you decide to use, it will be better than not trying<br />
to attribute impact at all.<br />
56
STAGE SEVEN:<br />
TRIANGULATION<br />
Triangulation is a crucial stage of the assessment, and involves the use of other sources of<br />
information to cross-check the results from the participatory exercises. A key source for triangulation<br />
is secondary data, which may include previous studies and reports, and external surveys done by the<br />
government, other organizations or research institutes may also provide useful data for triangulation.<br />
However, for most projects the key source of secondary information is the project’s own process and<br />
implementation monitoring (M&E) data.<br />
For example, if the results of the impact assessment show that there has been a reduction in disease<br />
patterns.<br />
<br />
<br />
Did the project actually provide the specific types of drugs or vaccines to treat or prevent the<br />
disease in question?<br />
Did the project provide sufficient quantities of drugs or vaccine which might account for these<br />
changes?<br />
This information should be available from the projects process monitoring reports.<br />
If any of the diseases in question are part of an official disease control program, is there additional<br />
information available from these programs, such as disease surveillance data?<br />
Another way to triangulate or validate your data is to use different participatory methods to measure<br />
the same indicator, and then compare the results. If the results are similar then they are more likely to<br />
be accurate. Alternatively, you can look for trends and patterns from the results of different exercises.<br />
For example, if you were to do a before and after scoring of food sources, income and expenditure,<br />
the results from the first exercise may show an increase in cereal production, the second may show an<br />
increase in the proportion of household income from the sale of millet, and the expenditure exercise<br />
may show a relative reduction in the amount of household income spent on millet purchases. As long<br />
as you have asked the participants to explain these changes, and the responses support the results of<br />
the participatory exercises, you can be fairly confident that the results from all three exercises are<br />
consistent with each other. Direct observation can also be used to triangulate data. The following<br />
photos from an impact assessment report show before and after photos of a project garden site<br />
illustrating changes in crop production.<br />
©Burns, 2007 ©Burns, 2007<br />
57
FIGURE7.1TRIANGULATINGDIFFERENTSOURCESOFINFORMATION<br />
STAGE EIGHT: FEEDBACK AND VALIDATION<br />
This is the final stage of the assessment and involves the presentation of the findings back to<br />
the community. If a local partner such as a Community Based Organization (CBO) is involved<br />
in the project, they should receive a copy of the results, and later the final report. This stage is<br />
the final opportunity for the community and project participants to verify that the results are<br />
correct. If there is to be a second phase of the project, or if the same project activities are to be<br />
implemented in another community, a “feedback” workshop can be held. This is a good<br />
opportunity to plan further work to improve the project. Alternatively a number of focus<br />
group exercises can be carried out with the objective of sharing the results with the<br />
participating communities.<br />
58
WHEN TO DO AN IMPACT ASSESSMENT<br />
The timing of an impact assessment will invariably have implications on the results, and an<br />
important question to ask is when to carry out an impact exercise. Many livelihoods projects have a<br />
delayed impact, and in a humanitarian context, where funding and project cycles are typically short,<br />
the project will end before the true impact of a project has been realized. Certain interventions will<br />
have a more or less immediate impact. For example, loans from village savings groups may be<br />
immediately invested in income generating activities, which turn an immediate profit which is then<br />
utilized on livelihoods investments. Similarly cash from a de-stocking intervention may be invested<br />
in food, fodder and veterinary drugs in a very short period of time. In contrast, most agricultural<br />
interventions will require at least one crop cycle to achieve any impact, and training projects may<br />
take even longer. In some cases, project participants may have expectations of the project that will<br />
take years to realize. For example, participants in a sheep re-stocking project in Niger hoped to<br />
eventually save enough income from the sale of the offspring of the project sheep to purchase a<br />
young cow, with the expectation that this cow would start producing milk, which could be fed to<br />
their children, and the surplus sold for cash which would be re-invested in more cattle. The<br />
participants suggested that a good long term indicator of project impact would be an increase in<br />
cattle ownership. However, the actual impact assessment took place long before any of the<br />
participants had saved up enough money to purchase a cow, and so an increase in cattle ownership<br />
would have been a meaningless indicator of impact. Alternatively the participants proposed that the<br />
number of ewes born from the project sheep should be used as a proxy indicator of project impact.<br />
In cases such as these, it is best to use short term, or proxy indicators of impact. As long as these are<br />
identified by project participants, they can still be considered as community-identified indicators.<br />
Similarly, some interventions will continue to have an impact for a long period of time, whereas the<br />
impact from other projects is only designed to have a short term life saving impact. This needs to be<br />
considered when designing an assessment, and when interpreting the results.<br />
It is useful to ask project participants when is the best time to do an assessment, and try to do it<br />
during the time period they suggest. Although this may not always be practical, community<br />
members will have the best idea as to when they expect the project to achieve an impact against the<br />
indicators they have identified. There are also times of the year that may be inappropriate to do an<br />
assessment as people are involved in cultural, religious or agricultural activities that will take<br />
priority, and community members can advise on what periods to avoid. Even if people do agree to<br />
participate in an assessment during busy periods, it is only natural that their responses will be<br />
rushed and this will compromise the quality of the results. In any case, from a purely ethical<br />
perspective carrying out assessments during busy periods should be avoided.<br />
59
REFERENCES<br />
Behnke et al. (2008). Evaluation of USAID Pastoral Development Projects in Ethiopia. Odessa Centre Ltd. and USAID<br />
Ethiopia, Addis Ababa.<br />
Bekele, G. and Abera, T. (2008). Livelihoods-based Drought Response in Ethiopia: <strong>Impact</strong> <strong>Assessment</strong> of Livestock<br />
Feed Supplementation. Feinstein International Center, Tufts University and Save the Children US, Addis Ababa<br />
Burns, J. and Suji, O. (2007). <strong>Impact</strong> <strong>Assessment</strong> of the Chical Integrated Recovery Action Project, Niger. Feinstein<br />
International Center, Medford<br />
Burns, J., Suji, O. and Reynolds, A. (2008). <strong>Impact</strong> <strong>Assessment</strong> of the Pastoralist Survival and Recovery Project,,<br />
Dakoro, Niger. Feinstein International Center, Medford<br />
Burns, J and Suji, O (2007), <strong>Impact</strong> <strong>Assessment</strong> of the Gokwe Integrated Recovery Action Project, Zimbabwe.<br />
Feinstein International Center, Medford<br />
Burns, J and Suji, O (2007), <strong>Impact</strong> <strong>Assessment</strong> of the Zimbabwe Dams, and Gardens Project. Feinstein International<br />
Center, Medford<br />
Burns, J (2007), Feinstein Center Field Testing Visit to Africare Project, Niger, March 2007<br />
Burns, J (2006), Feinstein International Center, Tufts University -Mid Term Visit to Lutheran World Relief Project,<br />
Niger.<br />
Catley, A. (1999). Monitoring and <strong>Impact</strong> <strong>Assessment</strong> of Community-based Animal Health Projects in Southern Sudan:<br />
Towards participatory approaches and methods. A report for Vétérinaires sans frontières Belgium and Vétérinaires sans<br />
frontières Switzerland. Vetwork UK, Musselburgh.<br />
Darcy, J (2005) Acts of Faith? Thoughts on the effectiveness of humanitarian action: A discussion paper prepared for<br />
the Social Science Research Council seminar series “The Transformation of Humanitarian Action”, New York 12th<br />
April 2005.<br />
Feinstein International Center, (2006) Tufts University, <strong>Participatory</strong> <strong>Impact</strong> <strong>Assessment</strong> Training Workshop, Aide<br />
Memoir, Addis Ababa, September 2006.<br />
Fritz Institute, (2007): (accessed on April 20 th 2007 from the Fritz Institute Website) available at<br />
http://www.fritzinstitute.org/prgHumanitarian<strong>Impact</strong>.htm<br />
Hofmann, C.A., Roberts, L., Shoham, J., Harvey, P: (2004), “Measuring the impact of humanitarian aid.” A review of<br />
current practice, HPG report 17, June 2004<br />
Catley, A. and Irungu, P. (2000). <strong>Participatory</strong> research on bovine trypanosomosis in Orma cattle, Tana River District,<br />
Kenya: Preliminary findings and identification of best-bet solutions. International Institute for Environment and<br />
Development, Kenya Trypanosomiasis Reseacrh Institute, Nairobi.<br />
http://www.participatoryepidemiology.info/Tana%20River%20research.pdf<br />
<strong>Participatory</strong> <strong>Impact</strong> <strong>Assessment</strong> Team (2002). <strong>Impact</strong> assessment of community-based animal health workers in<br />
Ethiopia; Initial experiences with participatory approaches and methods. Feinstein International Center, Addis Ababa<br />
Rifkin, S.B., Muller, F. and Bichmann, W. (1988). Primary healthcare: on measuring participation. Social Science and<br />
Medicine 26(9), 931-940<br />
Roche, C. (1999), <strong>Impact</strong> <strong>Assessment</strong> for Development Agencies- Learning to Value Change Oxford: Oxfam, Novib<br />
Watson, C. (2008), Literature Review of <strong>Impact</strong> Measurement in the Humanitarian Sector. Feinstein International<br />
Center, Medford<br />
60
Young, Dijkeme, Stoufer, Shrestha and Thapa, (1994), PRA Notes 20<br />
ANNEX 1:<br />
FURTHER READING<br />
ActionAid-Somaliland (1993). Programme Review by the Sanaag Community-based Organization. ActionAid, London<br />
Abebe, D. (2005). <strong>Participatory</strong> review and impact assessment of the community-based animal health workers system<br />
in pastoral and agropastoral areas of Somali and Oromia Regions. Save the Children USA, Addis Ababa<br />
Abebe, D., Cullis, A., Catley, A., Aklilu, Y., Mekonnen, G. and Ghebrechirstos, Y. (2008). Livelihoods impact and<br />
benefit-cost estimation of a commercial de-stocking relief intervention in Moyale district, southern Ethiopia. Disasters<br />
32/2 June 2008 (Online Early)<br />
Admassu, B., Nega, S., Haile, T., Abera, B., Hussein, A. and Catley, A. (2005). <strong>Impact</strong> assessment of a communitybased<br />
animal health project in Dollo Ado and Dollo Bay districts, southern Ethiopia. Tropical Animal Health and<br />
Production 37/1, 33-48<br />
Ashley, C. and K. Hussein (2000) Developing Methodologies for Livelihood <strong>Impact</strong> <strong>Assessment</strong>: Experience of the<br />
African Wildlife Foundation in East Africa Sustainable Livelihoods Working Paper 129, London: Overseas<br />
Development Institute<br />
Bayer, W. and Waters-Bayer, A. (2002). <strong>Participatory</strong> Monitoring and Evaluation with Pastoralists: a review of<br />
experiences and annotated bibliography. Deutsche Gesellschaft für Technische Zusammenarbeit (GTZ), Eschborn<br />
http://www.eldis.org/fulltext/PDFWatersmain.pdf<br />
Bekele, G. and Abera, T. (2008). Livelihoods-based Drought Response in Ethiopia: <strong>Impact</strong> <strong>Assessment</strong> of Livestock<br />
Feed Supplementation. Feinstein International Center, Tufts University and Save the Children US, Addis Ababa<br />
Burns, J. and Suji, O. (2007). <strong>Impact</strong> <strong>Assessment</strong> of the Chical Integrated Recovery Action Project, Niger. Feinstein<br />
International Center, Medford<br />
https://wikis.uit.tufts.edu/confluence/display/FIC/<strong>Impact</strong>+<strong>Assessment</strong>+of+the+Chical+Integrated+Recovery+Action+Pr<br />
oject%2C+Niger<br />
Burns, J., Suji, O. and Reynolds, A. (2008). <strong>Impact</strong> <strong>Assessment</strong> of the Pastoralist Survival and Recovery Project,,<br />
Dakoro, Niger. Feinstein International Center, Medford<br />
https://wikis.uit.tufts.edu/confluence/display/FIC/<strong>Impact</strong>+<strong>Assessment</strong>+of+the+Pastoralist+Survival+and+Recovery+Pr<br />
oject+Dakoro%2C+Niger<br />
Burns, J and Suji, O (2007), <strong>Impact</strong> <strong>Assessment</strong> of the Gokwe Integrated Recovery Action Project, Zimbabwe.<br />
Feinstein International Center, Medford<br />
https://wikis.uit.tufts.edu/confluence/display/FIC/<strong>Impact</strong>+<strong>Assessment</strong>+of+the+Gokwe+Integrated+Recovery+Action+P<br />
roject<br />
Burns, J and Suji, O (2007), <strong>Impact</strong> <strong>Assessment</strong> of the Zimbabwe Dams, and Gardens Project. Feinstein International<br />
Center, Medford https://wikis.uit.tufts.edu/confluence/download/attachments/14553652/Burns--<br />
<strong>Impact</strong>+<strong>Assessment</strong>+of+the+Zimbabwe+Dams+and+Gardens+Project.pdf?version=1<br />
Catley, A. (2005). <strong>Participatory</strong> Epidemiology: A Guide for Trainers. African Union/Interafrican Bureau for Animal<br />
Resources, Nairobi http://www.participatoryepidemiology.info/PE%20Guide%20electronic%20copy.pdf<br />
Catley, A. (1999). Monitoring and <strong>Impact</strong> <strong>Assessment</strong> of Community-based Animal Health Projects in Southern Sudan:<br />
Towards participatory approaches and methods. A report for Vétérinaires sans frontières Belgium and Vétérinaires sans<br />
61
frontières Switzerland. Vetwork UK, Musselburgh.<br />
http://www.participatoryepidemiology.info/Southern%20Sudan%20<strong>Impact</strong>%20<strong>Assessment</strong>.pdf<br />
CGAP (1997) <strong>Impact</strong> <strong>Assessment</strong> Methodologies: Report of a Virtual Meeting April 7-19, 1997 Highlights and<br />
Recommendations, and Discussion Paper [<strong>Impact</strong> <strong>Assessment</strong> Methodologies for Microfinance: A Review David<br />
Hulme, Institute for Development Policy and Management, University of Manchester] Consultative Group to Assist the<br />
Poorest (CGAP)<br />
Chambers R. (2007) Who Counts? The Quiet Revolution of Participation and Numbers Working Paper No. 296,<br />
Brighton: Institute of Development Studies<br />
Cromwell, E., P. Kambewa, R. Mwanza and R. Chirwa, with Kwera Development Centre (2001) <strong>Impact</strong> <strong>Assessment</strong><br />
Using <strong>Participatory</strong> Approaches: ‘Starter Pack’ and Sustainable Agriculture in Malawi Agricultural Research and<br />
Extension Network Paper No. 112. London: Overseas Development Institute<br />
Copestake, J. (date?) <strong>Impact</strong> <strong>Assessment</strong> of Microfinance and Organizational Learning: Who Will Survive? Journal of<br />
Microfinance Volume 2 Number 2<br />
Estrella, M. and J. Gaventa (no date) Who Counts Reality? <strong>Participatory</strong> Monitoring and Evaluation: A Literature<br />
Review Working Paper 70, Brighton: Institute for Development Studies<br />
Guijt, I. (1998) <strong>Participatory</strong> Monitoring and <strong>Impact</strong> <strong>Assessment</strong> of Sustainable Agriculture Initiatives: An Introduction<br />
to the Key Elements SARL Discussion Paper No. 1, July 1998. London: International Institute for Environment and<br />
Development<br />
Guijt, I., M Arevalo and K. Saladores (1998) <strong>Participatory</strong> Monitoring and Evaluation: Tracking change together PLA<br />
Notes 31:28-36, London: IIED<br />
Hofmann, C-A, L. Roberts, J. Shoham and P. Harvey (2004) Measuring the <strong>Impact</strong> of Humanitarian Aid: A Review of<br />
Current Practice Humanitarian Policy Group Research Report No. 17, London: Overseas Development Institute<br />
INTRAC (2001) NGOs and <strong>Impact</strong> <strong>Assessment</strong> NGO Policy Briefing Paper No. 3. Oxford: INTRAC<br />
INTRAC (1999) Evaluating <strong>Impact</strong>: The Search for Appropriate Methods and Instruments Ontrac No. 12<br />
Mayoux, L. (no date) Intra-household <strong>Impact</strong> <strong>Assessment</strong>: Issues and <strong>Participatory</strong> Tools Consultant for WISE<br />
Development Ltd<br />
Kumar, S. (2002) Methods for Community Participation, A Complete Guide for Practitioners. London: ITDG<br />
Publishing<br />
<strong>Participatory</strong> <strong>Impact</strong> <strong>Assessment</strong> Team (2002). <strong>Impact</strong> assessment of community-based animal health workers in<br />
Ethiopia; Initial experiences with participatory approaches and methods. Feinstein International Center, Addis Ababa<br />
http://www.participatoryepidemiology.info/PMIA%20Afar%20&%20Wollo.pdf<br />
Pretty, J, I. Guijt, J. Thompson and I. Scoones (1995) <strong>Participatory</strong> Learning and Action: A Trainer’s Guide London:<br />
International Institute for Environment and Development<br />
http://www.iied.org/pubs/display.php?o=6021IIED&n=1&l=1&k=<strong>Participatory</strong>%20Learning%20and%20Action%20A<br />
%20trainer's%20guide<br />
Rifkin, S.B., Muller, F. and Bichmann, W. (1988). Primary healthcare: on measuring participation. Social Science and<br />
Medicine 26(9), 931-940<br />
Roberts, L. (2004) Assessing the <strong>Impact</strong> of Humanitarian Assistance: A Review of Methods and Practices in the Health<br />
Sector HPG Background Paper, London: Overseas Development Institute<br />
62
Roche, C. (1999) <strong>Impact</strong> <strong>Assessment</strong> for Development Agencies: Learning to Value Change Oxford: OXFAM, Novib<br />
Save the Children UK (1999) Toolkits – A Practical Guide to Planning, Monitoring, Evaluation and <strong>Impact</strong> <strong>Assessment</strong><br />
by Louise Gosling with Mike Edwards, London: Save the Children<br />
Shoham, J. (2004) Assessing the <strong>Impact</strong> of Humanitarian Assistance: A Review of Methods in the Food and Nutrition<br />
Sector Background Paper for HPG Research Report No 17, London: Overseas Development Institute<br />
Simanowitz, A. with contributions by S. Johnson and J Gaventa (2000) Making <strong>Impact</strong> <strong>Assessment</strong> More <strong>Participatory</strong><br />
Working Paper no. 2, Improving the <strong>Impact</strong> of Microfinance on Poverty – Action Research Programme. Brighton:<br />
Imp-Act, Institute of Development Studies at the University of Sussex<br />
Watson, C. (2008). Literature Review of <strong>Impact</strong> Measurement in the Humanitarian Sector. Feinstein International<br />
Center, Medford<br />
White, S. and J. Petit (2004) <strong>Participatory</strong> Methods and the Measurement of Wellbeing <strong>Participatory</strong> Learning and<br />
Action 50, London: IIED<br />
Cover Photos <strong>Participatory</strong> Tools in Action © Alkassoum Kadede, 2007<br />
Visual Aids © Omeno Suji, 2007<br />
63
Feinstein International Center<br />
Tufts University<br />
200 Boston Ave., Suite 4800<br />
Medford, MA 02155<br />
USA<br />
tel: +1 617.627.3423<br />
fax: +1 617.627.3428<br />
fic.tufts.edu