Participatory Impact Assessment - Capacity4Dev
Participatory Impact Assessment - Capacity4Dev
Participatory Impact Assessment - Capacity4Dev

You also want an ePaper? Increase the reach of your titles
YUMPU automatically turns print PDFs into web optimized ePapers that Google loves.
Examplesofquantitativeimpactindicators:(increasedmilkconsumptionby<br />
children,incomefromcropsales)<br />
Examplesofqualitativeimpactindicators:(trustconfidencehope,status<br />
participation,security,dignity,socialcohesion,wellbeing)<br />
If the community or participants produce many impact indicators, ask them to prioritize the<br />
indicators using ranking. It is important not to have too many indicators: as with the key<br />
assessment questions, it is better to have a few good indicators than too many poor ones. Try to<br />
limit the number of indicators therefore to no more than five per project activity being assessed.<br />
Changes in coping strategies<br />
Often times during a humanitarian crisis, people will employ a variety of economic or livelihoods<br />
strategies to cope with the effects of a particular shock such as a drought. These strategies,<br />
sometimes called coping mechanisms are often good indicators by which to measure change or<br />
impact. For example during a drought people may sell most of their livestock (usually at a reduced<br />
price) in order to purchase food and cover other priority expenses. Once the situation has improved<br />
and people move into a recovery period, they will often restock by re-investing in livestock assets.<br />
By capturing these changes you can determine whether the situation has improved and to what<br />
extent the project played a role in facilitating this change. To identify these coping strategies,<br />
simply ask people what they did during the period leading up to and during the crisis.<br />
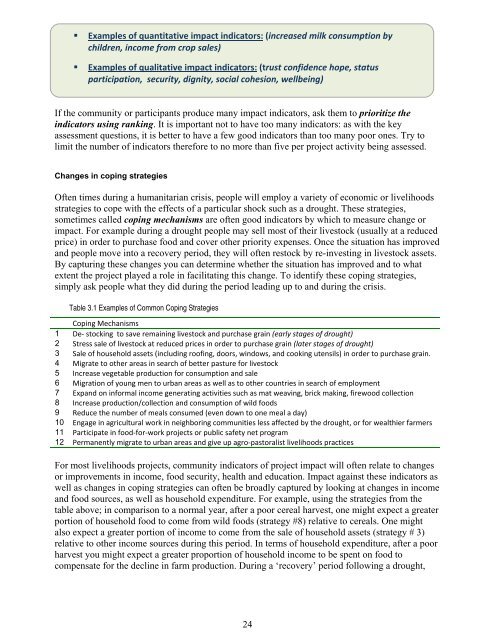
Table 3.1 Examples of Common Coping Strategies<br />
CopingMechanisms<br />
1 Destockingtosaveremaininglivestockandpurchasegrain(earlystagesofdrought)<br />
2 Stresssaleoflivestockatreducedpricesinordertopurchasegrain(laterstagesofdrought)<br />
3 Saleofhouseholdassets(includingroofing,doors,windows,andcookingutensils)inordertopurchasegrain.<br />
4 Migratetootherareasinsearchofbetterpastureforlivestock<br />
5 Increasevegetableproductionforconsumptionandsale<br />
6 Migrationofyoungmentourbanareasaswellastoothercountriesinsearchofemployment<br />
7 Expandoninformalincomegeneratingactivitiessuchasmatweaving,brickmaking,firewoodcollection<br />
8 Increaseproduction/collectionandconsumptionofwildfoods<br />
9 Reducethenumberofmealsconsumed(evendowntoonemealaday)<br />
10 Engageinagriculturalworkinneighboringcommunitieslessaffectedbythedrought,orforwealthierfarmers<br />
11 Participateinfoodforworkprojectsorpublicsafetynetprogram<br />
12 Permanentlymigratetourbanareasandgiveupagropastoralistlivelihoodspractices<br />
For most livelihoods projects, community indicators of project impact will often relate to changes<br />
or improvements in income, food security, health and education. <strong>Impact</strong> against these indicators as<br />
well as changes in coping strategies can often be broadly captured by looking at changes in income<br />
and food sources, as well as household expenditure. For example, using the strategies from the<br />
table above; in comparison to a normal year, after a poor cereal harvest, one might expect a greater<br />
portion of household food to come from wild foods (strategy #8) relative to cereals. One might<br />
also expect a greater portion of income to come from the sale of household assets (strategy # 3)<br />
relative to other income sources during this period. In terms of household expenditure, after a poor<br />
harvest you might expect a greater proportion of household income to be spent on food to<br />
compensate for the decline in farm production. During a ‘recovery’ period following a drought,<br />
24