Participatory Impact Assessment - Capacity4Dev
Participatory Impact Assessment - Capacity4Dev
Participatory Impact Assessment - Capacity4Dev

You also want an ePaper? Increase the reach of your titles
YUMPU automatically turns print PDFs into web optimized ePapers that Google loves.
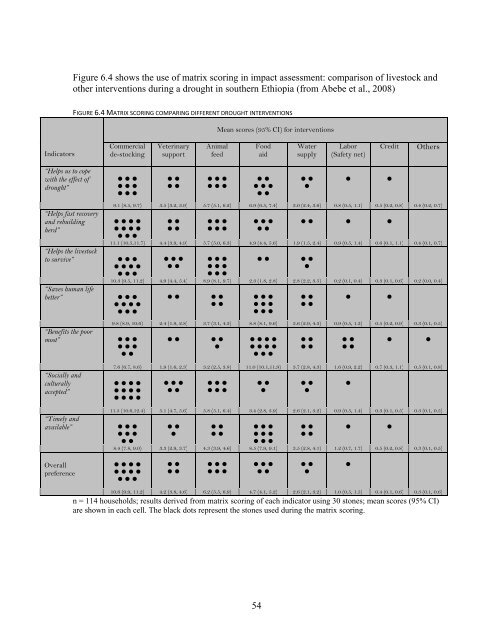
Figure 6.4 shows the use of matrix scoring in impact assessment: comparison of livestock and<br />
other interventions during a drought in southern Ethiopia (from Abebe et al., 2008)<br />
FIGURE6.4MATRIXSCORINGCOMPARINGDIFFERENTDROUGHTINTERVENTIONS<br />
Mean scores (95% CI) for interventions<br />
Indicators<br />
Commercial<br />
de-stocking<br />
Veterinary<br />
support<br />
Animal<br />
feed<br />
Food<br />
aid<br />
Water<br />
supply<br />
Labor<br />
(Safety net)<br />
Credit<br />
Others<br />
“Helps us to cope<br />
with the effect of<br />
drought”<br />
“Helps fast recovery<br />
and rebuilding<br />
herd”<br />
“Helps the livestock<br />
to survive”<br />
“Saves human life<br />
better”<br />
“Benefits the poor<br />
most”<br />
“Socially and<br />
culturally<br />
accepted”<br />
“Timely and<br />
available”<br />
<br />
<br />
<br />
<br />
<br />
<br />
<br />
<br />
<br />
<br />
<br />
<br />
<br />
9.1 (8.5, 9.7) 3.5 (3.2, 3.9) 5.7 (5.1, 6.2) 6.9 (6.5, 7.4) 3.0 (2.4, 3.6) 0.8 (0.5, 1.1) 0.5 (0.2, 0.8) 0.4 (0.2, 0.7)<br />
<br />
<br />
<br />
<br />
<br />
<br />
<br />
<br />
<br />
<br />
11.1 (10.5,11.7) 4.4 (3.9, 4.9) 5.7 (5.0, 6.3) 4.9 (4.4, 5.6) 1.9 (1.5, 2.4) 0.9 (0.5, 1.4) 0.6 (0.1, 1.1) 0.4 (0.1, 0.7)<br />
<br />
<br />
<br />
<br />
<br />
<br />
<br />
<br />
<br />
10.3 (9.5, 11.2) 4.9 (4.4, 5.4) 8.9 (8.1, 9.7) 2.3 (1.8, 2.8) 2.8 (2.2, 3.5) 0.2 (0.1, 0.4) 0.3 (0.1, 0.6) 0.2 (0.0, 0.4)<br />
<br />
<br />
<br />
<br />
<br />
<br />
<br />
<br />
<br />
<br />
<br />
<br />
<br />
9.8 (8.9, 10.6) 2.4 (1.9, 2.8) 3.7 (3.1, 4.3) 8.8 (8.1, 9.6) 3.6 (2.9, 4.3) 0.9 (0.5, 1.3) 0.5 (0.2, 0.9) 0.3 (0.1, 0.5)<br />
<br />
<br />
<br />
<br />
<br />
<br />
<br />
<br />
<br />
<br />
<br />
<br />
<br />
7.6 (6.7, 8.6) 1.9 (1.6, 2.3) 3.2 (2.5, 3.8) 11.0 (10.1,11.9) 3.7 (2.8, 4.3) 1.6 (0.9, 2.2) 0.7 (0.3, 1.1) 0.5 (0.1, 0.8)<br />
<br />
<br />
<br />
<br />
<br />
<br />
<br />
<br />
<br />
<br />
<br />
<br />
11.5 (10.6,12.4) 5.1 (4.7, 5.6) 5.8 (5.1, 6.4) 3.4 (2.8, 3.9) 2.6 (2.1, 3.2) 0.9 (0.5, 1.4) 0.3 (0.1, 0.5) 0.3 (0.1, 0.5)<br />
<br />
<br />
<br />
<br />
<br />
<br />
<br />
<br />
<br />
<br />
<br />
<br />
8.4 (7.8, 9.0) 3.3 (2.9, 3.7) 4.3 (3.9, 4.6) 8.5 (7.9, 9.1) 3.5 (2.8, 4.1) 1.2 (0.7, 1.7) 0.5 (0.2, 0.8) 0.3 (0.1, 0.5)<br />
<br />
<br />
<br />
<br />
<br />
Overall<br />
preference<br />
<br />
<br />
<br />
<br />
<br />
<br />
<br />
<br />
<br />
10.6 (9.9, 11.2) 4.2 (3.8, 4.6) 6.2 (5.5, 6.9) 4.7 (4.1, 5.2) 2.6 (2.1, 3.2) 1.0 (0.5, 1.5) 0.4 (0.1, 0.6) 0.3 (0.1, 0.6)<br />
n = 114 households; results derived from matrix scoring of each indicator using 30 stones; mean scores (95% CI)<br />
are shown in each cell. The black dots represent the stones used during the matrix scoring.<br />
<br />
<br />
<br />
54