Stainless steel finned tube heat exchanger design for waste ... - erc
Stainless steel finned tube heat exchanger design for waste ... - erc
Stainless steel finned tube heat exchanger design for waste ... - erc
You also want an ePaper? Increase the reach of your titles
YUMPU automatically turns print PDFs into web optimized ePapers that Google loves.
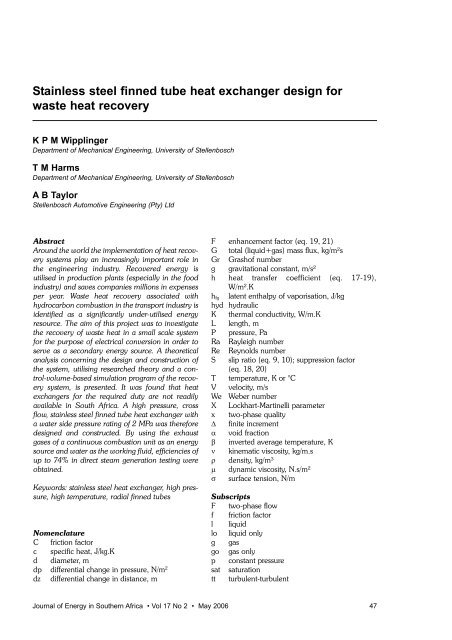
<strong>Stainless</strong> <strong>steel</strong> <strong>finned</strong> <strong>tube</strong> <strong>heat</strong> <strong>exchanger</strong> <strong>design</strong> <strong>for</strong><br />
<strong>waste</strong> <strong>heat</strong> recovery<br />
K P M Wipplinger<br />
Department of Mechanical Engineering, University of Stellenbosch<br />
T M Harms<br />
Department of Mechanical Engineering, University of Stellenbosch<br />
A B Taylor<br />
Stellenbosch Automotive Engineering (Pty) Ltd<br />
Abstract<br />
Around the world the implementation of <strong>heat</strong> recovery<br />
systems play an increasingly important role in<br />
the engineering industry. Recovered energy is<br />
utilised in production plants (especially in the food<br />
industry) and saves companies millions in expenses<br />
per year. Waste <strong>heat</strong> recovery associated with<br />
hydrocarbon combustion in the transport industry is<br />
identified as a significantly under-utilised energy<br />
resource. The aim of this project was to investigate<br />
the recovery of <strong>waste</strong> <strong>heat</strong> in a small scale system<br />
<strong>for</strong> the purpose of electrical conversion in order to<br />
serve as a secondary energy source. A theoretical<br />
analysis concerning the <strong>design</strong> and construction of<br />
the system, utilising researched theory and a control-volume-based<br />
simulation program of the recovery<br />
system, is presented. It was found that <strong>heat</strong><br />
<strong>exchanger</strong>s <strong>for</strong> the required duty are not readily<br />
available in South Africa. A high pressure, cross<br />
flow, stainless <strong>steel</strong> <strong>finned</strong> <strong>tube</strong> <strong>heat</strong> <strong>exchanger</strong> with<br />
a water side pressure rating of 2 MPa was there<strong>for</strong>e<br />
<strong>design</strong>ed and constructed. By using the exhaust<br />
gases of a continuous combustion unit as an energy<br />
source and water as the working fluid, efficiencies of<br />
up to 74% in direct steam generation testing were<br />
obtained.<br />
Keywords: stainless <strong>steel</strong> <strong>heat</strong> <strong>exchanger</strong>, high pressure,<br />
high temperature, radial <strong>finned</strong> <strong>tube</strong>s<br />
Nomenclature<br />
C friction factor<br />
c specific <strong>heat</strong>, J/kg.K<br />
d diameter, m<br />
dp differential change in pressure, N/m 2<br />
dz differential change in distance, m<br />
F enhancement factor (eq. 19, 21)<br />
G total (liquid+gas) mass flux, kg/m²s<br />
Gr Grashof number<br />
g gravitational constant, m/s²<br />
h <strong>heat</strong> transfer coefficient (eq. 17-19),<br />
W/m².K<br />
h fg latent enthalpy of vaporisation, J/kg<br />
hyd hydraulic<br />
K thermal conductivity, W/m.K<br />
L length, m<br />
P pressure, Pa<br />
Ra Rayleigh number<br />
Re Reynolds number<br />
S slip ratio (eq. 9, 10); suppression factor<br />
(eq. 18, 20)<br />
T temperature, K or °C<br />
V velocity, m/s<br />
We Weber number<br />
X Lockhart-Martinelli parameter<br />
x two-phase quality<br />
∆ finite increment<br />
α void fraction<br />
β inverted average temperature, K<br />
ν kinematic viscosity, kg/m.s<br />
ρ density, kg/m³<br />
µ dynamic viscosity, N.s/m²<br />
σ surface tension, N/m<br />
Subscripts<br />
F two-phase flow<br />
f friction factor<br />
l liquid<br />
lo liquid only<br />
g gas<br />
go gas only<br />
p constant pressure<br />
sat saturation<br />
tt turbulent-turbulent<br />
Journal of Energy in Southern Africa • Vol 17 No 2 • May 2006 47
Introduction<br />
The mid 20 th century has proven to be a time during<br />
which the world has had a rude awakening from<br />
its relaxed attitude towards the usage of our depleting<br />
natural resources. Proof of this is the <strong>waste</strong> <strong>heat</strong><br />
recovery systems that have been in use in industries<br />
all over the world <strong>for</strong> the last 50 years. An example<br />
of this is the integration of various factory sections<br />
where the <strong>waste</strong> <strong>heat</strong> from one section is used in<br />
another. This is common practise in the food industry<br />
and not only saves money, but streamlines production<br />
and results in better efficiencies. Nonetheless,<br />
a large amount of energy is still being lost in the<br />
<strong>for</strong>m of <strong>heat</strong> generated by everyday industrial and<br />
domestic equipment (Koorts 1998).<br />
The definition of <strong>waste</strong> <strong>heat</strong> includes the following:<br />
unburned but combustible fuel; sensible and<br />
latent enthalpy discharge from exhaust gas mixtures;<br />
and sensible <strong>heat</strong> discharge in liquid <strong>waste</strong> (Al<br />
Rabghi et al 1993).<br />
A quarter of the energy consumption in the<br />
western world is centred in the transportation sector.<br />
Automobiles and trucks account <strong>for</strong> approximately<br />
80% of all transportation energy expenditures.<br />
These thermal engines operate with a thermal<br />
efficiency between 30 and 40% (Koehler et al 1997).<br />
The typical energy balance <strong>for</strong> a turbocharged<br />
diesel engine, as tested by Stellenbosch Automotive<br />
Engineering (Wipplinger 2000), is as follows: oil<br />
cooling (2%), air cooling (5%), water cooling<br />
(25%), exhaust gasses (33%) and mechanical<br />
power (35%). It is clear that approximately one<br />
third of the total energy released by the combustion<br />
process is lost along with the exhaust gas, while one<br />
third is transferred to the cooling fluids and the rest<br />
is converted to actual mechanical power. The cooling<br />
fluids are necessary losses which prevent catastrophic<br />
failure of the engine due to over<strong>heat</strong>ing.<br />
But the energy lost along with the exhaust gas, can<br />
be ascribed to the inefficient utilisation of the available<br />
energy, which makes research into the recovery<br />
of <strong>waste</strong> energy and subsequent efficiency and<br />
fuel utilization improvement, a viable option.<br />
While it is well known that sensible hydro-carbon<br />
combustion <strong>waste</strong> <strong>heat</strong> recovery is a common<br />
practice in large units found in marine applications,<br />
the present study <strong>for</strong>ms part of ongoing investigations<br />
desiring to examine ways <strong>for</strong> exhaust gas<br />
<strong>waste</strong> <strong>heat</strong> recovery on smaller units, e.g. trucks<br />
and locomotive engines. The final system <strong>design</strong><br />
would ideally convert the recovered energy into<br />
electricity by implementing a turbine and generator<br />
combination.<br />
In a detailed study done by Wipplinger (2004),<br />
the following premises were accepted: The sensible<br />
<strong>heat</strong> must be recovered by means of a <strong>heat</strong><br />
<strong>exchanger</strong>, which will impose a low back pressure<br />
on the exhaust system. Latent enthalpy recovery is<br />
not envisaged at present as the condensation of any<br />
vapours present in the exhaust gas mixture is considered<br />
unfavourable to the exhaust system.<br />
Without committing to a downstream Rankine<br />
steam cycle and its variations (e.g. a Stirling engine<br />
might serve as an alternative), high pressure capability<br />
on the water side would be required. For various<br />
reasons discussed by Wipplinger (2004), a<br />
<strong>finned</strong> <strong>tube</strong> cross-flow configuration was considered<br />
the most suitable. In order to correctly specify such<br />
a unit, knowledge of the behaviour of two-phase<br />
flow and its subsequent <strong>heat</strong> transfer coefficients,<br />
are required.<br />
Two-phase correlations<br />
During the <strong>heat</strong> <strong>exchanger</strong> <strong>design</strong> process,<br />
described by Wipplinger (2004), a computer program<br />
was written in Microsoft ® Visual Basic 6 which<br />
simulated the conditions, and subsequent fluid/gas<br />
properties, inside the <strong>heat</strong> <strong>exchanger</strong>. Well known<br />
correlations were used to compensate <strong>for</strong> the various<br />
flow regimes, of which the following are the<br />
most important:<br />
Friedel Correlation <strong>for</strong> Frictional Two-phase<br />
Pressure Gradient<br />
The Friedel Correlation (Friedel 1979) is probably<br />
the most generally available correlation <strong>for</strong> the frictional<br />
two-phase pressure gradient. It is written in<br />
terms of a two-phase multiplier<br />
48 Journal of Energy in Southern Africa • Vol 17 No 2 • May 2006
CISE Correlation <strong>for</strong> Void Fraction<br />
The correlation of Premoli et al. (1970), usually<br />
known as the CISE correlation, is a correlation<br />
determining the void fraction in terms of a slip ratio,<br />
S. The void fraction (α) is given by<br />
∆T sat is the wall super<strong>heat</strong> in Kelvin and ∆P sat is the<br />
difference between the saturation pressures calculated<br />
from the wall temperature and the fluid temperature<br />
in Pascal.<br />
Parameter S (suppression factor) corrects the<br />
fully developed nucleate boiling prediction of h mic to<br />
account <strong>for</strong> the fact that, as the macroscopic convective<br />
effect increases in strength, nucleation is<br />
more strongly suppressed. Parameter F (enhancement<br />
factor) is calculated as<br />
and the Lockhart-Martinelli parameter is calculated<br />
as<br />
Chen Correlation <strong>for</strong> Boiling Heat Transfer<br />
to Saturated Fluids in Convective Flow<br />
The Chen Correlation (Chen 1963), used to<br />
determine the boiling <strong>heat</strong> transfer coefficient, uses<br />
the superpositioning of nucleation and <strong>for</strong>ced convection<br />
mechanisms. The convective transfer is<br />
expressed as a function of the two-phase Reynolds<br />
number after Lockhart-Martinelli (as presented by<br />
Whalley 1987), and the nucleation transfer is<br />
obtained from the nucleate boiling correlation of<br />
Forster and Zuber (1955). The Chen Correlation<br />
can be expressed as<br />
with the total <strong>heat</strong> transfer coefficient equal to the<br />
sum of a microscopic (nucleate boiling) contribution,<br />
h mic, and a macroscopic (bulk convective) contribution,<br />
h mac.<br />
All three of the above mentioned correlations<br />
and basic thermodynamic principles, were integrated<br />
in the simulation program.<br />
The input data needed to successfully simulate<br />
the <strong>heat</strong> <strong>exchanger</strong> included the material properties<br />
and dimensions of the <strong>heat</strong> <strong>exchanger</strong>, as well as<br />
the inlet temperature and pressure properties of<br />
both the working fluid and the exhaust gas.<br />
Heat <strong>exchanger</strong> material<br />
As stated previously, the <strong>design</strong> most suited <strong>for</strong> the<br />
application, due to its compact size, would be a<br />
cross flow <strong>heat</strong> <strong>exchanger</strong> with a continuous <strong>finned</strong><br />
<strong>tube</strong> criss-crossing the path of the hot gas. This<br />
would entail using a combination of U-<strong>tube</strong>s and<br />
straight <strong>finned</strong> <strong>tube</strong>s with a single <strong>heat</strong> <strong>exchanger</strong><br />
inlet and outlet.<br />
The project scope demanded that testing be<br />
done at high pressures and temperatures to determine<br />
their respective influence on the energy recov-<br />
Journal of Energy in Southern Africa • Vol 17 No 2 • May 2006 49
ery process. Due to this extreme combination, a fin<br />
and <strong>tube</strong> material had to be chosen that would<br />
withstand the conditions without failing and result<br />
in the best possible <strong>heat</strong> transfer. The materials’<br />
resistance to corrosion was also important, because<br />
of the corrosive nature of exhaust gasses.<br />
Materials like aluminium have a very good conductivity,<br />
but tend to soften at elevated temperatures.<br />
Copper has a very high melting point, but<br />
starts to flake and disintegrate long be<strong>for</strong>e it reaches<br />
its melting point temperature. It would also start<br />
‘ballooning’ at the U-bends, because of the high<br />
pressures inside the <strong>heat</strong> <strong>exchanger</strong> <strong>tube</strong>s. Due to<br />
the corrosive environment it would be subjected to,<br />
carbon and mild <strong>steel</strong> were also ruled out because<br />
of the inevitable decrease in <strong>heat</strong> <strong>exchanger</strong> effectiveness,<br />
should corrosion occur.<br />
After some consideration the material chosen <strong>for</strong><br />
both the fins and <strong>tube</strong>s, was stainless <strong>steel</strong>. Despite<br />
stainless <strong>steel</strong>’s low thermal conductivity, it has a<br />
very good resistance to corrosion and can be used<br />
at high temperatures. By utilising the same material<br />
<strong>for</strong> the fins and <strong>tube</strong>s, the resulting solid <strong>finned</strong> <strong>tube</strong><br />
would have no contact resistance and would<br />
improve the <strong>heat</strong> transfer.<br />
For stainless <strong>steel</strong>, an optimal fin height of 5 mm<br />
was determined necessary. <strong>Stainless</strong> <strong>steel</strong> tends to<br />
work harder, so to extrude the fins, or roll them onto<br />
the <strong>tube</strong> would not be feasible. There<strong>for</strong>e, it was<br />
decided to use a hollow bar and machine cut the<br />
fins out with the help of a numerically controlled<br />
milling machine (NC-machine).<br />
While this type of <strong>heat</strong> <strong>exchanger</strong> <strong>design</strong> meets<br />
the experimental needs and the engineering department’s<br />
workshop manufacturing capability at<br />
Stellenbosch University, it has not been optimised<br />
<strong>for</strong> manufacturing on any scale. Although modern<br />
computerized production workshops are highly cost<br />
effective in handling variations of small batch<br />
<strong>design</strong>s, alternatively more conventional <strong>heat</strong><br />
<strong>exchanger</strong> construction methods are not ruled out.<br />
However, deliberations of this kind are considered<br />
premature at this stage of the research.<br />
The optimal <strong>heat</strong> <strong>exchanger</strong> <strong>design</strong> was determined<br />
using the simulation program by entering<br />
various <strong>heat</strong> <strong>exchanger</strong> dimensions (i.e. the <strong>finned</strong><br />
<strong>tube</strong> dimensions and the number of <strong>tube</strong>-rows within<br />
the <strong>heat</strong> <strong>exchanger</strong>) along with the material properties<br />
of stainless <strong>steel</strong> and the inlet conditions of<br />
the working fluid and exhaust gas.<br />
The optimising strategy incorporated state of the<br />
art <strong>heat</strong> transfer theory with which, after several<br />
iterations, the program computed the resulting <strong>heat</strong><br />
<strong>exchanger</strong> outlet conditions <strong>for</strong> a given set of input<br />
parameters, as discussed above. These results were<br />
then compared and the ideal <strong>design</strong> identified.<br />
Heat <strong>exchanger</strong> construction and testing<br />
The <strong>heat</strong> <strong>exchanger</strong> simulation resulted in the following<br />
optimised dimensions: fin height, 5 mm; fin<br />
thickness, 0.5 mm; fin pitch, 2 mm. Each <strong>finned</strong><br />
<strong>tube</strong> was 306 mm in length and resulted in the<br />
completed <strong>heat</strong> <strong>exchanger</strong> having outer dimensions<br />
of 420 x 403 x 200 mm 3 . A machined <strong>finned</strong> <strong>tube</strong><br />
is shown in Figure 1.<br />
Figure 1: NC-machined <strong>finned</strong> <strong>tube</strong><br />
The U-<strong>tube</strong>s were interference fitted inside the<br />
<strong>finned</strong> <strong>tube</strong>s and then TIG-welded together. As a<br />
precaution, the fully assembled <strong>heat</strong> <strong>exchanger</strong> was<br />
pressure tested up to 3000 kPa. Under testing conditions,<br />
the pressure would not exceed 2000 kPa as<br />
set by the project goals.<br />
Figures 2 and 3 shows the completed <strong>heat</strong><br />
<strong>exchanger</strong> assembly, as well as the points at which<br />
pressure and temperature measurements were<br />
taken on the <strong>heat</strong> <strong>exchanger</strong> and exhaust gas ducting.<br />
To determine the characteristics of the <strong>heat</strong><br />
<strong>exchanger</strong> under various operating conditions,<br />
experimental testing was done using a continuous<br />
combustion unit (which supplied the exhaust gas)<br />
and water (which served as the <strong>heat</strong> recovery fluid).<br />
To enable testing at various pressures, a speed controlled<br />
water pump was connected to the inlet of the<br />
<strong>heat</strong> <strong>exchanger</strong> and a pressure valve was connected<br />
to the outlet of the <strong>heat</strong> <strong>exchanger</strong>. Temperature<br />
control was obtained by using various air-fuel mixtures<br />
inside the continuous combustion unit.<br />
Actual and simulated <strong>heat</strong> <strong>exchanger</strong><br />
results<br />
The evaluation of the experimental and simulated<br />
test results consisted of the comparison of the inlet<br />
and outlet properties in both cases.<br />
Figure 4 shows the results of an experimental<br />
test compared to the results of a simulated test at<br />
the same inlet conditions. The figure illustrates the<br />
temperature distribution as measured by the thermocouples<br />
that were TIG-welded to the U-<strong>tube</strong>s as<br />
shown in Figure 2. Between thermocouples 1 and<br />
4, Figure 4 shows a steeper actual temperature gradient<br />
than was predicted by the simulation. These<br />
thermocouples are in the first two rows of the <strong>heat</strong><br />
<strong>exchanger</strong> as shown in Figure 5. From there<br />
onwards, the temperature gradient rises through a<br />
50 Journal of Energy in Southern Africa • Vol 17 No 2 • May 2006
Figure 2: Measurements taken on the <strong>heat</strong> <strong>exchanger</strong><br />
Figure 3: Measurements taken on the exhaust inlet ducting<br />
Figure 4: Actual versus simulated<br />
temperatures inside the <strong>heat</strong> <strong>exchanger</strong><br />
Figure 5: Exhaust gas distribution inside<br />
the ducting<br />
Journal of Energy in Southern Africa • Vol 17 No 2 • May 2006 51
series of steps and becomes negative between thermocouples<br />
8 and 9.<br />
This was hypothesised that this anomalous<br />
behaviour could be explained by the distribution of<br />
hot exhaust gas flowing through the <strong>heat</strong> <strong>exchanger</strong>.<br />
Figure 5 shows the expected exhaust flow. As the<br />
exhaust gas enters the ducting, it rises to the top half<br />
of the ducting, creating turbulent vortices in the bottom<br />
half.<br />
These turbulent vortices will result in a better<br />
<strong>heat</strong> transfer through the bottom and sides of the<br />
ducting, cooling the exhaust down and exposing the<br />
lower parts of rows 3, 4 and 5 to a lower temperature;<br />
the end result being the actual cooling of the<br />
liquid-vapour mixture inside the <strong>finned</strong> <strong>tube</strong>s. This<br />
hypothesis was tested using convection theory.<br />
and T av is in Kelvin.<br />
The Reynolds number is determined by<br />
and the Rayleigh number by<br />
Ra = Gr.Re (27)<br />
By using a range of values <strong>for</strong> T surf between 25<br />
and 340°C along with Mills (1995), the results show<br />
that mixed convection conditions occur inside the<br />
ducting. This would result in a secondary motion<br />
where the exhaust gas would flow upwards along<br />
the wall and downwards in the central region <strong>for</strong>ming<br />
a vortex which would increase the <strong>heat</strong> transfer<br />
and result in a lower exhaust temperature. A way of<br />
eliminating this would be to ensure the equal distribution<br />
of the hot exhaust gas through the ducting<br />
with the help of guide vanes. In addition, Van Zyl et<br />
al (2006) also conducted a CFD simulation of the<br />
gas flow inside the ducting. Some generic results<br />
from that research are shown in Figure 6 and typically<br />
indicate flow separation and re-circulation of<br />
the gas occurring.<br />
Another interesting phenomenon shown by<br />
Figure 4 is the fact that the inlet gradient between<br />
thermocouples 1 and 4 is much steeper than predicted<br />
by the simulation program. The explanation<br />
<strong>for</strong> this phenomenon has a connection to the<br />
exhaust extraction fan which was situated at the<br />
outlet of the exhaust ducting. In experimental testing,<br />
a change in the <strong>heat</strong> transfer coefficient was<br />
noted when the fan was switched on, while no<br />
notable change was measured in the air mass flow<br />
rate at the continuous combustion unit.<br />
The flow meter restricts air flow when set to a<br />
certain volumetric flow rate, while the exhaust fan<br />
increases the suction at the outlet of the ducting.<br />
The result is a low pressure zone which <strong>for</strong>ms<br />
between the <strong>heat</strong> <strong>exchanger</strong> and the exhaust fan<br />
prompting the acceleration of the gas and giving a<br />
higher <strong>heat</strong> transfer coefficient within the <strong>heat</strong><br />
<strong>exchanger</strong>. This was confirmed by the experimental<br />
measurements as the simulated pressure drops<br />
(approximately 1 Pa) was much lower than the<br />
actual pressure drop (approximately 8-10 Pa)<br />
across the <strong>heat</strong> <strong>exchanger</strong>.<br />
Figure 7 (the use of different inlet conditions)<br />
shows similar temperature behaviour, as described<br />
in Figure 4. From Figure 7, it is evident that test runs<br />
5 and 9 as well as test runs 8 and 10 follow the<br />
same temperature path <strong>for</strong> the last half of the <strong>heat</strong><br />
<strong>exchanger</strong>, despite the fact that they have different<br />
starting gradients.<br />
Figure 6: (left) A sectional temperature distribution through a diffuser<br />
(right) A sectional velocity field through a diffuser<br />
52 Journal of Energy in Southern Africa • Vol 17 No 2 • May 2006
Figure 7: Test point comparisons<br />
Figure 8: Actual and simulated outlet temperatures<br />
The explanation <strong>for</strong> this occurrence is the fact<br />
that test runs 1 and 3 both had an inlet pressure of<br />
600 kPa, while test runs 2 and 4 were at 800 kPa.<br />
The similar pressures meant that they would evaporate<br />
at the same saturation temperatures. The fact<br />
that all of the tests had different exhaust gas temperatures<br />
and/or flow rates, explains the different<br />
temperature gradients at the beginning of each<br />
curve.<br />
To verify the baseline conditions with which the<br />
simulation results could be compared, all electronic<br />
measuring equipment used in the experiment, were<br />
calibrated be<strong>for</strong>ehand. Figure 8 shows the results of<br />
11 comparative test runs that were done. On average,<br />
the difference between inlet and outlet temperatures<br />
<strong>for</strong> the actual and simulated exhaust gas, varied<br />
by -1.99 %. In other words, the amount of simulated<br />
energy transferred was less than the actual<br />
energy transferred. The same comparison <strong>for</strong> the<br />
working fluid, showed a variation of -1.47 %. In<br />
other words, the amount of simulated energy transferred<br />
was again less than the actual energy transferred.<br />
The reason why these two values are different<br />
is because the simulation program does not take<br />
any losses into account.<br />
This is evident when comparing the amount of<br />
energy transferred. On average, the simulated and<br />
actual exhaust gas energy transferred, differed by<br />
Journal of Energy in Southern Africa • Vol 17 No 2 • May 2006 53
Figure 9: Heat <strong>exchanger</strong> experimental and simulated energy balance<br />
6.41%, while the simulated and actual energy transfer<br />
of the working fluid differed by 7.16 %.<br />
Figure 9 shows the energy balance <strong>for</strong> both the<br />
experimental and simulated cases. The experimental<br />
values are much more scattered than the simulated<br />
values, in part due to the fact that the simulation<br />
theory did not take the pulsating/plug flow into<br />
account. Thus, the simulated values <strong>for</strong>m a relatively<br />
straight line beneath the equilibrium line, where<br />
the distance between the simulated and equilibrium<br />
line can be ascribed to losses.<br />
From the comparative tests shown above, it was<br />
concluded that the simulation program, despite<br />
some minor inaccuracies by not taking losses into<br />
account, is a true representation of the characteristic<br />
behaviour of the <strong>heat</strong> <strong>exchanger</strong>. The highest<br />
efficiency reached by the <strong>heat</strong> <strong>exchanger</strong> in experimental<br />
testing was 74%. Although, by using certain<br />
inlet conditions, the simulation program predicts<br />
that the <strong>heat</strong> <strong>exchanger</strong> efficiencies could be as high<br />
as 87%.<br />
Further simulation testing<br />
In an attempt to further characterise the <strong>heat</strong><br />
<strong>exchanger</strong>, various simulated test runs were done<br />
using different inlet conditions.<br />
Data corresponding to the steam quality<br />
crossover from x < 1 to x = 1, clearly showed the<br />
various characteristics of the fluid temperature,<br />
inlet- and outlet pressures, thermal <strong>heat</strong> transfer<br />
coefficient and the enthalpy. The data was generated<br />
by keeping the inlet temperatures and mass flow<br />
rates constant, while varying the inlet pressures.<br />
A summary of the results is illustrated in Figure<br />
10 which shows the relationship between the water<br />
temperatures and the inlet pressures of the <strong>heat</strong><br />
<strong>exchanger</strong>. From the 3D graph it is evident that<br />
between inlet pressures of 400 and 1200 kPa, the<br />
outlet temperatures drop, while a temperature rise is<br />
noted above 1300 kPa. T sat also rises as the pressure<br />
is increased and can be seen as a steadily rising<br />
plateau.<br />
The pressure increase prompts the vapour saturation<br />
point on each curve to slowly disappear until<br />
the steam quality drops below 100% and becomes<br />
a liquid/vapour mixture.<br />
In Figure 11 the <strong>heat</strong> transfer coefficient curve<br />
peaks at a lower value when the pressure is<br />
increased. This would indicate that the amount of<br />
energy transferred decreases as the pressure<br />
increases.<br />
The discontinuities shown on each curve, indicates<br />
that the water is flowing through a row closer<br />
to the inlet exhaust gas and is thus exposed to a different<br />
exhaust temperature, changing the <strong>heat</strong><br />
transfer coefficient. In the first four test runs, the first<br />
discontinuity is caused by theory inconsistencies.<br />
The effect this has on the results is insignificant and<br />
does not justify implementing a different theory.<br />
By using the input values shown in Table 1, a<br />
characteristic <strong>heat</strong> transfer coefficient curve was<br />
generated.<br />
Figure 10: Water temperature distribution<br />
54 Journal of Energy in Southern Africa • Vol 17 No 2 • May 2006
nothing more than a parabolic trough with the collector<br />
replaced by fins and the absorption-<strong>tube</strong><br />
neatly folded into a zigzagged configuration.<br />
Figure 11: Water thermal <strong>heat</strong> transfer<br />
coefficient<br />
Table 1: Gas/fluid input values<br />
Inlet conditions Gas Water<br />
Temperature (ºC) 400 25<br />
Pressure (kPa) 101.4 1000<br />
Mass flow rate (kg/s) 0.0233 0.0015<br />
The results, plotted in Figure 12, correspond to<br />
data provided by Odeh et al (1998), where the<br />
modelling of a parabolic trough with direct steam<br />
generation was done. The first horizontal line represents<br />
the pre<strong>heat</strong>ed region (liquid water), the vertical<br />
line indicates the two-phase region (watervapour<br />
mixture) and the last horizontal line indicates<br />
the super<strong>heat</strong>ed region (super<strong>heat</strong>ed steam).<br />
The correspondence between the simulated <strong>heat</strong><br />
<strong>exchanger</strong> data and the data of a parabolic trough<br />
is explained by the fact that a <strong>heat</strong> <strong>exchanger</strong> is<br />
Conclusion<br />
This project is a good example of technology working<br />
to preserve our resources, where an ef<strong>for</strong>t has<br />
been made to try and minimise energy losses,<br />
which will result in less fuel usage. Although the<br />
<strong>heat</strong> <strong>exchanger</strong> <strong>design</strong> is only a small step in the<br />
development of a complete small scale recovery<br />
plant, which can be used in the truck or locomotive<br />
industry, it none the less <strong>for</strong>ms a valuable foundation<br />
on which the whole system can be built.<br />
The comprehensive research and testing done in<br />
this project, helped to define the characteristics of<br />
the <strong>heat</strong> <strong>exchanger</strong> and by including a simulation<br />
program, it will now be possible to simulate the<br />
whole recovery system based on these characteristics<br />
given certain inlet properties.<br />
The next step in the ongoing research project<br />
will be to incorporate a means of energy conversion,<br />
be it a sterling engine or a turbine and generator<br />
combination.<br />
References<br />
Al Rabghi O.M., Bierutty M., Akyurt M., Najjar Y. and Alp<br />
T. (1993), Recovery and utilization of <strong>waste</strong> <strong>heat</strong>, A<br />
review paper, Heat Recovery Systems and CHP, Vol.<br />
13, pp. 463-670.<br />
Chen J.C. (1963), A correlation <strong>for</strong> boiling <strong>heat</strong> transfer<br />
to saturated fluids in convective flow, ASME paper<br />
63-HT-34. Presented at the 6th National Heat<br />
Transfer Conference, Boston.<br />
Figure 12: Water <strong>heat</strong> transfer coefficient vs. temperature<br />
Journal of Energy in Southern Africa • Vol 17 No 2 • May 2006 55
Forster H.K. and Zuber N. (1955), Dynamics of vapour<br />
bubbles and boiling <strong>heat</strong> transfer, AIChEJ., Vol. 1, pp.<br />
531-535.<br />
Friedel L. (1979), Improved friction drop correlations <strong>for</strong><br />
horizontal and vertical two-phase flow, European<br />
Two-phase Flow Group Meeting, Ispra, Italy.<br />
Koehler J., Tgethoff W.J., Westpalen D. and Sonnekalb<br />
M. (1997), Absorption refrigeration systems <strong>for</strong><br />
mobile applications utilising exhaust gasses, Heat and<br />
Mass Transfer, Vol. 32, pp. 333-340.<br />
Koorts T. (1998), Waste energy recovery system, Final<br />
Year B Eng Project, University of Stellenbosch,<br />
August.<br />
Mills A.F. (1995), Heat and Mass Transfer, University of<br />
Cali<strong>for</strong>nia, Los Angeles, Appendix A and Chapter 4<br />
Figure 4.42, p. 312.<br />
Odeh S.D., Morrison G.L. and Behnia M. (1998),<br />
Modelling of parabolic trough direct steam generation<br />
solar collectors, Solar Thermal Energy Laboratory,<br />
University of New South Wales, Solar Energy, Vol.<br />
62, Nr. 6, pp. 395-406.<br />
Premoli A., Frencesco D. and Prina A. (1970), An empirical<br />
correlation <strong>for</strong> evaluating two-phase mixture density<br />
under adiabatic conditions, European Two-phase<br />
Flow Group Meeting, Milan.<br />
Van Zyl J.M., De Rouw B., Harms T.M. and Taylor, A.B.<br />
(2006), CFD investigation of an experimentally<br />
detected <strong>heat</strong> transfer phenomenon, Extended<br />
abstract accepted: SACAM06, SAAM, Cape Town.<br />
Whalley P.B. (1987), Boiling, Condensation, and Gas-<br />
Liquid Flow, Department of Engineering Science,<br />
University of Ox<strong>for</strong>d, Ox<strong>for</strong>d, Chapters 1-6, 16, 17,<br />
20.<br />
Wipplinger K.P.M. (2000), Internal combustion engine<br />
practical, Thermodynamics B, Presented by the<br />
Centre <strong>for</strong> Automotive Engineering, University of<br />
Stellenbosch, December.<br />
Wipplinger K.P.M. (2004), High pressure stainless <strong>steel</strong><br />
fin<strong>tube</strong> <strong>heat</strong> <strong>exchanger</strong> <strong>design</strong> <strong>for</strong> <strong>waste</strong> <strong>heat</strong> recovery,<br />
M Sc (Eng) thesis, University of Stellenbosch,<br />
April.<br />
56 Journal of Energy in Southern Africa • Vol 17 No 2 • May 2006


