CSP rollout - erc - University of Cape Town
CSP rollout - erc - University of Cape Town
CSP rollout - erc - University of Cape Town
- No tags were found...

You also want an ePaper? Increase the reach of your titles
YUMPU automatically turns print PDFs into web optimized ePapers that Google loves.
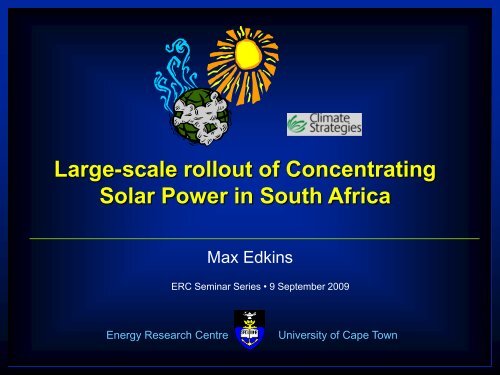
Large-scale <strong>rollout</strong> <strong>of</strong> ConcentratingSolar Power in South AfricaMax EdkinsERC Seminar Series • 9 September 2009Energy Research Centre<strong>University</strong> <strong>of</strong> <strong>Cape</strong> <strong>Town</strong>1 ERC
2008: “Peak, Plateau and Decline”Source: Lukey 20092 ERC
2012: another 10 * 100MWplants committed to3 ERC
2015: employment boost to Northern <strong>Cape</strong>4 ERC
2025: SA exporting as largest supplier <strong>of</strong> solarenergy technology5 ERC
Solar irradiation as driver for <strong>CSP</strong> <strong>rollout</strong>6 ERC
<strong>CSP</strong> Build Costs= 2.4B ZAR/64 MW= 3.75B ZAR/100 MW= 3.9B ZAR/50 MW= 7.8B ZAR/100 MW= 0.6B ZAR/11 MW= 5.1B ZAR/100 MWSource: renac 20097 ERC
<strong>CSP</strong> PlantDesignoptionsSource: WRI 20098 ERC
Cumulative <strong>CSP</strong> deployment (MW)200520062007200820092010201120122013201420152016201720182019202020212022202320242025<strong>CSP</strong> globally and in the LTMS25000200001500010000EER, 2007 (World)Sargent & Lundy,2003 (SunLab high)World Bank & GEF,2006 (high)Black & Veatch, 2006(low)<strong>CSP</strong> learningcurvesparabolic trough5-32%central receiver2-20%50000Black & Veatch, 2006(high)CleanEdge & Co-opAmerica Foundation,2008LTMS: parabolic trough = 15% & central receiver = 20%9 ERC
Large GHG savings from renewable electricitywedges <strong>of</strong> the LTMS• Renewables Target 27% by Cost 2030:LTMS Wedge(electricitysupply)(R/tCO 2 eq)Emissionssaved (MtCO 2 )<strong>CSP</strong> <strong>rollout</strong>(capacity)Renewables 27% by 2030 R 52 2,010 Mt 46 GW by2050Renewableswith learningRenewablesextendedRenewablesextended withlearningRenewablesand nuclearextended27% by 2030 - R 140 2,725 Mt 45 GW by205050% by 2050 R 92 3,285 Mt 85 GW by205050% by 2050 R 3 3,990 Mt 100 GW by205050% each(carbonneutral) by2050R 52 8,295 Mt 85 GW by205011 ERC
<strong>CSP</strong> build programmeStartScaleUpRolloutSource: adapted from LTMS 200713 ERC
The large-scale <strong>rollout</strong> <strong>of</strong> <strong>CSP</strong>Start2010 – 2015Scale-up2016 – 2020Roll-out2021-2050CO 2 -eq emissions avoided 22 Mt (
20102013201620192022202520282031203420372040204320462049Incremental cost <strong>of</strong> REFIT towards large-scale CSp <strong>rollout</strong>(2008 R billions per year)REFIT as a driver for <strong>CSP</strong> <strong>rollout</strong>• R2.10/kWh• Reviewed periodically180160• We assume its existence till2030 when <strong>CSP</strong> competitiveto coal• Also assume electricitygeneration cost to rise by 20%for next 3 years and 2%thereafter• Cumulative cost withdiminishing REFIT tariff: 5%,10% and 15% annually140120100806040200REFIT2.1REFIT2.1(5%)REFIT2.1(10%)REFIT2.1(15%)15 ERC
International SupportFinancial support most valuable (76% <strong>of</strong> survey respondents)Start2010 – 2015Scale-up2016 – 2020Roll-out2021-2050Technologyinnovation -domesticFirst plants online by 2014Eskom innovate ‘test plant’R,D&D for SA specifictechnologyWater-saving techTechnologyinnovation –internationalR 10 billion R 2 billion annually R 2-5 billion annuallyREFIT –domesticREFIT –internationalEnhance REPA capacityFacilitate feasibility studiesR 50 million annuallyAnd R 240 million annuallyREFIT supportProportion <strong>of</strong> REFIT cost estimates: Max R 30-90billion in 2030Gridexpansion–domesticLinking north-west to grid‘backbone’Five additionaltransmission lines+/- 60 more transmissionlinesGridexpansion–international??? R 5 billion ??? R 60 billion ??? R 350-400 billion19 ERC
Additional indicators• Levellised cost <strong>of</strong> electricity from <strong>CSP</strong>• Assess learning rate <strong>of</strong> technology – in line with 15% and20% assumptions?• indicator <strong>of</strong> cost effectiveness <strong>of</strong> <strong>rollout</strong>• REFIT functionality• Early indicator to assess effectiveness <strong>of</strong> SA RE policy• Grid-readiness• Indicators highlighting SA’s “enabling environment” for<strong>CSP</strong> <strong>rollout</strong>21 ERC