Solar electrification by the concession approach in rural Limpopo ...
Solar electrification by the concession approach in rural Limpopo ...
Solar electrification by the concession approach in rural Limpopo ...

Create successful ePaper yourself
Turn your PDF publications into a flip-book with our unique Google optimized e-Paper software.
SUPPORTING INNOVATION IN THE DELIVERY OF ENERGY SERVICESTO THE RURAL POOR:OFF-GRID ELECTRIFICATION VIA CONCESSIONS IN RURAL SOUTH AFRICA<strong>Solar</strong> <strong>electrification</strong> <strong>by</strong> <strong>the</strong> <strong>concession</strong><strong>approach</strong> <strong>in</strong> <strong>rural</strong> <strong>Limpopo</strong> prov<strong>in</strong>cePHASE 1. BASELINE SURVEYApril 2005ENERGY RESEARCH CENTREUniversity of Cape Town
<strong>Solar</strong> <strong>electrification</strong> <strong>by</strong> <strong>the</strong> <strong>concession</strong> <strong>approach</strong> <strong>in</strong> <strong>rural</strong> <strong>Limpopo</strong> prov<strong>in</strong>ce: Executive summaryExecutive summaryThe Energy Research Centre (ERC) at <strong>the</strong> University of Cape Town has been <strong>in</strong>volved <strong>in</strong> a researchproject to monitor, evaluate and support <strong>the</strong> off-grid <strong>electrification</strong> programme <strong>in</strong>itiated <strong>by</strong> <strong>the</strong>Department of M<strong>in</strong>erals and Energy <strong>in</strong> 1999 <strong>in</strong> three prov<strong>in</strong>ces of South Africa. The energy servicecompany (ESCO) <strong>approach</strong>, where a company <strong>in</strong>stalls and ma<strong>in</strong>ta<strong>in</strong>s solar home systems for feepay<strong>in</strong>gclients was selected. Private companies were granted exclusive <strong>concession</strong>s to operate as <strong>the</strong>energy service companies <strong>in</strong> <strong>the</strong> selected areas. A government subsidy was provided to reduce <strong>the</strong>connection and service fees payable <strong>by</strong> <strong>the</strong> users.The three <strong>concession</strong> areas are <strong>in</strong> <strong>the</strong> nor<strong>the</strong>ast of KwaZulu Natal prov<strong>in</strong>ce, <strong>the</strong> nor<strong>the</strong>rn part of<strong>Limpopo</strong> prov<strong>in</strong>ce, and <strong>the</strong> nor<strong>the</strong>rn part of Eastern Cape prov<strong>in</strong>ce. ERC has been work<strong>in</strong>g <strong>in</strong> <strong>the</strong>se<strong>concession</strong> areas s<strong>in</strong>ce May 2001, pr<strong>in</strong>cipally through conduct<strong>in</strong>g surveys with <strong>the</strong> aim ofunderstand<strong>in</strong>g <strong>the</strong> social impacts and <strong>the</strong> <strong>in</strong>stallation and function<strong>in</strong>g of <strong>the</strong> solar home systems <strong>in</strong>order to <strong>in</strong>form relevant stakeholders.This report is part of a series on <strong>the</strong> impact of <strong>the</strong> solar home systems. The first report 1 dealt with <strong>the</strong>first survey results from Eastern Cape Prov<strong>in</strong>ce. Follow<strong>in</strong>g <strong>the</strong> above first set of reports, a second setof follow-up reports based on subsequent surveys <strong>in</strong> <strong>the</strong> three prov<strong>in</strong>ces will be prepared. Thesecond set of reports will explore <strong>the</strong> trends over <strong>the</strong> last two to three years follow<strong>in</strong>g <strong>in</strong>stallation of<strong>the</strong> solar home systems. A summary report will conclude <strong>the</strong> series and will compare <strong>the</strong> f<strong>in</strong>d<strong>in</strong>gsfrom <strong>the</strong> three prov<strong>in</strong>ces.The general background to <strong>the</strong> evolution of government policy on provid<strong>in</strong>g universal access toelectricity, and <strong>the</strong> <strong>in</strong>tegration of solar <strong>electrification</strong> is provided <strong>in</strong> <strong>the</strong> first report as well as anumber of papers and articles.The objectives of <strong>the</strong> household surveys.The household surveys aimed to explore <strong>the</strong> impacts of solar home systems over time, ascerta<strong>in</strong><strong>in</strong>g<strong>the</strong> nature and extent of any fuel switch<strong>in</strong>g associated with <strong>the</strong> solar home systems, impacts on <strong>rural</strong>livelihoods, and attitudes of households exposed to solar home systemsA total of 280 households were <strong>in</strong>terviewed <strong>in</strong> <strong>the</strong> survey for this report. 121 of <strong>the</strong> households weresolar home system-electrified, 45 were grid-electrified, and 114 were non-electrified. The gridelectrifiedand non-electrified households were used as control groups. All <strong>the</strong> households are <strong>in</strong>Duvhuledza, Tshamutilikwa, and Mbahe.Characteristics of <strong>the</strong> households surveyed<strong>Solar</strong> home system users were found to be <strong>the</strong> wealthiest; <strong>the</strong> mean monthly <strong>in</strong>come for solar homesystem users was found to be R1543, compared to R1163 for grid users and R819 for non-electrifiedhouseholds. That solar home system users should have <strong>the</strong> highest mean monthly <strong>in</strong>come is notsurpris<strong>in</strong>g because to qualify for <strong>the</strong>se systems <strong>the</strong>y had to have regular <strong>in</strong>come. The mean monthlyper capita <strong>in</strong>come showed a similar pattern, be<strong>in</strong>g highest for <strong>the</strong> solar home system-users. Thehousehold size of solar home system-users was found to be <strong>the</strong> largest, which was unexpected s<strong>in</strong>cewealthier households tend to be smaller. The reason for this may be <strong>the</strong> presence of more relatives at<strong>the</strong>se wealthier households. The trend between <strong>the</strong> o<strong>the</strong>r sub-samples is more conventional, with <strong>the</strong>poorer non-electrified households hav<strong>in</strong>g larger household sizes.Installation of <strong>the</strong> solar home systemsInstallation for solar home systems were found to have been quite prompt, with over 80% ofrespondents gett<strong>in</strong>g <strong>the</strong>ir systems <strong>in</strong>stalled <strong>in</strong> one month or less follow<strong>in</strong>g application. Grid users hadto wait longer, which may be <strong>the</strong> result of <strong>the</strong> more extensive <strong>in</strong>frastructural developments that haveto go with grid extension. <strong>Solar</strong> home system-users were largely satisfied with <strong>in</strong>stallation of <strong>the</strong>irsystems.1ERC. 2004. <strong>Solar</strong> Electrification <strong>by</strong> <strong>the</strong> Concession Approach <strong>in</strong> <strong>the</strong> Rural Eastern Cape: Phase 1. Basel<strong>in</strong>eSurvey.ii
<strong>Solar</strong> <strong>electrification</strong> <strong>by</strong> <strong>the</strong> <strong>concession</strong> <strong>approach</strong> <strong>in</strong> <strong>rural</strong> <strong>Limpopo</strong> prov<strong>in</strong>ce: Executive summaryCustomer satisfaction and ambivalenceBy far <strong>the</strong> most liked feature of solar home systems was better light. Some ambivalence <strong>in</strong> attitudescan be expected s<strong>in</strong>ce <strong>the</strong>re are clear benefits and some frustrat<strong>in</strong>g limitations that come with solarhome systems. The frustration is compounded <strong>by</strong> <strong>in</strong>itial ignorance of <strong>the</strong> capabilities of PV basedsystems. The expectation that <strong>the</strong> grid will be com<strong>in</strong>g and <strong>the</strong> overwhelm<strong>in</strong>g preference for gridelectricity contribute to <strong>the</strong> ambivalence.The <strong>in</strong>ability of solar home system to meet <strong>the</strong>rmal needs such as cook<strong>in</strong>g is one of <strong>the</strong> technology’sgreatest shortcom<strong>in</strong>gs consider<strong>in</strong>g <strong>the</strong> importance of this service. Most solar home system ownersseem to be unaware that grid-users face a similar dilemma <strong>in</strong> that <strong>the</strong> cost of grid electricityprecluded some 80% of <strong>the</strong>m from us<strong>in</strong>g electricity for cook<strong>in</strong>g.Problems with <strong>the</strong> solar home systemsAbout 40% of solar home system-users had had a problem with <strong>the</strong>ir systems. A similar percentage(37%) felt <strong>the</strong>y were able to identify <strong>the</strong> problem and virtually all had reported <strong>the</strong> problems. Thereports were generally made to <strong>the</strong> energy store, but a few respondents reported to <strong>the</strong> chief, <strong>the</strong>technician, and <strong>the</strong> fee collector. How reliably or promptly <strong>the</strong>se reports reached <strong>the</strong> service provideris not clear. 16% of <strong>the</strong> problems were unresolved at <strong>the</strong> time of <strong>the</strong> survey, but it is not possible tosay for how long <strong>the</strong> problems had been outstand<strong>in</strong>g.<strong>Solar</strong> home system-users pay much more than <strong>the</strong> o<strong>the</strong>r households <strong>in</strong> <strong>the</strong> o<strong>the</strong>r sub-samples and<strong>the</strong>y were frustrated <strong>by</strong> this high cost. Their ma<strong>in</strong> suggestion for mak<strong>in</strong>g payment easier was toreduce <strong>the</strong> service fee. Ano<strong>the</strong>r major concern was <strong>the</strong> limitation <strong>in</strong> both what can be used with solarhome system, <strong>the</strong> number of rooms that could be supplied with power, and <strong>the</strong> time limitation onpower availability. The need to purchase o<strong>the</strong>r fuels adds to <strong>the</strong> cost of energy for solar home systemhouseholds.Cost, limited power and <strong>the</strong> cost of o<strong>the</strong>r necessary fuels<strong>Solar</strong> home system users pay much more per month(R128) than <strong>the</strong> o<strong>the</strong>r sub-samples for <strong>the</strong>irenergy, a figure more than twice as much as grid-users (R59) who spend <strong>the</strong> least on energy among<strong>the</strong> three sub-samples. <strong>Solar</strong> home system-users are <strong>the</strong> only sub-sample with a mean monthlyexpenditure on energy that is above <strong>the</strong> overall mean of R93. The service level received <strong>by</strong> gridusers is practically unlimited for household level needs.<strong>Solar</strong> home system-users have to spend an additional R70 for o<strong>the</strong>r fuels on top of <strong>the</strong> R58 paid for<strong>the</strong> solar home system each month. 68% of <strong>the</strong>m thought <strong>the</strong>y should be pay<strong>in</strong>g no more than R30per month for <strong>the</strong> service, which would be comparable to what grid users pay on average for <strong>the</strong>irelectricity.The cost of fuelsGas and fuelwood were found to be particularly expensive for <strong>the</strong> households who used <strong>the</strong>m.Fuelwood was collected free <strong>by</strong> some 95% of households. Gas was more prevalent among solarhome system-users because <strong>the</strong>ir <strong>in</strong>comes allowed <strong>the</strong>m to use this expensive fuel. The meanmonthly expenditures <strong>by</strong> solar home system-owners us<strong>in</strong>g <strong>the</strong> specified fuels were found to be aboutR21 on candles, R42 on paraff<strong>in</strong>, R129 on gas, R73 on fuelwood, R46 on dry cell batteries, and R11on car batteries (charg<strong>in</strong>g).Changes <strong>in</strong> fuel use after receiv<strong>in</strong>g solar home system or grid electricityThe major impact on fuel use was reduction <strong>in</strong> <strong>the</strong> use of light<strong>in</strong>g fuels, candles, and to a lesserextent paraff<strong>in</strong>. Because solar home systems cannot usually cover all rooms, candles and paraff<strong>in</strong>cont<strong>in</strong>ue to be used for <strong>the</strong> o<strong>the</strong>r rooms and also when <strong>the</strong> solar home system cuts out. No impacthad been made to <strong>the</strong> fuels supply<strong>in</strong>g most household energy, i.e. those fuels meet<strong>in</strong>g <strong>the</strong> <strong>the</strong>rmalneeds, ma<strong>in</strong>ly cook<strong>in</strong>g, water heat<strong>in</strong>g, and space heat<strong>in</strong>g. Thus, <strong>the</strong> range of fuels used <strong>by</strong> solarhome system-owners has not been altered. The need for supply of <strong>the</strong>se fuels more conveniently stillneeds to be addressed.iii
<strong>Solar</strong> <strong>electrification</strong> <strong>by</strong> <strong>the</strong> <strong>concession</strong> <strong>approach</strong> <strong>in</strong> <strong>rural</strong> <strong>Limpopo</strong> prov<strong>in</strong>ce: Executive summaryChanges <strong>in</strong> people’s livesIt has been stated that improved light<strong>in</strong>g was <strong>the</strong> major impact of solar home systems on households.This means that even without solar home system, light<strong>in</strong>g is possible, albeit at an <strong>in</strong>ferior level. Theo<strong>the</strong>r major impacts have been <strong>in</strong> <strong>in</strong>formation and enterta<strong>in</strong>ment through watch<strong>in</strong>g television andlisten<strong>in</strong>g to <strong>the</strong> radio with greater convenience than would be <strong>the</strong> case with car batteries, or dry cellbatteries. The overwhelm<strong>in</strong>g preference for grid electricity however <strong>in</strong>dicates that solar homesystem-users are not yet content.The satisfaction of grid-users, shown <strong>by</strong> <strong>the</strong>ir very limited desire to switch to any o<strong>the</strong>r fuel confirmsgrid electricity as <strong>the</strong> ‘ultimate’ source of energy for most households.The reach of solar home system is generally limited to <strong>the</strong> more affluent <strong>rural</strong> households who canmeet <strong>the</strong> service fee requirements. This is likely to rema<strong>in</strong> <strong>the</strong> case <strong>in</strong>to <strong>the</strong> foreseeable future as longas users must pay for <strong>the</strong> service.Key questions and issuesThe dissem<strong>in</strong>ation of <strong>in</strong>formation to potential solar home system users needs to be improved so thatall <strong>the</strong> characteristics of <strong>the</strong> technology are well understood. The way <strong>in</strong> which <strong>in</strong>formation ispackaged needs to be appropriate for <strong>the</strong> level of literacy of <strong>the</strong> <strong>in</strong>tended consumer of <strong>the</strong><strong>in</strong>formation.The issue of ownership of solar home system needs to be addressed <strong>in</strong> <strong>the</strong> long term. Perhaps anarrangement where<strong>by</strong> <strong>the</strong> ownership of <strong>the</strong> solar home system passes to <strong>the</strong> household, coupled withtra<strong>in</strong><strong>in</strong>g of local freelance technicians with a system of certification may be useful.That solar home systems fail to reach <strong>the</strong> poor households is a good case for an <strong>in</strong>tegrated <strong>approach</strong>with a focus on poverty reduction. This <strong>approach</strong> will entail collaboration across many developmentarms of government and o<strong>the</strong>r non-governmental stakeholders. The target<strong>in</strong>g of <strong>the</strong> subsidy to ensureaccess <strong>by</strong> <strong>the</strong> poor is a major challenge.The <strong>approach</strong> of cluster<strong>in</strong>g of <strong>in</strong>stallation of solar home systems needs to be emphasized more as oneway to reduce <strong>the</strong> cost of ma<strong>in</strong>tenance and <strong>the</strong>re<strong>by</strong> improve access and service to customers <strong>by</strong> <strong>the</strong>service providers.The prospects of <strong>the</strong> grid reach<strong>in</strong>g target areas for solar home system dissem<strong>in</strong>ation need to befrankly communicated to avoid a wait-and see attitude among users, and to avoid bitterness amongthose who accept solar home systems only to see <strong>the</strong> grid arrive soon afterwards. This can lead to asense of hav<strong>in</strong>g been cheated.Policy recommendationsThe dissem<strong>in</strong>ation of <strong>in</strong>formation needs to be ref<strong>in</strong>ed so that <strong>in</strong>formation is packaged <strong>in</strong> a way thatmakes <strong>the</strong> <strong>in</strong>formation easily accessible to <strong>the</strong> target group. The level of literacy is not high soimportant documents like contracts and user manuals have to be suitably simplified. Contracts arelegal documents and are necessarily complex, but <strong>the</strong>re is no reason why short, pla<strong>in</strong> languageversions cannot be provided as well to enable <strong>the</strong> gist of <strong>the</strong> conditions to be understood. Examplesof this <strong>approach</strong> are <strong>the</strong> South African Lotto pamphlets, or most onl<strong>in</strong>e computer software licenceagreements where <strong>the</strong> reader is given a simplified pla<strong>in</strong> language version of <strong>the</strong> terms with <strong>the</strong> optionof see<strong>in</strong>g <strong>the</strong> full details if he/she wishes.The process of select<strong>in</strong>g areas where solar <strong>electrification</strong> is to be <strong>in</strong>troduced needs to be reviewed.The question that needs to be answered is whe<strong>the</strong>r <strong>the</strong>re will be grid <strong>electrification</strong> of all <strong>rural</strong>households; and if so over what period. Priority should be given to those areas with <strong>the</strong> remotestchance of be<strong>in</strong>g grid electrified, and this should be officially made clear to <strong>the</strong> recipients.Introduc<strong>in</strong>g solar home systems where users have been told that <strong>the</strong> grid is com<strong>in</strong>g <strong>in</strong> a few yearscauses confusion and frustration for both service providers and users.Consideration needs to be given to <strong>the</strong> sett<strong>in</strong>g up of fora for <strong>the</strong> exchange of experiences and ideasbetween service providers, and similarly for recipients of solar home systems and <strong>the</strong> techniciansserv<strong>in</strong>g <strong>the</strong>m. Exchange visits would be a useful way to facilitate exchange of experiences betweencommunities.If solar home systems are meant for <strong>the</strong> <strong>rural</strong> poor, <strong>the</strong> results so far show that <strong>the</strong>y are reach<strong>in</strong>g <strong>the</strong>wealthiest <strong>rural</strong> households. Are <strong>the</strong>se households <strong>the</strong> best recipients for subsidies? Attempts toiv
<strong>Solar</strong> <strong>electrification</strong> <strong>by</strong> <strong>the</strong> <strong>concession</strong> <strong>approach</strong> <strong>in</strong> <strong>rural</strong> <strong>Limpopo</strong> prov<strong>in</strong>ce: Executive summary<strong>in</strong>troduce cheaper systems <strong>by</strong> reduc<strong>in</strong>g <strong>the</strong>ir size are not likely to succeed s<strong>in</strong>ce more frustration willresult from <strong>the</strong> even lower service level. It has been established that <strong>the</strong> current service level of solarhome systems is frustrat<strong>in</strong>g owners, yet <strong>the</strong>y feel that <strong>the</strong> fees are too high. Higher capacity systemswill cost more and become even more <strong>the</strong> preserve of <strong>the</strong> <strong>rural</strong> elite. Increas<strong>in</strong>g capital subsidies mayallow poorer households access, but will <strong>the</strong>y be able to pay <strong>the</strong> costs of ma<strong>in</strong>tenance and repair? Itmay well be asked if solar home systems are what <strong>the</strong> poor need. Often <strong>the</strong>re are many morepress<strong>in</strong>g needs, and an <strong>in</strong>tegrated and bottom up <strong>approach</strong> to <strong>the</strong> plann<strong>in</strong>g of service delivery mayaddress <strong>the</strong> problems more successfully.There seems to be a case for <strong>the</strong> exploration of ownership schemes for solar home systems. This isbecause <strong>the</strong>re is as yet no sure recipe for successful dissem<strong>in</strong>ation, and not enough <strong>in</strong>formation isavailable <strong>in</strong>ternationally to prescribe a w<strong>in</strong>n<strong>in</strong>g <strong>approach</strong>.The fact that <strong>the</strong>re are many lessons and need for corrective steps po<strong>in</strong>ts to <strong>the</strong> need for pilotschemes so that lessons are learnt before full scale implementation is attempted. This will conta<strong>in</strong>costs and result <strong>in</strong> less frustration for both service providers and users.v
Table of contentsExecutive summaryAcknowledgementsMap of part of <strong>Limpopo</strong> prov<strong>in</strong>ce, show<strong>in</strong>g survey areasiixxi1. Introduction 12. Socio-economic context of <strong>rural</strong> <strong>electrification</strong> <strong>in</strong> <strong>Limpopo</strong> prov<strong>in</strong>ce 12.1 Samples and sub-samples of SHS users, grid-users and households without electricity 12.2 Income levels of different sub-samples, sizes of households and per capita <strong>in</strong>come 22.3 Sources of Income 52.4 Gender of household head 62.5 Type and size of homestead 62.6 Employment status of household heads 72.7 Migration: Household members liv<strong>in</strong>g away from home 73. Ma<strong>in</strong> end uses of various fuel/energy sources 83.1 Ownership and use of electrical appliances 83.1.1 Light<strong>in</strong>g: Ma<strong>in</strong> fuels presently used and fuels households would like to switchto 113.1.2 Cook<strong>in</strong>g: Ma<strong>in</strong> fuels presently used and fuels households would like to switchto 113.1.3 Water heat<strong>in</strong>g: Ma<strong>in</strong> fuels presently used and fuels households would like toswitch to 113.1.4 Refrigeration: Ma<strong>in</strong> fuels presently used and fuels households would like toswitch to 113.1.5 Media applications: Ma<strong>in</strong> fuels presently used and fuels households would liketo switch to 113.2 General observations on use and preference for ma<strong>in</strong> fuels 124. Application for and <strong>in</strong>stallation of non-grid and grid electricity 134.1 Application for service 134.2 4.2 <strong>Solar</strong> home system <strong>in</strong>stallation 134.2.1 Knowledge of solar home system 134.3 SHS Ownership 144.4 Service contract 144.5 Service fees 155. <strong>Solar</strong> electricity, grid electricity use, households expectations and satisfaction 165.1 Customer ‘satisfaction’ measured as a dichotomy 165.2 SHS electricity use 165.2.1 Will<strong>in</strong>gness to pay more for a larger system 165.3 Expectation concern<strong>in</strong>g appliances 175.4 Service level and problems with SHS 185.5 Likes and dislikes about <strong>the</strong> SHS 196. Payment for electricity services 206.1 Frequency of purchase of tokens 20
7. Electrical appliances owned <strong>by</strong> SHS-users and grid-users 237.1 Ownership and use 238. General use of fuels and energy sources 248.1 Costs and quantities 248.2 Costs and quantities of o<strong>the</strong>r fuels besides electricity 248.3 Sources of purchased fuels 258.3.1 Distances and cost of return journeys to purchase fuels 258.4 Estimated fuel replacement with solar or grid electricity 269. Household light<strong>in</strong>g <strong>in</strong> practice 289.1 Coverage of household light<strong>in</strong>g (number of rooms, number of lights) 289.2 When lights are switched on and off (differences between seasons) 289.3 Attitudes towards electricity waste 289.4 Light<strong>in</strong>g quality comparisons between different fuels 299.5 Activities for which SHS lights are used 299.6 Inside and outside lights 2910. Socio-economic impacts of SHS and grid <strong>electrification</strong> 3010.1 Energy expenditure of households 3010.2 The proportion of household budget devoted to fuels and electricity 3110.3 Information: Extent of use of radio and TV 3210.4 Enterta<strong>in</strong>ment 3310.5 Education (extension of times of children’s homework) 3310.6 Changes <strong>in</strong> lives 3410.7 Contribution to job creation 3511. Conclusions and key issues 3611.1 The objectives of <strong>the</strong> research 3611.2 Characteristics of <strong>the</strong> households surveyed 3611.3 Installation of <strong>the</strong> SHSs 3611.4 Customer satisfaction and ambivalence 3611.5 Problems with <strong>the</strong> SHSs 3711.6 Cost, limited power and <strong>the</strong> cost of o<strong>the</strong>r necessary fuels 3711.7 The cost of fuels 3811.8 Changes <strong>in</strong> fuel use after receiv<strong>in</strong>g SHS or grid electricity 3811.9 Changes <strong>in</strong> people’s lives 3911.10 Key questions and issues 3912. Policy recommendations 40References 41Appendices1. Sunrise and sunset times (with twilight) for Polokwane <strong>in</strong> <strong>Limpopo</strong> prov<strong>in</strong>ce 422. Selected energy data for <strong>Limpopo</strong> prov<strong>in</strong>ce from Statistics SA 2001 Census 43
List of figuresFigure 2.2: Comparison of mean <strong>in</strong>come accord<strong>in</strong>g to sub-samples 3Figure 2.3: Comparison of per capita monthly <strong>in</strong>come across sub-samples 4Figure 2.4: Grouped per capita monthly <strong>in</strong>comes of all three sub-samples 4Figure 3.1: Ma<strong>in</strong> fuels currently used <strong>by</strong> SHS users for given end uses 8Figure 3.2: Ma<strong>in</strong> fuels to which SHS users would like to switch to for given end uses 8Figure 3.3: Ma<strong>in</strong> fuels currently used <strong>by</strong> grid users 9Figure 3.4: Ma<strong>in</strong> fuels to which grid-electrified households would like to switch to for givenend uses 9Figure 3.5: Ma<strong>in</strong> fuels currently used <strong>by</strong> non-electrified households 10Figure 3.6: Ma<strong>in</strong> fuels to which non-electrified households would like to switch 10Figure 8.1: Mean monthly households expenditure on each fuel accord<strong>in</strong>g to sub-samples,clustered <strong>by</strong> fuel; for those households that use <strong>the</strong> fuel <strong>in</strong> question 24Figure 8.2: Mean monthly households expenditure on each fuel accord<strong>in</strong>g to sub-samples,clustered <strong>by</strong> sub-sample 25Figure 10.1: Total monthly expenditure on energy <strong>by</strong> sub-sample 30Table 10.2: Scatter plot of <strong>in</strong>come vs expenditure for all households <strong>in</strong> all sub-samples 31Figure 10.3: Percentage of total monthly <strong>in</strong>comespent on energy (all households and <strong>by</strong> subsample)32List of tablesTable 2.1: Number of households <strong>in</strong>terviewed <strong>in</strong> different communities <strong>in</strong> <strong>Limpopo</strong> prov<strong>in</strong>ce 1Figure 2.1: Mean monthly <strong>in</strong>come of all households 2Table 2.2: Mean <strong>in</strong>come (rand) accord<strong>in</strong>g to sub-samples 2Table 2.3: Household size accord<strong>in</strong>g to sub-sample 3Table 2.4: Mean per capita <strong>in</strong>come (Rands) accord<strong>in</strong>g to sub-samples 5Table 2.5: Sources of <strong>in</strong>come accord<strong>in</strong>g to sub-samples 5Table 2.6: Highest education level of household head accord<strong>in</strong>g to sub-samples 5Table 2.7: Age categories of household head 6Table 2.8: Type of homestead 6Table 2.9: Employment status of household head accord<strong>in</strong>g to sub-samples 7Table 2.10: Absent household members and related issues 7Table 4.1: Levels of understand<strong>in</strong>g of <strong>the</strong> SHS 13Table 4.2: Recollection of hav<strong>in</strong>g obta<strong>in</strong>ed written <strong>in</strong>formation concern<strong>in</strong>g <strong>the</strong> SHS 14Table 4.3: Knowledge of ownership of <strong>the</strong> SHS 14Table 4.4: Knowledge of <strong>the</strong> contract with <strong>the</strong> service provider 14Table 4.5: Amount per month SHS-users th<strong>in</strong>k <strong>the</strong>y should pay for <strong>the</strong> fee for service token 15Table 5.1: Levels of satisfaction with different aspects of <strong>the</strong> SHS 16Table 5.2: Users’ views of use of a larger system 16Table 5.3: First appliances SHS households expected to use with SHS 17
Table 5.4: Customers’ explanation for satisfaction or dissatisfaction with <strong>the</strong> appliances thatcan be used with <strong>the</strong> SHS 17Table 5.6: Where problems with SHS are reported 18Table 5.7: Number of times have had a problem 18Table 5.8: Frequency with which problems were mentioned 19Table 5.9: Frequency of checks on <strong>the</strong> SHS 19Table 6.1: When <strong>the</strong> token is bought 20Table 6.2: Persons who pay for <strong>the</strong> token 20Table 6.3: Place where person buy<strong>in</strong>g <strong>the</strong> token lives 20Table 6.4: Does <strong>the</strong> person buy<strong>in</strong>g <strong>the</strong> token earn a regular <strong>in</strong>come? 21Table 6.5: Customer suggestions to make payment easier 21Table 6.6: Expected duration of payment for SHS 21Table 6.7: If <strong>the</strong> outlet has been closed 21Table 6.8: Distance to outlet where token is purchased 22Table 7.1: Ownership of electrical appliances: SHS and grid-users 23Table 7.2: Ownership and use of TV: SHS-users compared with grid-users and non-electrifiedhouseholds. 23Table 8.1: Amount paid monthly for <strong>the</strong> electricity token (grid users) 24Table 8.2: Where paraff<strong>in</strong> and gas are bought accord<strong>in</strong>g to fuel type and sub-samples 25Table 8.3: Average distances travelled to purchase fuels and average cost of <strong>the</strong> return trip 26Table 8.4: Fuels used less s<strong>in</strong>ce obta<strong>in</strong><strong>in</strong>g solar or grid electricity 26Table 8.5: Fuels used less s<strong>in</strong>ce obta<strong>in</strong><strong>in</strong>g solar or grid electricity 27Table 8.6: Changes <strong>in</strong> expenditure on fuels s<strong>in</strong>ce obta<strong>in</strong><strong>in</strong>g solar or grid electricity 27Table 9.1: Activities us<strong>in</strong>g solar or grid light<strong>in</strong>g at <strong>the</strong> time of <strong>the</strong> survey 29Table 10.1: Total monthly expenditure (R) on all fuels exclud<strong>in</strong>g electricity 30Table 10.2: Monthly expenditure (R) on all fuels <strong>in</strong>clud<strong>in</strong>g electricity 31Table 10.3: Proportion of <strong>in</strong>come spent on all fuels accord<strong>in</strong>g to sub-samples 31Table 10.4: Household members who watch television most 32Table 10.6: Persons <strong>in</strong> <strong>the</strong> household study<strong>in</strong>g or do<strong>in</strong>g homework 33Table 10.7: Length of time <strong>the</strong>y study 33Table 10.8: Use of solar light when study<strong>in</strong>g 33Table 10.9: If SHS and grid electricity changes respondent’s lives 34Table 10.10: Most important changes result<strong>in</strong>g from solar power and grid electricity 34Table 10.11: Are <strong>the</strong>re th<strong>in</strong>gs <strong>the</strong> household cannot buy anymore s<strong>in</strong>ce obta<strong>in</strong><strong>in</strong>g electricity 34Table 10.12: Selected th<strong>in</strong>gs households are unable to buy any more 35Table 10.13: Would advise o<strong>the</strong>rs to get a SHS or grid electricity 35
AcknowledgementsWe acknowledge <strong>the</strong> advice and many discussions held with <strong>the</strong> DME and <strong>the</strong> NER <strong>in</strong> <strong>the</strong> course ofthis research.In <strong>the</strong> forefront, recognition must be given of <strong>the</strong> work of Yaw Afrane-Okese for <strong>the</strong> immensepreparatory work and fieldwork he accomplished until August 2003. He was <strong>in</strong>itially helped <strong>by</strong>Cecile Thom (who <strong>in</strong>itiated <strong>the</strong> project) and Njeri Wamukonya <strong>in</strong> prepar<strong>in</strong>g a very detailedprogramme and research design that steered <strong>the</strong> research over <strong>the</strong> years.Our special thanks must be extended to <strong>Solar</strong>vision and <strong>the</strong>ir staff who devoted much of <strong>the</strong>ir time toanswer<strong>in</strong>g our questions and keep<strong>in</strong>g us <strong>in</strong>formed of <strong>the</strong> Company’s development. They provided<strong>in</strong>valuable assistance <strong>in</strong> locat<strong>in</strong>g a large sample of <strong>the</strong>ir customers and assist<strong>in</strong>g us with <strong>the</strong> <strong>in</strong>itialvisits <strong>in</strong> 2002 and return visits made <strong>in</strong> 2004.We also thank <strong>the</strong> Outlet staff for <strong>the</strong>ir help.Our special thanks go to <strong>the</strong> team of <strong>in</strong>terviewers who had to work exceptionally hard, to <strong>the</strong>community leaders who gave us much of <strong>the</strong>ir time and to all <strong>the</strong> households who so generouslyprovided <strong>the</strong> answers to a large number of questions.We must extend our thanks to <strong>the</strong> research team, especially to Nthabiseng Mohlakoana and JocelynMuller who prepared and assisted <strong>in</strong> not only <strong>the</strong> long field trips but assisted <strong>in</strong> <strong>the</strong> tra<strong>in</strong><strong>in</strong>g of<strong>in</strong>terviewers and <strong>the</strong> data capture. Margaret Mat<strong>in</strong>ga assisted <strong>in</strong> <strong>the</strong> <strong>in</strong>itial stages of compil<strong>in</strong>g <strong>the</strong>report.Our thanks go to all members of <strong>the</strong> research team that was led <strong>by</strong> Gisela Prasad and Bill Cowan.Gisela Prasad deserves particular mention for provid<strong>in</strong>g detailed comments for <strong>the</strong> improvement of<strong>the</strong> draft report. Hazel Rann<strong>in</strong>ger did much to provide <strong>the</strong> template and valuable guidance on whichthis report is based.The research would not have been possible without <strong>in</strong>itial fund<strong>in</strong>g from <strong>the</strong> Shell Foundation andour gratitude goes to <strong>the</strong> Foundation for its <strong>in</strong>itial support.Last but perhaps most of all thanks must go to <strong>the</strong> local leadership and households <strong>in</strong> <strong>Limpopo</strong>prov<strong>in</strong>ce who make this type of research possible <strong>by</strong> will<strong>in</strong>gly receiv<strong>in</strong>g <strong>the</strong> research teams andsubmitt<strong>in</strong>g to exhaustive <strong>in</strong>terviews. We hope that our endeavours will contribute to <strong>the</strong> delivery ofbetter services that more effectively meet <strong>the</strong>ir needs.Maxwell Mapako was responsible for <strong>the</strong> data analysis and writ<strong>in</strong>g of this report.x
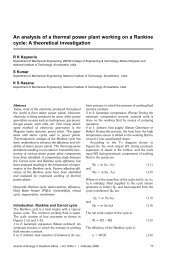
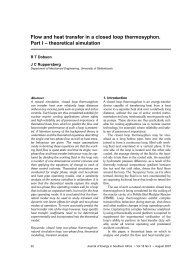
Map of part of <strong>Limpopo</strong> prov<strong>in</strong>ce,show<strong>in</strong>g survey areasScale 1:500 000Source: Automobile Association of South Africa, 2003The survey areas are around Thohoyandou. Some of <strong>the</strong> local place names mentioned <strong>in</strong> surveyquestionnaires and shown on <strong>the</strong> above map <strong>in</strong>clude Sibasa, Nwanedi, Tshamavhudzi andFolovhodwe.xi
<strong>Solar</strong> <strong>electrification</strong> <strong>by</strong> <strong>the</strong> <strong>concession</strong> <strong>approach</strong> <strong>in</strong> <strong>rural</strong> <strong>Limpopo</strong> prov<strong>in</strong>ce 11. IntroductionThe Energy Research Centre (ERC) at <strong>the</strong> University of Cape Town has been <strong>in</strong>volved <strong>in</strong> a researchproject to monitor, evaluate and support <strong>the</strong> off-grid <strong>electrification</strong> programme <strong>in</strong>itiated <strong>by</strong> <strong>the</strong>Department of M<strong>in</strong>erals and Energy <strong>in</strong> 1999 <strong>in</strong> three prov<strong>in</strong>ces of South Africa. The energy servicecompany (ESCO) <strong>approach</strong>, where a company <strong>in</strong>stalls and ma<strong>in</strong>ta<strong>in</strong>s solar home systems for feepay<strong>in</strong>gclients was selected. Private companies were granted exclusive <strong>concession</strong>s to operate as <strong>the</strong>energy service companies <strong>in</strong> <strong>the</strong> selected areas. A government subsidy was provided for to reduce<strong>the</strong> connection and service fees payable <strong>by</strong> <strong>the</strong> users.The three <strong>concession</strong> areas are <strong>in</strong> <strong>the</strong> nor<strong>the</strong>ast of KwaZulu-Natal, <strong>the</strong> nor<strong>the</strong>rn part of <strong>Limpopo</strong>prov<strong>in</strong>ce, and <strong>the</strong> nor<strong>the</strong>rn part of Eastern Cape Prov<strong>in</strong>ce. ERC has been work<strong>in</strong>g <strong>in</strong> <strong>the</strong>se<strong>concession</strong> areas s<strong>in</strong>ce May 2001, pr<strong>in</strong>cipally through conduct<strong>in</strong>g surveys with <strong>the</strong> aim ofunderstand<strong>in</strong>g <strong>the</strong> social impacts and <strong>the</strong> <strong>in</strong>stallation and function<strong>in</strong>g of <strong>the</strong> solar home systems(SHSs) <strong>in</strong> order to <strong>in</strong>form relevant stakeholders.This report is <strong>the</strong> second <strong>in</strong> a series of planned reports on <strong>the</strong> impact of <strong>the</strong> SHAs and is based on <strong>the</strong>July-August 2002 survey results of <strong>the</strong> ‘First monitor<strong>in</strong>g of <strong>Solar</strong>vision project <strong>in</strong> <strong>Limpopo</strong>Prov<strong>in</strong>ce’. The first report (ERC 2004) dealt with <strong>the</strong> first monitor<strong>in</strong>g survey results from EasternCape Prov<strong>in</strong>ce.The general background to <strong>the</strong> evolution of government policy on provid<strong>in</strong>g universal access toelectricity, and <strong>the</strong> <strong>in</strong>tegration of solar <strong>electrification</strong> is provided <strong>in</strong> <strong>the</strong> first report as well as anumber of papers and articles (a detailed account is given <strong>by</strong> Afrane Okese and Thom (2001)).2. Socio-economic context of <strong>rural</strong> <strong>electrification</strong> <strong>in</strong><strong>Limpopo</strong> prov<strong>in</strong>ceThe <strong>Limpopo</strong> Prov<strong>in</strong>ce is situated <strong>in</strong> <strong>the</strong> North-eastern part of South Africa. The prov<strong>in</strong>ce alsoborders Botswana to <strong>the</strong> west and north-west, Zimbabwe to <strong>the</strong> north, and Mozambique to <strong>the</strong> eastand Gauteng prov<strong>in</strong>ce <strong>in</strong> <strong>the</strong> South. The prov<strong>in</strong>ce covers an area of 123 910 square km which is 10.2% of national land area. The population of <strong>Limpopo</strong> prov<strong>in</strong>ce was 5 273 647 <strong>in</strong> 2001 (2001 Census).Agriculture is <strong>the</strong> ma<strong>in</strong>stay of <strong>the</strong> prov<strong>in</strong>ce’s economy and <strong>the</strong> prov<strong>in</strong>ce also has a budd<strong>in</strong>g tourism<strong>in</strong>dustry due to its array of wild life and nature reserves.Ano<strong>the</strong>r significant economic resource is m<strong>in</strong><strong>in</strong>g, with major m<strong>in</strong>eral deposits <strong>in</strong>clud<strong>in</strong>g plat<strong>in</strong>umgroup metals, iron ore, chromium, high and middle grad<strong>in</strong>g cok<strong>in</strong>g coal, diamonds, antimony,phosphate and copper as well as m<strong>in</strong>eral reserves like gold, emeralds, scheelite, magnetite,vermiculite, silicon and mica among o<strong>the</strong>rs.2.1 Samples and sub-samples of SHS users, grid-users andhouseholds without electricityThe 280 households <strong>in</strong>terviewed were selected from three communities, Duvhuledza, Mbahe andTshamutilikwa, located roughly <strong>in</strong> <strong>the</strong> central part of <strong>the</strong> map. Table 2.1 presents <strong>the</strong> numbers ofhouseholds <strong>in</strong>terviewed <strong>in</strong> each community.Table 2.1: Number of households <strong>in</strong>terviewed <strong>in</strong> different communities <strong>in</strong> <strong>Limpopo</strong>prov<strong>in</strong>ceCommunity Non grid solar Grid electrified Non electrified TotalDuvhuledza 32 0 23 55Mbahe 21 22 45 88Tshamutilikwa 68 23 46 137Total 121 45 114 280ENERGY RESEARCH CENTRE
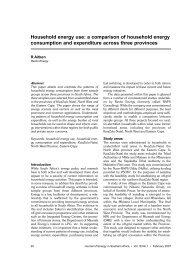
<strong>Solar</strong> <strong>electrification</strong> <strong>by</strong> <strong>the</strong> <strong>concession</strong> <strong>approach</strong> <strong>in</strong> <strong>rural</strong> <strong>Limpopo</strong> prov<strong>in</strong>ce 22.2 Income 2 levels of different sub-samples, sizes of households andper capita <strong>in</strong>comeThe overall mean <strong>in</strong>come for all households was R1245 with a median value of R950, standarddeviation R944. The difference between <strong>the</strong> mean and median suggests a skew <strong>in</strong> <strong>the</strong> <strong>in</strong>comedistribution. This is confirmed <strong>in</strong> Figure 2.1; <strong>the</strong> <strong>in</strong>come pattern shows a pronounced negative skew,<strong>in</strong>dicat<strong>in</strong>g that most households are towards <strong>the</strong> lower end of <strong>the</strong> <strong>in</strong>come scale, with very fewenjoy<strong>in</strong>g comparatively high <strong>in</strong>comes..120100No of households806040200010002000 3000 4000 5000Mean monthly <strong>in</strong>come60007000Figure 2.1: Mean monthly <strong>in</strong>come of all householdsMean <strong>in</strong>come accord<strong>in</strong>g to sub-samplesSHS-users have a mean <strong>in</strong>come that is above <strong>the</strong> R1 245 mean for all households covered <strong>in</strong> <strong>the</strong>survey, and is almost double that of <strong>the</strong> non-electrified households.Table 2.2: Mean <strong>in</strong>come (rand) accord<strong>in</strong>g to sub-samplesM<strong>in</strong>imum Maximum Mean SDSHS users 150 5200 1543 1163Grid users 60 3600 1134 799Non electrified hholds 100 3200 819 823The mean <strong>in</strong>comes can be more easily compared <strong>in</strong> Figure 2.2. The data is presented <strong>in</strong> box plots andboth mean and median values can be seen as well as <strong>the</strong> <strong>in</strong>cidence of outliers (extreme values). Themore numerous outliers among <strong>the</strong> SHS-users pull <strong>the</strong> mean fur<strong>the</strong>r from <strong>the</strong> median (most commonvalue) more than <strong>in</strong> <strong>the</strong> o<strong>the</strong>r sub-samples. Far outliers (see note to Figure 2.2) have been excludedfrom <strong>the</strong> plots <strong>in</strong> this figure.2All <strong>in</strong>come and expenditure figures <strong>in</strong> this report are <strong>in</strong> South African rands (ZAR) unless <strong>in</strong>dicated o<strong>the</strong>rwise.ENERGY RESEARCH CENTRE
<strong>Solar</strong> <strong>electrification</strong> <strong>by</strong> <strong>the</strong> <strong>concession</strong> <strong>approach</strong> <strong>in</strong> <strong>rural</strong> <strong>Limpopo</strong> prov<strong>in</strong>ce 360005000Mean monthly <strong>in</strong>come40003000200010000-1000SHS users Grid users Non electNote: Explanation of box plot figuresThe vertical l<strong>in</strong>es with diamonds show <strong>the</strong> mean value across <strong>the</strong> centre of <strong>the</strong> diamond, with <strong>the</strong>confidence <strong>in</strong>terval (95%) shown <strong>by</strong> <strong>the</strong> vertical spread of <strong>the</strong> diamond.The boxes show <strong>the</strong> median value as <strong>the</strong> middle horizontal l<strong>in</strong>e, with <strong>the</strong> angled portion show<strong>in</strong>g<strong>the</strong> confidence <strong>in</strong>terval. Box height shows <strong>the</strong> <strong>in</strong>ter–quartile range, IQR (upper, lower).Outliers are plotted as ---- up to 1.5 IQR from <strong>the</strong> median, +++ from 1.5 to 3 IQRs from median,and oooo if fur<strong>the</strong>r than 3 IQRs from <strong>the</strong> median (far outliers).Figure 2.2: Comparison of mean <strong>in</strong>come accord<strong>in</strong>g to sub-samplesSHS owners enjoy <strong>the</strong> highest mean <strong>in</strong>comes, and <strong>the</strong> non-electrified households <strong>the</strong> lowest. Thispattern can be largely expla<strong>in</strong>ed <strong>by</strong> <strong>the</strong> selection criteria for households to qualify for SHSs, aregular <strong>in</strong>come.The sizes of <strong>the</strong> households <strong>in</strong> <strong>the</strong> three sub-samples are shown <strong>in</strong> Table 2.3. The SHS-users have<strong>the</strong> highest mean size, with <strong>the</strong> grid-connected households hav<strong>in</strong>g <strong>the</strong> smallest family size. While <strong>the</strong>trend <strong>in</strong> household size between grid-users and non-electrified households tends to follow <strong>the</strong>conventional norm where poorer households tend to have larger family sizes, <strong>the</strong> apparent anomalywith respect to <strong>the</strong> SHS users needs to be explored fur<strong>the</strong>r.Table 2.3: Household size accord<strong>in</strong>g to sub-sampleSub-sample M<strong>in</strong>imum Maximum Mean SDSHS users 1 10 6.157 2.56Grid users 1 6 5.200 2.22Non electrified households 1 4 5.702 2.59ENERGY RESEARCH CENTRE
<strong>Solar</strong> <strong>electrification</strong> <strong>by</strong> <strong>the</strong> <strong>concession</strong> <strong>approach</strong> <strong>in</strong> <strong>rural</strong> <strong>Limpopo</strong> prov<strong>in</strong>ce 412001000Per capita monthly <strong>in</strong>come8006004002000-200SHS users Grid users Non electExplanation of box plot figures.The vertical l<strong>in</strong>es with diamonds show <strong>the</strong> mean value across <strong>the</strong> centre of <strong>the</strong> diamond, with <strong>the</strong>confidence <strong>in</strong>terval (95%) shown <strong>by</strong> <strong>the</strong> vertical spread of <strong>the</strong> diamond.The boxes show <strong>the</strong> median value as <strong>the</strong> middle horizontal l<strong>in</strong>e, with <strong>the</strong> angled portion show<strong>in</strong>g<strong>the</strong> confidence <strong>in</strong>terval. Box height shows <strong>the</strong> <strong>in</strong>ter–quartile range, IQR (upper, lower).Outliers are plotted as ---- up to 1.5 IQR from <strong>the</strong> median, +++ from 1.5 to 3 IQRs from median,and oooo if fur<strong>the</strong>r than 3 IQRs from <strong>the</strong> median (far outliers).Figure 2.3: Comparison of per capita monthly <strong>in</strong>come across sub-samplesThe per capita monthly <strong>in</strong>come follows a similar trend to that of total monthly <strong>in</strong>come. That SHSusersstill show <strong>the</strong> highest per capita <strong>in</strong>come despite <strong>the</strong>ir mean family size be<strong>in</strong>g <strong>the</strong> highestunderl<strong>in</strong>es <strong>the</strong> marg<strong>in</strong> <strong>by</strong> which <strong>the</strong>y exceed <strong>the</strong> <strong>in</strong>comes of <strong>the</strong> o<strong>the</strong>r sub-samples. The groupedmeans of per capita <strong>in</strong>come are compared <strong>in</strong> Figure 2.4.% of households ___70.0060.0050.0040.0030.0020.00SHS Grid Non elect10.000.00
<strong>Solar</strong> <strong>electrification</strong> <strong>by</strong> <strong>the</strong> <strong>concession</strong> <strong>approach</strong> <strong>in</strong> <strong>rural</strong> <strong>Limpopo</strong> prov<strong>in</strong>ce 5Table 2.4: Mean per capita <strong>in</strong>come (Rands) accord<strong>in</strong>g to sub-samplesM<strong>in</strong>imum Maximum Mean Std DevSHS users 19 1 050 276 215Grid users 26 2 280 220 153Non electrified households 19 850 164 1442.3 Sources of IncomeBecause of <strong>the</strong> need for regular <strong>in</strong>comes to be able to pay monthly for SHSs, it is not surpris<strong>in</strong>g that<strong>the</strong> predom<strong>in</strong>ant sources of <strong>in</strong>come among SHS households are salaried jobs, pensions and stategrants. Table 2.5 summarises <strong>the</strong> sources of <strong>in</strong>come <strong>by</strong> sub-sample.Table 2.5: Sources of <strong>in</strong>come accord<strong>in</strong>g to sub-samplesIncome sourcesSHS usersN= 121Grid usersN= 45Non-electrifiedhouseholdsN= 114Regular earn<strong>in</strong>gs salary/wages 74% 56% 54%Pensions and state grants 36% 44% 52%Own bus<strong>in</strong>ess 8% 18% 3%Piece jobs 7% 18% 24%Informal sell<strong>in</strong>g 6% 9% 24%Note: Percentages <strong>in</strong> this table do not add up to 100% because each household could<strong>in</strong>dicate multiple sources of <strong>in</strong>comeGrid users and non-electrified households have lower but similar figures for <strong>in</strong>come from salariesand wages, but differ <strong>in</strong> that <strong>the</strong> grid-users have <strong>the</strong> highest ‘own bus<strong>in</strong>ess’ figure. The survey didnot explore <strong>the</strong> specific bus<strong>in</strong>ess activities <strong>in</strong> this case, but <strong>the</strong>se could <strong>in</strong>clude electricity-dependentactivities that are only possible for this sub-sample. Non-electrified households have <strong>the</strong> highest‘<strong>in</strong>formal sell<strong>in</strong>g’ figure, and depend considerably on this and piece jobs when compared to <strong>the</strong> o<strong>the</strong>rsub-samples.Table 2.6: Highest education level of household head accord<strong>in</strong>g to sub-samplesHighest education level ofhousehold headSHS usersN=121Grid UsersN= 45Non-electrifiedhouseholds N= 114No school 34% 42% 46%Primary 9% 9% 21%Secondary 23% 20% 19%Matric 12% 13% 11%Post-matric 19% 13% 3%In all cases <strong>the</strong> proportion of household heads who did not go to school is higher than any o<strong>the</strong>reducation-related category. There is also a clear trend from SHS-users to non-electrified householdswith <strong>the</strong> percentage of households heads who did not attend school ris<strong>in</strong>g from 34% to 46%. On <strong>the</strong>o<strong>the</strong>r hand, <strong>the</strong> trend for <strong>the</strong> most educated household heads goes <strong>in</strong> <strong>the</strong> opposite direction. Thistrend correlates well with that for <strong>in</strong>come and formal employment, which is not surpris<strong>in</strong>g.ENERGY RESEARCH CENTRE
<strong>Solar</strong> <strong>electrification</strong> <strong>by</strong> <strong>the</strong> <strong>concession</strong> <strong>approach</strong> <strong>in</strong> <strong>rural</strong> <strong>Limpopo</strong> prov<strong>in</strong>ce 6Age categoriesTable 2.7: Age categories of household headSHS usersN=121Grid UsersN= 45Non-electrifiedhouseholds N= 11418-29 7% 9% 8%30-44 41% 38% 33%45-59 32% 31% 33%60+ 19% 20% 24%The dom<strong>in</strong>ance of <strong>the</strong> young-to-middle-aged household heads (30-44 and 45-59 age groups) is quitesimilar between <strong>the</strong> SHS-users and grid-users, both show<strong>in</strong>g a pronounced majority of youngerhouseholds heads. The non-electrified households show a more even spread between <strong>the</strong> ages of 30to over 60. Like <strong>the</strong> o<strong>the</strong>r sub-samples, <strong>the</strong> proportion of household heads is lowest for <strong>the</strong> under 30age group. The observed differences <strong>in</strong> <strong>the</strong> sub-samples are not particularly marked and noexplanation is immediately obvious.2.4 Gender of household headThe SHS-users have <strong>the</strong> highest proportion of male-headed households, 83%, while <strong>the</strong> o<strong>the</strong>r twosub-samples have similar and much lower figures, 64% for <strong>the</strong> grid-users and 61% for <strong>the</strong> nonelectrifiedhouseholds. On <strong>the</strong> basis of <strong>in</strong>come, <strong>the</strong> SHS-users have been found to be <strong>the</strong> wealthiest.The pattern <strong>in</strong> household heads <strong>the</strong>refore suggests that male-headed households tend to be wealthierthan female-headed households.2.5 Type and size of homesteadAlthough both <strong>the</strong> grid-users and non-electrified households show a marked dom<strong>in</strong>ance of traditionalhomesteads, <strong>the</strong> non-electrified homesteads show greater dom<strong>in</strong>ance of traditional homesteads, overtwice as many as any o<strong>the</strong>r type of homestead. In contrast, <strong>the</strong> SHS-users show dom<strong>in</strong>ance of mixedtraditional and o<strong>the</strong>r build<strong>in</strong>gs. There is a modest (13%) proportion of multiple-room brick housesamong SHS-users and grid-users. This category is much lower among <strong>the</strong> non-electrified householdsas it is more expensive than traditional structures, which are likely to be <strong>the</strong> type of homestead that<strong>the</strong> owner can build at least cost with local materials.Table 2.8: Type of homesteadType of homestead SHS Users Grid usersNon-electrifiedhouseholdsTraditional homestead 42% 58% 67%S<strong>in</strong>gle/brick house with multiple rooms 13% 13% 5%Mixture of traditional huts and o<strong>the</strong>r build<strong>in</strong>gs 45% 27% 27%Brick house and shack - 2% 1%The mean number of rooms was highest among SHS-users at 4.63 compared to 3.74 and 3.60 for <strong>the</strong>grid-users and non-electrified households respectively. The SHS-users have an extra room onaverage when compared to <strong>the</strong> o<strong>the</strong>r two sub-samples.ENERGY RESEARCH CENTRE
<strong>Solar</strong> <strong>electrification</strong> <strong>by</strong> <strong>the</strong> <strong>concession</strong> <strong>approach</strong> <strong>in</strong> <strong>rural</strong> <strong>Limpopo</strong> prov<strong>in</strong>ce 72.6 Employment status of household headsTable 2.9: Employment status of household head accord<strong>in</strong>g to sub-samplesSHS usersGrid usersNon-electrifiedhouseholdsEmployed 58% 49% 40%Unemployed 15% 9% 33%Self-employed 8% 20% 2%Housewife 19% - 3%Pensioner - 29% 21%Disability pension - - 2%Hav<strong>in</strong>g already noted <strong>the</strong> prevalence of formal employment among SHS-users, and own bus<strong>in</strong>essesamong grid-users from look<strong>in</strong>g at sources of <strong>in</strong>come, <strong>the</strong> trends shown <strong>in</strong> employment status ofhousehold heads are to be expected. The high unemployment rate (more than double that of SHSusersand more than triple that of grid-users) among non-electrified household heads partly expla<strong>in</strong>s<strong>the</strong> comparatively low <strong>in</strong>come levels found <strong>in</strong> this sub-sample. It has already been noted that SHSuserstend to have <strong>the</strong> youngest household heads, which partly expla<strong>in</strong>s <strong>the</strong> absence of pensioners forthis sub-sample.2.7 Migration: Household members liv<strong>in</strong>g away from homeThis section explores <strong>the</strong> issues around <strong>the</strong> movement of household members to o<strong>the</strong>r areas and <strong>the</strong>irimpacts on household <strong>in</strong>come. It is readily apparent that roughly half of <strong>the</strong> households <strong>in</strong> eachcategory have no members liv<strong>in</strong>g elsewhere. There is strik<strong>in</strong>g similarity across sub-samples <strong>in</strong> thischaracteristic, which may have less to do with mode of <strong>electrification</strong> than with o<strong>the</strong>r local factors.SHS-users have <strong>the</strong> highest percentage of absent household heads, which may be expla<strong>in</strong>ed <strong>by</strong> <strong>the</strong>fact that this sub-sample has <strong>the</strong> highest percentage of formally employed household heads, who arepredom<strong>in</strong>antly male. Formal jobs are generally available <strong>in</strong> towns. SHS-users were found to havepractically no contribution to household <strong>in</strong>come from non-members, and <strong>the</strong>y were alsopredom<strong>in</strong>antly not support<strong>in</strong>g absent members. Grid-users, on <strong>the</strong> o<strong>the</strong>r hand, have only half <strong>the</strong>percentage of absent of household heads, which may be partly due to <strong>the</strong> sub-sample hav<strong>in</strong>g <strong>by</strong> far<strong>the</strong> highest percentage of self-employed household heads who are most likely to work locally. Thesub-sample has, <strong>by</strong> a wide marg<strong>in</strong>, <strong>the</strong> highest <strong>in</strong>cidence of <strong>in</strong>com<strong>in</strong>g remittances from outside <strong>the</strong>household. The reason for this is not obvious. Like <strong>the</strong> SHS-users, <strong>the</strong>re is virtually no reportedf<strong>in</strong>ancial support of absent household members.Non-electrified households stand out <strong>in</strong> hav<strong>in</strong>g <strong>the</strong> highest proportion of households support<strong>in</strong>gabsent members, yet this is <strong>the</strong> lowest <strong>in</strong>come sub-sample. They have virtually no <strong>in</strong>com<strong>in</strong>gremittances, but have already been shown to have <strong>the</strong> widest range of <strong>in</strong>come sources. The identitiesof <strong>the</strong> absent beneficiaries were not explored <strong>in</strong> <strong>the</strong> survey questionnaire.Table 2.10: Absent household members and related issuesSHS-users Grid-users Non-electrifiedhouseholdsHousehold head absent 33% 18% 25%% of households with no members liv<strong>in</strong>g elsewhere 51% 53% 54%Someone else 3 contribut<strong>in</strong>g to households 2% 27% 4%Support<strong>in</strong>g absent members (child, parent) 3% 4% 11%3 The survey did not explore <strong>the</strong> identity of <strong>the</strong> o<strong>the</strong>r persons contribut<strong>in</strong>g to <strong>the</strong> householdENERGY RESEARCH CENTRE
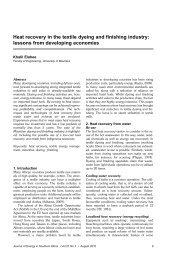
<strong>Solar</strong> <strong>electrification</strong> <strong>by</strong> <strong>the</strong> <strong>concession</strong> <strong>approach</strong> <strong>in</strong> <strong>rural</strong> <strong>Limpopo</strong> prov<strong>in</strong>ce 83. Ma<strong>in</strong> end uses of various fuel/energy sourcesThe ownership of electrical appliances <strong>by</strong> SHS-users and grid-users is discussed <strong>in</strong> Section 7.3.1 Ownership and use of electrical appliancesThe follow<strong>in</strong>g three pairs of charts were produced from <strong>the</strong> data presented <strong>in</strong> Appendix I. Each pairof charts presents <strong>the</strong> ma<strong>in</strong> fuels currently used, and <strong>the</strong> fuels preferred for given end uses <strong>in</strong> eachsub-sample. The charts are compiled from responses to two questions: What respondents used as<strong>the</strong>ir ma<strong>in</strong> fuel for each end use, and <strong>the</strong> fuel <strong>the</strong>y would prefer to switch to <strong>in</strong> each case. Thepercentages refer to all households <strong>in</strong> a sub-sample, not just those us<strong>in</strong>g a given appliance/end use.SHS households% SHS households ____100%80%60%40%20%0%100%Light<strong>in</strong>g Cook<strong>in</strong>g Water ht Space ht TV Radio91%87%83%40%11%3% 6% 5%1%1% 2% 2%<strong>Solar</strong> Wood Paraff<strong>in</strong> Gas Car batt Dry-cell batteriesFigure 3.1: Ma<strong>in</strong> fuels currently used <strong>by</strong> SHS users for given end uses% of SHS households ____100%80%60%40%20%0%2%4%6%2%77%76%75%60%69%65%51%33% 39%29%3%1%Light<strong>in</strong>gCook<strong>in</strong>gWater htSpace htSpace coolTVRadioGeyserFridgeIronHifi<strong>Solar</strong> Grid WoodFigure 3.2: Ma<strong>in</strong> fuels to which SHS users would like to switch to for given end usesENERGY RESEARCH CENTRE
<strong>Solar</strong> <strong>electrification</strong> <strong>by</strong> <strong>the</strong> <strong>concession</strong> <strong>approach</strong> <strong>in</strong> <strong>rural</strong> <strong>Limpopo</strong> prov<strong>in</strong>ce 9Grid-electrified households% of grid electrified households ______100%80%60%40%20%0%96%22%16%7%Light<strong>in</strong>g Cook<strong>in</strong>g Water ht Space ht Spc cool TV Radio Geyser69%60%78%71%33%Grid Wood Paraff<strong>in</strong> Candles7%2%2%Figure 3.3: Ma<strong>in</strong> fuels currently used <strong>by</strong> grid users% of grid elec households _____100%80%60%40%20%0%Light<strong>in</strong>g Cook<strong>in</strong>g Water ht Radio Fridge Iron9%4%4% 7%7%2%2%SHS Wood Paraff<strong>in</strong> Dry-cell batteriesFigure 3.4: Ma<strong>in</strong> fuels to which grid-electrified households would like to switch to forgiven end usesENERGY RESEARCH CENTRE
<strong>Solar</strong> <strong>electrification</strong> <strong>by</strong> <strong>the</strong> <strong>concession</strong> <strong>approach</strong> <strong>in</strong> <strong>rural</strong> <strong>Limpopo</strong> prov<strong>in</strong>ce 10Non-electrified households% of non-electrified households _______100%80%60%40%20%0%99%96%Light<strong>in</strong>g Cook<strong>in</strong>g Water ht Space ht TV Radio63%50%51%34%29% 33%2% 1% 1%Wood Paraff<strong>in</strong> Gas Candles Car batt Dry-cell batteriesFigure 3.5: Ma<strong>in</strong> fuels currently used <strong>by</strong> non-electrified households% of non-electrified households ______100%80%60%40%20%0%Light<strong>in</strong>g Cook<strong>in</strong>g Water ht Space ht TV Radio Fridge Iron81%78%76%68%73%37%27%1%3%1%<strong>Solar</strong> Grid Dry-cell batteriesFigure 3.6: Ma<strong>in</strong> fuels to which non-electrified households would like to switchENERGY RESEARCH CENTRE
<strong>Solar</strong> <strong>electrification</strong> <strong>by</strong> <strong>the</strong> <strong>concession</strong> <strong>approach</strong> <strong>in</strong> <strong>rural</strong> <strong>Limpopo</strong> prov<strong>in</strong>ce 113.1.1 Light<strong>in</strong>g: Ma<strong>in</strong> fuels presently used and fuels households wouldlike to switch toSHS-owners predom<strong>in</strong>antly used <strong>the</strong>ir solar lights for light<strong>in</strong>g, but <strong>the</strong>y were apparently notsatisfied, because 76% preferred to switch to grid electricity, with only 2% preferr<strong>in</strong>g solar light<strong>in</strong>g.In contrast, 96% of grid-users used grid electricity for light<strong>in</strong>g, and none wanted to switch to solar.7% wanted to switch to paraff<strong>in</strong> light<strong>in</strong>g; probably believ<strong>in</strong>g this would lessen <strong>the</strong>ir electricity bills.Non-electrified households depended ma<strong>in</strong>ly on paraff<strong>in</strong> (63%) and candles (34%) for light<strong>in</strong>g, but,like <strong>the</strong> SHS owners, <strong>the</strong>y seemed unhappy, with 81% preferr<strong>in</strong>g to switch to grid electricity and noo<strong>the</strong>r fuel.3.1.2 Cook<strong>in</strong>g: Ma<strong>in</strong> fuels presently used and fuels households wouldlike to switch toSHS owners almost all cooked with wood (91%), with very limited use of gas and paraff<strong>in</strong> (6% and3% respectively). The majority preferred to switch to grid electricity for cook<strong>in</strong>g (77%) while 2%wanted to cook with solar. This preference for cook<strong>in</strong>g with solar <strong>in</strong>dicates that <strong>the</strong>se fewhouseholds did not fully understand <strong>the</strong> limitations of solar electricity for high power applications,unless <strong>the</strong>y were referr<strong>in</strong>g to solar <strong>the</strong>rmal cookers. Wood was also <strong>the</strong> major cook<strong>in</strong>g fuel for gridelectrified households, account<strong>in</strong>g for 71% of <strong>the</strong> households. 22% cooked with grid electricity and7% with paraff<strong>in</strong>. There was overall satisfaction with this fuel use pattern as evidenced <strong>by</strong> <strong>the</strong> smallpercentage of only 4% who wanted to switch cook<strong>in</strong>g fuel to fuelwood.Virtually all (99%) of non-electrified households cooked with wood; <strong>the</strong> rema<strong>in</strong>der used gas. Thepercentage want<strong>in</strong>g to switch to cook<strong>in</strong>g with grid electricity was similar to that for SHS-users, at78%. No o<strong>the</strong>r fuel was preferred for cook<strong>in</strong>g.It is worth not<strong>in</strong>g that while households without grid electricity strongly prefer it as a cook<strong>in</strong>g fuel,grid-users mostly cook with wood. This is generally because grid electricity is too expensive to cookwith. Households without grid electricity may not be aware of this constra<strong>in</strong>t, hence <strong>the</strong>ir preferencefor electric cook<strong>in</strong>g.3.1.3 Water heat<strong>in</strong>g: Ma<strong>in</strong> fuels presently used and fuels households would like toswitch toThe pattern among SHS-users for water heat<strong>in</strong>g fuels is quite similar to that for cook<strong>in</strong>g fuels. Wooddom<strong>in</strong>ates o<strong>the</strong>r fuels <strong>by</strong> a wide marg<strong>in</strong>: 83% compared to 11% and 5% for paraff<strong>in</strong> and gasrespectively. Aga<strong>in</strong> most SHS-users prefer to switch to grid electricity (75%) with 2% express<strong>in</strong>g apreference for solar water heat<strong>in</strong>g.Among grid-users, only 16% used electricity for water heat<strong>in</strong>g compared to 78% us<strong>in</strong>g wood and 2%us<strong>in</strong>g paraff<strong>in</strong>. There was also little desire to switch fuels among grid-users, with only 4% want<strong>in</strong>g toswitch to wood.The non-electrified households had <strong>the</strong> highest wood usage for water heat<strong>in</strong>g, 96% with 2% us<strong>in</strong>gparaff<strong>in</strong> and 1% us<strong>in</strong>g gas. The desire to use grid electricity was still very pronounced, with 76%wish<strong>in</strong>g to switch to grid electricity.3.1.4 Refrigeration: Ma<strong>in</strong> fuels presently used and fuels households would like toswitch toThere were only a few (two to three respondents) responses under refrigeration, and no respondentreported us<strong>in</strong>g any fuel for refrigeration, just preference for electricity (3%) and solar (2%). It wouldnot be useful to attach undue statistical significance to this relatively <strong>in</strong>significant number ofresponses.3.1.5 Media applications: Ma<strong>in</strong> fuels presently used and fuels households wouldlike to switch toSHS households predom<strong>in</strong>antly rely on <strong>the</strong>ir solar systems to power televisions and radios, with<strong>in</strong>significant use of car batteries (1%). The preferred fuel for power<strong>in</strong>g TVs was found to be onlygrid electricity. For radios, aga<strong>in</strong> <strong>the</strong> ma<strong>in</strong> fuel <strong>by</strong> far was SHS, at 87%, with m<strong>in</strong>imal use of carbatteries and dry cell batteries (2% <strong>in</strong> each case). The preferred fuels for radios were grid electricity(69%) and SHS (6%).ENERGY RESEARCH CENTRE
<strong>Solar</strong> <strong>electrification</strong> <strong>by</strong> <strong>the</strong> <strong>concession</strong> <strong>approach</strong> <strong>in</strong> <strong>rural</strong> <strong>Limpopo</strong> prov<strong>in</strong>ce 12The small preference (6%) for SHS for power<strong>in</strong>g radios is probably because of <strong>the</strong> low powerdemand of radios which makes <strong>the</strong>m more compatible than TVs with <strong>the</strong> limited power provided <strong>by</strong>SHSs.Grid electrified households use only grid electricity for power<strong>in</strong>g <strong>the</strong>ir televisions, and <strong>in</strong> most casesfor power<strong>in</strong>g <strong>the</strong>ir radios. Like <strong>the</strong> SHS households, batteries are also use to power radios <strong>by</strong> am<strong>in</strong>ority of households (16%). No o<strong>the</strong>r fuel is preferred for power<strong>in</strong>g TVs, but 7% prefer to powerradios with dry cell batteries. Aga<strong>in</strong>, <strong>the</strong> low power demand of radios expla<strong>in</strong>s this observation.Grid-electrified households may use batteries for power<strong>in</strong>g <strong>the</strong>ir radios where such radios are notdesigned for nor adapted to grid voltage.Non-electrified households predom<strong>in</strong>antly power televisions with car batteries and radios with drycell batteries and car batteries. 29% used car batteries and 3% used a generator for TV power while51% used dry cell batteries compared to 33% us<strong>in</strong>g car batteries to power radios. For TVs <strong>the</strong>preferred fuel was almost totally grid electricity (68%), with 1% preferr<strong>in</strong>g solar and 2% generator.The preferred fuel for radios was grid electricity (27%) with very little preference for solar (1%) andgenerator (2%).3.2 General observations on use and preference for ma<strong>in</strong> fuelsThe SHS- and grid-electrified households show a marked similarity <strong>in</strong> <strong>the</strong>ir use of firewood for<strong>the</strong>rmal needs (chiefly cook<strong>in</strong>g, water heat<strong>in</strong>g and space heat<strong>in</strong>g) while us<strong>in</strong>g electricity for lowpower applications (light<strong>in</strong>g, TV and radio). The o<strong>the</strong>r immediately strik<strong>in</strong>g similarity is betweenSHS- and non-electrified households <strong>in</strong> <strong>the</strong>ir overwhelm<strong>in</strong>g preference for grid electricity, this be<strong>in</strong>gvirtually to <strong>the</strong> total exclusion of o<strong>the</strong>r fuels <strong>in</strong> <strong>the</strong> case of <strong>the</strong> non-electrified households.The three <strong>the</strong>rmal uses (cook<strong>in</strong>g, water heat<strong>in</strong>g and space heat<strong>in</strong>g) are associated with a preferencefor grid electricity <strong>by</strong> <strong>the</strong> SHS-users and non-electrified households, <strong>in</strong> contrast to <strong>the</strong> use of wood<strong>by</strong> grid-electrified households for <strong>the</strong>se end uses. The grid-electrified households are constra<strong>in</strong>edfrom us<strong>in</strong>g <strong>the</strong>rmal electric appliances due to <strong>the</strong> high consumption of <strong>the</strong>se appliances which wouldlead to high electricity bills. Households without grid electricity are attracted <strong>by</strong> <strong>the</strong> virtuallyunconstra<strong>in</strong>ed power available with a grid connection and may not be aware of <strong>the</strong> cost constra<strong>in</strong>ts.Multiple fuel dependence rema<strong>in</strong>s a fact of life among all <strong>the</strong> sub-samples for different reasons,though it is most pronounced among <strong>the</strong> non-electrified households, who are also <strong>the</strong> poorest <strong>in</strong>terms of <strong>in</strong>come, compared to <strong>the</strong> SHS and grid-electrified households.ENERGY RESEARCH CENTRE
<strong>Solar</strong> <strong>electrification</strong> <strong>by</strong> <strong>the</strong> <strong>concession</strong> <strong>approach</strong> <strong>in</strong> <strong>rural</strong> <strong>Limpopo</strong> prov<strong>in</strong>ce 134. Application for and <strong>in</strong>stallation of non-grid and gridelectricityThis section looks at selected aspects of <strong>the</strong> process of acquir<strong>in</strong>g SHSs and grid electricityconnections. Most of <strong>the</strong> questions are related to SHSs and’ where appropriate’ responses from gridusersare also exam<strong>in</strong>ed. The experience with SHS and grid electricity was ra<strong>the</strong>r limited at <strong>the</strong> timeof <strong>the</strong> survey because only 7% of SHS-user respondent had been us<strong>in</strong>g <strong>the</strong>ir systems for over 12months; 45% of respondents had had <strong>the</strong>ir SHSs for one to six months, and 37% had had <strong>the</strong>ir SHSsfor between six months and one year.The situation among grid-users was not very different; with <strong>the</strong> majority (82%) hav<strong>in</strong>g beenconnected to <strong>the</strong> grid one to twelve months prior to <strong>the</strong> survey; 33% had been connected one to threemonths prior to <strong>the</strong> survey, and only 10% had been connected to <strong>the</strong> grid for over two years.4.1 Application for serviceThe majority, 58% of household had found out about SHSs at community meet<strong>in</strong>gs. The energystore seems to have played a distant second (15%) and friends and family 13%. No householdsreported hav<strong>in</strong>g applied for more than one SHS – <strong>the</strong> reasons for this were not probed <strong>in</strong> <strong>the</strong> survey,but f<strong>in</strong>ancial constra<strong>in</strong>ts may have been largely responsible for this situation.4.2 <strong>Solar</strong> home system <strong>in</strong>stallationOver half of all <strong>in</strong>stallations (53%) were carried out less than one month after application, andano<strong>the</strong>r 30% about one month after application. Thus, with<strong>in</strong> a month of application, 83% ofrespondents had <strong>the</strong>ir SHSs <strong>in</strong> place. A few cases reported longer wait<strong>in</strong>g times, <strong>the</strong>se <strong>in</strong>clud<strong>in</strong>g twomonths (7%) and three months (3%). There may have been particular complications <strong>in</strong> <strong>the</strong>se fewcases.Grid owners reported a totally different situation, with only 2% report<strong>in</strong>g connection with<strong>in</strong> onemonth follow<strong>in</strong>g application. 20% had been connected less than two years after apply<strong>in</strong>g. Themajority, 76%, reported be<strong>in</strong>g connected two years after <strong>the</strong>ir applications, and a few (2%) waitedlonger than two years.The level of satisfaction with <strong>the</strong> SHS connections was high, with 80% of households <strong>in</strong>dicat<strong>in</strong>g <strong>the</strong>yhad no compla<strong>in</strong>ts. The significant compla<strong>in</strong>ts raised were about high costs (6%) and slow response(3%). Grid-users were also highly satisfied, with 86% hav<strong>in</strong>g no compla<strong>in</strong>ts. There was also nodom<strong>in</strong>ant compla<strong>in</strong>t, all <strong>the</strong> compla<strong>in</strong>ts be<strong>in</strong>g no more than 2% and <strong>in</strong>clud<strong>in</strong>g power cuts, slowresponse and high costs.4.2.1 Knowledge of solar home systemTable 4.1: Levels of understand<strong>in</strong>g of <strong>the</strong> SHSQuestions asked of households us<strong>in</strong>g SHS Yes NoDid <strong>the</strong> technician expla<strong>in</strong> to you:How <strong>the</strong> SHS works (2% miss<strong>in</strong>g)How to take care of <strong>the</strong> SHSHow to connect appliances91%92%89%Do you know which appliances can be connected to <strong>the</strong> SHS? 89% 8%Are you responsible for clean<strong>in</strong>g <strong>the</strong> module 18% 78%7%7%9%Explanation of <strong>the</strong> SHS <strong>in</strong> general to owners seems to have been extensive, with around 90% of allrespondents <strong>in</strong>dicat<strong>in</strong>g that <strong>the</strong>y had had explanations from technicians on how <strong>the</strong>ir SHS works,how to care for it and how to connect appliances to it. As a result most respondents were confident<strong>the</strong>y knew what <strong>the</strong>y could connect to <strong>the</strong>ir SHSs. 78% knew that <strong>the</strong>y were not supposed to clean<strong>the</strong>ir modules, a service that is provided <strong>by</strong> <strong>the</strong> service provider. 18% seemed not to know this.ENERGY RESEARCH CENTRE
<strong>Solar</strong> <strong>electrification</strong> <strong>by</strong> <strong>the</strong> <strong>concession</strong> <strong>approach</strong> <strong>in</strong> <strong>rural</strong> <strong>Limpopo</strong> prov<strong>in</strong>ce 14Table 4.2: Recollection of hav<strong>in</strong>g obta<strong>in</strong>ed written <strong>in</strong>formation concern<strong>in</strong>g <strong>the</strong> SHSDid you receive written <strong>in</strong>formation about <strong>the</strong> SHS?Noth<strong>in</strong>g 31%Users manual 0.8%Pamphlet 65%Poster 3%The majority of respondents (65%) <strong>in</strong>dicated <strong>the</strong>y had received pamphlets, with almost all <strong>the</strong>rema<strong>in</strong>der (31%) claim<strong>in</strong>g <strong>the</strong>y received noth<strong>in</strong>g. 3% claimed receiv<strong>in</strong>g posters and under 1% a usermanual. It is possible here that <strong>the</strong> dist<strong>in</strong>ction between user manual and pamphlet was confused. It isnot clear why as many as one-third of respondents claimed to have received no written <strong>in</strong>formation.Perhaps <strong>the</strong>y were <strong>the</strong> most recent SHS-owners and had not yet got <strong>the</strong>ir written materials.4.3 SHS OwnershipTable 4.3: Knowledge of ownership of <strong>the</strong> SHSWho owns <strong>the</strong> SHS once <strong>in</strong>stalled?HH 2%<strong>Solar</strong>vision 88%Government 0.8%Don't know 8%The proportion of respondents who knew that <strong>the</strong> SHSs were owned <strong>by</strong> <strong>Solar</strong> Vvision was similar tothat of respondents who had been given explanations <strong>by</strong> technicians. 88% knew <strong>the</strong> correctownership of <strong>the</strong> SHSs while 8% did not know and 2% thought <strong>the</strong> household owned <strong>the</strong> SHS.There may be several explanations for <strong>the</strong> small degree of ignorance of <strong>the</strong> SHS ownership,<strong>in</strong>clud<strong>in</strong>g <strong>the</strong> possibility of <strong>the</strong> respondent not hav<strong>in</strong>g been <strong>in</strong> <strong>the</strong> area at <strong>the</strong> time of <strong>in</strong>stallation.4.4 Service contractTable 4.4: Knowledge of <strong>the</strong> contract with <strong>the</strong> service providerYesNoDid you sign a contract with <strong>the</strong> service provider 98% 1%Did someone expla<strong>in</strong> <strong>the</strong> contract 69% 29%Did you understand <strong>the</strong> terms of <strong>the</strong> contract 50% 45%Virtually all respondents claimed to have signed a contract with <strong>the</strong> service provider, but 29%claimed not to have had an explanation of <strong>the</strong> contract, and only 50% <strong>in</strong>dicated that <strong>the</strong>y understood<strong>the</strong> terms of <strong>the</strong> contract. It will be seen later that this lack of detailed understand<strong>in</strong>g of <strong>the</strong> contractdid not seem to lead to unhapp<strong>in</strong>ess with <strong>the</strong> contract.ENERGY RESEARCH CENTRE
<strong>Solar</strong> <strong>electrification</strong> <strong>by</strong> <strong>the</strong> <strong>concession</strong> <strong>approach</strong> <strong>in</strong> <strong>rural</strong> <strong>Limpopo</strong> prov<strong>in</strong>ce 154.5 Service feesTable 4.5: Amount per month SHS-users th<strong>in</strong>k <strong>the</strong>y should pay for <strong>the</strong> feefor service tokenRand per month Number %5 5 410 20 1615 6 520 27 2225 6 530 12 1030-40 3 340-47 3 3+47 28 23Some 68% of respondents fell <strong>in</strong> <strong>the</strong> range of R10 to R30 <strong>in</strong> terms of how much <strong>the</strong>y expected to payper month for <strong>the</strong> fee for service for <strong>the</strong>ir SHSs. Very few suggested R5 per month, <strong>in</strong>dicat<strong>in</strong>g thatmost respondents accepted that <strong>the</strong> SHSs cannot be provided free or at giveaway costs. Only 23%felt <strong>the</strong> service was worth more than R47 per month. (Some caution needs to be exercised <strong>in</strong><strong>in</strong>terpret<strong>in</strong>g this result. SHS owners may have also considered what <strong>the</strong>y can comfortably afford <strong>in</strong>mak<strong>in</strong>g <strong>the</strong>ir responses, particularly if <strong>the</strong>y felt that <strong>the</strong> results of <strong>the</strong> survey may have a bear<strong>in</strong>g on<strong>the</strong> sett<strong>in</strong>g of future amounts for <strong>the</strong> service.)ENERGY RESEARCH CENTRE
<strong>Solar</strong> <strong>electrification</strong> <strong>by</strong> <strong>the</strong> <strong>concession</strong> <strong>approach</strong> <strong>in</strong> <strong>rural</strong> <strong>Limpopo</strong> prov<strong>in</strong>ce 165. <strong>Solar</strong> electricity, grid electricity use, householdsexpectations and satisfactionThis section looks at a number of <strong>in</strong>dicators that <strong>in</strong>dicate expectations and satisfaction among SHSusersand grid-users. The fact that <strong>the</strong> questions dealt with <strong>in</strong> this section are from diverse parts of<strong>the</strong> questionnaire, and <strong>the</strong> quite limited exposure to electricity services at <strong>the</strong> time of <strong>the</strong> survey ledto a certa<strong>in</strong> amount of apparent ambivalence <strong>in</strong> <strong>the</strong> attitudes of respondents. The follow up survey ofhouseholds <strong>in</strong> <strong>the</strong> same areas will probably reveal how attitudes have crystallised over time.5.1 Customer ‘satisfaction’ measured as a dichotomyA collection of responses to various questions on satisfaction are grouped <strong>in</strong> Table 5.1.Table 5.1: Levels of satisfaction with different aspects of <strong>the</strong> SHSItems measur<strong>in</strong>g satisfaction Yes NoHave compla<strong>in</strong>ts about <strong>the</strong> <strong>in</strong>stallation 20% 80%Satisfied with <strong>the</strong> location of <strong>the</strong> unit <strong>in</strong> <strong>the</strong> house 92% 8%Satisfied with <strong>the</strong> contract 69% 27%Satisfied with <strong>the</strong> location of lights 100% 0%Satisfied with <strong>the</strong> services of <strong>the</strong> technician* 19% 11%* The two responses presented <strong>in</strong> this case do not add up to 100% because <strong>the</strong> rest of <strong>the</strong> respondentswere ambivalent and did not answer ‘Yes’ or ’No’The level of satisfaction with <strong>in</strong>dicators where users had a direct <strong>in</strong>put is, not surpris<strong>in</strong>gly, highest.All respondents were satisfied with <strong>the</strong> location of <strong>the</strong>ir lights, and 92% were satisfied with <strong>the</strong>location of <strong>the</strong> SHS unit <strong>in</strong>side <strong>the</strong> house. The limited level of dissatisfaction <strong>in</strong> this case may be dueto <strong>the</strong> respondent not be<strong>in</strong>g <strong>the</strong> one who specified where <strong>the</strong> SHS unit should be placed and <strong>the</strong>reforehav<strong>in</strong>g a different op<strong>in</strong>ion, or perhaps <strong>the</strong> unit could not be located exactly where <strong>the</strong>y wanted forsome technical or practical reason.The level of satisfaction with <strong>the</strong> contract was good at 69%, which tallies with <strong>the</strong> percentage ofSHS owners who reported hav<strong>in</strong>g had an explanation of <strong>the</strong> contract. This also <strong>in</strong>dicates that somerespondents who did not understand <strong>the</strong> terms of <strong>the</strong> contract were never<strong>the</strong>less happy with it s<strong>in</strong>ce<strong>the</strong> percentage of respondent who reported that <strong>the</strong>y understood <strong>the</strong> terms of <strong>the</strong> contract was lowerat 50%.5.2 SHS electricity use5.2.1 Will<strong>in</strong>gness to pay more for a larger systemTable 5.2: Users’ views of use of a larger systemWhat would you use a larger system for?* %More <strong>in</strong>side lights 26More outside lights 17Watch videos 11Watch TV 12Colour TV 31Buy more appliances 2Sew<strong>in</strong>g mach<strong>in</strong>e 1* The selection of responses was providedThe frustration with <strong>the</strong> power limitation of SHSs can be seen <strong>in</strong> <strong>the</strong> responses to <strong>the</strong> question ofwhat respondents would do with a larger system. The largest group of respondents (almost 31%)ENERGY RESEARCH CENTRE
<strong>Solar</strong> <strong>electrification</strong> <strong>by</strong> <strong>the</strong> <strong>concession</strong> <strong>approach</strong> <strong>in</strong> <strong>rural</strong> <strong>Limpopo</strong> prov<strong>in</strong>ce 17<strong>in</strong>dicated that <strong>the</strong>y would use <strong>the</strong>ir colour televisions. The use of <strong>the</strong>se appliances with current SHSsis precluded due to power constra<strong>in</strong>ts. Also, colour TVs are not compatible with 12 volt dc suppliesexcept for some small portables; <strong>in</strong>verters would have to be used <strong>in</strong> most, if not all cases.The next largest group of respondents, just under 26%, wanted to <strong>in</strong>crease <strong>the</strong> number of <strong>in</strong>sidelights. This aga<strong>in</strong> is because <strong>the</strong>re are generally some rooms that are not provided with solar light<strong>in</strong>gbecause of <strong>the</strong> capacity limitations of <strong>the</strong> SHSs. This situation forces SHS owners to depend on o<strong>the</strong>rfuels like paraff<strong>in</strong> and candles to light <strong>the</strong> rooms that <strong>the</strong>ir SHSs cannot cater for. Closely allied with<strong>the</strong> wish to have more <strong>in</strong>side light<strong>in</strong>g is <strong>the</strong> wish to have more outside light<strong>in</strong>g (usually securitylight<strong>in</strong>g) <strong>by</strong> about 17% of respondents. Roughly 12% would use <strong>the</strong> extra capacity to watch TV, andabout 10% to run video cassette recorders (VCRs). Aga<strong>in</strong> VCRs are not generally 12v dc-compatibleand would require <strong>in</strong>verters. About 2% would procure more appliances and less than one percentexpected to use additional power to run a sew<strong>in</strong>g mach<strong>in</strong>e. Clearly <strong>the</strong>re is still considerableignorance around appliance compatibility with SHSs.5.3 Expectation concern<strong>in</strong>g appliancesTable 5.3: First appliances SHS households expected to use with SHSFirst appliance expected to be used %Stove 14TV (black and white) 15TV (colour) 12Radio 44Hi-Fi 5Fridge 9Light 1Expectations for what first appliance <strong>the</strong>y would be able to use with <strong>the</strong>ir SHSs shows <strong>the</strong> majority(44%) of respondents expected to use radios. Roughly similar numbers (<strong>in</strong> <strong>the</strong> range 12% to15%)expected to use a stove, run a black and white, or a colour TV. About 9% expected to use a fridgeand only 1% expected to use lights as first priority. These priority expectations run contrary to whatSHSs can provide, with <strong>the</strong> notable exception of <strong>the</strong> radio. The o<strong>the</strong>r first appliances listed, stove,colour TV and refrigerator are impractical with SHSs. These early expectations are likely to havebeen due to lack of <strong>in</strong>formation prior to <strong>the</strong> <strong>in</strong>stallation of <strong>the</strong> SHSs.39% of SHS-users were satisfied with <strong>the</strong> appliances while 60% were dissatisfied. The explanationsof <strong>the</strong> level of satisfaction given <strong>in</strong> response to ano<strong>the</strong>r question are given below.Table 5.4: Customers’ explanation for satisfaction or dissatisfaction with <strong>the</strong> appliancesthat can be used with <strong>the</strong> SHSPositive responses %Higher service level 12All HH needs satisfied 13Negative responsesPower limitation 57Power cuts 1Can't power fridge 2No color TV 3Can't use all appliances 1No color TV & fridge 1It is hardly surpris<strong>in</strong>g that <strong>the</strong> most frequent negative response was ‘power limitation’, and <strong>in</strong> fact all<strong>the</strong> o<strong>the</strong>r negative responses can be seen as express<strong>in</strong>g <strong>the</strong> issue of limited power <strong>in</strong> different words.The positive responses were considerably fewer <strong>in</strong> comparison, with 13% of respondents <strong>in</strong>dicat<strong>in</strong>gENERGY RESEARCH CENTRE
<strong>Solar</strong> <strong>electrification</strong> <strong>by</strong> <strong>the</strong> <strong>concession</strong> <strong>approach</strong> <strong>in</strong> <strong>rural</strong> <strong>Limpopo</strong> prov<strong>in</strong>ce 18that <strong>the</strong>ir household needs had been met, and 12% <strong>in</strong>dicat<strong>in</strong>g <strong>the</strong>y had a ‘higher service level’,presumably compar<strong>in</strong>g previous fuels like paraff<strong>in</strong>, candles, and batteries aga<strong>in</strong>st SHSs.5.4 Service level and problems with SHSThe fee-for-service <strong>approach</strong> is based on <strong>the</strong> cont<strong>in</strong>uous provision of ma<strong>in</strong>tenance service <strong>by</strong> aprovider and payment of regular service fees <strong>by</strong> <strong>the</strong> client receiv<strong>in</strong>g <strong>the</strong> services. Ideally <strong>the</strong>resolution of faults should be prompt as long as service fees are be<strong>in</strong>g paid. The types of problemsthat have arisen, and <strong>the</strong> ability of <strong>the</strong> service provider and users to cope with <strong>the</strong>se problems are <strong>the</strong>issues explored below.Table 5.5 Incidence of problems with <strong>the</strong> SHSItems relat<strong>in</strong>g to problemsHad problemsAble to identify problem(s)Know what to do when <strong>the</strong>re is a problemReported <strong>the</strong> problems with SHSHave <strong>the</strong> problems been solved?Are any of <strong>the</strong> problems still unsolved% of SHS-usersrespond<strong>in</strong>g ‘Yes’40375639301640% of respondents reported hav<strong>in</strong>g had a problem with <strong>the</strong>ir SHSs, and almost <strong>the</strong> same percentagefelt <strong>the</strong>y could identify <strong>the</strong> problem. The problems were reported <strong>in</strong> virtually all cases but 16%reported that <strong>the</strong> problems were not yet solved. It is not possible to say for how long resolution of <strong>the</strong>problems was outstand<strong>in</strong>g without gett<strong>in</strong>g additional <strong>in</strong>formationWhere problems with SHS are reportedThe majority of problems were reported to <strong>the</strong> energy store (28%) and technician (8%). Onehousehold each reported to <strong>the</strong> chief and <strong>the</strong> revenue collector. Unless this diversity of report<strong>in</strong>gpo<strong>in</strong>ts is agreed with <strong>the</strong> service provider and gets <strong>the</strong> fault report through timeously, delays <strong>in</strong>rectification of faults can be expected.Table 5.6: Where problems with SHS are reportedEnergy store 28%Technician 8%Revenue collector 1%Chief 1%No problem yet 62%Table 5.7: Number of times have had a problemOnce 21%Twice 7%Three times 3%More than three times 5%No problem yet 61%Most households (21%) who had experienced problems had only one <strong>in</strong>stance, with much fewerreport<strong>in</strong>g two or three problems. This low fault rate is to be expected given <strong>the</strong> relatively short timethat respondents had had <strong>the</strong>ir SHSs at <strong>the</strong> time of <strong>the</strong> survey.ENERGY RESEARCH CENTRE
<strong>Solar</strong> <strong>electrification</strong> <strong>by</strong> <strong>the</strong> <strong>concession</strong> <strong>approach</strong> <strong>in</strong> <strong>rural</strong> <strong>Limpopo</strong> prov<strong>in</strong>ce 19Table 5.8: Frequency with which problems were mentionedPower cuts 2%Little electricity 2%Not work<strong>in</strong>g <strong>in</strong> bad wea<strong>the</strong>r 1%Battery voltage low 23%The problems most frequently reported seem to be related to power availability, thus, while lowbattery voltage is <strong>the</strong> predom<strong>in</strong>ant problem, <strong>the</strong> o<strong>the</strong>r problems are also related to this issue and canbe seen as alternative ways of stat<strong>in</strong>g <strong>the</strong> same issue. This is not surpris<strong>in</strong>g because low batteryvoltage and <strong>the</strong> consequent cutt<strong>in</strong>g off of power are <strong>the</strong> visible symptoms of many o<strong>the</strong>r problems.For example if <strong>the</strong> solar module is dirty, <strong>the</strong> charge regulator malfunctions, or battery term<strong>in</strong>als arecorroded and dirty, <strong>the</strong> result is normally little energy <strong>in</strong> <strong>the</strong> battery, lead<strong>in</strong>g to a low voltagesituation with<strong>in</strong> a short time. The above data is <strong>the</strong>refore symptomatic and may not reliably <strong>in</strong>dicatewhat is wrong with <strong>the</strong> SHSs.Table 5.9: Frequency of checks on <strong>the</strong> SHSOnce 20%Twice already 6%Three times already 2%Five times already 2%No visits or miss<strong>in</strong>g data 71%The way <strong>the</strong> data on visits to check <strong>the</strong> SHS <strong>in</strong>stallations <strong>by</strong> <strong>Solar</strong>vision is presented does notprovide a frequency, but ra<strong>the</strong>r how many times <strong>Solar</strong>vision had visited <strong>the</strong> SHSs before <strong>the</strong> survey.Whe<strong>the</strong>r this is frequent or <strong>in</strong>frequent depends on how old <strong>the</strong> system <strong>by</strong> <strong>the</strong> time of <strong>the</strong> survey.5.5 Likes and dislikes about <strong>the</strong> SHSTable 5.10:Likes and dislikes of <strong>the</strong> SHSWhat was most liked% of SHSusersWhat was most disliked% of SHSusersBetter lightEasy lifeCassette player and lightRadioSafeSaves moneyTV and lightEveryth<strong>in</strong>gNoth<strong>in</strong>gExtended study timeNot applicable/miss<strong>in</strong>g591055432.51119Power limitationPower cuts easilyWea<strong>the</strong>r effectNoth<strong>in</strong>gTime limitationPay<strong>in</strong>g when unusedNo colour TVCannot light all roomsN/a or miss<strong>in</strong>g4416133111119By far <strong>the</strong> most liked characteristic of SHSs was <strong>the</strong> better light with nearly 60% of respondentscit<strong>in</strong>g this advantage. A distant second at 10% was ‘easy life’ followed <strong>by</strong> <strong>the</strong> ability to use smallappliances like radio and TV at 5% and below. The dislikes were dom<strong>in</strong>ated <strong>by</strong> <strong>the</strong> problem ofpower limitation of SHSs, although this was expressed <strong>in</strong> numerous ways. Susceptibility to <strong>the</strong>wea<strong>the</strong>r was also a significant factor (<strong>the</strong> effect of cloudy wea<strong>the</strong>r is to reduce available power andlimit <strong>the</strong> amount of energy stored <strong>in</strong> <strong>the</strong> battery).ENERGY RESEARCH CENTRE
<strong>Solar</strong> <strong>electrification</strong> <strong>by</strong> <strong>the</strong> <strong>concession</strong> <strong>approach</strong> <strong>in</strong> <strong>rural</strong> <strong>Limpopo</strong> prov<strong>in</strong>ce 206. Payment for electricity services6.1 Frequency of purchase of tokensAll respondents reported pay<strong>in</strong>g <strong>the</strong>ir SHS fees monthly, though 16% <strong>in</strong>dicated that <strong>the</strong>re had beensituations where <strong>the</strong>y had been unable to pay <strong>the</strong>ir fees.Table 6.1: When <strong>the</strong> token is boughtSHS-users Grid-usersBefore new month starts 61% 4%First day of month 9% 9%First week of month 7% 4%Pension day 6% 11%When credit runs out 2% 62%Mid-month 13% 0%Alternate months 1% 0%Not applicable/miss<strong>in</strong>g 0% 9%Most grid-users reported purchas<strong>in</strong>g <strong>the</strong>ir tokens when credit ran out (62%), or, to a much lesserextent, on pension day or <strong>the</strong> first day of <strong>the</strong> month. SHS-users predom<strong>in</strong>antly paid before <strong>the</strong> startof <strong>the</strong> next month(61%), mid month, or early <strong>in</strong> each month. The difference <strong>in</strong> <strong>the</strong> tim<strong>in</strong>g of paymentis due to <strong>the</strong> requirement for regular payment of <strong>the</strong> SHS service fee each month. It is reasonable formost grid-users to pay when <strong>the</strong>ir credit runs out, or when money becomes available (pension day).This suggests that some grid-users may sometimes run out of credit and go without power till <strong>the</strong>next pension day.Table 6.2: Persons who pay for <strong>the</strong> tokenSHS-usersGrid-usersHusband 67% 80%Wife 20% 13%Son/daughter 13% 7%Husbands were <strong>by</strong> far <strong>the</strong> most frequent token buyers, with wives and children scor<strong>in</strong>g much lowerfrequencies. The role of husbands as be<strong>in</strong>g <strong>the</strong> breadw<strong>in</strong>ners <strong>in</strong> most households expla<strong>in</strong>s this trend.The persons pay<strong>in</strong>g for tokens were reported to be mostly stay<strong>in</strong>g at home among both <strong>the</strong> SHSusersand grid-usersTable 6.3: Place where person buy<strong>in</strong>g <strong>the</strong> token livesSHS-usersGrid-usersAt home* 80% 88%Away from home 18% 22%* The responses to this question gave place names, not an explicit <strong>in</strong>dication of ‘At home/Not at home’.Where <strong>the</strong> place name was local, <strong>the</strong> answer was taken to be ‘At home’The percentage of households with token buyers stay<strong>in</strong>g away from home was found to be a littlehigher among SHS-users. It may be unwise to read too much <strong>in</strong>to <strong>the</strong> difference consider<strong>in</strong>g <strong>the</strong>possible <strong>in</strong>accuracy that may arise from <strong>the</strong> way <strong>the</strong> question was asked (see note to table). Most of<strong>the</strong> persons pay<strong>in</strong>g for <strong>the</strong> token were found to have a regular <strong>in</strong>come. It has already been noted thatit is husbands who pay for <strong>the</strong> token <strong>in</strong> most households.ENERGY RESEARCH CENTRE
<strong>Solar</strong> <strong>electrification</strong> <strong>by</strong> <strong>the</strong> <strong>concession</strong> <strong>approach</strong> <strong>in</strong> <strong>rural</strong> <strong>Limpopo</strong> prov<strong>in</strong>ce 21Table 6.4: Does <strong>the</strong> person buy<strong>in</strong>g <strong>the</strong> token earn a regular <strong>in</strong>come?SHS-users Grid-usersYes 84% 80%No 16% 20%The sentiment among SHS-users was overwhelm<strong>in</strong>gly that fees should be cheaper <strong>in</strong> order tofacilitate payment. This suggests that most felt that <strong>the</strong> service fees <strong>the</strong>y were pay<strong>in</strong>g was higherthan <strong>the</strong>y thought <strong>the</strong>y should be pay<strong>in</strong>g. The frequency of payment was not seen as an importantfactor <strong>in</strong> terms of mak<strong>in</strong>g payment easier.Table 6.5: Customer suggestions to make payment easierSHS-usersToken cheaper 95%Pay weekly 1%Pay every two months 2%Pay noth<strong>in</strong>g 2%Question not asked <strong>in</strong> grid questionnaireOnly 8% of respondents stated that <strong>the</strong>y expected to pay service fees for <strong>the</strong>ir SHSs as long as <strong>the</strong>yhad <strong>the</strong> SHSs. The overwhelm<strong>in</strong>g majority expected to pay until <strong>the</strong> grid was extended to <strong>the</strong>m.Table 6.6: Expected duration of payment for SHSSHS-usersAs long as have SHS 8%Until grid 75%Until ownership of SHS 6%This year only 4%6 months only 4%Don’t know 1%O<strong>the</strong>r/miss<strong>in</strong>g 2%This response suggests widespread expectancy that <strong>the</strong> grid is com<strong>in</strong>g and that SHSs are only astopgap measure. This is likely to result <strong>in</strong> grow<strong>in</strong>g frustration with <strong>the</strong> pass<strong>in</strong>g of time, withunknown results. Eight percent believed that payment of fees was a short-term arrangement to lastsix months to a year. It is not clear why some respondents were so mis<strong>in</strong>formed, perhaps <strong>the</strong>y werenot present at <strong>the</strong> time of <strong>in</strong>stallation when explanations were given.Table 6.7: If <strong>the</strong> outlet has been closedGrid-usersNever 82%Sometimes 11%Not applicable/miss<strong>in</strong>g 7%For grid-users (SHS users were not asked), <strong>the</strong> outlet where <strong>the</strong>y purchase tokens was reported tohave been always open when 82% of respondents went to purchase tokens. Only 11% of respondentshad sometimes found <strong>the</strong> outlet closed when <strong>the</strong>y <strong>in</strong>tended to purchase electricity tokens. The outlethas <strong>the</strong>refore not generally frustrated respondents when <strong>the</strong>y needed tokens. This is important s<strong>in</strong>cemost respondents had to travel a considerable distance to <strong>the</strong> token outlet as shown <strong>in</strong> Table 6.8below.ENERGY RESEARCH CENTRE
<strong>Solar</strong> <strong>electrification</strong> <strong>by</strong> <strong>the</strong> <strong>concession</strong> <strong>approach</strong> <strong>in</strong> <strong>rural</strong> <strong>Limpopo</strong> prov<strong>in</strong>ce 22Table 6.8: Distance to outlet where token is purchasedGrid-usersUp to 6km 4%6-8 km 4%8-10 km 2%Over 10 km 89%Some 89% of grid-connected respondents reported travell<strong>in</strong>g over 10km to <strong>the</strong> outlet where <strong>the</strong>ypurchased tokens, and only four percent reported travell<strong>in</strong>g distances of 6km and less (aga<strong>in</strong>, SHSusers were not questioned on this). Why <strong>the</strong> outlet is sometimes closed for 11% of respondents is notclear. It may be because <strong>the</strong> respondents were not fully aware of <strong>the</strong> operat<strong>in</strong>g hours of <strong>the</strong> outlet, orthat <strong>the</strong> outlet is occasionally closed dur<strong>in</strong>g bus<strong>in</strong>ess hours when it would usually be open.ENERGY RESEARCH CENTRE
<strong>Solar</strong> <strong>electrification</strong> <strong>by</strong> <strong>the</strong> <strong>concession</strong> <strong>approach</strong> <strong>in</strong> <strong>rural</strong> <strong>Limpopo</strong> prov<strong>in</strong>ce 237. Electrical appliances owned <strong>by</strong> SHS-users and gridusers7.1 Ownership and useTable 7.1: Ownership of electrical appliances: SHS and grid-usersSHS-usersGrid-usersRadio 52% 51%Radio cassette 50% 62%Hi-fi 8% 22%Colour TV 2% 25%Black and white TV 36% 33%Cell-phone charger 6% 20%Fridge/freezer 10% 13%Hotplate 8% 9%Iron 10% 33%Video 6% 7%The ownership of low power appliances like radios and black and white televisions is not verydifferent between SHS-users and grid-owners. A clear discrepancy is evident <strong>in</strong> <strong>the</strong> ownership ofcolour TVs and hi-fi systems. These consume more power and are more suited to run on gridelectricity. Cause for concern however is <strong>the</strong> ownership of fridges, hotplates, video cassetterecorders and colour TVs <strong>by</strong> some SHS-users. These appliances which are idle can be a fur<strong>the</strong>rsource of frustration and anxiety over <strong>the</strong> extension of <strong>the</strong> grid to <strong>the</strong>se households.Table 7.2: Ownership and use of TV: SHS-users compared with grid-users and nonelectrifiedhouseholds.SHS-users Grid-users Non-electr. householdsHave TV (black and white or colour) 39% 60% 33%Watch daily 20% 20% 14%Up to 4 hours daily 37% 51% 25%Same <strong>in</strong> w<strong>in</strong>ter and summer 15% Miss<strong>in</strong>g Miss<strong>in</strong>g% school children watch<strong>in</strong>g frequently 12% 18% 4%Grid users have considerably more televisions than <strong>the</strong> o<strong>the</strong>r sub-samples. The percentage ofrespondents hav<strong>in</strong>g televisions is almost double that for non-electrified households. Grid users alsowatch for longer, with 51% report<strong>in</strong>g that <strong>the</strong>y watch for up to four hours daily, compared to 37%among SHS-users. The proportion of schoolchildren watch<strong>in</strong>g TV frequently is also highest amonggrid-users. These patterns are readily expla<strong>in</strong>ed <strong>by</strong> <strong>the</strong> ability of grid electricity to cater for <strong>the</strong> loadsimposed upon it. SHSs or car batteries will constra<strong>in</strong> users due to <strong>the</strong>ir lower power capabilities andlimited energy storage capacity.ENERGY RESEARCH CENTRE
<strong>Solar</strong> <strong>electrification</strong> <strong>by</strong> <strong>the</strong> <strong>concession</strong> <strong>approach</strong> <strong>in</strong> <strong>rural</strong> <strong>Limpopo</strong> prov<strong>in</strong>ce 248. General use of fuels and energy sourcesMultiple fuel use is a fact of life among all three sub-samples. The range of fuels used was shown tobe widest among <strong>the</strong> non-electrified households. Among <strong>the</strong> primary fuels that were encountered areparaff<strong>in</strong>, candles, gas, fuelwood, dry cell and car batteries, petrol (for generators), and biomass fuels.Calculation of <strong>the</strong> quantities and costs of <strong>the</strong> various fuels <strong>in</strong>volved <strong>the</strong> use of several variables suchas quantities of fuels purchased per given time, <strong>the</strong> price paid for various quantities of <strong>the</strong> fuels, howlong <strong>the</strong> fuels last, uses to which fuels are put, where <strong>the</strong> fuels are obta<strong>in</strong>ed, and <strong>the</strong> cost of returntrips to procure fuels. It was not always possible to calculate quantities of fuels used because <strong>in</strong> somecases <strong>the</strong> units specified <strong>by</strong> respondents are not formally def<strong>in</strong>ed, for example ‘bundles’ of wood,whose size can vary widely. In o<strong>the</strong>r cases such as generator fuel, <strong>the</strong> number of questions asked was<strong>in</strong>sufficient to allow calculation of quantities of fuels used.The costs of <strong>the</strong> different fuels were calculated and <strong>the</strong> percentage of households <strong>in</strong>come spent onenergy was determ<strong>in</strong>ed.8.1 Costs and quantitiesTable 8.1: Amount paid monthly for <strong>the</strong> electricity token (grid users)Rands% of grid-users pay<strong>in</strong>g15-20 730-50 4250-70 2970+ 22While all SHS-users pay a service fee of R58 monthly, about half of grid-users pay no more thanR50 monthly, and only 22% pay R70 and above. When <strong>the</strong> service level issues that have just beendiscussed are compared, clearly grid-users get a far higher service level for <strong>the</strong>ir money.8.2 Costs and quantities of o<strong>the</strong>r fuels besides electricityThe mean monthly expenditure on selected fuels are shown <strong>in</strong> Figures 8.1 and 8.2, and <strong>the</strong> sourcetable for <strong>the</strong> data used is given <strong>in</strong> Appendix II. It is important to bear <strong>in</strong> m<strong>in</strong>d that <strong>the</strong> mean monthlyexpenditures given here are for those households that use each fuel and that <strong>the</strong> number of <strong>the</strong>sehouseholds varies for each fuel. Figures 8.1 and 8.2 give two views of <strong>the</strong> mean monthlyexpenditure data. Figure 8.1 shows that <strong>the</strong> highest mean monthly expenditures are on fuelwood andgas. Only a few households use gas however. A clear trend is also apparent for fuelwood, with <strong>the</strong>mean monthly expenditure be<strong>in</strong>g highest for <strong>the</strong> non-electrified households. This is not surpris<strong>in</strong>gs<strong>in</strong>ce some grid-users (22%) cook with electricity and also use it for meet<strong>in</strong>g o<strong>the</strong>r <strong>the</strong>rmal needs,and some SHS-users cook and meet o<strong>the</strong>r <strong>the</strong>rmal needs with gas and paraff<strong>in</strong> <strong>in</strong> addition to wood.Mean monthly expenditure140120100806040SHS users Grid Users Non Elec200Candles Paraff<strong>in</strong> Gas Fuelwood Dry cells Car battery Grid electFigure 8.1: Mean monthly households expenditure on each fuel accord<strong>in</strong>g to subsamples,clustered <strong>by</strong> fuel; for those households that use <strong>the</strong> fuel <strong>in</strong> questionENERGY RESEARCH CENTRE
<strong>Solar</strong> <strong>electrification</strong> <strong>by</strong> <strong>the</strong> <strong>concession</strong> <strong>approach</strong> <strong>in</strong> <strong>rural</strong> <strong>Limpopo</strong> prov<strong>in</strong>ce 25Mean monthly expenditure140120100806040Candles Paraff<strong>in</strong> Gas Fuelwood Dry cells Car battery Grid elect200SHS users Grid Users Non ElecFigure 8.2: Mean monthly households expenditure on each fuel accord<strong>in</strong>g to subsamples,clustered <strong>by</strong> sub-sample8.3 Sources of purchased fuelsTable 8.2: Where paraff<strong>in</strong> and gas are bought accord<strong>in</strong>g to fuel type and sub-samplesSHS-users Grid-users Non-electrified householdsParaff<strong>in</strong>In town 22% 0% 11%Local shops 2% 20% 25%Tuckshop/spaza 19% 11% 25%Garage 14% 9% 18%GasTown 11% Not used 2%Local shops 8% Not used 1%Garage 4% Not used 1%Do not buy gas 78% 60% 97%While <strong>the</strong> o<strong>the</strong>r sub-samples show a strong tendency to buy <strong>the</strong>ir fuels locally, <strong>the</strong> proportion ofSHS-users go<strong>in</strong>g to town for paraff<strong>in</strong> and gas is considerably higher at 22% and 11% respectively. Itmay be that <strong>the</strong>se households, which have <strong>the</strong> highest <strong>in</strong>comes, tend to do major shopp<strong>in</strong>g <strong>in</strong> townand may be purchas<strong>in</strong>g <strong>the</strong>ir fuels at <strong>the</strong> same time. Unit prices for fuels are likely to be cheaper <strong>in</strong>town, more-so if purchased <strong>in</strong> larger quantities.8.3.1 Distances and cost of return journeys to purchase fuelsThe cost of go<strong>in</strong>g to procure fuels is an additional cost that was not <strong>in</strong>cluded <strong>in</strong> <strong>the</strong> cost of fuelsalready discussed. Table 8.3 shows <strong>the</strong> mean cost of return journeys to purchase selected fuels and,<strong>in</strong> <strong>the</strong> case of paraff<strong>in</strong>, <strong>the</strong> distances to where <strong>the</strong> fuel is bought. SHS-users report <strong>the</strong> greatest meandistances to <strong>the</strong>ir paraff<strong>in</strong> sources (12km) while grid-owners report half this distance on average.Non-electrified households report 9km on average.ENERGY RESEARCH CENTRE
<strong>Solar</strong> <strong>electrification</strong> <strong>by</strong> <strong>the</strong> <strong>concession</strong> <strong>approach</strong> <strong>in</strong> <strong>rural</strong> <strong>Limpopo</strong> prov<strong>in</strong>ce 26Table 8.3: Average distances travelled to purchase fuels and average cost of<strong>the</strong> return trip% of households pay<strong>in</strong>gfor fuel tripsSHS-users Grid-users Non-electrified households53% 13% 61%Paraff<strong>in</strong> M<strong>in</strong> 0.03 M<strong>in</strong> 1 M<strong>in</strong> 1Max 80 Max 16 Max 33Distance (km) Mean 12 Mean 6 Mean 9N 68 N 24 N 92M<strong>in</strong> 4 M<strong>in</strong> 8 M<strong>in</strong> 2Cost of return trip ( R) Max 19 Max 12 Max 20Mean 11 Mean 10 Mean 10N 47 N 4 N 51GasCost of return trip ( R)M<strong>in</strong> 4 M<strong>in</strong> M<strong>in</strong> 10Max 120 Max Max 11Mean 33 Mean Mean 10N 25 N 0 N 5Charg<strong>in</strong>g car batteriesCost of return trip ( R)M<strong>in</strong> 4 M<strong>in</strong> 5 M<strong>in</strong> 5Max 10 Max 10 Max 70Mean 7 Mean 8 Mean 10N 6 N 2 N 42Total monthly cost of M<strong>in</strong> 4 M<strong>in</strong> 5 M<strong>in</strong> 4all return journeys (R) Max 131 Max 12 Max 77Mean 22 Mean 9 Mean 14N 64 N 6 N 69It is not surpris<strong>in</strong>g that <strong>the</strong> sub-sample with <strong>the</strong> least multi-fuel dependence, <strong>the</strong> grid-users, have <strong>the</strong>smallest percentage (13%) of households report<strong>in</strong>g that <strong>the</strong>y spend money on trips to purchase fuels.In contrast over 50% of both SHS-users and non-electrified households report pay<strong>in</strong>g for trips toprocure fuels. Non-electrified households have <strong>the</strong> highest percentage, 61%, aga<strong>in</strong>st 53% for SHSusers.The total monthly cost of return journeys to procure fuels is highest for SHS-users (R22) and lowestfor grid-users (R6). The figure of non-electrified households is <strong>in</strong> between <strong>the</strong> o<strong>the</strong>r two at R14. Thedom<strong>in</strong>ance of SHS-households may be due <strong>in</strong> part to <strong>the</strong>ir higher <strong>in</strong>come level relative to <strong>the</strong> o<strong>the</strong>rsub-samples. It has already been suggested that SHS-users may do more shopp<strong>in</strong>g <strong>in</strong> town andpurchase fuels at <strong>the</strong> same time, thus reflect<strong>in</strong>g greater distances and higher expenses even thoughthis expenditure may not be exclusively spent on fuel.8.4 Estimated fuel replacement with solar or grid electricityTable 8.4: Fuels used less s<strong>in</strong>ce obta<strong>in</strong><strong>in</strong>g solar or grid electricityAre <strong>the</strong>re fuels used less? SHS-users Grid-usersYes 94% 93%No 6% 7%A large proportion of both SHS-users and grid-users (over 90%) felt that <strong>electrification</strong> has resulted<strong>in</strong> <strong>the</strong>m us<strong>in</strong>g less of o<strong>the</strong>r fuels. A small percentage (6-7%) <strong>in</strong> each case felt no difference hadoccurred. The reason for this m<strong>in</strong>ority view may have to do with reliability of <strong>the</strong> electricity supply,though this is less likely to be <strong>the</strong> case with grid-users. The major impact was on light<strong>in</strong>g fuels asshown <strong>in</strong> Table 8.5 below.ENERGY RESEARCH CENTRE
<strong>Solar</strong> <strong>electrification</strong> <strong>by</strong> <strong>the</strong> <strong>concession</strong> <strong>approach</strong> <strong>in</strong> <strong>rural</strong> <strong>Limpopo</strong> prov<strong>in</strong>ce 27Table 8.5: Fuels used less s<strong>in</strong>ce obta<strong>in</strong><strong>in</strong>g solar or grid electricityFuel% of respondents mention<strong>in</strong>g <strong>the</strong> fuelSHS-usersGrid-usersCandles 61% 49%Paraff<strong>in</strong> 31% 40%Wood 0% 2%Dry cell batteries 1% 2%Generator 1% 0%n/a 6% 7%Reduction <strong>in</strong> <strong>the</strong> use of candles was seen as <strong>the</strong> greatest impact on o<strong>the</strong>r fuels <strong>by</strong> 61% of SHSs users,with paraff<strong>in</strong> be<strong>in</strong>g <strong>the</strong> only o<strong>the</strong>r significant fuel said to have been affected <strong>by</strong> <strong>the</strong> acquisition ofSHSs (31%). S<strong>in</strong>ce SHSs cannot cook or be used for o<strong>the</strong>r <strong>the</strong>rmal applications, this impact is whatmight be expected.Grid users stated that candles and paraff<strong>in</strong> were <strong>the</strong> fuels whose use had been reduced <strong>by</strong> <strong>the</strong>ir be<strong>in</strong>gconnected to <strong>the</strong> grid. Wood is also mentioned, albeit <strong>by</strong> only 2% of grid connected respondents.Grid electricity can displace wood for cook<strong>in</strong>g and o<strong>the</strong>r <strong>the</strong>rmal applications, but is relativelyexpensive, which is why its impact on <strong>the</strong> use of wood is found to be limited. The fact that <strong>the</strong>majority of households us<strong>in</strong>g wood collect it free is a major factor here.Table 8.6: Changes <strong>in</strong> expenditure on fuels s<strong>in</strong>ce obta<strong>in</strong><strong>in</strong>g solar or grid electricityTrend SHS-users Grid-usersSpend<strong>in</strong>g more money 22% 2%Spend<strong>in</strong>g less money 52% 93%Same 11% 2%Miss<strong>in</strong>g or n/a 15% 2%The question on <strong>the</strong> effect of <strong>electrification</strong> on expenditure on fuels produced a fairly unequivocalresponse (93%) from grid-users who <strong>in</strong>dicated that <strong>the</strong>y were spend<strong>in</strong>g less money than before<strong>electrification</strong>. SHS-users were less certa<strong>in</strong>, with about half say<strong>in</strong>g <strong>the</strong>y were spend<strong>in</strong>g less money,11% say<strong>in</strong>g no change had occurred, and 22% say<strong>in</strong>g <strong>the</strong>y were spend<strong>in</strong>g more money. In view of<strong>the</strong> fact that <strong>the</strong> mean expenditure on grid electricity is a little over half of that on SHSs, <strong>the</strong>sentiment among SHS-users can be understood.ENERGY RESEARCH CENTRE
<strong>Solar</strong> <strong>electrification</strong> <strong>by</strong> <strong>the</strong> <strong>concession</strong> <strong>approach</strong> <strong>in</strong> <strong>rural</strong> <strong>Limpopo</strong> prov<strong>in</strong>ce 289. Household light<strong>in</strong>g <strong>in</strong> practiceThe most important benefit of hav<strong>in</strong>g SHSs was said <strong>by</strong> most respondents to be light<strong>in</strong>g, and <strong>the</strong>light was found brighter than candles and paraff<strong>in</strong> lamps. This section explores <strong>the</strong> views ofrespondents on this improved light<strong>in</strong>g compared to more traditional forms of light<strong>in</strong>g.9.1 Coverage of household light<strong>in</strong>g (number of rooms, number oflights)The configuration of SHSs <strong>in</strong> <strong>Limpopo</strong> prov<strong>in</strong>ce is typically three lights <strong>in</strong>side (one <strong>in</strong> each of threeselected rooms) and one light outside. The mean number of rooms per homestead is 4.6 for SHSusers, which is higher than <strong>the</strong> o<strong>the</strong>r sub-samples, both of which have less than four rooms perhomestead. Clearly <strong>the</strong>re would be a shortfall <strong>in</strong> <strong>the</strong> number of lights for SHS-owners <strong>in</strong> generals<strong>in</strong>ce <strong>the</strong>y have more rooms than lights. In fact only 24% of SHS owners had lights <strong>in</strong> all <strong>the</strong>irrooms. About 54% had up to four rooms without lights. No household reported hav<strong>in</strong>g applied formore than one SHS, and none were found to have more than one SHS <strong>in</strong>stalled. It is possible that <strong>the</strong>cost of two SHSs may have been an important factor <strong>in</strong> discourag<strong>in</strong>g <strong>the</strong> acquisition of more thanone SHS.Among grid-users only six households (13%) had more than one room without electric light<strong>in</strong>g and24% had one room without electric light<strong>in</strong>g..9.2 When lights are switched on and off (differences between seasons)The shorter day length <strong>in</strong> w<strong>in</strong>ter results <strong>in</strong> lights be<strong>in</strong>g switched on earlier than <strong>in</strong> summer. There isroughly a one and half hour difference <strong>in</strong> <strong>the</strong> sunrise and sunset times for Polokwane. 4 A tableshow<strong>in</strong>g <strong>the</strong> w<strong>in</strong>ter (June) and summer (December) sunrise and sunset times for Polokwane is given<strong>in</strong> Appendix III. Three quarters of SHS-owners switched on <strong>the</strong>ir lights with<strong>in</strong> 40 m<strong>in</strong>utes to onehour after sunset. Given that <strong>the</strong> twilight is about half an hour, this pattern fits well with <strong>the</strong> onset ofdarkness.In summer, <strong>by</strong> 19:00hrs, two thirds of household would have switched on <strong>the</strong>ir lights. By 19:30hrs,<strong>the</strong> percentage of households with lights switched on would have risen to 74%. Very few households(7%) switched <strong>the</strong>ir lights off before 21:00hrs. Most lights were put out between 21:00hrs and22:00hrs. 39% of households switched off <strong>the</strong>ir lights at 21:00hrs, and <strong>by</strong> 22:00 hrs 74% of lightswould be off.In w<strong>in</strong>ter, 50% of lights were switched on at 18:00hrs, and <strong>in</strong> <strong>the</strong> next half hour <strong>the</strong> percentage ofSHS-users with lights on would rise to 76%. Switch off was found to be earlier than <strong>in</strong> summer, withmost lights be<strong>in</strong>g out between 20:00-21:00hrs. The largest switch-off peak was at 21:00hrs (34%)compared to 21% and 18% for 20:00hrs and 20:30hrs respectively. In w<strong>in</strong>ter, <strong>by</strong> 22:00hrs some 95%of lights would be off.9.3 Attitudes towards electricity wasteThere seemed to be greater awareness of <strong>the</strong> need to conserve electricity among SHS-ownerscompared to grid-owners. This is to be expected given <strong>the</strong> awareness of <strong>the</strong> SHS-owners of <strong>the</strong>limited energy at <strong>the</strong>ir disposal <strong>in</strong> <strong>the</strong> even<strong>in</strong>g.Almost all (97%) SHS owners switch off lights <strong>in</strong> empty rooms, <strong>the</strong> ma<strong>in</strong> reason be<strong>in</strong>g to saveelectricity (88%) and <strong>in</strong> a few cases (6%) because <strong>the</strong> battery would be low. While watch<strong>in</strong>g TVSHS-users mostly switched off lights (37% vs 24% who did not) primarily to save electricity (30%)– no o<strong>the</strong>r reason got more than 4% mention.Grid-users behave quite differently, with only 56% switch<strong>in</strong>g off lights <strong>in</strong> empty rooms, and 31%giv<strong>in</strong>g <strong>the</strong> reason for this as ‘sav<strong>in</strong>g electricity’ while ano<strong>the</strong>r 22% had ‘sav<strong>in</strong>g money’ as <strong>the</strong>ir4There are numerous sites available on <strong>the</strong> <strong>in</strong>ternet for calculat<strong>in</strong>g sunrise and sunset times for any location onearth if <strong>the</strong> co-ord<strong>in</strong>ates and time zone are known. See for example www.compsolv.com/los/sunset.html ormach.usno.navy.mil/cgi-b<strong>in</strong>/aa_pap (accessed July 2004).ENERGY RESEARCH CENTRE
<strong>Solar</strong> <strong>electrification</strong> <strong>by</strong> <strong>the</strong> <strong>concession</strong> <strong>approach</strong> <strong>in</strong> <strong>rural</strong> <strong>Limpopo</strong> prov<strong>in</strong>ce 29reason. When watch<strong>in</strong>g TV most grid users (56%) did not switch off <strong>the</strong>ir lights. Those who did(33%) had two ma<strong>in</strong> reasons; sav<strong>in</strong>g electricity (20%) and better view of <strong>the</strong> TV image (13%).9.4 Light<strong>in</strong>g quality comparisons between different fuelsGrid-users unanimously felt that electric lights were brighter than candles and paraff<strong>in</strong>, but 9% feltthat gas lights were equal or brighter and 51% felt that solar lights were equal to or brighter than gridelectric lights. SHS-users were, like grid-users, unanimous that <strong>the</strong>ir SHS lights were brighter thancandles and paraff<strong>in</strong> lamps (with one exception who felt that SHS lights were equal to candles). 26%felt that gas lights were equal to or brighter than SHS lights. When compar<strong>in</strong>g grid lights to SHSlights, roughly equal percentages felt that <strong>the</strong> two were equally bright (34%) and that SHS lightswere brighter (36%).9.5 Activities for which SHS lights are usedTable 9.1: Activities us<strong>in</strong>g solar or grid light<strong>in</strong>g at <strong>the</strong> time of <strong>the</strong> surveyActivities* SHS-users Grid-usersSocialise/rest 22% 40%Watch TV/listen to radio 34% 13%Read/write 13% Not on listHomework/study 28% 4%Household chores 3% 31%Craft work 0% 7%Bath/prepare for work 0% 4%*These activities were chosen from a pre-established list and multiple responses were possible. The first (mostpopular) activity is reported <strong>in</strong> this table.The activities for which solar light<strong>in</strong>g was used are dom<strong>in</strong>ated <strong>by</strong> TV and radio, followed <strong>by</strong>homework and study. ‘Socialise and rest’ came third on <strong>the</strong> list, and ‘read/write’ was fourth. Amonggrid-users, <strong>the</strong> major difference is <strong>the</strong> greater emphasis on use for ‘socialise/rest’, and <strong>the</strong> far greaterimportance on use of grid light<strong>in</strong>g for household chores. The fact that grid light<strong>in</strong>g normally coversall rooms <strong>in</strong> a homestead means that all activities can be performed under grid light<strong>in</strong>g. In contrast,SHS light<strong>in</strong>g generally caters for selected rooms only and is necessarily reserved for priority but lowpower applications. This means some household chores must be carried out with o<strong>the</strong>r means oflight<strong>in</strong>g.9.6 Inside and outside lightsAbout 80% of grid-owners <strong>in</strong>dicated switch<strong>in</strong>g times for outside lights compared to 98% for SHSowners.The latter virtually all have outside lights because <strong>the</strong> configuration of <strong>the</strong>ir SHSs <strong>in</strong>cludesone outside light for a s<strong>in</strong>gle system. 95% of SHS outside lights were on <strong>by</strong> 19:00hrs and 78% wereoff <strong>by</strong> 22:00hrs. Among grid-users 78% of outside lights were on <strong>by</strong> 19:00hrs, and 51% were off <strong>by</strong>22:00hrs. This improved slightly to 56% <strong>by</strong> 22:30 hrs, suggest<strong>in</strong>g that some households may leave<strong>the</strong>ir grid outside lights on all night. This is supported <strong>by</strong> <strong>the</strong> much larger percentage of grid-ownerswho felt that outside lights had an impact on security (76%) compared to a much lower 44% who felt<strong>the</strong> same way among SHS users.ENERGY RESEARCH CENTRE
<strong>Solar</strong> <strong>electrification</strong> <strong>by</strong> <strong>the</strong> <strong>concession</strong> <strong>approach</strong> <strong>in</strong> <strong>rural</strong> <strong>Limpopo</strong> prov<strong>in</strong>ce 3010. Socio-economic impacts of SHS and grid<strong>electrification</strong>This section looks at <strong>the</strong> energy use patterns of <strong>the</strong> three sub-samples, SHS-users, grid-users, andnon-electrified households. The chang<strong>in</strong>g patterns of fuel use that have resulted from <strong>electrification</strong>are explored, as well as <strong>the</strong> expenditure on energy, which will be seen to be more onerous on <strong>the</strong>poorer households.10.1 Energy expenditure of householdsTotal monthly expenditure on all fuels exclud<strong>in</strong>g electricitySHS-users reported spend<strong>in</strong>g more than <strong>the</strong> o<strong>the</strong>r sub-samples on energy before <strong>the</strong> cost ofelectricity is added. Grid owners spent <strong>the</strong> least on energy before <strong>the</strong> cost of electricity is added. Oneexplanation for this is that grid-users do not use as wide a mix of fuels as <strong>the</strong> o<strong>the</strong>r sub-samples, andthat SHS-users have <strong>the</strong> highest <strong>in</strong>comes and can be expected to spend more. Non-electrifiedhouseholds, with <strong>the</strong>ir greater level of multi-fuel dependence spend almost twice as much as griduserswhen <strong>the</strong> cost of grid electricity is not taken <strong>in</strong>to account.Table 10.1: Total monthly expenditure (R) on all fuels exclud<strong>in</strong>g electricityCategory M<strong>in</strong> Max Mean Std deviationSHS-users 4.50 542.40 82.06 89.02Grid-users 6.95 234.37 38.92 46.75Non-electrified households 5.66 310.73 72.90 60.02Monthly expenditure on energy <strong>in</strong> Rands400350300250200150100500All SHS Grid Non ElecExplanation of box plot figures. The vertical l<strong>in</strong>es with diamonds show <strong>the</strong> mean value across <strong>the</strong> centre of<strong>the</strong> diamond, with <strong>the</strong> confidence <strong>in</strong>terval (95%) shown <strong>by</strong> <strong>the</strong> vertical spread of <strong>the</strong> diamond.Figure 10.1: 5 Total monthly expenditure on energy <strong>by</strong> sub-sample5For this box plot and <strong>the</strong> associated table follow<strong>in</strong>g it, extreme outliers three or more IQRs (<strong>in</strong>ter quartileranges) from <strong>the</strong> median were ignored. The median value is <strong>the</strong> horizontal l<strong>in</strong>e across <strong>the</strong> box. The mean is <strong>the</strong>horizontal l<strong>in</strong>e across <strong>the</strong> diamond.ENERGY RESEARCH CENTRE
<strong>Solar</strong> <strong>electrification</strong> <strong>by</strong> <strong>the</strong> <strong>concession</strong> <strong>approach</strong> <strong>in</strong> <strong>rural</strong> <strong>Limpopo</strong> prov<strong>in</strong>ce 31Table 10.2: Monthly expenditure (R) on all fuels <strong>in</strong>clud<strong>in</strong>g electricityn Mean Median SDAll sub-samples 275 93.20 74.00 68.02SHS-owners 120 128.02 92.17 78.04Grid-owners 42 59.10 58.16 27.77Non-electrified households 114 72.90 55.10 60.02When <strong>the</strong> cost of electricity is <strong>in</strong>cluded, <strong>the</strong> energy expenditure for SHS-users still rema<strong>in</strong>s <strong>the</strong>highest, and that for non-electrified households, unchanged, rema<strong>in</strong>s <strong>the</strong> second highest. The relativemagnitudes of <strong>the</strong>se expenditures can be easily compared <strong>in</strong> Figure 10.1 above. The figure also<strong>in</strong>cludes <strong>the</strong> overall mean for comparison, and it is apparent that SHS-users are <strong>the</strong> only sub-sampleabove <strong>the</strong> overall mean.10.2 The proportion of household budget devoted to fuels andelectricityAverage proportion of <strong>in</strong>come spent on all fuels accord<strong>in</strong>g to sub-samplesTable 10.3: Proportion of <strong>in</strong>come spent on all fuels accord<strong>in</strong>g to sub-samplesn Mean Median Std devAll sub-samples 247 8.6% 7.0% 6.3%SHS-owners 115 10.8% 8.3% 7.8%Grid-owners 40 6.1% 4.7% 4.3%Non-electrified households 95 7.6% 6.3% 5.6%When all households are taken <strong>in</strong>to account, <strong>the</strong> mean percentage of total <strong>in</strong>come spent on energy is8.6%. SHS-users top <strong>the</strong> list for percentage of <strong>in</strong>come spent on energy, with a figure of 10.8% whilegrid-users spend <strong>the</strong> least, 6.1%. Thus, despite <strong>the</strong>ir higher <strong>in</strong>comes relative to <strong>the</strong> o<strong>the</strong>r subsamples,<strong>the</strong> high energy expenditure of SHS-users means <strong>the</strong>y still spend a larger proportion of <strong>the</strong>ir<strong>in</strong>come on energy.The fact that <strong>the</strong> poorest still spend a larger proportion of <strong>the</strong>ir <strong>in</strong>come on energy is not alteredhowever, as Figure 10.2 shows. It can be seen that households with <strong>in</strong>comes above R1 000 permonth do not spend more than 20% of <strong>the</strong>ir <strong>in</strong>come on energy (most are below 10%), those earn<strong>in</strong>gbelow this amount can spend far higher percentages on energy. Households earn<strong>in</strong>g above R3000per month spend well below 10% of <strong>the</strong>ir <strong>in</strong>come on energy.% of <strong>in</strong>come spent on energy ________70%60%50%40%30%20%10%0%- 1000 2000 3000 4000 5000 6000Total monthly <strong>in</strong>comeTable 10.2: Scatter plot of <strong>in</strong>come vs expenditure for all households <strong>in</strong> all sub-samplesENERGY RESEARCH CENTRE
<strong>Solar</strong> <strong>electrification</strong> <strong>by</strong> <strong>the</strong> <strong>concession</strong> <strong>approach</strong> <strong>in</strong> <strong>rural</strong> <strong>Limpopo</strong> prov<strong>in</strong>ce 32Figure 10.3 summarises <strong>the</strong> percentage of <strong>in</strong>come spent on energy for all households, and for <strong>the</strong>three sub-samples. It can be seen that grid-users spend a smaller percentage of <strong>the</strong>ir <strong>in</strong>come onenergy and SHS-users spend <strong>the</strong> highest.% of monthly <strong>in</strong>come spent on energy40%35%30%25%20%15%10%5%0%All SHS GRID Non-elecExplanation of box plot figures:The vertical l<strong>in</strong>es with diamonds show <strong>the</strong> mean value across <strong>the</strong> centre of <strong>the</strong> diamond, with <strong>the</strong>confidence <strong>in</strong>terval (95%) shown <strong>by</strong> <strong>the</strong> vertical spread of <strong>the</strong> diamond.The boxes show <strong>the</strong> median value as <strong>the</strong> middle horizontal l<strong>in</strong>e, with <strong>the</strong> angled portion show<strong>in</strong>g <strong>the</strong>confidence <strong>in</strong>terval. Box height shows <strong>the</strong> <strong>in</strong>ter–quartile range, IQR (upper, lower).Outliers are plotted as ---- up to 1.5 IQR from <strong>the</strong> median, +++ from 1.5 to 3 IQRs from median, and oooo iffur<strong>the</strong>r than 3 IQRs from <strong>the</strong> median (far outliers).Figure 10.3: Percentage of total monthly <strong>in</strong>come spent on energy (all households and <strong>by</strong>sub-sample)10.3 Information: Extent of use of radio and TVTable 10.4: Household members who watch television mostSHS-users Grid-users Non-electrified householdsAdult men 4% 18% 1%Adult women 4% 4% 0%School-go<strong>in</strong>g children 12% 18% 4%All 12% 18% 11%Adult men & women 2% 0% 0%Adult women and children 4% 0% 0%Miss<strong>in</strong>g or n/a 62% 42% 69%Schoolgo<strong>in</strong>g children watch TV more than any o<strong>the</strong>r group except grid-users where adult men watchequally frequently. Perhaps men make a po<strong>in</strong>t of watch<strong>in</strong>g specific programmes like news and sportwhile wives are occupied with cook<strong>in</strong>g, clean<strong>in</strong>g, wash<strong>in</strong>g up, and o<strong>the</strong>r household chores.ENERGY RESEARCH CENTRE
<strong>Solar</strong> <strong>electrification</strong> <strong>by</strong> <strong>the</strong> <strong>concession</strong> <strong>approach</strong> <strong>in</strong> <strong>rural</strong> <strong>Limpopo</strong> prov<strong>in</strong>ce 3310.4 Enterta<strong>in</strong>mentDuration per day of TV watch<strong>in</strong>gTable 10.5: Duration per day of TV watch<strong>in</strong>gSHS-users Grid-users* Non-electrified householdsAbout 4 hours 6% 24% 2%Up to 4 hours 37% 51% 26%One hour 4% 0% 3%*The m<strong>in</strong>imum for grid-electrified households was 2 hours.Grid users were found to watch TV for at least 2 hours, and had <strong>the</strong> highest number of householdmembers watch<strong>in</strong>g for four hours and more. The constra<strong>in</strong><strong>in</strong>g effect of SHS is apparent, with only6% report<strong>in</strong>g about four hours TV watch<strong>in</strong>g.10.5 Education (extension of times of children’s homework)Persons <strong>in</strong> <strong>the</strong> household study<strong>in</strong>g or do<strong>in</strong>g homeworkTable 10.6: Persons <strong>in</strong> <strong>the</strong> household study<strong>in</strong>g or do<strong>in</strong>g homeworkSHSusersGridusersNon-electrified householdsYes 83% 71% 81%No 17% 29% 19%There were high percentages of persons study<strong>in</strong>g <strong>in</strong> all sub-samples, particularly among <strong>the</strong> SHSusersand non-electrified households. The questions of how long <strong>the</strong>y study and <strong>the</strong> extent to whichSHS-users make use of solar light<strong>in</strong>g are explored <strong>in</strong> <strong>the</strong> follow<strong>in</strong>g tables.Table 10.7: Length of time <strong>the</strong>y studySHS-users Grid-users Non-electrified householdsLess than one hour 0% 2% 2%One to two hours 29% 33% 49%Miss<strong>in</strong>g or n/a 16% 29% 21%The length of time students study does not seem to depend on <strong>the</strong> <strong>electrification</strong> sub-sample to which<strong>the</strong>y belong. Those study<strong>in</strong>g with grid light<strong>in</strong>g or solar lights do so under better light, but study isnever<strong>the</strong>less possible with candles. The SHS-users also report study<strong>in</strong>g with, and sometimes withoutus<strong>in</strong>g <strong>the</strong>ir solar lights.Table 10.8: Use of solar light when study<strong>in</strong>gSHS-usersAlways 43%Sometimes 41%Never 0%n/a 17%There were no respondents who claimed never to use <strong>the</strong>ir solar lights when study<strong>in</strong>g. 43% claimed<strong>the</strong>y always used <strong>the</strong>ir solar lights, and 41% sometimes used <strong>the</strong>ir solar lights when study<strong>in</strong>g. Thereason for <strong>the</strong> sizeable proportion of respondents who use <strong>the</strong>ir solar lights sometimes for study<strong>in</strong>gmay be due to reliability of <strong>the</strong>ir SHSs, limited hours of operation of <strong>the</strong> SHSs, or because not allENERGY RESEARCH CENTRE
<strong>Solar</strong> <strong>electrification</strong> <strong>by</strong> <strong>the</strong> <strong>concession</strong> <strong>approach</strong> <strong>in</strong> <strong>rural</strong> <strong>Limpopo</strong> prov<strong>in</strong>ce 34rooms are usually fitted with solar lights and <strong>the</strong> students cannot always have use of <strong>the</strong> rooms withsolar lights.10.6 Changes <strong>in</strong> livesThere is a general perception that <strong>electrification</strong> <strong>by</strong> both grid and SHS changed respondents’ lives.This is very pronounced among grid-owners, with 96% <strong>in</strong>dicat<strong>in</strong>g that <strong>the</strong>ir lives had been changed.For SHS-users <strong>the</strong> figure was 83%. The known limitations of SHS already expressed as <strong>the</strong> likes anddislikes of SHS-users provide part of <strong>the</strong> explanation for this difference.Table 10.9: If SHS and grid electricity changes respondent’s livesSHS-users Grid-usersYes 83% 96%No 17% 2%Miss<strong>in</strong>g 0% 2%There are also differences between SHS-users and grid-users <strong>in</strong> what <strong>the</strong>y saw as <strong>the</strong> most importantchanges result<strong>in</strong>g from <strong>electrification</strong>. Table 10.10 explores <strong>the</strong>se differences fur<strong>the</strong>r.Table 10.10: Most important changes result<strong>in</strong>g from solar power and grid electricityChange SHS-users Grid-usersLess work 2% 13%Less candle use 7% 24%Appliance daily use 11% 36%Less wood collection 0% 9%Safe/brighter light<strong>in</strong>g 27% 9%Children are study<strong>in</strong>g 6% 2%Save money 8% 0%Noth<strong>in</strong>g 0% 4%Miss<strong>in</strong>g 31% 6%SHS-owners saw listen<strong>in</strong>g to <strong>the</strong> radio, buy<strong>in</strong>g less fuel, sav<strong>in</strong>g money, and bright lights as be<strong>in</strong>g <strong>the</strong>top four changes result<strong>in</strong>g from SHS <strong>electrification</strong>. Grid-owners, on <strong>the</strong> o<strong>the</strong>r hand, saw <strong>the</strong> dailyuse of appliances, reduced candle use, less work, and brighter lights/safety and reduced need tocollect wood as <strong>the</strong>ir most important changes. The issue of reduced wood collection is <strong>in</strong>terest<strong>in</strong>gbecause some 22% of grid-users use electricity as <strong>the</strong>ir ma<strong>in</strong> cook<strong>in</strong>g fuel, while <strong>the</strong> rema<strong>in</strong>der usewood which is largely collected free and collection is seen as a m<strong>in</strong>or problem. This situation limits<strong>the</strong> ability of grid electricity to reduce <strong>the</strong> use of wood as a cook<strong>in</strong>g fuel, particularly while <strong>the</strong> woodis free. Some 9% of grid-users reported that <strong>the</strong>y were no longer able to buy certa<strong>in</strong> th<strong>in</strong>gs becauseof <strong>the</strong> cost of grid electricity.The proportion of SHS-users who are unable to buy certa<strong>in</strong> items because of service fee payments issome three times higher that <strong>the</strong> correspond<strong>in</strong>g proportion of grid-usersTable 10.11: Are <strong>the</strong>re th<strong>in</strong>gs <strong>the</strong> household cannot buy anymore s<strong>in</strong>ce obta<strong>in</strong><strong>in</strong>gelectricityTh<strong>in</strong>gs cannot buy SHS-users Grid-usersYes 27% 9%No 56% 89%Miss<strong>in</strong>g 17% 2%ENERGY RESEARCH CENTRE
<strong>Solar</strong> <strong>electrification</strong> <strong>by</strong> <strong>the</strong> <strong>concession</strong> <strong>approach</strong> <strong>in</strong> <strong>rural</strong> <strong>Limpopo</strong> prov<strong>in</strong>ce 35SHS-users have already been shown to be pay<strong>in</strong>g a larger proportion of <strong>the</strong>ir <strong>in</strong>come towards energycosts, and that <strong>the</strong>ir monthly service fee of R58 is nearly double <strong>the</strong> mean grid cost of R31.90. Theitems that <strong>the</strong>y are no longer able to buy are predom<strong>in</strong>antly foods as shown <strong>in</strong> Table 10.12.Table 10.12: Selected th<strong>in</strong>gs households are unable to buy any moreItems impactedSHS-usersFood 13%Transport money 0%School fees 0%General household needs 1%Grid owners do not feel constra<strong>in</strong>ed <strong>by</strong> <strong>the</strong>ir electricity payments to <strong>the</strong> extent of fail<strong>in</strong>g to buyth<strong>in</strong>gs <strong>the</strong>y were able to buy prior to <strong>electrification</strong>. They would also be more will<strong>in</strong>g to recommendgrid electricity to o<strong>the</strong>rs as shown <strong>in</strong> Table 10.13. The percentage of SHS-users will<strong>in</strong>g torecommend SHS to o<strong>the</strong>rs is much lower than <strong>the</strong> correspond<strong>in</strong>g figure for grid-users when <strong>the</strong>sefigures are compared to <strong>the</strong> proportion of respondents who felt that <strong>the</strong>ir lives had been changedTable 10.13: Would advise o<strong>the</strong>rs to get a SHS or grid electricitySHS-usersGrid-usersYes 60% 96%No 31% 2%Miss<strong>in</strong>g or n/a 9% 2%For grid-users <strong>the</strong> number who felt <strong>the</strong>ir lives had been changed <strong>by</strong> grid <strong>electrification</strong> is <strong>the</strong> same as<strong>the</strong> number who would recommend grid electricity to o<strong>the</strong>rs. This fur<strong>the</strong>r confirms <strong>the</strong> greater levelof satisfaction among grid-users.10.7 Contribution to job creationIt is perhaps expect<strong>in</strong>g too much to look for a mean<strong>in</strong>gful impact on unemployment from <strong>the</strong>implementation of a fee-for-service SHS project. By its nature <strong>the</strong> operation is quite centralised andafter <strong>the</strong> <strong>in</strong>stallation phase, typically <strong>the</strong> only local people directly employed would be a few officestaff and ma<strong>in</strong>tenance technicians. The <strong>Solar</strong>vision office employs seven persons exclud<strong>in</strong>gtechnicians, who are paid on <strong>the</strong> basis of number of SHSs attended to. Perhaps <strong>the</strong> majorshortcom<strong>in</strong>g has to do with <strong>the</strong> <strong>in</strong>ability of SHSs to power productive activities such as gr<strong>in</strong>d<strong>in</strong>g,weld<strong>in</strong>g, irrigation and food process<strong>in</strong>g.ENERGY RESEARCH CENTRE
<strong>Solar</strong> <strong>electrification</strong> <strong>by</strong> <strong>the</strong> <strong>concession</strong> <strong>approach</strong> <strong>in</strong> <strong>rural</strong> <strong>Limpopo</strong> prov<strong>in</strong>ce 3611. Conclusions and key issuesThese conclusions perta<strong>in</strong> to <strong>the</strong> basel<strong>in</strong>e survey. A second survey was undertaken <strong>in</strong> mid 2004 <strong>in</strong><strong>the</strong> same area and will capture more recent developments <strong>in</strong>clud<strong>in</strong>g longer-term views anddisconnections.11.1 The objectives of <strong>the</strong> researchThe household surveys aimed to explore <strong>the</strong> impacts of SHSs over time, ascerta<strong>in</strong><strong>in</strong>g <strong>the</strong> nature andextent of any fuel switch<strong>in</strong>g associated with <strong>the</strong> SHSs, impacts on <strong>rural</strong> livelihoods, and attitudes ofhouseholds exposed to systems.11.2 Characteristics of <strong>the</strong> households surveyedSHS users were found to be wealthier on average that <strong>the</strong> o<strong>the</strong>r two categories. The mean monthly<strong>in</strong>come for SHS users was found to be R1543, compared to R1163 for grid users and R819 for nonelectrifiedhouseholds. That SHS users should have <strong>the</strong> highest mean monthly <strong>in</strong>come is notsurpris<strong>in</strong>g because to qualify for <strong>the</strong>se systems <strong>the</strong>y had to have regular <strong>in</strong>come. The mean monthlyper capita <strong>in</strong>come showed a similar pattern, be<strong>in</strong>g highest for <strong>the</strong> SHS-users.The size of <strong>the</strong> SHS-users households was found to be <strong>the</strong> largest. The reason for this is not obviousbut could be l<strong>in</strong>ked to <strong>the</strong> presence of relatives at <strong>the</strong>se wealthier homes. The trend between <strong>the</strong> o<strong>the</strong>rsub-samples is more conventional, with <strong>the</strong> poorer non-electrified households hav<strong>in</strong>g largerhousehold sizes.11.3 Installation of <strong>the</strong> SHSsCommunity <strong>in</strong>formation dissem<strong>in</strong>ation seems to have been effective <strong>in</strong> <strong>in</strong>form<strong>in</strong>g most solar homesystem-owners about SHSs. Installations were also prompt, with 83% of <strong>in</strong>stallations be<strong>in</strong>g carriedout one month or less after application. Grid connections were much slower, achiev<strong>in</strong>g a similarlevel of <strong>in</strong>stallation (76%) <strong>in</strong> two years.The transfer of <strong>in</strong>formation to users was good, though distribution of written materials was ra<strong>the</strong>rlimited, with about a third of survey respondents report<strong>in</strong>g that no written material was providedwith <strong>the</strong>ir solar home systems.Close to 90% of respondents knew that <strong>the</strong> SHSs did not belong to <strong>the</strong> households. All respondentsexcept one had signed contracts with <strong>Solar</strong>vision, and about 70% had been given an explanation buthalf claimed not to understand <strong>the</strong> terms of <strong>the</strong> contract. Despite this limited understand<strong>in</strong>g, 70%were satisfied with <strong>the</strong> contract provisions.The expectations and satisfaction f<strong>in</strong>d<strong>in</strong>gs suggest general satisfaction with <strong>in</strong>stallation of solarhome systems. 20% of respondents had a compla<strong>in</strong>t and 27% were not satisfied with <strong>the</strong> contract.There was widespread desire for larger systems, particularly to power colour televisions and morelights. The issue of more lights arises because SHS-users generally have rooms that are not fittedwith solar lights.11.4 Customer satisfaction and ambivalenceBy a wide marg<strong>in</strong>, <strong>the</strong> most liked feature of SHSs was better light. Some ambivalence <strong>in</strong> attitudescan be expected s<strong>in</strong>ce <strong>the</strong>re are clear benefits that come with SHSs, but also some frustrat<strong>in</strong>glimitations. The expectation that <strong>the</strong> grid will be com<strong>in</strong>g and <strong>the</strong> overwhelm<strong>in</strong>g preference for gridelectricity contribute to <strong>the</strong> ambivalence.Expectations for what would be used with <strong>the</strong> SHSs reveals some <strong>in</strong>itial ignorance of <strong>the</strong> capabilitiesand limitations of solar home systems. Respondents expected to use <strong>in</strong>compatible appliances, forexample stoves (14%), colour televisions (12%), and refrigerators (9%). Information may not havebeen effectively dissem<strong>in</strong>ated or packaged. The most cited source of dissatisfaction among ownersof solar home systems was power limitation and issues around it, <strong>in</strong>clud<strong>in</strong>g power cuts, <strong>in</strong>ability touse certa<strong>in</strong> appliances. These compla<strong>in</strong>ts accounted for 65% of negative responses on satisfaction. Incontrast positive responses were fewer and <strong>in</strong>dicated better light<strong>in</strong>g (12%), and all needs satisfied(13%). 40% of respondents had experienced a problem with <strong>the</strong>ir SHSs, and 16% were unresolved atENERGY RESEARCH CENTRE
<strong>Solar</strong> <strong>electrification</strong> <strong>by</strong> <strong>the</strong> <strong>concession</strong> <strong>approach</strong> <strong>in</strong> <strong>rural</strong> <strong>Limpopo</strong> prov<strong>in</strong>ce 37<strong>the</strong> time of <strong>the</strong> survey. Of course without know<strong>in</strong>g for how long <strong>the</strong>se systems had been unattended,it is not possible to say whe<strong>the</strong>r this represents a ma<strong>in</strong>tenance problem; <strong>the</strong> survey was a snapshot ofan ongo<strong>in</strong>g project and it can be reasonably expected that some systems await<strong>in</strong>g repairs would beencountered.Most SHS owners seem to be unaware that grid-users face a similar dilemma <strong>in</strong> that <strong>the</strong> cost of gridelectricity precluded some 80% of <strong>the</strong>m from us<strong>in</strong>g electricity for cook<strong>in</strong>g.11.5 Problems with <strong>the</strong> SHSsAbout 40% of SHS-users had experienced a problem with <strong>the</strong>ir systems. A similar percentage (37%)felt <strong>the</strong>y were able to identify <strong>the</strong> problem and virtually all had reported <strong>the</strong> problems. The reportswere generally made to <strong>the</strong> energy store, but a few respondents reported to <strong>the</strong> chief, <strong>the</strong> technician,and <strong>the</strong> fee collector. How reliably or promptly <strong>the</strong>se reports reached <strong>the</strong> service provider is notclear. 16% of <strong>the</strong> problems were unresolved at <strong>the</strong> time of <strong>the</strong> survey, but it is not possible to say forhow long <strong>the</strong> problems had been outstand<strong>in</strong>g.The most frequently mentioned problem was low battery voltage. This is generally a symptom thatarises from many causes like loose connections, faulty charge controller, battery com<strong>in</strong>g to <strong>the</strong> endof its useful life, misuse of <strong>the</strong> system, or prolonged cloudy wea<strong>the</strong>r. The problem as reported can<strong>the</strong>refore not directly assist <strong>in</strong> diagnos<strong>in</strong>g what may be wrong with <strong>the</strong> systems.SHS-users pay much more than <strong>the</strong> o<strong>the</strong>r sub-samples and <strong>the</strong>y were frustrated <strong>by</strong> this high cost.Their ma<strong>in</strong> suggestion for mak<strong>in</strong>g payment easier was to reduce <strong>the</strong> service fee. Ano<strong>the</strong>r majorconcern was <strong>the</strong> limitation <strong>in</strong> both what can be used with SHS, <strong>the</strong> number of rooms that could besupplied with power, and <strong>the</strong> time limitation on power availability. The need to purchase o<strong>the</strong>r fuelsadds to <strong>the</strong> cost of energy for SHS households.11.6 Cost, limited power and <strong>the</strong> cost of o<strong>the</strong>r necessary fuelsSHS users pay much more per month than <strong>the</strong> o<strong>the</strong>r sub-samples for <strong>the</strong>ir energy (R128) – more thantwice as much as grid-users (R59) who <strong>in</strong> fact pay <strong>the</strong> least among <strong>the</strong> three sub-samples. SHS-usersare <strong>the</strong> only sub-sample with a mean monthly expenditure on energy that is above <strong>the</strong> overall meanof R93. The service level received <strong>by</strong> grid users is practically unlimited for household level needs.SHS-users have to spend an additional R70 for o<strong>the</strong>r fuels on top of <strong>the</strong> R58 paid for <strong>the</strong> SHS eachmonth. 68% of <strong>the</strong>m thought <strong>the</strong>y should be pay<strong>in</strong>g no more than R30 per month for <strong>the</strong> service,which seems fair and would be comparable to what grid users pay on average for <strong>the</strong>ir electricity.Non-electrified households show <strong>the</strong> highest mean monthly expenditure on fuelwood while solarhome system-users have <strong>the</strong> highest mean expenditure on gas. Grid-users do not use gas, and spendlittle on o<strong>the</strong>r fuels except for fuelwood. Grid electricity is <strong>the</strong>ir second major fuel expenditure item.Because solar home system-users had on average 4.6 rooms per homestead, <strong>the</strong> three <strong>in</strong>side lightsprovided with <strong>the</strong> solar home systems were <strong>in</strong>sufficient to light all rooms. Light<strong>in</strong>g times varied <strong>by</strong>roughly one hour between summer and w<strong>in</strong>ter. Lights were generally switched on 40 m<strong>in</strong>utes to onehour after sunset, which is to be expected given that <strong>the</strong>re is about half an hour of twilight aftersunset. Switch-off time was not very different between grid-users and SHS-users, suggest<strong>in</strong>g thatbedtime was due more to habit than <strong>by</strong> electricity source characteristics.The awareness of <strong>the</strong> need to conserve electricity was greater among solar home system-users, 97%of whom switched off lights <strong>in</strong> unoccupied rooms compared to 56% among grid-users. Switch<strong>in</strong>g offlights while watch<strong>in</strong>g television was common, largely to save electricity <strong>by</strong> SHS-users (20%) and tosee <strong>the</strong> image better among grid-users (13%). The activities for which electric light<strong>in</strong>g was useddiffer <strong>in</strong> that grid-users cite ‘socialise/rest’ and household chores as <strong>the</strong>ir ma<strong>in</strong> uses far more thansolar home system-users, and add ‘crafts/work’, and ‘bath/prepare for work’ which are notmentioned <strong>by</strong> solar home system-users The ‘crafts/work’ activities are <strong>in</strong>terest<strong>in</strong>g because <strong>the</strong>ysuggest a possible productive use. <strong>Solar</strong> home system-users <strong>in</strong>dicated television/radio andhomework/study as <strong>the</strong>ir ma<strong>in</strong> uses for electric light<strong>in</strong>g.Far more grid-users (76%) felt that outside lights had enhanced security than SHS-users (44%),probably because <strong>the</strong> former could regularly leave <strong>the</strong>ir outside lights on all night; someth<strong>in</strong>g solarhome system-users could not do without risk<strong>in</strong>g automatic low voltage cut-offs.ENERGY RESEARCH CENTRE
<strong>Solar</strong> <strong>electrification</strong> <strong>by</strong> <strong>the</strong> <strong>concession</strong> <strong>approach</strong> <strong>in</strong> <strong>rural</strong> <strong>Limpopo</strong> prov<strong>in</strong>ce 38Few grid-users (13%) spend money on trips to get fuel, and spend <strong>the</strong> least on such trips, only amean of R6 per month. This is expla<strong>in</strong>ed <strong>by</strong> <strong>the</strong> strong dependence on just two energy sources, gridelectricity and firewood among grid-users, and <strong>the</strong> fact that most households us<strong>in</strong>g fuelwood collectit free. In sharp contrast, 61% of non-electrified households undertake paid trips to procure fuels,spend<strong>in</strong>g on average R14 per month on <strong>the</strong>se trips. SHS-users reported a slightly lower <strong>in</strong>cidence ofundertak<strong>in</strong>g paid trips to procure fuels, with 53% of households undertak<strong>in</strong>g <strong>the</strong> trips and spend<strong>in</strong>gR22 per month on average. Possible reasons for <strong>the</strong> solar home system-users hav<strong>in</strong>g <strong>the</strong> highestfigure for monthly expenditure on fuel procurement trips <strong>in</strong>clude <strong>the</strong>ir use of gas which istransported <strong>in</strong> heavy cyl<strong>in</strong>ders to depots which are not always near, and <strong>the</strong>ir higher <strong>in</strong>come statuswhich may allow <strong>the</strong>m to buy fuels <strong>in</strong> town.11.7 The cost of fuelsThe SHS service fee was seen as be<strong>in</strong>g too high. Only a quarter of respondents felt that <strong>the</strong> servicewas worth more than R47. The majority, 70%, suggested a range of R10-R30.Gas and fuelwood were found to be particularly expensive for <strong>the</strong> households who used <strong>the</strong>m.Fortunately fuelwood was collected free <strong>by</strong> some 95% of households. Gas was more prevalentamong SHS-users because <strong>the</strong>ir <strong>in</strong>comes allowed <strong>the</strong>m to use this expensive fuel. The mean monthlyexpenditures <strong>by</strong> SHS-owners us<strong>in</strong>g <strong>the</strong> specified fuels were found to be about R21 on candles, R42on paraff<strong>in</strong>, R129 on gas, R73 on fuelwood, R46 on dry cell batteries, and R11 on car batteries(charg<strong>in</strong>g).When <strong>the</strong> cost of electricity is excluded, <strong>the</strong> mean monthly expenditure of non-electrified householdsfar exceeds that of grid-users and is close to that of solar home system-users. With <strong>the</strong> cost ofelectricity <strong>in</strong>cluded, <strong>the</strong> mean monthly expenditure for all households is R93. SHS-users have <strong>the</strong>highest mean of R128 (median R92), non-electrified households <strong>the</strong> second highest at R73 (medianR55), and grid-users <strong>the</strong> lowest at R59 (median R58). The median values for <strong>the</strong> non-electrifiedhouseholds and grid-users are quite similar. The mean values are so different due to <strong>the</strong> <strong>in</strong>fluence ofoutliers (extreme values).The mean percentage of total <strong>in</strong>come spent on energy per month is about 8.6% for all households.For SHS-users <strong>the</strong> percentage is 10.8%, 6.1% for grid-users and 7.6% for non-electrified households.SHS-users top <strong>the</strong> percentage of <strong>in</strong>come spent on energy rank<strong>in</strong>g even though <strong>the</strong>ir <strong>in</strong>comes are <strong>the</strong>highest. This underl<strong>in</strong>es how much greater <strong>the</strong>ir energy expenditure is. A clear trend was also seenwhere<strong>by</strong> <strong>the</strong> poorest households spend a greater proportion of <strong>the</strong>ir <strong>in</strong>comes on pay<strong>in</strong>g for energy.Virtually no households with <strong>in</strong>comes of at least R1000 spend more than 20% of <strong>the</strong>ir <strong>in</strong>comes onenergy. Those with lower <strong>in</strong>comes than this may spend up to about half of reported <strong>in</strong>comes onenergy while those with <strong>in</strong>comes above R3000 spend well below 10%.11.8 Changes <strong>in</strong> fuel use after receiv<strong>in</strong>g SHS or grid electricityThe major impact on fuel use was reduction <strong>in</strong> <strong>the</strong> use of light<strong>in</strong>g fuels, candles, and to a lesserextent paraff<strong>in</strong>. Because SHSs cannot usually cover all rooms, candles and paraff<strong>in</strong> cont<strong>in</strong>ue to beused for <strong>the</strong> o<strong>the</strong>r rooms and also when <strong>the</strong> SHS cuts out. No impact had been made to <strong>the</strong> fuelssupply<strong>in</strong>g most household energy, i.e. those fuels meet<strong>in</strong>g <strong>the</strong> <strong>the</strong>rmal needs, ma<strong>in</strong>ly cook<strong>in</strong>g, waterheat<strong>in</strong>g, and space heat<strong>in</strong>g. Thus, <strong>the</strong> range of fuels used <strong>by</strong> SHS-owners has not been altered, only<strong>the</strong> quantities. The need for supply of <strong>the</strong>se fuels more conveniently still needs to be addressed.Well over 90% of solar home system and grid-users reported that electricity had displaced candlesand paraff<strong>in</strong> as light<strong>in</strong>g fuels. Little else was replaced as was already seen <strong>in</strong> <strong>the</strong> similarity between<strong>the</strong>se two sub-samples <strong>in</strong> <strong>the</strong>ir fuels use patterns.Most grid-users (93%) felt that hav<strong>in</strong>g grid electricity was sav<strong>in</strong>g <strong>the</strong>m money spent on fuels. Farfewer SHS-users (52%) felt <strong>the</strong> same way, and 22% felt <strong>the</strong>y were us<strong>in</strong>g more money on fuels andenergy sources s<strong>in</strong>ce gett<strong>in</strong>g solar home systems. Only 2% of grid-users felt <strong>the</strong> same.Non-electrified households show strongest multi-fuel dependence. The major similarities <strong>in</strong> fuel useand preference were:• SHS and grid-users use wood for <strong>the</strong>rmal end uses, and electricity for light<strong>in</strong>g andaudiovisual applications;• SHS and non-electrified households want grid electricity for virtually all end uses.ENERGY RESEARCH CENTRE
<strong>Solar</strong> <strong>electrification</strong> <strong>by</strong> <strong>the</strong> <strong>concession</strong> <strong>approach</strong> <strong>in</strong> <strong>rural</strong> <strong>Limpopo</strong> prov<strong>in</strong>ce 39Grid-electrified households have least desire to switch. There are different reasons for <strong>the</strong>similarities between grid-users and SHS-users. SHS-users face a power constra<strong>in</strong>t while grid-usersface f<strong>in</strong>ancial constra<strong>in</strong>ts and may also have o<strong>the</strong>r socio-cultural reasons for preferr<strong>in</strong>g to usefirewood.11.9 Changes <strong>in</strong> people’s livesIt has been stated that improved light<strong>in</strong>g was <strong>the</strong> major impact of SHSs on households. This meansthat even without SHS, light<strong>in</strong>g is possible, albeit at an <strong>in</strong>ferior level. The o<strong>the</strong>r major impacts havebeen <strong>in</strong> <strong>in</strong>formation and enterta<strong>in</strong>ment through watch<strong>in</strong>g TV and listen<strong>in</strong>g to <strong>the</strong> radio with greaterconvenience than would be <strong>the</strong> case with car batteries, or dry cell batteries. The overwhelm<strong>in</strong>gpreference for grid electricity however <strong>in</strong>dicates that SHS-users are not yet content. The satisfactionof grid-users, shown <strong>by</strong> <strong>the</strong>ir very limited desire to switch to any o<strong>the</strong>r fuel confirms grid electricityas <strong>the</strong> ‘ultimate’ source of energy for most households.The reach of SHS is generally limited to <strong>the</strong> more affluent <strong>rural</strong> households who can meet <strong>the</strong>service fee requirements. This is likely to rema<strong>in</strong> <strong>the</strong> case <strong>in</strong>to <strong>the</strong> foreseeable future as long as usersmust pay for <strong>the</strong> service.Respondents were positive that <strong>electrification</strong> had changed <strong>the</strong>ir lives, <strong>the</strong> change be<strong>in</strong>g better lightfor solar home system-users; better light and broader range of appliances for grid-users. Over aquarter of SHS-users reported that <strong>the</strong>re were items <strong>the</strong>y were no longer able to buy (ma<strong>in</strong>ly food)because of hav<strong>in</strong>g to pay SHS service fees. Grid-users were much less affected, with only 10%report<strong>in</strong>g that electricity costs had constra<strong>in</strong>ed <strong>the</strong>ir ability to buy o<strong>the</strong>r items. Grid-users wouldreadily advise o<strong>the</strong>r people to get grid connections, while only 60% of grid-users would do <strong>the</strong> same.The SHS project did not have a significant impact on <strong>the</strong> employment situation <strong>in</strong> <strong>Limpopo</strong>prov<strong>in</strong>ce.11.10 Key questions and issuesThe dissem<strong>in</strong>ation of <strong>in</strong>formation to potential SHS users needs to be improved so that all <strong>the</strong>characteristics of <strong>the</strong> technology are well understood. The way <strong>in</strong> which <strong>in</strong>formation is packagedneeds to be appropriate for <strong>the</strong> level of literacy of <strong>the</strong> <strong>in</strong>tended consumer of <strong>the</strong> <strong>in</strong>formation.The issue of ownership of SHS needs to be addressed <strong>in</strong> <strong>the</strong> long term. Perhaps a system where<strong>by</strong><strong>the</strong> ownership of <strong>the</strong> SHS passes to <strong>the</strong> household, coupled with tra<strong>in</strong><strong>in</strong>g of local freelancetechnicians with a system of certification, may be useful.That SHSs fail to reach <strong>the</strong> poor households is a good case for an <strong>in</strong>tegrated <strong>approach</strong> with a focuson poverty reduction. This <strong>approach</strong> will entail collaboration across many development arms ofgovernment and o<strong>the</strong>r non-governmental stakeholders.The <strong>approach</strong> of tight cluster<strong>in</strong>g of <strong>in</strong>stallations of SHSs needs to be emphasized more to improveaccessibility and service to customers <strong>by</strong> <strong>the</strong> service providers. This is one way to reduce <strong>the</strong> cost ofma<strong>in</strong>tenance because transport costs are lower and one technician can more easily service a largernumber of clients.The prospects of <strong>the</strong> grid reach<strong>in</strong>g target areas for SHS dissem<strong>in</strong>ation need to be franklycommunicated to avoid a wait-and see attitude among users, and to avoid bitterness among thosewho accept SHSs only to see <strong>the</strong> grid arrive soon afterwards. This can lead to a sense of hav<strong>in</strong>g beenmisled.ENERGY RESEARCH CENTRE
<strong>Solar</strong> <strong>electrification</strong> <strong>by</strong> <strong>the</strong> <strong>concession</strong> <strong>approach</strong> <strong>in</strong> <strong>rural</strong> <strong>Limpopo</strong> prov<strong>in</strong>ce 4012. Policy recommendationsThe dissem<strong>in</strong>ation of <strong>in</strong>formation needs to be ref<strong>in</strong>ed so that <strong>in</strong>formation is packaged <strong>in</strong> a way thatmakes <strong>the</strong> <strong>in</strong>formation easily accessible to <strong>the</strong> target group. The level of literacy is not high soimportant documents like contracts and user manuals have to be suitably simplified. Contracts arelegal documents and are necessarily complex, but <strong>the</strong>re is no reason why short, pla<strong>in</strong> languageversions cannot also be provided to enable <strong>the</strong> gist of <strong>the</strong> conditions to be understood. Examples ofthis <strong>approach</strong> are <strong>the</strong> South African Lotto pamphlet, or most onl<strong>in</strong>e computer software licenceagreements where <strong>the</strong> user is given a simplified version of <strong>the</strong> terms with <strong>the</strong> option of see<strong>in</strong>g <strong>the</strong>full and much more complex details if he/she wishes.The process of select<strong>in</strong>g areas where solar <strong>electrification</strong> is to be <strong>in</strong>troduced needs to be reviewed.The question that needs to be answered is whe<strong>the</strong>r <strong>the</strong>re will be grid <strong>electrification</strong> of all <strong>rural</strong>households; and if so over what period. Priority should be given to those areas with <strong>the</strong> remotestchance of be<strong>in</strong>g grid electrified, and this should be officially made clear to <strong>the</strong> recipients.Introduc<strong>in</strong>g SHSs where users have been told that <strong>the</strong> grid is com<strong>in</strong>g <strong>in</strong> a few years causes confusionand frustration for both service providers and users.Consideration needs to be given to <strong>the</strong> sett<strong>in</strong>g up of forums for <strong>the</strong> exchange of experiences andideas between service providers, and similarly for recipients of SHSs and <strong>the</strong> technicians serv<strong>in</strong>g<strong>the</strong>m. Exchange visits would be a useful way to facilitate exchange of experiences betweencommunities.If SHSs are meant for <strong>the</strong> <strong>rural</strong> poor, <strong>the</strong> results so far show that <strong>the</strong>y are reach<strong>in</strong>g <strong>the</strong> wealthiest<strong>rural</strong> households. Are <strong>the</strong>se households <strong>the</strong> best recipients for subsidies? Attempts to <strong>in</strong>troducecheaper systems <strong>by</strong> reduc<strong>in</strong>g <strong>the</strong>ir size are not likely to succeed s<strong>in</strong>ce more frustration will resultfrom <strong>the</strong> even lower service level. It has been established that <strong>the</strong> current service level of SHSs isfrustrat<strong>in</strong>g owners, yet <strong>the</strong>y feel that <strong>the</strong> fees are too high, yet service providers need to recovercosts. Higher capacity systems will cost more and become even more <strong>the</strong> preserve of <strong>the</strong> <strong>rural</strong> elite.Increas<strong>in</strong>g capital subsidies may allow poorer households access, but will <strong>the</strong>y be able to pay <strong>the</strong>costs of ma<strong>in</strong>tenance and repair? It may well be asked if SHSs are what <strong>the</strong> poor need. Often <strong>the</strong>reare many more basic and press<strong>in</strong>g needs for <strong>the</strong> poorer households. An <strong>in</strong>tegrated and bottom up<strong>approach</strong> to <strong>the</strong> plann<strong>in</strong>g of service delivery may address <strong>the</strong> problems more successfully.There seems to be a case for <strong>the</strong> exploration of ownership schemes for SHSs. This is because <strong>the</strong>re isas yet no sure recipe for successful dissem<strong>in</strong>ation, and not enough <strong>in</strong>formation is available<strong>in</strong>ternationally to prescribe a w<strong>in</strong>n<strong>in</strong>g <strong>approach</strong>.The fact that <strong>the</strong>re are many lessons and need for corrective steps po<strong>in</strong>ts to <strong>the</strong> need for pilotschemes so that lessons are learnt before full scale implementation is attempted. This will conta<strong>in</strong>costs and result <strong>in</strong> less frustration for both service providers and users.ENERGY RESEARCH CENTRE
<strong>Solar</strong> <strong>electrification</strong> <strong>by</strong> <strong>the</strong> <strong>concession</strong> <strong>approach</strong> <strong>in</strong> <strong>rural</strong> <strong>Limpopo</strong> prov<strong>in</strong>ce 41ReferencesAfrane-Okese Y, Mohlakoana N & dos Santos R R. 2001. Operational challenges of large-scale offgridPV <strong>rural</strong> <strong>electrification</strong> programme <strong>in</strong> South Africa. Paper presented at <strong>the</strong> ISES 2001 <strong>Solar</strong>World Congress, Adelaide, Australia, 25-30 November 2001.Afrane-Okese Y & Thom C, 2001. Understand<strong>in</strong>g <strong>the</strong> South African off-grid <strong>electrification</strong>programme. Paper presented at <strong>the</strong> ISES 2001 <strong>Solar</strong> World Congress, Adelaide, Australia, 25-30November 2001.ECN 2000. Monitor<strong>in</strong>g and evaluation of solar home systems: Experiences with applications of solarphotovoltaic for households <strong>in</strong> develop<strong>in</strong>g countries. Utrecht.ESMAP 2000a. Photovoltaic applications <strong>in</strong> <strong>rural</strong> areas of <strong>the</strong> develop<strong>in</strong>g world. ESMAP TechnicalPaper 009. The World Bank, Wash<strong>in</strong>gton.ESMAP 2000b. Zimbabwe <strong>rural</strong> <strong>electrification</strong> study. Report 228/00. The World Bank, Wash<strong>in</strong>gton.Karekezi S & Kithyoma W 2002. Renewable energy strategies for <strong>rural</strong> Africa. Is a PV–ledrenewable energy strategy <strong>the</strong> right <strong>approach</strong> for provid<strong>in</strong>g modern energy to <strong>the</strong> <strong>rural</strong> poor of sub–Saharan Africa? In Energy Policy Special Issue, 30, 11–12: 1071–1086.ERC [Energy Research Centre]. 2004. <strong>Solar</strong> <strong>electrification</strong> <strong>by</strong> <strong>the</strong> <strong>concession</strong> <strong>approach</strong> <strong>in</strong> <strong>the</strong> <strong>rural</strong>Eastern Cape. Energy Research Centre, University of Cape Town.Statistics SA 2004. Census 2001. Available onl<strong>in</strong>e at www.statssa.gov.za/census2001.ENERGY RESEARCH CENTRE
<strong>Solar</strong> <strong>electrification</strong> <strong>by</strong> <strong>the</strong> <strong>concession</strong> <strong>approach</strong> <strong>in</strong> <strong>rural</strong> <strong>Limpopo</strong> prov<strong>in</strong>ce 42APPENDICES1. Sunrise and sunset times (with twilight) for Polokwane <strong>in</strong> <strong>Limpopo</strong> prov<strong>in</strong>ce1-30 June 2002W<strong>in</strong>terCTS SR SS CTE1 06:13 06:37 17:23 17:472 06:13 06:38 17:23 17:473 06:13 06:38 17:22 17:474 06:14 06:38 17:22 17:475 06:14 06:39 17:22 17:476 06:15 06:39 17:22 17:477 06:15 06:40 17:22 17:478 06:15 06:40 17:22 17:479 06:16 06:40 17:22 17:4710 06:16 06:41 17:22 17:4711 06:16 06:41 17:22 17:4712 06:17 06:41 17:22 17:4713 06:17 06:42 17:22 17:4714 06:17 06:42 17:23 17:4715 06:18 06:42 17:23 17:4716 06:18 06:43 17:23 17:4817 06:18 06:43 17:23 17:4818 06:19 06:43 17:23 17:4819 06:19 06:44 17:23 17:4820 06:19 06:44 17:24 17:4821 06:19 06:44 17:24 17:4922 06:19 06:44 17:24 17:4923 06:20 06:44 17:24 17:4924 06:20 06:45 17:24 17:4925 06:20 06:45 17:25 17:4926 06:20 06:45 17:25 17:5027 06:20 06:45 17:25 17:5028 06:20 06:45 17:26 17:5029 06:21 06:45 17:26 17:5130 06:21 06:45 17:26 17:511-31 December 2002SummerCTS SR SS CTE1 04:41 05:06 18:36 19:012 04:41 05:06 18:37 19:023 04:41 05:07 18:37 19:034 04:41 05:07 18:38 19:035 04:42 05:07 18:39 19:046 04:42 05:07 18:40 19:057 04:42 05:07 18:40 19:068 04:42 05:07 18:41 19:069 04:42 05:07 18:42 19:0710 04:42 05:08 18:42 19:0811 04:43 05:08 18:43 19:0812 04:43 05:08 18:43 19:0913 04:43 05:09 18:44 19:1014 04:43 05:09 18:45 19:1015 04:44 05:09 18:45 19:1116 04:44 05:10 18:46 19:1117 04:45 05:10 18:46 19:1218 04:45 05:10 18:47 19:1319 04:45 05:11 18:48 19:1320 04:46 05:11 18:48 19:1421 04:46 05:12 18:49 19:1422 04:47 05:12 18:49 19:1523 04:47 05:13 18:50 19:1524 04:48 05:13 18:50 19:1625 04:48 05:14 18:51 19:1626 04:49 05:14 18:51 19:1627 04:49 05:15 18:51 19:1728 04:50 05:16 18:52 19:1729 04:51 05:16 18:52 19:1830 04:51 05:17 18:52 19:1831 04:52 05:17 18:53 19:18CTS is Civil Twilight Start, SR is Sunrise, SS isSunset, CTE is Civil Twilight EndValues calculated at http://www.compsolv.com/los/sunset.html us<strong>in</strong>g <strong>the</strong> co-ord<strong>in</strong>ates for Polokwane,namely latitude -23.87 degrees and longitude 29.44 degrees. These sunrise and sunset times areprovided for comparison with <strong>the</strong> times at which households with electricity (grid and solar) reportedswitch<strong>in</strong>g <strong>the</strong>ir lights on and off <strong>in</strong> w<strong>in</strong>ter and summer. It is also possible to see <strong>the</strong> differencebetween summer and w<strong>in</strong>ter sunrise and sunset times and <strong>the</strong> duration of <strong>the</strong> twilight periods at dawnand dusk.ENERGY RESEARCH CENTRE
<strong>Solar</strong> <strong>electrification</strong> <strong>by</strong> <strong>the</strong> <strong>concession</strong> <strong>approach</strong> <strong>in</strong> <strong>rural</strong> <strong>Limpopo</strong> prov<strong>in</strong>ce 432. Selected energy data for <strong>Limpopo</strong> prov<strong>in</strong>ce from Statistics SA 2001 CensusEnergy Source for Light<strong>in</strong>gHouseholdsElectricity 752691Gas 2072Paraff<strong>in</strong> 90420Candles 325834<strong>Solar</strong> 3169O<strong>the</strong>r 5778Energy Source for Cook<strong>in</strong>gHouseholdsElectricity 295512Gas 19625Paraff<strong>in</strong> 131633Wood 702428Coal 18651Animal dung 5272<strong>Solar</strong> 2981O<strong>the</strong>r 3864ENERGY RESEARCH CENTRE