Solar electrification by the concession approach in rural Limpopo ...
Solar electrification by the concession approach in rural Limpopo ...
Solar electrification by the concession approach in rural Limpopo ...

You also want an ePaper? Increase the reach of your titles
YUMPU automatically turns print PDFs into web optimized ePapers that Google loves.
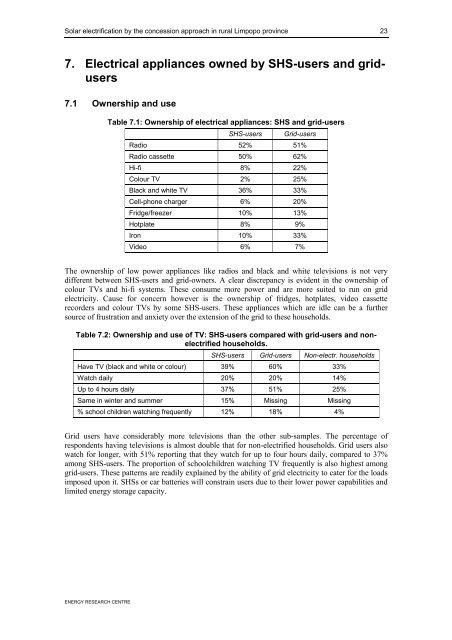
<strong>Solar</strong> <strong>electrification</strong> <strong>by</strong> <strong>the</strong> <strong>concession</strong> <strong>approach</strong> <strong>in</strong> <strong>rural</strong> <strong>Limpopo</strong> prov<strong>in</strong>ce 237. Electrical appliances owned <strong>by</strong> SHS-users and gridusers7.1 Ownership and useTable 7.1: Ownership of electrical appliances: SHS and grid-usersSHS-usersGrid-usersRadio 52% 51%Radio cassette 50% 62%Hi-fi 8% 22%Colour TV 2% 25%Black and white TV 36% 33%Cell-phone charger 6% 20%Fridge/freezer 10% 13%Hotplate 8% 9%Iron 10% 33%Video 6% 7%The ownership of low power appliances like radios and black and white televisions is not verydifferent between SHS-users and grid-owners. A clear discrepancy is evident <strong>in</strong> <strong>the</strong> ownership ofcolour TVs and hi-fi systems. These consume more power and are more suited to run on gridelectricity. Cause for concern however is <strong>the</strong> ownership of fridges, hotplates, video cassetterecorders and colour TVs <strong>by</strong> some SHS-users. These appliances which are idle can be a fur<strong>the</strong>rsource of frustration and anxiety over <strong>the</strong> extension of <strong>the</strong> grid to <strong>the</strong>se households.Table 7.2: Ownership and use of TV: SHS-users compared with grid-users and nonelectrifiedhouseholds.SHS-users Grid-users Non-electr. householdsHave TV (black and white or colour) 39% 60% 33%Watch daily 20% 20% 14%Up to 4 hours daily 37% 51% 25%Same <strong>in</strong> w<strong>in</strong>ter and summer 15% Miss<strong>in</strong>g Miss<strong>in</strong>g% school children watch<strong>in</strong>g frequently 12% 18% 4%Grid users have considerably more televisions than <strong>the</strong> o<strong>the</strong>r sub-samples. The percentage ofrespondents hav<strong>in</strong>g televisions is almost double that for non-electrified households. Grid users alsowatch for longer, with 51% report<strong>in</strong>g that <strong>the</strong>y watch for up to four hours daily, compared to 37%among SHS-users. The proportion of schoolchildren watch<strong>in</strong>g TV frequently is also highest amonggrid-users. These patterns are readily expla<strong>in</strong>ed <strong>by</strong> <strong>the</strong> ability of grid electricity to cater for <strong>the</strong> loadsimposed upon it. SHSs or car batteries will constra<strong>in</strong> users due to <strong>the</strong>ir lower power capabilities andlimited energy storage capacity.ENERGY RESEARCH CENTRE