Solar electrification by the concession approach in rural Limpopo ...
Solar electrification by the concession approach in rural Limpopo ...
Solar electrification by the concession approach in rural Limpopo ...

Create successful ePaper yourself
Turn your PDF publications into a flip-book with our unique Google optimized e-Paper software.
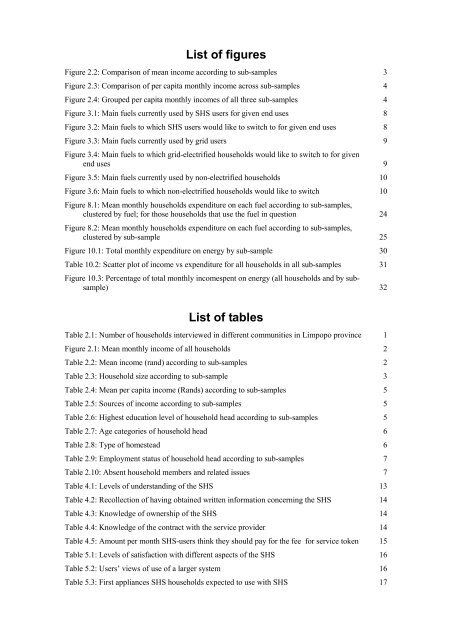
List of figuresFigure 2.2: Comparison of mean <strong>in</strong>come accord<strong>in</strong>g to sub-samples 3Figure 2.3: Comparison of per capita monthly <strong>in</strong>come across sub-samples 4Figure 2.4: Grouped per capita monthly <strong>in</strong>comes of all three sub-samples 4Figure 3.1: Ma<strong>in</strong> fuels currently used <strong>by</strong> SHS users for given end uses 8Figure 3.2: Ma<strong>in</strong> fuels to which SHS users would like to switch to for given end uses 8Figure 3.3: Ma<strong>in</strong> fuels currently used <strong>by</strong> grid users 9Figure 3.4: Ma<strong>in</strong> fuels to which grid-electrified households would like to switch to for givenend uses 9Figure 3.5: Ma<strong>in</strong> fuels currently used <strong>by</strong> non-electrified households 10Figure 3.6: Ma<strong>in</strong> fuels to which non-electrified households would like to switch 10Figure 8.1: Mean monthly households expenditure on each fuel accord<strong>in</strong>g to sub-samples,clustered <strong>by</strong> fuel; for those households that use <strong>the</strong> fuel <strong>in</strong> question 24Figure 8.2: Mean monthly households expenditure on each fuel accord<strong>in</strong>g to sub-samples,clustered <strong>by</strong> sub-sample 25Figure 10.1: Total monthly expenditure on energy <strong>by</strong> sub-sample 30Table 10.2: Scatter plot of <strong>in</strong>come vs expenditure for all households <strong>in</strong> all sub-samples 31Figure 10.3: Percentage of total monthly <strong>in</strong>comespent on energy (all households and <strong>by</strong> subsample)32List of tablesTable 2.1: Number of households <strong>in</strong>terviewed <strong>in</strong> different communities <strong>in</strong> <strong>Limpopo</strong> prov<strong>in</strong>ce 1Figure 2.1: Mean monthly <strong>in</strong>come of all households 2Table 2.2: Mean <strong>in</strong>come (rand) accord<strong>in</strong>g to sub-samples 2Table 2.3: Household size accord<strong>in</strong>g to sub-sample 3Table 2.4: Mean per capita <strong>in</strong>come (Rands) accord<strong>in</strong>g to sub-samples 5Table 2.5: Sources of <strong>in</strong>come accord<strong>in</strong>g to sub-samples 5Table 2.6: Highest education level of household head accord<strong>in</strong>g to sub-samples 5Table 2.7: Age categories of household head 6Table 2.8: Type of homestead 6Table 2.9: Employment status of household head accord<strong>in</strong>g to sub-samples 7Table 2.10: Absent household members and related issues 7Table 4.1: Levels of understand<strong>in</strong>g of <strong>the</strong> SHS 13Table 4.2: Recollection of hav<strong>in</strong>g obta<strong>in</strong>ed written <strong>in</strong>formation concern<strong>in</strong>g <strong>the</strong> SHS 14Table 4.3: Knowledge of ownership of <strong>the</strong> SHS 14Table 4.4: Knowledge of <strong>the</strong> contract with <strong>the</strong> service provider 14Table 4.5: Amount per month SHS-users th<strong>in</strong>k <strong>the</strong>y should pay for <strong>the</strong> fee for service token 15Table 5.1: Levels of satisfaction with different aspects of <strong>the</strong> SHS 16Table 5.2: Users’ views of use of a larger system 16Table 5.3: First appliances SHS households expected to use with SHS 17