- Page 1 and 2: IOI Corporation Berhad Annual repor
- Page 3 and 4: our vision …is to be a leading co
- Page 5: Profit Before Taxation 2011 Rm2.86
- Page 8 and 9: chairman’s statement Dear Shareho
- Page 10 and 11: Prospects Palm oil production volum
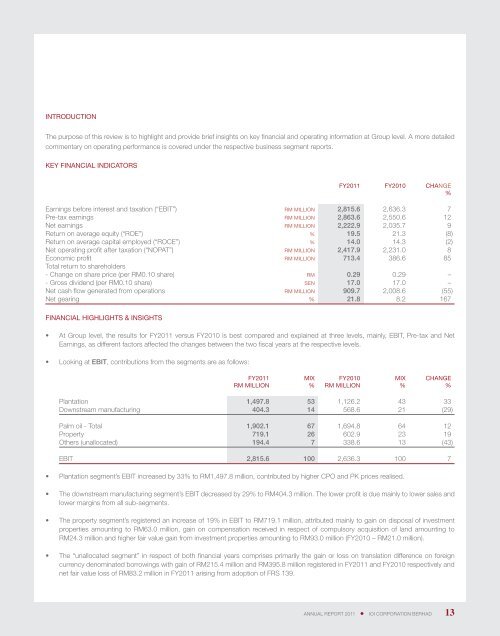
- Page 12 and 13: group financial overview CASH FLOWs
- Page 14 and 15: group performance highlights RM’0
- Page 16 and 17: five-year financial highlights RM
- Page 20 and 21: FINANCIAL HIGHLIGHTS & INSIGHTS (co
- Page 22 and 23: COE, ROCE, WACC AND ECONOMIC PROFIT
- Page 25 and 26: Boosting plantation productivity th
- Page 27 and 28: The Group has 82 estates, unchanged
- Page 29 and 30: AREA STATEMENT In Hectares 2011 201
- Page 31: For FY2011, the Group’s plantatio
- Page 34 and 35: management’s discussion and analy
- Page 36 and 37: Our manufacturing facilities are th
- Page 38 and 39: IOI City Development @ IOI Resort C
- Page 40 and 41: management’s discussion and analy
- Page 42 and 43: The Group’s property investment p
- Page 44 and 45: KEPONG Kuala Lumpur City Centre Nor
- Page 46 and 47: CORPORATE SOCIAL RESPONSIBILITY The
- Page 48 and 49: After being awarded the top rating
- Page 50 and 51: CORPORATE SOCIAL RESPONSIBILITY Soc
- Page 52 and 53: DECember 2010 A Christmas charity b
- Page 54 and 55: CORPORATE INFORMATION BOARD OF DIRE
- Page 56 and 57: profile of directors TAN SRI DATO
- Page 58 and 59: LEE CHENG LEANG Executive Director,
- Page 60 and 61: QUAH POH KEAT Independent Non-Execu
- Page 62 and 63: SENIOR MANAGEMENT TEAM Corporate Gr
- Page 64 and 65: Global presence North America USA
- Page 66 and 67: location of operations in malaysia
- Page 68 and 69:
corporate Calendar August 2010 Goma
- Page 70 and 71:
March 2011 IOI received two awards
- Page 72 and 73:
AUDIT COMMITTEE REPORT A MEMBERS Da
- Page 74 and 75:
viii To do the following, in relati
- Page 76 and 77:
Number of Meetings and Details of A
- Page 78 and 79:
Board Composition and Balance The B
- Page 80 and 81:
Dato’ Lee Yeow Chor CEO Dialogue
- Page 82 and 83:
Appointment to the Board and the ef
- Page 84 and 85:
The Group has also established seve
- Page 86 and 87:
statement on internal control INTRO
- Page 88 and 89:
RISK MANAGEMENT The Group’s activ
- Page 90 and 91:
other information composition of sh
- Page 92 and 93:
PENALTIES There were no sanctions a
- Page 94 and 95:
directors’ report The Directors o
- Page 96 and 97:
Directors’ report USD600 Million
- Page 98 and 99:
Directors’ report Executive Share
- Page 100 and 101:
Directors’ report Directors’ In
- Page 102 and 103:
Directors’ report Statutory Infor
- Page 104 and 105:
Directors’ report Significant Eve
- Page 106 and 107:
INCOME STATEMENTS for the Financial
- Page 108 and 109:
STATEMENTS OF FINANCIAL POSITION as
- Page 110 and 111:
STATEMENTS OF CHANGES IN EQUITY for
- Page 112 and 113:
STATEMENTS OF CHANGES IN EQUITY for
- Page 114 and 115:
STATEMENTS OF CASH FLOWS for the Fi
- Page 116 and 117:
STATEMENTS OF CASH FLOWS for the Fi
- Page 118 and 119:
notes to the financial statements 3
- Page 120 and 121:
notes to the financial statements 3
- Page 122 and 123:
notes to the financial statements 3
- Page 124 and 125:
notes to the financial statements 3
- Page 126 and 127:
notes to the financial statements 3
- Page 128 and 129:
notes to the financial statements 3
- Page 130 and 131:
notes to the financial statements 3
- Page 132 and 133:
notes to the financial statements 3
- Page 134 and 135:
notes to the financial statements 4
- Page 136 and 137:
notes to the financial statements 5
- Page 138 and 139:
notes to the financial statements 5
- Page 140 and 141:
notes to the financial statements 5
- Page 142 and 143:
notes to the financial statements 5
- Page 144 and 145:
notes to the financial statements 5
- Page 146 and 147:
notes to the financial statements 5
- Page 148 and 149:
notes to the financial statements 5
- Page 150 and 151:
notes to the financial statements 5
- Page 152 and 153:
notes to the financial statements 5
- Page 154 and 155:
notes to the financial statements 5
- Page 156 and 157:
notes to the financial statements 5
- Page 158 and 159:
notes to the financial statements 5
- Page 160 and 161:
notes to the financial statements 5
- Page 162 and 163:
notes to the financial statements 8
- Page 164 and 165:
notes to the financial statements 9
- Page 166 and 167:
notes to the financial statements 1
- Page 168 and 169:
notes to the financial statements 1
- Page 170 and 171:
notes to the financial statements 1
- Page 172 and 173:
notes to the financial statements 1
- Page 174 and 175:
notes to the financial statements 1
- Page 176 and 177:
notes to the financial statements 1
- Page 178 and 179:
notes to the financial statements 1
- Page 180 and 181:
notes to the financial statements 2
- Page 182 and 183:
notes to the financial statements 2
- Page 184 and 185:
notes to the financial statements 2
- Page 186 and 187:
notes to the financial statements 2
- Page 188 and 189:
notes to the financial statements 2
- Page 190 and 191:
notes to the financial statements 3
- Page 192 and 193:
notes to the financial statements 3
- Page 194 and 195:
notes to the financial statements 3
- Page 196 and 197:
notes to the financial statements 3
- Page 198 and 199:
notes to the financial statements 3
- Page 200 and 201:
notes to the financial statements 3
- Page 202 and 203:
notes to the financial statements 3
- Page 204 and 205:
notes to the financial statements 3
- Page 206 and 207:
notes to the financial statements 3
- Page 208 and 209:
notes to the financial statements 3
- Page 210 and 211:
notes to the financial statements 3
- Page 212 and 213:
notes to the financial statements 3
- Page 214 and 215:
notes to the financial statements 3
- Page 216 and 217:
notes to the financial statements 3
- Page 218 and 219:
notes to the financial statements 4
- Page 220 and 221:
notes to the financial statements 4
- Page 222 and 223:
notes to the financial statements 4
- Page 224 and 225:
notes to the financial statements 4
- Page 226 and 227:
notes to the financial statements 4
- Page 228 and 229:
notes to the financial statements 4
- Page 230 and 231:
notes to the financial statements 4
- Page 232 and 233:
notes to the financial statements 4
- Page 234 and 235:
notes to the financial statements 4
- Page 236 and 237:
notes to the financial statements 4
- Page 238 and 239:
notes to the financial statements 4
- Page 240 and 241:
notes to the financial statements 4
- Page 242 and 243:
notes to the financial statements 4
- Page 244 and 245:
notes to the financial statements 4
- Page 246 and 247:
notes to the financial statements 4
- Page 248 and 249:
notes to the financial statements 4
- Page 250 and 251:
notes to the financial statements 4
- Page 252 and 253:
notes to the financial statements 4
- Page 254 and 255:
notes to the financial statements 4
- Page 256 and 257:
notes to the financial statements 4
- Page 258 and 259:
notes to the financial statements 4
- Page 260 and 261:
notes to the financial statements 4
- Page 262 and 263:
notes to the financial statements 4
- Page 264 and 265:
notes to the financial statements 4
- Page 266 and 267:
notes to the financial statements 4
- Page 268 and 269:
notes to the financial statements 4
- Page 270 and 271:
notes to the financial statements 4
- Page 272 and 273:
STATEMENT BY DIRECTORS In the opini
- Page 274 and 275:
INDEPENDENT AUDITORS’ REPORT to t
- Page 276 and 277:
GROUP PROPERTIES A. PLANTATION ESTA
- Page 278 and 279:
GROUP PROPERTIES B. DEVELOPMENT PRO
- Page 280 and 281:
GROUP PROPERTIES B. DEVELOPMENT PRO
- Page 282 and 283:
GROUP PROPERTIES C. INVESTMENT PROP
- Page 284 and 285:
GROUP PROPERTIES D. INDUSTRIAL PROP
- Page 286 and 287:
GROUP PROPERTIES E. OTHER PROPERTIE
- Page 288 and 289:
notice of annual general meeting NO
- Page 290 and 291:
notice of annual general meeting AG
- Page 292 and 293:
statement accompanying notice of an
- Page 294 and 295:
SHAREHOLDERS INFORMATION As at 29 A
- Page 296 and 297:
notes
- Page 298 and 299:
FOLD HERE stamp The Company Secreta