2011 Half-year report - Tod's
2011 Half-year report - Tod's
2011 Half-year report - Tod's

You also want an ePaper? Increase the reach of your titles
YUMPU automatically turns print PDFs into web optimized ePapers that Google loves.
TOD’S Group<br />
<strong>2011</strong> <strong>Half</strong> Year Financial Report<br />
06.30.<strong>2011</strong><br />
management’s best valuation. Estimates and assumptions are reviewed regularly . If these<br />
estimates and assumptions should change in future from the actual circumstances, they will<br />
obviously be modified for the period in which those circumstances changed.<br />
Specifically with regard to determination of eventual impairment losses affecting fixed assets,<br />
complete tests are performed only when the annu al <strong>report</strong> is prepared, when all information as<br />
might be necessary are available, unless there are indications that require immediate valuation<br />
of eventual impairment losses or the occurrence of events that required re iteration of the<br />
procedure. The analyses carried out at this <strong>report</strong>ing date have not revealed any impairment<br />
indicators.<br />
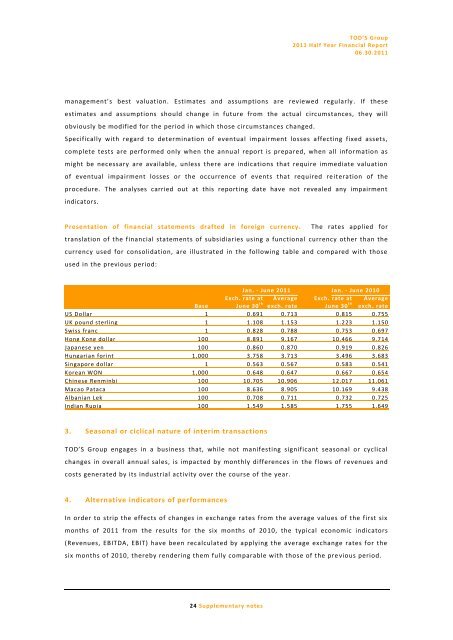
Presentation of financial statements drafted in foreign currency. The rates applied for<br />
translation of the financial statements of subsidiaries using a functional currency other than the<br />
currency used for consolidation, are illustrated in the following table and compared with those<br />
used in the previous period:<br />
Jan. - June <strong>2011</strong> Jan. - June 2010<br />
Exch. rate at Average Exch. rate at Average<br />
Base June 30 th exch. rate June 30 th exch. rate<br />
US Dollar 1 0.691 0.713 0.815 0.755<br />
UK pound sterling 1 1.108 1.153 1.223 1.150<br />
Swiss franc 1 0.828 0.788 0.753 0.697<br />
Hong Kong dollar 100 8.891 9.167 10.466 9.714<br />
Japanese yen 100 0.860 0.870 0.919 0.826<br />
Hungarian forint 1,000 3.758 3.713 3.496 3.683<br />
Singapore dollar 1 0.563 0.567 0.583 0.541<br />
Korean WON 1,000 0.648 0.647 0.667 0.654<br />
Chinese Renminbi 100 10.705 10.906 12.017 11.061<br />
Macao Pataca 100 8.636 8.905 10.169 9.438<br />
Albanian Lek 100 0.708 0.711 0.732 0.725<br />
Indian Rupia 100 1.549 1.585 1.755 1.649<br />
3. Seasonal or ciclical nature of interim transactions<br />
TOD’S Group engages in a business that, while not manifesting significant seasonal or cyclical<br />
changes in overall annual sales, is impacted by monthly differences in the flows of revenues and<br />
costs generated by its industrial activity over the course of the <strong>year</strong>.<br />
4. Alternative indicators of performances<br />
In order to strip the effects of changes in exchange rates from the average values of the first six<br />
months of <strong>2011</strong> from the results for the six months of 20 10, the typical economic indicators<br />
(Revenues, EBITDA, EBIT) have been recalculated by applying the average exchange rates for the<br />
six months of 2010, thereby rendering them fully comparable with those of the pre vious period.<br />
24 Supplementary notes