2011 Half-year report - Tod's
2011 Half-year report - Tod's
2011 Half-year report - Tod's

You also want an ePaper? Increase the reach of your titles
YUMPU automatically turns print PDFs into web optimized ePapers that Google loves.
TOD’S Group<br />
<strong>2011</strong> <strong>Half</strong> Year Financial Report<br />
06.30.<strong>2011</strong><br />
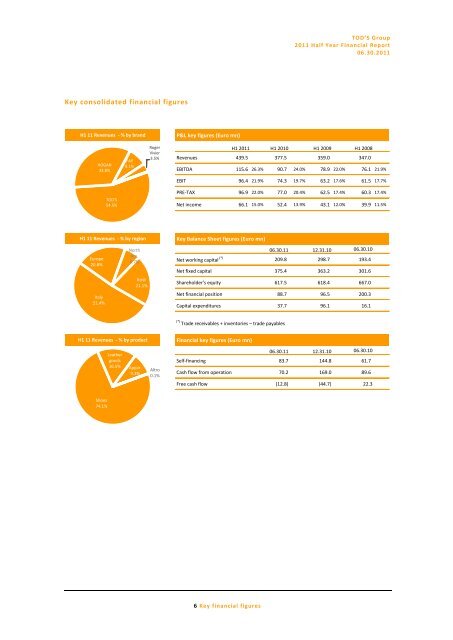
Key consolidated financial figures<br />
H1 11 Revenues - % by brand<br />
P&L key figures (Euro mn)<br />
HOGAN<br />
33.8%<br />
FAY<br />
8.1%<br />
Roger<br />
Vivier<br />
3.5%<br />
Altro<br />
0,1%<br />
H1 <strong>2011</strong> H1 2010 H1 2009 H1 2008<br />
Revenues 439.5 377.5 359.0 347.0<br />
EBITDA 115.6 26.3% 90.7 24.0% 78.9 22.0% 76.1 21.9%<br />
EBIT 96.4 21.9% 74.3 19.7% 63.2 17.6% 61.5 17.7%<br />
TOD'S<br />
54.5%<br />
PRE-TAX 96.9 22.0% 77.0 20.4% 62.5 17.4% 60.3 17.4%<br />
Net income 66.1 15.0% 52.4 13.9% 43.1 12.0% 39.9 11.5%<br />
H1 11 Revenues - % by region<br />
Europe<br />
20.8%<br />
Italy<br />
51.4%<br />
North<br />
Am.<br />
6.7%<br />
RoW<br />
21.1%<br />
Key Balance Sheet figures (Euro mn)<br />
06.30.11 12.31.10 06.30.10<br />
Net working capital (*) 209.8 298.7 193.4<br />
Net fixed capital 375.4 363.2 301.6<br />
Shareholder's equity 617.5 618.4 667.0<br />
Net financial position 88.7 96.5 200.3<br />
Capital expenditures 37.7 96.1 16.1<br />
(*)<br />
Trade receivables + inventories – trade payables<br />
H1 11 Revenues - % by product<br />
Leather<br />
goods<br />
16.5% Appar.<br />
9.3%<br />
Altro<br />
0.1%<br />
Financial key figures (Euro mn)<br />
06.30.11 12.31.10 06.30.10<br />
Self-financing 83.7 144.8 61.7<br />
Cash flow from operation 70.2 169.0 89.6<br />
Free cash flow (12.8) (44.7) 22.3<br />
Shoes<br />
74.1%<br />
6 Key financial figures