2011 Half-year report - Tod's
2011 Half-year report - Tod's
2011 Half-year report - Tod's

Create successful ePaper yourself
Turn your PDF publications into a flip-book with our unique Google optimized e-Paper software.
TOD’S Group<br />
<strong>2011</strong> <strong>Half</strong> Year Financial Report<br />
06.30.<strong>2011</strong><br />
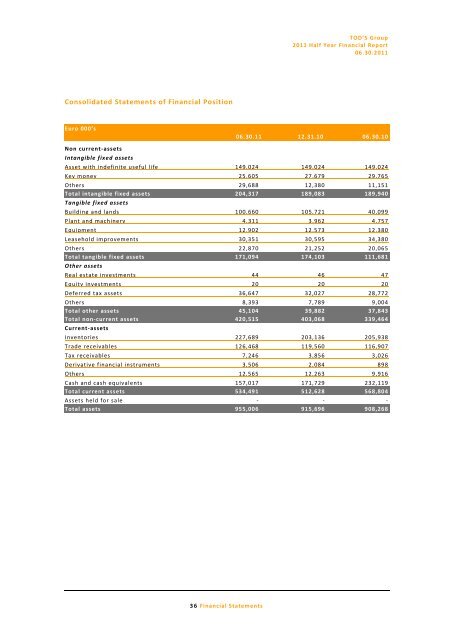
Consolidated Statements of Financial Position<br />
Euro 000’s<br />
06.30.11 12.31.10 06.30.10<br />
Non current-assets<br />
Intangible fixed assets<br />
Asset with indefinite useful life 149,024 149,024 149,024<br />
Key money 25,605 27,679 29,765<br />
Others 29,688 12,380 11,151<br />
Total intangible fixed assets 204,317 189,083 189,940<br />
Tangible fixed assets<br />
Building and lands 100,660 105,721 40,099<br />
Plant and machinery 4,311 3,962 4,757<br />
Equipment 12,902 12,573 12,380<br />
Leasehold improvements 30,351 30,595 34,380<br />
Others 22,870 21,252 20,065<br />
Total tangible fixed assets 171,094 174,103 111,681<br />
Other assets<br />
Real estate investments 44 46 47<br />
Equity investments 20 20 20<br />
Deferred tax assets 36,647 32,027 28,772<br />
Others 8,393 7,789 9,004<br />
Total other assets 45,104 39,882 37,843<br />
Total non-current assets 420,515 403,068 339,464<br />
Current-assets<br />
Inventories 227,689 203,136 205,938<br />
Trade receivables 126,468 119,560 116,907<br />
Tax receivables 7,246 3,856 3,026<br />
Derivative financial instruments 3,506 2,084 898<br />
Others 12,565 12,263 9,916<br />
Cash and cash equivalents 157,017 171,729 232,119<br />
Total current assets 534,491 512,628 568,804<br />
Assets held for sale - - -<br />
Total assets 955,006 915,696 908,268<br />
36 Financial Statements