2011 Half-year report - Tod's
2011 Half-year report - Tod's
2011 Half-year report - Tod's

You also want an ePaper? Increase the reach of your titles
YUMPU automatically turns print PDFs into web optimized ePapers that Google loves.
Group<br />
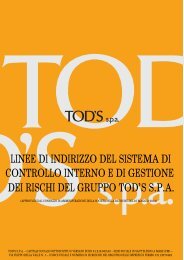
<strong>2011</strong> IAS/IFRS <strong>Half</strong> Year Report
TOD’S Group<br />
<strong>2011</strong> <strong>Half</strong> Year Financial Report<br />
06.30.<strong>2011</strong><br />
TABLE OF CONTENTS<br />
Company’s data ................................................................................................... 1<br />
Corporate Governance bodies .................................................................................. 2<br />
TOD’S Group ....................................................................................................... 3<br />
Group’s organizational chart .................................................................................... 4<br />
Distribution network as of June 30 th <strong>2011</strong> ................................................................... 5<br />
Key consolidated financial figures ............................................................................. 6<br />
Highlights of results .............................................................................................. 8<br />
Interim Report ........................................................................................................ 9<br />
Group’s activity ......................................................................................................... 10<br />
Group’s brands .......................................................................................................... 10<br />
Organizational structure of the Group ....................................................................... 11<br />
Foreign currency markets .......................................................................................... 11<br />
Main events and operations during the perio d .......................................................... 12<br />
The Group’s results in HY <strong>2011</strong> .................................................................................. 13<br />
Significant events occurring after the end of the period ........................................... 20<br />
Business Outlook ....................................................................................................... 20<br />
Supplementary notes ..............................................................................................21<br />
1. General notes ............................................................................................. 22<br />
2. Accounting policies ..................................................................................... 22<br />
3. Seasonal or ciclical nature of interim transactions ......................................... 24<br />
4. Alternative indicators of performances ......................................................... 24<br />
5. Scope of consolidation ................................................................................ 25<br />
6. Segment <strong>report</strong>ing ...................................................................................... 26<br />
7. Earnings per share ...................................................................................... 28<br />
8. Dividends ................................................................................................... 29<br />
9. Intangible and tangible fixed assets .............................................................. 29<br />
10. Hedging of financial risks (IFRS 7) ................................................................. 29<br />
11. Transactions with related parties ................................................................. 30<br />
<strong>Half</strong>-<strong>year</strong> Condensed Financial Statements ................................................................33<br />
Consolidated Profit & Loss ......................................................................................... 34<br />
Consolidated comprehensive income ......................................................................... 35<br />
Consolidated Statements of Financial Position .......................................................... 36<br />
Consolidated Statements of Cash Flows ..................................................................... 38<br />
Attestation of the <strong>Half</strong>-Year condensed financial statements of TOD’S Group pursuant<br />
article 154 bis of D.LGS. 58/98 and of article 81 -ter of Consob Regulation n. 11971 of May<br />
14 th 1999 and further modifications and integrations. ................................................40<br />
Table of contents
TOD’S Group<br />
<strong>2011</strong> <strong>Half</strong> Year Financial Report<br />
06.30.<strong>2011</strong><br />
Company’s data<br />
Registered office<br />
TOD’S S.p.A.<br />
Via Filippo Della Valle, 1<br />
63811 Sant'Elpidio a Mare (Fermo) - Italy<br />
Tel. +39 0734 8661<br />
Legal data Parent company<br />
Share capital resolved euro 61,218,802<br />
Share capital subscribed and paid euro 61,218,802<br />
Fiscal Code and registration number on Company Register of Court of Fermo: 01113570442<br />
Registered with the Chamber of Commerce of Fermo under n. 114030 R.E.A.<br />
Offices e Show rooms Dusseldorf – Kaistrasse, 2<br />
Hong Kong - Three Pacific Place, 1 Queen’s Road East<br />
London - Old Bond Street, 16<br />
Milan - Corso Venezia, 30<br />
Milan - Via Savona, 56<br />
Milan - Via Serbelloni 1-4<br />
Milan - Via della Spiga, 22<br />
Milan - Via Montenero, 63<br />
New York - 450, West 15 th Street<br />
Paris - Rue Royale, 20<br />
Seoul - 89-10, Cheongdam-dong, Kangnam-ku<br />
Shanghai - 1366 Nanjing West Road, Plaza 66 Tower 2<br />
Tokyo - Omotesando Building, 5-1-5 Jingumae<br />
Production facilities Comunanza (AP) - Via Merloni, 7<br />
Comunanza (AP) - Via S.Maria, 2-4-6<br />
Sant'Elpidio a Mare (FM) - Via Filippo Della Valle, 1<br />
Bagno a Ripoli, Loc. Vallina (FI) - Via del Roseto, 60<br />
Bagno a Ripoli, Loc. Vallina (FI) - Via del Roseto, 50<br />
Tolentino (MC) - Via Sacharov 41/43<br />
1 Company’s data
TOD’S Group<br />
<strong>2011</strong> <strong>Half</strong> Year Financial Report<br />
06.30.<strong>2011</strong><br />
Corporate Governance bodies<br />
Board of directors ( 1) Diego Della Valle Chairman<br />
Andrea Della Valle<br />
Vice- Chairman<br />
Luigi Abete<br />
Maurizio Boscarato<br />
Luigi Cambri<br />
Luca Cordero di Montezemolo<br />
Emanuele Della Valle<br />
Fabrizio Della Valle<br />
Emilio Macellari<br />
Pierfrancesco Saviotti<br />
Stefano Sincini<br />
Vito Varvaro<br />
Executive Committee Diego Della Valle Chairman<br />
Andrea Della Valle<br />
Fabrizio Della Valle<br />
Emilio Macellari<br />
Stefano Sincini<br />
Vito Varvaro<br />
Compensation Luigi Abete Chairman<br />
Committee<br />
Luigi Cambri<br />
Pierfrancesco Saviotti<br />
Internal Control and Maurizio Boscarato Chairman<br />
Corporate Governance<br />
Luigi Cambri<br />
Committee<br />
Pierfrancesco Saviotti<br />
Independent Directors Luigi Abete Chairman<br />
Committee<br />
Luigi Cambri<br />
Pierfrancesco Saviotti<br />
Board of statutory ( 2) Enrico Colombo Chairman<br />
Auditors Fabrizio Redaelli Acting stat. auditor<br />
Gian Mario Perugini<br />
Acting stat. auditor<br />
Gilfredo Gaetani<br />
Substitute auditor<br />
Massimo Foschi<br />
Substitute auditor<br />
Independent Auditors ( 3)<br />
Manager charged with preparing<br />
a company’s financial <strong>report</strong><br />
Deloitte & Touche S.p.A.<br />
Rodolfo Ubaldi<br />
( 1 )<br />
Term of the office: 2009 -<strong>2011</strong> (resolution of the Shareholders’ meeting as of April 20 th , 2009)<br />
( 2 )<br />
Term of the office: 2010 -2012 (resolution of the Shareholders’ meeting as of A pril 22 nd , 2010)<br />
( 3 )<br />
Term of the office: 2006 -<strong>2011</strong> (resolution of the Share holders’ meeting as of April 28 th , 2006)<br />
2 Corporate Governance bodies
TOD’S Group<br />
<strong>2011</strong> <strong>Half</strong> Year Financial Report<br />
06.30.<strong>2011</strong><br />
TOD’S Group<br />
TOD’S S.p.A.<br />
Parent Company, owner of<br />
TOD’S, HOGAN and FAY brands<br />
and licensee of ROGER VIVIER<br />
brand.<br />
Del.Com. S.r.l.<br />
Subholding for operation of national<br />
subsidiaries and DOS in Italy.<br />
TOD’S International B.V.<br />
Subholding for operation of<br />
international subsidiaries and DOS in<br />
The Netherlands.<br />
An.Del. Usa Inc.<br />
Subholding for operation of<br />
subsidiaries in the United States.<br />
Del.Pav S.r.l.<br />
Company that operates DOS in Italy.<br />
Filangieri 29 S.r.l.<br />
Company that operates DOS in Italy.<br />
Gen.del. SA<br />
Company that operates DOS in<br />
Switzerland.<br />
TOD’S Belgique S.p.r.l.<br />
Company that operates DOS in<br />
Belgium.<br />
TOD’S Deutschland Gmbh<br />
Company that distributes and<br />
promotes products in Germany and<br />
manages DOS in Germany.<br />
TOD’S Espana SL<br />
Company that operates DOS in<br />
Spain.<br />
TOD’S France Sas<br />
Company that distributes and<br />
promotes products in France and<br />
manages DOS in France.<br />
TOD’S Luxembourg S.A.<br />
Company that operates DOS in<br />
Luxembourg.<br />
TOD’S Hong Kong Ltd<br />
Company that distributes and<br />
promotes products in Far East and<br />
South Pacific and manages DOS in<br />
Hong Kong.<br />
TOD’S Japan KK<br />
Company that operates DOS in<br />
Japan.<br />
TOD’S Korea Inc.<br />
Company that promotes products in<br />
Korea.<br />
TOD’S Macao Ltd<br />
Company that operates DOS in<br />
Macao.<br />
TOD’S Retail India Private Ltd<br />
Company that operates DOS in India.<br />
TOD’S Saint Barth Sas<br />
Not operating company .<br />
TOD’S (Shanghai) Trading Co. Ltd<br />
Company that operates DOS in China.<br />
TOD’S Singapore Pte Ltd<br />
Company that operates DOS in<br />
Singapore.<br />
TOD’S UK Ltd<br />
Company that operates DOS in Great<br />
Britain.<br />
Webcover Ltd<br />
Company that distributes and<br />
promotes products in Great Britain<br />
and manages DOS in Great Britain.<br />
Cal.Del. Usa Inc.<br />
Company that operates DOS in<br />
California (USA).<br />
Colo. Del. Usa Inc.<br />
Not operating company .<br />
Deva Inc.<br />
Company that distributes and<br />
promotes products in North America,<br />
and manages of DOS in New Jersey<br />
(USA).<br />
Flor. Del. Usa Inc.<br />
Company that operates DOS in Florida<br />
(USA).<br />
Hono. Del. Inc.<br />
Company that operates DOS in Hawa ii<br />
(USA).<br />
Il. Del. Usa Inc.<br />
Company that operates DOS in Illinois<br />
(USA).<br />
Neva. Del. Inc.<br />
Company that operates DOS in Nevada<br />
(USA).<br />
Or. Del. Usa Inc.<br />
Company that operates DOS in<br />
California (USA).<br />
TOD’S Tex. Del. Usa Inc.<br />
Company that operates DOS in Texas<br />
(USA).<br />
Sandel SA<br />
Not operating company .<br />
Un.Del. Kft<br />
Production company.<br />
Alban.Del Sh.p.k.<br />
Production company.<br />
Holpaf B.V.<br />
Real estate company .<br />
Re.Se.Del. S.r.l.<br />
Company for services.<br />
3 TOD’S Group
TOD’S Group<br />
<strong>2011</strong> <strong>Half</strong> Year Financial Report<br />
06.30.<strong>2011</strong><br />
Group’s organizational chart<br />
TOD’S S.p.A.<br />
100%<br />
Gen.Del. SA<br />
Zurich – Switzerland<br />
S.C. Chf 200,000<br />
TOD’S International BV<br />
Amsterdam – The Netherlands<br />
S.C. - Euro 2,600,200<br />
100% 100%<br />
ALBAN.DEL Sh.p.k<br />
Tirana – Albania<br />
S.C. – Euro 720,000<br />
1% 99%<br />
TOD’S (Shanghai) Trading Co. Ltd<br />
Shanghai- China<br />
S.C. Usd 6,000,000<br />
10%<br />
1%<br />
TOD’S Hong Kong Ltd<br />
Hong Kong<br />
S.C. - Usd 16,550,000<br />
100% 50% 1%<br />
50%<br />
TOD’S Belgique S.p.r.l.<br />
Bruxelles - Belgium<br />
S.C. - Euro 300,000<br />
TOD’S Japan KK<br />
Tokio - Japan<br />
S.C. - Jpy 100,000,000<br />
TOD’S Saint Barth Sas<br />
Saint Barthélemy<br />
S.C. - Euro 500,000<br />
Un.Del Kft<br />
Tata - Hungary<br />
S.C. - Huf 42,900,000<br />
TOD’S Macao Lda<br />
Macao<br />
S.C. Mop 20,000,000<br />
TOD’S India Retail Private Ltd<br />
Mumbai – India<br />
S.C. Inr 193,900,000<br />
100%<br />
100%<br />
100%<br />
90%<br />
99%<br />
100%<br />
100%<br />
100%<br />
100%<br />
50%<br />
100%<br />
Webcover Ltd<br />
London – Great Britain<br />
S.C. - Gbp 1,000<br />
TOD’S UK Ltd<br />
London – Great Britain<br />
S.C. - Gbp 350,000<br />
TOD’S Espana SL<br />
Madrid – Spain<br />
S.C. - Euro 468,539.77<br />
TOD’S Korea Inc<br />
Seoul - Korea<br />
S.C. Won 1,600,000,000<br />
TOD’S Singapore Ltd<br />
Singapore<br />
S.C. - Sgd 300,000<br />
TOD’S Luxembourg S.A.<br />
Luxembourg<br />
S.C. Euro 31,000.00<br />
Sandel SA<br />
San Marino<br />
S.C. - Euro 258,000<br />
100%<br />
An.Del. USA Inc.<br />
New York U.S.A.<br />
S.C. - Usd 3,700,000<br />
Cal.Del. USA Inc.<br />
Beverly Hills, Ca U.S.A.<br />
S.C. - Usd 10,000<br />
Deva Inc.<br />
Wilmington, DE U.S.A.<br />
S.C. - Usd 500,000<br />
Hono.Del. Inc.<br />
Honolulu, Hi U.S.A.<br />
S.C. - Usd 10,000<br />
Neva.Del. Inc.<br />
Carson City, Nv U.S.A.<br />
S.C. - Usd 10,000<br />
TOD’S Tex. Del. Inc.<br />
Dallas, Tx U.S.A<br />
S.C. - Usd 10,000<br />
100% 100%<br />
100% 100%<br />
100% 100%<br />
100% 100%<br />
100%<br />
Colo.Del. USA Inc<br />
Denver, Co U.S.A.<br />
S.C. - Usd 10,000<br />
Flor.Del. USA Inc.<br />
Tallahassee, Fl U.S.A.<br />
S.C. - Usd 10,000<br />
Il.Del. USA Inc.<br />
Springfield, Il U.S.A.<br />
S.C. - Usd 10,000<br />
Or.Del. USA Inc.<br />
Sacramento, Ca U.S.A.<br />
S.C. - Usd 10,000<br />
100%<br />
Del.Com S.r.l.<br />
S.Elpidio a Mare - Italy<br />
S.C. - Euro 31,200<br />
Del.Pav. S.r.l.<br />
S.Elpidio a Mare - Italy<br />
S.C. - Euro 50,000<br />
50%<br />
100%<br />
Re.Se.Del. S.r.l.<br />
S.Elpidio a Mare - Italy<br />
S.C. - Euro 25,000<br />
100%<br />
TOD’S France Sas<br />
Paris - France<br />
S.C. - Euro 780,000<br />
50%<br />
Filangieri 29 S.r.l.<br />
S.Epidio a Mare- Italy<br />
S.C. - Euro 100,000<br />
100%<br />
TOD’S Deutschland Gmbh<br />
Dusseldorf - Germany<br />
S.C. - Euro 153,387.56<br />
100%<br />
Holpaf B.V.<br />
Amsterdam – The Netherlands<br />
S.C. - Euro 5,000,000<br />
4 TOD’S Group
TOD’S Group<br />
<strong>2011</strong> <strong>Half</strong> Year Financial Report<br />
06.30.<strong>2011</strong><br />
Distribution network as of June 30 th <strong>2011</strong><br />
(D)=DOS<br />
(D)=DOS<br />
USA USA (D) (D) (F) (F)<br />
U.S.A.<br />
U.S.A. 14<br />
14<br />
Total 14<br />
RoW RoW (D) (D) (F) (F)<br />
Saudi Arabia 2 2<br />
Bahrain Baharain 2 2<br />
U.A.E. United Arab E. 5 5<br />
Kuwait 2 2<br />
Lebanon 2 2<br />
Qatar 1 1<br />
Total 14 14<br />
(F)=FRANCHISING<br />
(F)=FRANCHISED STORES<br />
Europe (D) (F)<br />
Italy 41 5<br />
Belgium 1<br />
France 11<br />
Germany 9<br />
Great Britain 5<br />
Greece 5<br />
Luxembourg 1<br />
Netherlands 1<br />
Portugal 1<br />
Russia 2<br />
Spain 2 1<br />
Switzerland 3<br />
Turkey 1<br />
Total 74 15<br />
Asia (D) (F)<br />
Asia Japan (D) 27 (F) 1<br />
Japan China 27 24 41<br />
China Korea 208 74<br />
Korea Philippines 9 27<br />
Philippines Hong Kong 9 12<br />
Hong India Kong 82<br />
1<br />
India Indonesia 2 3<br />
Indonesia<br />
Macau 1 1<br />
3<br />
Macao<br />
Malaysia<br />
1<br />
3<br />
1<br />
Malaysia<br />
Singapore 2 1<br />
2<br />
Singapore Taiwan 15<br />
Taiwan 14<br />
Thailand 2<br />
Thailandia 3<br />
U.S.A. 1<br />
U.S.A. Total 73 41<br />
Total 69 40<br />
To<br />
Ro<br />
Sa<br />
Ba<br />
U.<br />
Ku<br />
Le<br />
Qa<br />
To<br />
As<br />
Ja<br />
Ch<br />
Ko<br />
DOS, <strong>2011</strong> new openings<br />
Franchised stores, <strong>2011</strong> new openings<br />
Far East<br />
Far East<br />
Nanning (China) Taipei (Taiwan)<br />
Zhengzhou (China) Kuala Lumpur (Malaysia)<br />
Hong Kong<br />
(China)<br />
Tianjin<br />
(China)<br />
Europe<br />
Madrid<br />
Milan<br />
(Spain)<br />
(Italy)<br />
For a complete list of retail outlets ope rated by the DOS and franchising network, reference should be made<br />
to the corporate web site: www.todsgroup.com<br />
5 Distribution network
TOD’S Group<br />
<strong>2011</strong> <strong>Half</strong> Year Financial Report<br />
06.30.<strong>2011</strong><br />
Key consolidated financial figures<br />
H1 11 Revenues - % by brand<br />
P&L key figures (Euro mn)<br />
HOGAN<br />
33.8%<br />
FAY<br />
8.1%<br />
Roger<br />
Vivier<br />
3.5%<br />
Altro<br />
0,1%<br />
H1 <strong>2011</strong> H1 2010 H1 2009 H1 2008<br />
Revenues 439.5 377.5 359.0 347.0<br />
EBITDA 115.6 26.3% 90.7 24.0% 78.9 22.0% 76.1 21.9%<br />
EBIT 96.4 21.9% 74.3 19.7% 63.2 17.6% 61.5 17.7%<br />
TOD'S<br />
54.5%<br />
PRE-TAX 96.9 22.0% 77.0 20.4% 62.5 17.4% 60.3 17.4%<br />
Net income 66.1 15.0% 52.4 13.9% 43.1 12.0% 39.9 11.5%<br />
H1 11 Revenues - % by region<br />
Europe<br />
20.8%<br />
Italy<br />
51.4%<br />
North<br />
Am.<br />
6.7%<br />
RoW<br />
21.1%<br />
Key Balance Sheet figures (Euro mn)<br />
06.30.11 12.31.10 06.30.10<br />
Net working capital (*) 209.8 298.7 193.4<br />
Net fixed capital 375.4 363.2 301.6<br />
Shareholder's equity 617.5 618.4 667.0<br />
Net financial position 88.7 96.5 200.3<br />
Capital expenditures 37.7 96.1 16.1<br />
(*)<br />
Trade receivables + inventories – trade payables<br />
H1 11 Revenues - % by product<br />
Leather<br />
goods<br />
16.5% Appar.<br />
9.3%<br />
Altro<br />
0.1%<br />
Financial key figures (Euro mn)<br />
06.30.11 12.31.10 06.30.10<br />
Self-financing 83.7 144.8 61.7<br />
Cash flow from operation 70.2 169.0 89.6<br />
Free cash flow (12.8) (44.7) 22.3<br />
Shoes<br />
74.1%<br />
6 Key financial figures
Euro<br />
TOD’S Group<br />
<strong>2011</strong> <strong>Half</strong> Year Financial Report<br />
06.30.<strong>2011</strong><br />
<strong>2011</strong> Group employees<br />
BLC<br />
33%<br />
EX<br />
1%<br />
The Group employees<br />
06.30.11 12.31.10 06.30.10 06.30.09<br />
Year to date 3,416 3,194 3,102 2,820<br />
WHC<br />
66%<br />
EX = executives<br />
WHC = white collar employees<br />
BLC = blue collar employees<br />
Main Stock Market indicators (Euro) – TOD’S S.p.A.<br />
S h a r e s ’ p r i c e<br />
Official price at January 3 th <strong>2011</strong> 74.71<br />
Official price at June 30 th <strong>2011</strong> 91.35<br />
Minimum price (January-June) 70.33<br />
Maximum price (January-June) 98.45<br />
M a r k e t c a p i t a l i z a t i o n<br />
At January 3 th <strong>2011</strong> 2,286,925,381<br />
At June 30 th <strong>2011</strong> 2,796,199,391<br />
D i v i d e n d p e r s h a r e<br />
Extraordinary Dividend 2010 3.50<br />
Year 2010 2.00<br />
Year 2009 1.50<br />
O r d i n a r y s h a r e s<br />
Number of outstanding shares 30,609,401<br />
Earning per share (euro)<br />
Stock performance<br />
2.14<br />
100,00<br />
1.69<br />
1.39<br />
1.29<br />
95,00<br />
90,00<br />
85,00<br />
80,00<br />
75,00<br />
70,00<br />
HI <strong>2011</strong> HI 2010 HI 2009 H1 2008<br />
65,00<br />
January - June <strong>2011</strong><br />
7 Key financial figures
TOD’S Group<br />
<strong>2011</strong> <strong>Half</strong> Year Financial Report<br />
06.30.<strong>2011</strong><br />
Highlights of results<br />
Revenues: revenues totalled 439.5 million euros<br />
during the period (the average change in foreign<br />
exchange rates had a positive impact of 1.0<br />
million euros), equivalent to growth of 16.4%<br />
from H1 2010. Sales by the DOS network<br />
totalled 227.0 million euros (+22.4%).<br />
Sales revenues (Euro mn)<br />
438,5 439,5<br />
377,5<br />
359,0<br />
347,0<br />
EBITDA: this grew by 27.5%, to 1 1 5 . 6 million<br />
euros. At June 30 th <strong>2011</strong>, it was equivalent to<br />
26.3% of sales (H1 2010: 24.0%).<br />
H1 11 comp.<br />
ex. rates basis<br />
114,2 115,6<br />
H1 11 H1 10 H1 09 H1 08<br />
EBITDA (Euro mn)<br />
EBIT: this totalled 9 6 . 4 million euros, +29.8%<br />
compared with H1 2010 (74.3 million euros).<br />
When measured on a comparable exchange rate<br />
basis, EBIT totalled 9 4 . 9 million euros<br />
(+2 7 . 8 %).<br />
H1 11 comp.<br />
ex. rates basis<br />
90,7<br />
78,9 76,1<br />
H1 11 H1 10 H1 09 H1 08<br />
EBIT (Euro mn)<br />
Net financial position (NFP): the Group had<br />
157.0 million euros in liquid assets at June 30 th<br />
<strong>2011</strong>. Its net financial position was 88.7 million<br />
94,9 96,4<br />
74,3<br />
63,2 61,5<br />
euros at the same date.<br />
Capital expenditures: 37.7 million euros in<br />
capital expenditures were made in H1 201 1, in<br />
H1 2010 amounted to 16.1 million euros.<br />
H1 11 comp.<br />
ex. rates basis<br />
H1 11 H1 10 H1 09 H1 08<br />
NFP (Euro mn)<br />
Distribution network: at June 30 th<br />
the single<br />
200,3<br />
brand distribution network comprised 1 61 DOS<br />
and 70 Franchised stores.<br />
88,7<br />
100,0<br />
52,8<br />
06.30.11 06.30.10 06.30.09 06.30.08<br />
8 Highlights of results
Group<br />
Interim Report
TOD’S Group<br />
<strong>2011</strong> <strong>Half</strong> Year Financial Report<br />
06.30.<strong>2011</strong><br />
Group’s activity<br />
TOD’S Group operates in the luxury sector under its proprietary brands (TOD’S, HOGAN, and FAY)<br />
and licensed brands (ROGER VIVIER). It actively creates, produces and distributes shoes, leather<br />
goods and accessories, and apparel. The firm’s mission is to offer global customers top-quality<br />
products that satisfy their functional requirements and aspirations.<br />
Development of production. Group’s production structure is based on complete control of the<br />
production process, from creation of the collectio ns to production and then distribution of the<br />
products. This approach is considered key to assuring the prestige of its brands.<br />
Shoes and leather goods are produced in Group -owned plants, with partial outsourcing to<br />
specialized workshops. All of these ou tsourcers are located in areas with a strong tradition of<br />
shoe and leather good production. This preference reflects the fact that an extremely high<br />
standard of professional quality is required to make these items, with a significantly high level of<br />
added value contributed to the final product by manual work.<br />
The Group relies exclusively on selected specialized outsourcers, which enables it to exploit their<br />
respective specializations in crafting the individual products sold as part of the apparel line.<br />
Distribution structure. The prestige of Group’s brands and the high degree of specialization<br />
necessary to offer the respective products to customers entails distribution through a network of<br />
similarly specialized stores. Accordingly, the Group relies pr incipally on three channels: DOS<br />
(directly operated stores), franchised retail outlets, and a series of selected, independent<br />
multibrand stores. Group’s strategy is focused on development of the DOS and franchising<br />
networks, given that these channels offer greater control and more faithful transmission of the<br />
individual brands. It is also clear that, in particular market situations, distribution through<br />
independent multibrand stores is more efficient. This channel is of key importance to the Group.<br />
Group’s brands<br />
The Tod’s brand is known for shoes and luxury leather goods, with styles that<br />
have became icons of modern living. Tod’s is known in the luxury goods sector as a symbol of the<br />
perfect combination of tradition, quality and modernity. Each product is hand-crafted with<br />
highly-skilled techniques, intended, after laborious reworking, to become an exclusive,<br />
recognisable, modern and practical object. Some styles, like the Driving Shoe and the D bag, are<br />
10 Interim <strong>report</strong>
TOD’S Group<br />
<strong>2011</strong> <strong>Half</strong> Year Financial Report<br />
06.30.<strong>2011</strong><br />
cherished by celebrities and ordinary people worldwide, and have become icons and forerunners<br />
of a new concept of elegance, for both women and men .<br />
Begun in the 80s with shoe collections for women, men and children, the<br />
Hogan brand now also crafts various leather goods items. The Hogan brand is distinctive for high<br />
quality, functionality and design. Every product stems from a highly skilled design technique and<br />
is created using quality materials with a particular passion f or details and a search for perfection.<br />
Hogan products are the highest expression of a “new luxury” lifestyle. Hogan is meant for<br />
someone who cherishes the type of luxury associated with product excellence, innovative original<br />
design and consummate practic ality. The Traditional and the Interactive shoe styles endure as<br />
continuing “best sellers”.<br />
FAY is a brand created in the mid 80s with a product range of high quality casual<br />
wear. The brand is known for its quality craftsmanship, for the excellence of its materials, a<br />
meticulous attention to craft details and its high functionality without sacrificing style and<br />
quality. FAY products are wearable everywhere: from the stadium to the office, in urban areas<br />
and in the countryside. The line, which has seasonal men’s, women’s and junior’s collect ions,<br />
focuses on classic evergreen styles, continuously modified and refreshed with innovative and<br />
recognisably eye-catching design.<br />
Organizational structure of the Group<br />
Group’s organisational configuration rotates around TOD’S S.p.A. that is at the heart of Group’s<br />
organisation, its parent company that owns TOD’S,HOGAN and FAY brands, holds the licenses to the<br />
ROGER VIVIER, and manages Group’s production and distribution. Through a series of sub-holdings,<br />
the organisation is rounded out by a series of commercial companies that are delegated complete<br />
responsibility for retail distribution through the DOS network. Certain of them, strategically located<br />
on international markets, are assigned major roles in product distribution, marketing and promotion,<br />
and public relations processes along the “value chain”, while simultaneously guaranteeing the<br />
uniform image that Group brands must have worldwide.<br />
Foreign currency markets<br />
Comparative analysis of the average exchange rates for the euro against other major currencies<br />
between January and June <strong>2011</strong> and the first half of 2010 reveals a general increase in the value of<br />
11 Interim <strong>report</strong>
TOD’S Group<br />
<strong>2011</strong> <strong>Half</strong> Year Financial Report<br />
06.30.<strong>2011</strong><br />
the euro with respect to the U.S. dollar and currencies that are linked to it, and a decrease with<br />
respect to the other currencies, among which Swiss Franc, Japanese Yen and Singapore Dollar.<br />
Change (%) on exchange<br />
rate - major<br />
extra/UE currencies<br />
13.1%<br />
4.8%<br />
5.4%<br />
0.2%<br />
-1.4%<br />
GBP CHF HKD SGD USD JPY RMB<br />
-5.6%<br />
-5.5%<br />
Change vs H1 2010 average<br />
Main events and operations during the period<br />
The results realised during H1 <strong>2011</strong> confirm broadly the same growth rates of revenue and<br />
operating margin as the ones already performed in the 1 st quarter <strong>2011</strong>. Sales, mainly driven by<br />
the acceleration of TOD’S brand, show the appeal of Group’s trademarks in all the markets,<br />
particularly important in international ones, driven by outstanding results of Greater China<br />
(China, Hong Kong, Macao and T aiwan). Strong acceleration of revenue has been performed also<br />
in the US market, where an inversion of the trend has been confirmed in respect of last period s.<br />
Nonetheless, the first half of the <strong>year</strong> was characterised by two major initiatives taken by the<br />
Group to protect and promote Italian heritage . The first of these involves its full financial<br />
support, as sole sponsor, for restoration of the Coliseum, based on the agreement reached<br />
January 21 st <strong>2011</strong> with the Ministry of Cultural Affairs ( Ministero per i Beni e le Attività Culturali)<br />
and the Supervisor for central Rome's archaeological area (Soprintendenza speciale per i beni<br />
archeologici). The financial commitment assumed by the Group for this monument, a symbol of<br />
Italian history and culture, totals 25 million euros. It will be disbursed in instalments over the<br />
entire duration of restoration work. The Soprintendenza speciale per i beni archeologici di Roma<br />
will be responsible for planning and executing the work . Following a favourable resolution by the<br />
Shareholders’ Meeting on May 16 th <strong>2011</strong>, Tod’s S.p.A. acquired the status of Permanent Founding<br />
Member of Fondazione Teatro alla Scala in June. By donating 5.2 million euros to that<br />
foundation, which will be payable in four <strong>year</strong>s, Tod’s S.p.A. has confirmed its wish to assist La<br />
Scala opera house, with its glorious reputation and excellent organisation, preserve its world<br />
status as a shining example of “made in Italy”.<br />
12 Interim <strong>report</strong>
TOD’S Group<br />
<strong>2011</strong> <strong>Half</strong> Year Financial Report<br />
06.30.<strong>2011</strong><br />
The Group’s results in HY <strong>2011</strong><br />
The half-<strong>year</strong> results of the Group confirm the growth trend <strong>report</strong>ed for the first three months<br />
of FY <strong>2011</strong>.<br />
Supported by the excellent performance of the DOS network, especially in Asia and United States<br />
(with aggregate DOS sales totalling 227 million euros in H1 <strong>2011</strong>, for growth of 22.4% from 2 010),<br />
revenue during the period totalled 439.5 million euros. That was up 62 million euros from the<br />
377.5 million euros <strong>report</strong>ed in the same period of 2010, representing an increase of 16.4%. The<br />
effect of changes in average exchange rates was negligible. On a like-for-like cross-rate basis,<br />
revenues would have been 438.5 million euros, with a growth rate of 16.2%.<br />
The product leverage effect on operating income was extremely positive, both on account of the<br />
significant growth in revenue and its compositio n, which was concentrated in markets (Asia) and<br />
merchandise categories (leather goods and accessories) having higher margins, while the organic<br />
component was preponderant. Earnings consequently grew at strong rates. Compared with H1<br />
2010, EBITDA and EBIT grew by 27.5% and 29.8%, respectively, to 115.6 million euros and 96.4<br />
million euros, respectively. In H1 <strong>2011</strong>, EBITDA represented 26.3% of revenues, more than 230<br />
basis points higher than the figure for the same period of 2010 (24%). EBIT was equal to 21.9 % of<br />
sales, compared with 19.7% in 2010.<br />
Net consolidated income turned in exactly the same performance. With a tax rate that was<br />
substantially identical, net income for the period was 66.1 million euros (52.4 million euro s at<br />
June 2010), up 26%, or 13.7 million euros.<br />
(Euro 000’s)<br />
FY 10 Main P&L indicators H1 <strong>2011</strong> H1 2010 Change %<br />
7 8 7 , 5 3 9 S a l e s r e v e n u e s 4 3 9 , 4 5 8 3 7 7 , 4 6 2 6 1 , 9 9 6 1 6 . 4<br />
1 9 3 , 0 5 9 E B I T D A 1 1 5 , 6 1 6 9 0 , 6 9 3 2 4 , 9 2 3 2 7 . 5<br />
( 3 3 , 1 1 5 ) D e p r. , a m o r t . , w r i t e - d o w n s ( 1 9 , 2 0 0 ) ( 1 6 , 4 2 5 ) ( 2 , 7 7 5 ) 1 6 . 9<br />
1 5 9 , 9 4 4 E B I T 9 6 , 4 1 6 7 4 , 2 6 8 2 2 , 1 4 8 2 9 . 8<br />
1 6 3 , 3 5 2 P r e - t a x p r o f i t 9 6 , 8 6 5 7 6 , 9 6 9 1 9 , 8 9 6 2 5 . 8<br />
110,7 8 6 C o n s o l i d a t e d n e t i n c o m e 6 6 , 0 6 4 5 2 , 4 2 1 1 3 , 6 4 3 2 6 . 0<br />
F o r e i g n e x c h a n g e i m p a c t o n r e v e n u e s ( 9 2 3 )<br />
A d j u s t e d s a l e s r e v e n u e s 4 3 8 , 5 3 5 3 7 7 , 4 6 2 6 1 , 0 7 3 1 6 . 2<br />
F o r. e x c h . i m p a c t o n o p e r a t i n g c o s t ( 5 1 2 )<br />
A d j u s t e d E B I T D A 1 1 4 , 1 8 1 9 0 , 6 9 3 2 3 , 4 8 8 25.9<br />
F o r. e x c h . i m p a c t o n d e p r e c . & a m o r t . ( 8 0 )<br />
A d j u s t e d E B I T 9 4 , 9 0 1 7 4 , 2 6 8 2 0 , 6 3 3 2 7 . 8<br />
E B I T D A % 2 6 . 3 2 4 . 0<br />
E B I T % 2 1 . 9 1 9 . 7<br />
A d j u s t e d E B I T D A % 2 6 . 0 2 4 . 0<br />
A d j u s t e d E B I T % 2 1 . 6 1 9 . 7<br />
Ta x r a t e % 3 1 . 8 3 1 . 9<br />
13 Interim <strong>report</strong>
TOD’S Group<br />
<strong>2011</strong> <strong>Half</strong> Year Financial Report<br />
06.30.<strong>2011</strong><br />
(Euro 000’s)<br />
06.30.10 Main Balance sheet indicators 06.30.11 12.31.10 Change<br />
1 9 3 , 3 8 2 N e t w o r k i n g c a p i t a l ( *) 2 0 9 , 8 1 0 1 9 2 , 6 8 8 1 7 , 1 2 2<br />
3 0 1 , 6 2 1 Non- c u r r e n t a s s e t s 3 7 5 , 4 1 1 3 6 3 , 1 8 6 1 2 , 2 2 5<br />
( 2 8 , 3 0 0 ) O t h e r c u r r e n t a s s e t s / l i a b i l i t i e s ( 5 6 , 5 0 7 ) ( 3 3 , 9 2 8 ) ( 2 2 , 5 7 9 )<br />
466,703 Invested Capital 528,714 521,946 6,768<br />
2 0 0 , 2 9 9 N e t f i n a n c i a l p o s i t i o n 8 8 , 7 4 8 9 6 , 4 9 5 ( 7 , 7 4 7 )<br />
667,002 Shareholder’s equity 617,462 618,441 (979)<br />
1 6 , 1 1 2 C a p i t a l e x p e n d i t u r e s 3 7 , 6 7 7 9 6 , 0 6 7 ( 5 8 , 3 9 0 )<br />
8 9 , 5 5 3 C a s h f l o w f r o m o p e r a t i o n 7 0 , 1 7 7 1 6 8 , 9 5 0 ( 9 8 , 7 7 3 )<br />
2 2 , 3 2 3 F r e e c a s h f l o w ( 1 2 , 7 9 4 ) ( 4 4 , 7 0 8 ) 3 1 , 9 1 4<br />
( * )<br />
Trade receivables + inventories – trade payables<br />
Revenues. Consolidated sales were 439.5 million euros in the first half of <strong>2011</strong>, up 16.4% from H1<br />
2010. All the distribution channels posted outstanding performances, in all the product categories<br />
and the geographical regions.<br />
In the first half of <strong>2011</strong>, revenues to third parties totalled 212.5 million euros, with growth of<br />
10.7% from H1 2010. The DOS network posted excellent results; in the first six months of <strong>2011</strong>,<br />
revenues through DOS globally amounted to 227 million euros, with growth of 22.4% from H1<br />
2010 (+21.6% in Q1<br />
<strong>2011</strong>, +22.9% in Q2<br />
<strong>2011</strong>). As of June<br />
30 th <strong>2011</strong>, the<br />
Group’s distribution<br />
network<br />
is<br />
represented by 161<br />
DOS and 70<br />
franchised<br />
stores,<br />
compared to 151<br />
DOS and 71<br />
(Euro mn) H1 <strong>2011</strong> % H1 2010 % Change %<br />
DOS 227.0 51.6 185.5 49.1 41.5 22.4<br />
Third parties (WS) 212.5 48.4 192.0 50.9 20.5 10.7<br />
Total 439.5 100.0 377.5 100.0 62.0 16.4<br />
Third<br />
Third<br />
parties<br />
parties<br />
(WS)<br />
(WS)<br />
48,4%<br />
48.4%<br />
DOS<br />
DOS<br />
51.6%<br />
51,6%<br />
450<br />
400<br />
400<br />
350<br />
350<br />
300<br />
300<br />
250<br />
250<br />
200<br />
200<br />
150<br />
150<br />
100<br />
50<br />
0<br />
Third WS parties<br />
(WS)<br />
DOS<br />
Third WS parties<br />
(WS)<br />
DOS<br />
H1 <strong>2011</strong> H1 2010<br />
franchised stores as of June 30th 2010. The organic growth was brilliant: the Same Store Sales<br />
Growth (SSSG) rate, calculated as the worldwide average of sales growth rates <strong>report</strong>ed by DOS<br />
opened as of January 1st, 2010 , was 17.2% for the first 31 weeks of the <strong>year</strong> (from January 1st to<br />
July 31st, <strong>2011</strong>), showing an acceleration versus the first months of the <strong>year</strong>, despite a more<br />
challenging comparison basis.<br />
The Tod’s brand achieved excellent results, showing an acceleration of its growth (+19.3% in Q1<br />
<strong>2011</strong>, +25.6% in Q2 <strong>2011</strong>), driven by the outstanding results of the DOS network, in all the product<br />
categories and the geographical regions. In the first half of <strong>2011</strong>, the brand’s sales totalled 239.7<br />
14 Interim <strong>report</strong>
TOD’S Group<br />
<strong>2011</strong> <strong>Half</strong> Year Financial Report<br />
06.30.<strong>2011</strong><br />
million euros, up 22.3% from H1 2010. Revenues of the Hogan brand were 148.3 million euros, with<br />
growth of 7.9% from H1 2010, driven by the organic growth in It aly. The brand is currently focused<br />
on its expansion abroad, with emphasis on the Asian markets, where some stores are scheduled to<br />
be opened in the next few months.<br />
The Fay brand<br />
totalled 35.4 million<br />
euros of sales, with<br />
growth of 3.3% from<br />
H1 2010, driven by<br />
the Italian market, as<br />
well. Finally, the<br />
Roger Vivier brand’s<br />
revenues were 15.6<br />
million euros in H1<br />
<strong>2011</strong>, up 64.3% from<br />
H1 2010. This growth<br />
rate is considerable,<br />
(Euro mn) H1 <strong>2011</strong> % H1 2010 % Change %<br />
TOD'S 239.7 54.5 195.9 51.9 43.8 22.3<br />
HOGAN 148.3 33.8 137.5 36.4 10.8 7.9<br />
FAY 35.4 8.1 34.3 9.1 1.1 3.3<br />
RV 15.6 3.5 9.5 2.5 6.1 64.3<br />
Other 0.5 0.1 0.3 0.1 0.2 n.s.<br />
Total 439.5 100.0 377.5 100.0 62.0 16.4<br />
RV<br />
RV<br />
3,5%<br />
2,5%<br />
FAY<br />
FAY<br />
8,1%<br />
8,.%<br />
HOGAN<br />
33.8% 33,7%<br />
TOD'S<br />
54,5%<br />
TOD'S<br />
54.5%<br />
450<br />
400<br />
400<br />
350<br />
350<br />
300<br />
300<br />
250<br />
250<br />
200<br />
200<br />
150 150<br />
100<br />
50<br />
0<br />
RV<br />
FAY<br />
HOGAN<br />
HOGAN<br />
TOD'S<br />
RV<br />
FAY<br />
RV<br />
FAY<br />
HOGAN<br />
HOGAN<br />
TOD'S<br />
H1 <strong>2011</strong> H1 2010<br />
despite we continue to remind that this brand is still consolidating its positio ning among the most<br />
exclusive luxury brands worldwide.<br />
The Group confirms its leadership in the core business of shoes, thanks to the outstanding<br />
performances of the Tod’s and Hogan brand. This product category totalled 325.5 million euros<br />
of revenues in H1<br />
<strong>2011</strong>, up 15.3% from<br />
H1 2010. Sales from<br />
leather goods and<br />
accessories posted a<br />
significant acceleration<br />
of their performance<br />
(+21.6% in Q1 <strong>2011</strong>,<br />
+29.7% in Q2 <strong>2011</strong>),<br />
driven by the<br />
outstanding results of<br />
(Euro mn) H1 <strong>2011</strong> % H1 2010 % Change %<br />
Shoes 325.5 74.1 282.4 74.8 43.1 15.3<br />
Leather goods 72.7 16.5 57.8 15.3 14.9 25.7<br />
Appareal 41.0 9.3 37.0 9.8 4.0 10.7<br />
Other 0.3 0.1 0.3 0.1 0.0 n.s.<br />
Total 439.5 100.0 377.5 100.0 62.0 16.4<br />
Other<br />
0,1%<br />
Leather<br />
goods<br />
16,5% 15.3%<br />
Appar.<br />
Appar.<br />
9.8%<br />
9,3%<br />
Shoes<br />
74.8%<br />
Shoes<br />
74,1%<br />
450<br />
400<br />
400<br />
350<br />
350<br />
300<br />
300<br />
250<br />
250<br />
200<br />
200<br />
150<br />
100<br />
50<br />
0<br />
Leather<br />
Appar.<br />
Leather goods<br />
goods<br />
Shoes<br />
Apparel<br />
Leather Appar.<br />
Leather<br />
goods<br />
goods<br />
Shoes<br />
H1 <strong>2011</strong> H1 2010<br />
the Tod’s brand in the whole collection of handbags and accessories. The Group’s revenues of this<br />
product category totalled 72.7 million euros in H1 <strong>2011</strong>, up 25.7% from H1 2010. Finally, sales from<br />
apparel totalled 41 million euros in H1 <strong>2011</strong>, with growth of 10.7% from H1 2010.<br />
All the regions, where the Group operates, posted double -digit growth rates. The Group confirmed<br />
its leadership in Italy, with all its brands. In H1 <strong>2011</strong> sales on the domestic market totalled 226.1<br />
15 Interim <strong>report</strong>
TOD’S Group<br />
<strong>2011</strong> <strong>Half</strong> Year Financial Report<br />
06.30.<strong>2011</strong><br />
million euros (up<br />
+11% from H1 2010).<br />
Sales in the rest of<br />
Europe totalled 91.2<br />
million euros in H1<br />
<strong>2011</strong>, with growth of<br />
13.5% from H1 2010.<br />
Strong<br />
acceleration<br />
of the US market<br />
(+5.3% in Q1 <strong>2011</strong>,<br />
+23.5% in Q2 <strong>2011</strong>),<br />
driven by the<br />
(Euro mn) H1 <strong>2011</strong> % H1 2010 % Change %<br />
Italy 226.1 51.4 203.7 54.0 22.4 11.0<br />
Europe 91.2 20.8 80.3 21.3 10.9 13.5<br />
North America 29.3 6.7 25.5 6.7 3.8 15.2<br />
RoW 92.9 21.1 68.0 18.0 24.9 36.6<br />
Total 439.5 100.0 377.5 100.0 62.0 16.4<br />
North<br />
Nord Am. Am.<br />
6,8% 6.7%<br />
Europe Europe<br />
21.3% 20.8%<br />
RoW<br />
21.1% RoW<br />
21.1%<br />
Italy<br />
54.0% Italy<br />
51.4%<br />
400 450<br />
350 400<br />
300 350<br />
300<br />
250<br />
250<br />
200<br />
200<br />
150<br />
150<br />
100<br />
50<br />
0<br />
RoW<br />
RoW<br />
North. Am.<br />
North Am.<br />
Europe<br />
Europe<br />
Italy<br />
Italy<br />
RoW<br />
North. RoWAm.<br />
North Am.<br />
Europe<br />
Europe<br />
Italy<br />
H1 <strong>2011</strong> H1 2010<br />
excellent results of the DOS channel. In H1 <strong>2011</strong>, the Group’s sales in the US totalled 29.3 million<br />
euros (up 15.2% from H1 2010; +18% at constant exchange rates) . Finally, revenues for the area<br />
“Rest of World” totalled 92.9 million euros in H1 <strong>2011</strong>, with growth of 36.6% from H1 2010. The<br />
acceleration of the Asian performance was driven by the excelle nt results of mainland China, and<br />
Hong Kong. Japanese revenues grew in H1 <strong>2011</strong>, despite the tragic events which hit the country,<br />
mainly due to the more favourable currency exchange rate .<br />
O p e r a t i n g r e s u l t s . EBITDA in H1 <strong>2011</strong> totalled 115.6 million euros, up 24.9 million euros from<br />
the amount <strong>report</strong>ed in H1 2010, when it was 90.7 million euros. Gross operating profit was thus<br />
equivalent to 26.3% of consolidated revenue (H1 2010: 24%).<br />
The change on a comparable exchange rate basis was negligible. In this case, EBITDA would be<br />
about 114.2 million euros, and would represent about 26% of sales. In absolute terms, growth<br />
would amount to 23.5 million euros.<br />
16 Interim <strong>report</strong>
TOD’S Group<br />
<strong>2011</strong> <strong>Half</strong> Year Financial Report<br />
06.30.<strong>2011</strong><br />
As previously mentioned, the positive effects on<br />
operating results were generated by a<br />
composition of sales where higher margin<br />
components made a greater contribution<br />
(geographical areas and product categories),<br />
which were only partially absorbed by the<br />
structural growth in overhead costs, tied to<br />
development of business volumes. Lease and rental<br />
expenses (leases of locations and royalties for use<br />
of licenses) totalled 30.4 million euros at June<br />
30 th <strong>2011</strong>, up 2.2 million euros from 2010. They<br />
represented 7.5% of revenue at June 30 th 2010<br />
and 6.9% at June 30 th <strong>2011</strong>.<br />
EBITDA (Euro mn)<br />
114,2 115,6<br />
H1 <strong>2011</strong> comparable<br />
exch. rate basis<br />
90,7<br />
H1 <strong>2011</strong> H1 2010<br />
The cost for Group employee remuneration totalled 63.1 million euros, compared with 57.8<br />
million euros in the first six m onths of the previous <strong>year</strong>. The change is mainly connected with<br />
the increase in headcount, with a total of 3,416 employees at June 30 th <strong>2011</strong>, or 222 and 314<br />
persons more than at December 31 st and June 30 th 2010, respectively. The increase in employees<br />
stems mainly from reinforcement of the Group production organisation, as well as opening of new<br />
boutiques during the first half. At June 30 th<br />
revenue, as compared with 15.3% in the first six months of 2010.<br />
<strong>2011</strong>, employee costs equalled 14.4% of Group<br />
Amortisation and depreciation expenses grew,<br />
from 15.8 million euros in H1 2010, to 18.4 million<br />
euros in H1 <strong>2011</strong>, while their ratio to revenue<br />
remained constant at 4.2%. Net of additional<br />
operating provisions of 0.8 million euros, EBIT in<br />
H1 <strong>2011</strong> totalled 96.4 million euros (74.3 million<br />
euros in H1 2010) and was equal to 21.9% of<br />
Group sales, up significantly from 19.7% in H1<br />
2010).<br />
On a comparable exchange rate basis, EBIT would<br />
have been 94.9 million euros, and would be equal<br />
to 21.6% of revenues.<br />
EBIT (Euro mn)<br />
94,9 96,4<br />
H1 <strong>2011</strong> comparable<br />
exch. rate basis<br />
74,3<br />
H1 <strong>2011</strong> H1 2010<br />
17 Interim <strong>report</strong>
TOD’S Group<br />
<strong>2011</strong> <strong>Half</strong> Year Financial Report<br />
06.30.<strong>2011</strong><br />
Net financial income for the period was slightly above th e break-even point, at a positive 0.4<br />
million. Consolidated net income in H1 <strong>2011</strong> was 66.1 million euros, representing growth of<br />
26.0% from the figure for the same period of the previous <strong>year</strong> (first six months of 2010: 52.4<br />
million euros). At June 30 th <strong>2011</strong>, net income was equal to 15.0% of revenue, compared with<br />
13.9% in H1 2010. Net income shows the result after income taxes accrued for the period<br />
(including the effects of deferred taxes) totalling 30.8 million euros, for a tax rate of 31.8%<br />
(31.9% in H1 2010).<br />
Capital expenditures. Capital expenditure in H1 <strong>2011</strong> totalled 37.7 million euros. This increase<br />
includes about 20.0 million euros to reflect the intangible asset in relation to the agreement<br />
signed for financing of restoration work on the Coliseum. Net of this asset, the outlay for<br />
operating capital expenditure totalled 17.7 million euros, compared with 16.1 million euros in<br />
the same period of 2010.<br />
Tangible & intangible assets -<br />
Capital expenditures<br />
(Euro mn)<br />
96.1<br />
37.7<br />
40.8<br />
16.1<br />
21.3<br />
H1 <strong>2011</strong> H1 2010 FY 2010 FY 2009 FY 2008<br />
The capital expenditure during the period by the DOS network totalled about 8.6 million euros.<br />
This amount was used primarily to expand the<br />
DOS network in mainland China, with four new<br />
store openings in H1 <strong>2011</strong>, as well as the<br />
fitting out of two new TOD’S brand store<br />
corners in Milan and Madrid. TOD’S retail<br />
outlet space in Madrid was expanded and<br />
TOD’S boutique in Düsseldorf was renovated<br />
during the same period.<br />
INVESTMENTS BY ALLOCATION<br />
Other<br />
65%<br />
Prod.<br />
12%<br />
DOS<br />
23%<br />
18 Interim <strong>report</strong>
TOD’S Group<br />
<strong>2011</strong> <strong>Half</strong> Year Financial Report<br />
06.30.<strong>2011</strong><br />
Net financial position (NFP). At June 30 th<br />
<strong>2011</strong>, net financial position was positive and equal to<br />
88.7 million euros (200.3 million euros at June 30 th 2010), including liquid assets (cash and bank<br />
deposits) for 157.0 million euros, and liabilities for 68.3 million euros, of which 37.8 million<br />
euros for long-term exposures.<br />
Net Financial position (Euro 000’s)<br />
06.30.10 06.30.11 12.31.10 Change<br />
Current financial assets<br />
232,119 Cash and cash equivalents 157,017 171,729 (14,712)<br />
232,119 Current financial assets 157,017 171,729 (14,712)<br />
Current financial liabilities<br />
(24,267) Current account overdraft (25,343) (27,283) 1,940<br />
(1,521) Current share of medium-long term financing (5,168) (5,146) (22)<br />
(25,788) Current financial liabilities (30,511) (32,429) 1,918<br />
206,331 Current net financial position 126,506 139,300 (12,794)<br />
Non-Current financial liabilities<br />
(6,032) Financing (37,758) (42,805) 5,047<br />
(6,032) Non-Current financial liabilities (37,758) (42,805) 5,047<br />
200,299 Net financial position 88,748 96,495 (7,747)<br />
Net financial position at June 30 th<br />
<strong>2011</strong> amounts to 88.7 million euros (96.5 million euros at<br />
December 31 st 2010). Gross of dividends paid, net financial position would be equal to 150.0<br />
million euros (+53.5% millions in respect to December 31 s t 2010).<br />
(Euro 000’s)<br />
Cash Flows H1 <strong>2011</strong> H1 2010<br />
Profit (loss) for the period 65,409 51,618<br />
Non cash items 18,283 10,083<br />
Cash Flow 83,692 61,701<br />
Changes in operating net working capital (13,515) 27,852<br />
Operating cash flow 70,177 89,553<br />
Cash Flow from (used in) investment activity (31,270) (17,180)<br />
Cash Flow from (used in) financing activity (51,701) (50,050)<br />
Cash Flow from (used in) continuing operation (12,794) 22,323<br />
Cash flow from assets held for sale 0 0<br />
Cash Flow generated (used) (12,794) 22,323<br />
Net financial position at the beginning of the period 139,300 184,008<br />
Net financial position at the end of the period 126,506 206,331<br />
Change in current net finan cial position (12,794) 22,323<br />
Cash flow was 83.7 million euros in H1 <strong>2011</strong>, up 22 million euros from H1 2010. Operating cash<br />
flow was 70.2 million euros (89.6 million euros at June 30 th 2010), due to greater use of working<br />
capital, largely connected with the temporary accumulation of inventories due to the advanced<br />
19 Interim <strong>report</strong>
TOD’S Group<br />
<strong>2011</strong> <strong>Half</strong> Year Financial Report<br />
06.30.<strong>2011</strong><br />
stage of production for the next Fall -Winter collection, which will be sold entirely in the second<br />
half.<br />
The value of investments to finance capital expenditure and distribution of dividends also grew.<br />
Net of these, the free cash flow used in the period totalled 12.8 million euros .<br />
Significant events occurring after the end of the period<br />
No significant events affecting the Group’ activities occurred after the end of H1 <strong>2011</strong>.<br />
Business Outlook<br />
The most important signals resulting from analysis of t he business in H1 <strong>2011</strong> are found in the<br />
excellent positioning of the brands and firm customer satisfaction with the collections offered,<br />
both inside and outside Italy, as confirmed by the generally excellent sales performance of the<br />
DOS network.<br />
Particularly significant indicators of this positive trend, with respect to their relative weight in<br />
overall Group activity, are represented by the sharp reversal of performance on the United States<br />
market and brilliant performance by the ROGER VIVIER brand, which testify to how brand<br />
awareness is rapidly consolidating in the selected niche of target customers.<br />
Considering the number of orders received for the upcoming Fall -Winter collection, and the<br />
results obtained during the first six months of the <strong>year</strong>, positi ve forecasts can be made for the<br />
entire <strong>year</strong> in terms of growth in revenue and margins from FY 2010.<br />
Sant’Elpidio a Mare, August 5 th , <strong>2011</strong><br />
The Chairman of the Board of Directors<br />
Diego Della Valle<br />
20 Interim <strong>report</strong>
Group<br />
<strong>Half</strong>-<strong>year</strong> Interim Report<br />
Supplementary notes
TOD’S Group<br />
<strong>2011</strong> <strong>Half</strong> Year Financial Report<br />
06.30.<strong>2011</strong><br />
1. General notes<br />
The half-<strong>year</strong> Financial Report, which includes the half-<strong>year</strong> condensed financial statements of<br />
TOD’S Group at June 30th, <strong>2011</strong>, has been prepared in accordance with Article 154 ter (2, 3 and<br />
4) of the Consolidated Law on Financial Intermediation (“TUF”), introduced by Legislative Decree<br />
195/2007 in implementation of Directive 2004/109/EC (the “Transparency” directive), and<br />
complies with IAS 34 – Interim Financial Reporting, adopted according to the procedure<br />
envisaged in Article 6 of EC Regulation no. 1606/2002. Consequently, this half-<strong>year</strong> condensed<br />
financial statements not include all the information required for the annual <strong>report</strong> and must be<br />
read together with the annual <strong>report</strong> prepared for the financial <strong>year</strong> at December 31st 20 10.<br />
It includes the half-<strong>year</strong> condensed financial statements of TOD’S S.p.A. and its Italian and<br />
foreign subsidiaries, together identified as TOD’S Group, drafted with the reference date of June<br />
30th, <strong>2011</strong> (January 1st – June 30th).<br />
The half-<strong>year</strong> condensed financial statements (profit and loss account, comprehensive profit and<br />
loss account, Consolidated Statement of Financial position , Consolidated Statement of Cash<br />
Flows, and Consolidated statement of changes in equity) were drafted in the long form and are<br />
the same as those used for the consolidated financial statements at December 31st, 20 10.<br />
As envisaged in IAS 34, the notes to the financial statements were drafted in summary form and<br />
refer only to the components of the profit and loss account, balance sheet, and fund s flow<br />
statement, whose composition or change in amount or nature was significant. Thus, they<br />
illustrate additional information for accurate comprehension of Group’s financial position at June<br />
30 th , <strong>2011</strong>.<br />
The <strong>Half</strong> Year Financial Report at June 30th, <strong>2011</strong> was approved by the Board of Directors of<br />
TOD’S S.p.A. on August 5th, <strong>2011</strong>, when its publication was authorised. It was audited (limited<br />
review) by the independent auditor Deloitte & Touche S.p.A.<br />
2. Accounting policies<br />
The half-<strong>year</strong> condensed financial statements were prepared according International Accounting<br />
Standards (“IFRS”) issued by International Accounting Standards Board (“IASB”) and approved by<br />
the European Union. IFRS refers also to the International Accounting Standards (“IAS”), in force<br />
at <strong>report</strong>ing date, and all interpretative documents issued by International Financial Reporting<br />
Interpretations Committee (“SIC”) .<br />
The accounting standards used to prepare this half-<strong>year</strong> condensed financial statements are<br />
consistent with those used to prepare the consolidated annual <strong>report</strong> at 31 December 20 10, to<br />
which reference is made for full treatment.<br />
22 Supplementary notes
TOD’S Group<br />
<strong>2011</strong> <strong>Half</strong> Year Financial Report<br />
06.30.<strong>2011</strong><br />
i. Accounting standards, amendments and interpretations applied since Januar y 1 st <strong>2011</strong>,<br />
relevant for the Group<br />
‣ IAS 24 Revised – Related parties disclosures: it has been clarified the definition of a related<br />
party and simplified disclosures for government-related entities.<br />
ii. Accounting standards, amendments and interpretations a pplied since January 1 st <strong>2011</strong>, not<br />
relevant for the Group<br />
The following accounting standards, amendments, improvements and interpretations, are<br />
applicable since 1 st January <strong>2011</strong> and refer to situations or cases that were not applied in the<br />
half-<strong>year</strong> condensed financial statements of TOD’S Group for the period ending at June 30 th <strong>2011</strong>:<br />
‣ IAS 34 Improvement – Interim financial <strong>report</strong>ing: it has been clarified the disclosure<br />
principle for significant transactions on interim financial <strong>report</strong>ing.<br />
‣ IAS 1 Improvement – Presentation of financial statements : an entity, for each component of<br />
equity, may present the breakdown of other comprehensive income either in the statement<br />
of changes in equity or in the no tes to the financial statements.<br />
‣ IFRS 1 Improvement – First time adoption: a first time adopter that changes its accounting<br />
policies or its use of IFRS 1 exemptions after publishing a set of IAS 34 interim financial<br />
information should explain those changes and include the effects of such changes in its<br />
opening reconciliations within the first annual IFRS financial statements; the exemption to<br />
use a ‘deemed cost’ arising from a revaluation , is extended to revaluations occurred during<br />
the period covered by the first IFRS financial statements; entities subject to rate regulation<br />
are permitted to use previous GAAP carrying amounts of property plant and equipment or<br />
intangible assets as deemed cost.<br />
‣ IFRS 7 Improvement, Amendment – Financial instruments disclosures: it has been clarified<br />
disclosures on the nature and extent of risks arising from financial instruments;<br />
‣ IFRIC 13 Improvement – Customer loyalty programmes: it has been clarified the meaning of<br />
the term ‘fair value’ in the context of measuring award cre dits under customer loyalty<br />
programmes.<br />
‣ IFRIC 14 Amendment – The limit on a defined benefit asset, minimum funding requirements<br />
and their interaction: it has been clarified the conditions under which an asset could be<br />
recognised in the financial statements.<br />
‣ IFRIC 19 – Extinguishing financial liabilities with equity instruments: it has been clarified the<br />
accounting treatment for renegotiating the term of a financial liability fully o partially issuing<br />
equity instruments.<br />
Estimates and assumptions. Preparation of the financial figures <strong>report</strong>ed on the half-<strong>year</strong><br />
condensed financial statements entails making estimates and assumptions based on the<br />
23 Supplementary notes
TOD’S Group<br />
<strong>2011</strong> <strong>Half</strong> Year Financial Report<br />
06.30.<strong>2011</strong><br />
management’s best valuation. Estimates and assumptions are reviewed regularly . If these<br />
estimates and assumptions should change in future from the actual circumstances, they will<br />
obviously be modified for the period in which those circumstances changed.<br />
Specifically with regard to determination of eventual impairment losses affecting fixed assets,<br />
complete tests are performed only when the annu al <strong>report</strong> is prepared, when all information as<br />
might be necessary are available, unless there are indications that require immediate valuation<br />
of eventual impairment losses or the occurrence of events that required re iteration of the<br />
procedure. The analyses carried out at this <strong>report</strong>ing date have not revealed any impairment<br />
indicators.<br />
Presentation of financial statements drafted in foreign currency. The rates applied for<br />
translation of the financial statements of subsidiaries using a functional currency other than the<br />
currency used for consolidation, are illustrated in the following table and compared with those<br />
used in the previous period:<br />
Jan. - June <strong>2011</strong> Jan. - June 2010<br />
Exch. rate at Average Exch. rate at Average<br />
Base June 30 th exch. rate June 30 th exch. rate<br />
US Dollar 1 0.691 0.713 0.815 0.755<br />
UK pound sterling 1 1.108 1.153 1.223 1.150<br />
Swiss franc 1 0.828 0.788 0.753 0.697<br />
Hong Kong dollar 100 8.891 9.167 10.466 9.714<br />
Japanese yen 100 0.860 0.870 0.919 0.826<br />
Hungarian forint 1,000 3.758 3.713 3.496 3.683<br />
Singapore dollar 1 0.563 0.567 0.583 0.541<br />
Korean WON 1,000 0.648 0.647 0.667 0.654<br />
Chinese Renminbi 100 10.705 10.906 12.017 11.061<br />
Macao Pataca 100 8.636 8.905 10.169 9.438<br />
Albanian Lek 100 0.708 0.711 0.732 0.725<br />
Indian Rupia 100 1.549 1.585 1.755 1.649<br />
3. Seasonal or ciclical nature of interim transactions<br />
TOD’S Group engages in a business that, while not manifesting significant seasonal or cyclical<br />
changes in overall annual sales, is impacted by monthly differences in the flows of revenues and<br />
costs generated by its industrial activity over the course of the <strong>year</strong>.<br />
4. Alternative indicators of performances<br />
In order to strip the effects of changes in exchange rates from the average values of the first six<br />
months of <strong>2011</strong> from the results for the six months of 20 10, the typical economic indicators<br />
(Revenues, EBITDA, EBIT) have been recalculated by applying the average exchange rates for the<br />
six months of 2010, thereby rendering them fully comparable with those of the pre vious period.<br />
24 Supplementary notes
TOD’S Group<br />
<strong>2011</strong> <strong>Half</strong> Year Financial Report<br />
06.30.<strong>2011</strong><br />
These criteria for measuring business performance must not be considered alternative to those<br />
established by IFRSs.<br />
Furthermore – as it has already been mentioned in the preceding paragraph, the Group’s cash<br />
flow is uneven from quarter to qua rter, largely on account of its industrial activity. Consequently,<br />
the analysis of interim results and financial statement indicators (EBITDA, EBIT, financial position<br />
and working capital) cannot be considered fully representative, and it would thus be imp roper to<br />
consider the indicators for the reference period to be in proportion to the results for the entire<br />
financial <strong>year</strong>.<br />
5. Scope of consolidation<br />
On November 26th 2010, the Group acquired full ownership of Holpaf B.V., the real estate<br />
company that owns the Tokyo building that, since 2005, pursuant to a lease agreement, houses<br />
both TOD’S Japan KK’s administrative offices and the largest TOD’s flagship store in Japan (for<br />
further details see the financial statements for 2010). The entire absorption of this company<br />
represents the only change in the <strong>report</strong>ing entity covered under the half-<strong>year</strong> condensed<br />
financial statements as at June 30th 2010.<br />
It is assumed that the Group controls those companies in which it does not own more than 50%<br />
of the capital, and thus disposes of the same percentage of voting power at the Shareholders’<br />
Meeting, where the Group has the power to exercise direct or indirect control of those<br />
companies’ financial and operating policies in view of realizing benefits from their activities.<br />
The following list illustrates the entire scope of consolidation at June 30th, 201 1:<br />
Parent Company<br />
TOD’S S.p.a.<br />
S.Elpidio a Mare - Italy<br />
Share Capital (S.C.) - Euro 61,218,802<br />
Direct subsidiaries<br />
TOD’S Deutsch. Gmbh TOD’S France Sas An.Del. USA Inc. TOD’S Internat. BV<br />
Dusseldorf - Germany Paris - France New York - U.S.A Amsterdam –Netherlands<br />
S.C. - Euro 153,387.56 S.C. - Euro 780,000 S.C. - Usd 3,700,000 S.C. - Euro 2,600,200<br />
% held: 100% % held: 100% % held: 100% % held: 100%<br />
Del.Com S.r.l.<br />
Holpaf B.V.<br />
S.Elpidio a Mare – Italy Amsterdam - Netherlands<br />
S.C. - Euro 31,200 S.C. - Euro 5,000,000<br />
% held: 100% % held: 100%<br />
Indirect subsidiaries<br />
Cal.Del. USA Inc. Colo.Del. USA Inc. Deva Inc. Flor.Del. USA Inc.<br />
Beverly Hills, Ca - U.S.A. Denver, Co - U.S.A. Wilmington, DE – U.S.A. Tallahassee, Fl - U.S.A.<br />
S.C. - Usd 10,000 S.C. - Usd 10,000 S.C. - Usd 500,000 S.C. - Usd 10,000<br />
% held: 100% % held: 100% % held: 100% % held: 100%<br />
25 Supplementary notes
TOD’S Group<br />
<strong>2011</strong> <strong>Half</strong> Year Financial Report<br />
06.30.<strong>2011</strong><br />
Indirect subsidiaries (continues)<br />
Hono.Del. Inc. Il.Del. USA Inc. Neva.Del. Inc. Or.Del. USA Inc.<br />
Honolulu, Hi - U.S.A. Springfield, Il - U.S.A. Carson City, Nv - U.S.A. Sacramento, Ca - U.S.A.<br />
S.C. - Usd 10,000 S.C. - Usd 10,000 S.C. - Usd 10,000 S.C. - Usd 10,000<br />
% held: 100% % held: 100% % held: 100% % held: 100%<br />
TOD’S Tex Del USA Inc. Gen.Del SA Sandel SA TOD’S Belgique S.p.r.l.<br />
Dallas, Tx - U.S.A Ginevra - Switzerland San Marino Bruxelles - Belgium<br />
S.C. - Usd 10,000 S.C. - Chf 200,000 S.C. - Euro 258,000 S.C. - Euro 300,000<br />
% held: 100% % held: 100% % held: 100% % held: 100%<br />
TOD’S Espana SL TOD’S Hong Kong Ltd TOD’S Japan KK TOD’S Saint Barth Sas<br />
Madrid – Spain Hong Kong Tokio - Japan Saint Barthélemy<br />
S.C. - Euro 468,539.77 S.C. - Usd 16,550,000 S.C. - Jpy 100,000,000 S.C. - Euro 500,000<br />
% held: 100% % held: 100% % held: 100% % held: 100%<br />
TOD’S Singapore Pte Ltd Un.Del Kft TOD’S UK Ltd Webcover Ltd<br />
Singapore Tata - Hungary London – Great Britain London – Great Britain<br />
S.C. - Sgd 300,000 S.C. - Huf 42,900,000 S.C. - Gbp 350 ,000.00 S.C. - Gbp 1,000.00<br />
% held: 100% % held: 100% % held: 100% % held: 50%<br />
TOD’S Luxembourg SA TOD’S Korea Inc. TOD’S Macao ltd TOD’S (Shanghai) Tr. Co Ltd<br />
Luxembourg Seoul - Korea Macao Shanghai – China<br />
S.C. - Euro 31,000.00 S.C. - Won 1,600,000,000 S.C. – MOP 20,000,000 S.C. – USD 6,000,000<br />
% held: 50% % held: 100% % held: 100% % held: 100%<br />
TOD’S India Retail Pte Ltd Re.Se.Del. S.r.l. Del.Pav. S.r.l. Filangieri 29 S.r.l.<br />
Mumbai - India S.Elpidio a Mare- Italy S.Elpidio a Mare- Italy S.Elpidio a Mare- Italy<br />
S.C. – INR 193,900,000 S.C. - Euro 25,000.00 S.C. - Euro 50 ,000 S.C. - Euro 100,000<br />
held: 51% held: 100% held: 50% held: 50%<br />
Alban.Del Sh.p.k.<br />
Tirana - Albania<br />
S.C. - Euro 720,000<br />
held: 100%<br />
6. Segment <strong>report</strong>ing<br />
The search for higher levels of operating efficiency has revealed the general importance of a<br />
significant portion of service activities (first and foremost produc tion), both at the central and<br />
peripheral levels, as the basis for maximi sing profitability. This renders the possibility of<br />
aggressive segmentation of the business uneconomical under current circumstances.<br />
At the operating level, Group’s organization is based on an articulated matrix structure according<br />
to the different functions/activities in the value chain, alternatively according to brand, product,<br />
channel and geographical area. The overall organization envisages a unified strategic vision of<br />
the business.<br />
This type of organization is reflected in the ways in which management monitors and strategically<br />
focuses the Group’s activities.<br />
The economic disclosure set out in the Interim Report is completed as follows, including a break -<br />
down of consolidated revenues by BRAND, CHANNEL, PRODUCT TYPE and REGION, and INCOME<br />
STATEMENT for the business:<br />
26 Supplementary notes
TOD’S Group<br />
<strong>2011</strong> <strong>Half</strong> Year Financial Report<br />
06.30.<strong>2011</strong><br />
<strong>2011</strong> Capital expenditures<br />
By investment allocation (Euro mn)<br />
By region (Euro mn)<br />
H1 2009 <strong>2011</strong><br />
24,7<br />
H1 2008 2010<br />
24.7<br />
29.6 29,6<br />
H1 2009 <strong>2011</strong><br />
H1 2008 2010<br />
-<br />
8,6 9,2<br />
8.6 9.2<br />
4,4 4.4 3,8 3.8 3,1 3.1<br />
7.57,5<br />
3.0 3,0 2,9<br />
3.7 4.2<br />
2.9<br />
1.4 1.5 1,4 1,5<br />
3,7 4,2<br />
-<br />
Key money DOS Prod. Other<br />
Italy Italy Europe EuropeNorth Am. North Am. RoW RoW<br />
Distribution network<br />
TOD’S GROUP - Distribution network<br />
06.30.11 06.30.10<br />
Italy DOS 41 37<br />
FRANCHISED STORES 5 6<br />
Europe DOS 33 31<br />
FRANCHISED STORES 10 11<br />
USA DOS 14 14<br />
FRANCHISED STORES - -<br />
RoW DOS 73 69<br />
FRANCHISED STORES 55 54<br />
Total DOS 161 151<br />
Total FRANCHISED STORES 70 71<br />
107<br />
101<br />
13<br />
12<br />
10<br />
11<br />
TOD'S<br />
58<br />
58<br />
HOGAN<br />
DOS<br />
Franchised stores<br />
H1 <strong>2011</strong> H1 2010<br />
DOS<br />
Franchised stores<br />
H1 <strong>2011</strong> H1 2010<br />
27 Supplementary notes
TOD’S Group<br />
<strong>2011</strong> <strong>Half</strong> Year Financial Report<br />
06.30.<strong>2011</strong><br />
3<br />
3<br />
7<br />
6<br />
FAY<br />
ROGER<br />
VIVIER<br />
0<br />
0<br />
1<br />
1<br />
DOS<br />
Franchised stores<br />
H1 <strong>2011</strong> H1 2010<br />
DOS<br />
Franchised stores<br />
H1 <strong>2011</strong> H1 2010<br />
7. Earnings per share<br />
The calculation of base and diluted earnings per share is based on the followings:<br />
i. R e f e r e n c e p r o f i t<br />
(Euro 000’s)<br />
From continuing and discontinued operations HY <strong>2011</strong> H1 2010<br />
Profit used to determine basic earning s per share 65,409 51,618<br />
Dilution effects 0 0<br />
Profit used to determine diluted earnings per share 65,409 51,618<br />
(Euro 000’s)<br />
From continuing and discontinued operations H1 <strong>2011</strong> H1 2010<br />
Profit attributable to equity holders of the Company 65,409 51,618<br />
Income (Loss) from discontinued operations<br />
Profit used to determine basic earning per sh are 65,409 51,618<br />
Dilution effects<br />
Profit used to determine dilu ted earning per share 65,409 51,618<br />
In both periods, first half <strong>2011</strong> and 2010, there were no dilutions of net consolidated earnings,<br />
partly as a result of activities that were disc ontinued during the periods in question.<br />
ii. R e f e r e n c e n u m b e r o f s h a r e s<br />
H1 <strong>2011</strong> H1 2010<br />
Weighted average number of shares to determine basic earning s per share 30.609.401 30.609.401<br />
Share options - -<br />
Weighted average number of shares to determine dilu ted earning per share 30.609.401 30.609.401<br />
28 Supplementary notes
TOD’S Group<br />
<strong>2011</strong> <strong>Half</strong> Year Financial Report<br />
06.30.<strong>2011</strong><br />
8. Dividends<br />
Pursuant to a resolution by the Shareholders’ Meeting of April 2 0 th <strong>2011</strong>, the parent company<br />
TOD’S S.p.A. paid its shareholders dividends in May for the net profit realised in FY 20 10. The<br />
aggregate value of dividends paid totals 61,218,802.00 euros, at the rate of 2 euros for each of<br />
the 30,609,401 shares comprising share capital at the ex dividend date (May 23 rd <strong>2011</strong>).<br />
Moreover, other Group companies paid 1,790 thousand euros in dividends to their own minority<br />
shareholders.<br />
9. Intangible and tangible fixed assets<br />
Intangible assets of TOD’S S.p.A. include the net book value related to the agreement signed with<br />
the Ministry of Cultural Affairs and the Supervisor for Central Rome ’s Archaeological Area for<br />
financing the restoration work on the Coliseum, amounting to 18.5 million euros net of<br />
amortization for 1.5 million euros. The asset value has been determined by discounting expected<br />
cash flows for restoration activities based on the expected work plan. The liability for financing<br />
restoration works amounts to 20.2 million euros, net of VAT, of which 16.7 million euros for longterm<br />
exposures.<br />
10. Hedging of financial risks (IFRS 7)<br />
Consistently with the provisions of the Code of Self -discipline of Listed Companies, TOD’S Group<br />
has set up a system for monitoring the financial risks to which it is exposed. These can be<br />
identified as follows:<br />
i. Credit risk. This represents the exposure of TOD’S Group to potential losses stemming from<br />
default on the obligations assumed by commercial counterparties.<br />
ii. Liquidity risk. This represents the risk stemming from the unavailability of financial resources<br />
as necessary to meet the short-term commitments assumed by the Group and its own<br />
financial requirements.<br />
iii. Market risk. This type of risk includes those risks that are directly or indirectly tied with the<br />
fluctuation of physical and financial market prices to which a company is exposed:<br />
– exchange rate risk;<br />
– interest rate risk;<br />
– commodity risk, which is tied to the volatility of prices for the raw materials used in the<br />
production process.<br />
In the ambit of the policy adopted for management of the aforementioned risks, the Group<br />
constantly monitors the financial risks connected with its operations, so that it can a ssess their<br />
potential negative effects in advance and take the necessary actions to mitigate them.<br />
29 Supplementary notes
TOD’S Group<br />
<strong>2011</strong> <strong>Half</strong> Year Financial Report<br />
06.30.<strong>2011</strong><br />
Particularly in regard to exchange rate risk, the Group has adopted a risk management policy that<br />
pursues the objective of guarant eeing that the countervalue in euro of the receipts from<br />
wholesale sales in foreign currency of each collection (Spring -Summer and Fall-Winter) is equal<br />
or better on average to what would be obtained by applying the set target exchange rates. The<br />
foregoing purposes are pursued by executing forward contracts for each individual currency in<br />
which the Group operates (principally USD, CHF, GBP, HKD, SGD), in order to hedge a specific<br />
percentage of revenue volumes (and costs) expected in the individual currencies other than the<br />
functional currency, without any speculative or trading purpose, consistently with the strategic<br />
policies adopted for prudent management of cash flows. This might involve foregoing<br />
opportunities, but also avoids incurring speculative risks. The fair value of these derivative<br />
financial instruments is classifiable as being 2 nd level, according to the hierarchy of fair value<br />
requested by IFRS 7.<br />
11. Transactions with related parties<br />
In implementation of the Related Party Transactions Regulation adopted by CONSOB with<br />
Resolution no. 17221 of March 12th 2010, as amended by Resolution no. 17389 of June 23 rd<br />
2010, during 2010 TOD’S Group modified its existing procedures governing the transparency and<br />
substantive fairness of related party transactions, to bring them in line with the principles set<br />
out in the cited CONSOB Regulation. (The complete text of the “Related PartyTransactions<br />
Procedure of TOD’S S.p.A.” can be found at www.todsgroup.com). The new related parties<br />
procedure was approved – after receiving the favourable opinion of independent directors – by<br />
the Board of Directors of the parent company on November 11 th 2010 and came into force on<br />
January 1st <strong>2011</strong>.<br />
Transactions concluded during the period.<br />
In continuation of contractual relationships already existing in 2010, TOD’S Group continued to<br />
maintain a series of contractual relationship with related parties (directors/controlling or<br />
significant shareholders) in the first half of <strong>2011</strong>. All transactions – which are connected with the<br />
normal operations of TOD’S Group companies – were executed solely on behalf of the Group by<br />
applying contractual conditions consistent with those tha t can theoretically be obtained on an<br />
arm’s length basis and compliant with corporate governan ce provisions which ensure regularity,<br />
transparency and fairness of such transactions. The main object of the transactions was the sale<br />
of products, lease of sales spaces, show rooms and offices, use of the ROGER VIVIER brand<br />
license and the provision of advertising services.<br />
On November 4 th 2009, the IASB issued a revised version of IAS 24 - Related Party Disclosures,<br />
applicable from January 1 st <strong>2011</strong>, that clarifies the definition of a related party. Application of<br />
this amendment did not have any significant effects on the measurement of items in Group’s<br />
30 Supplementary notes
TOD’S Group<br />
<strong>2011</strong> <strong>Half</strong> Year Financial Report<br />
06.30.<strong>2011</strong><br />
financial statements and had only limited effects on the disclosures for related par ty<br />
transactions.<br />
i. Commercial transactions with related parties – Revenues<br />
Euro 000’s<br />
Sales of Rendering Sales Operating Other<br />
products of services of assets Royalties lease operations<br />
30 June <strong>2011</strong><br />
Parent Company ( * ) 1,182 1,296 5,093 67<br />
Directors 1 32<br />
Exec. with strat. respons.<br />
Other related parties ( * * ) 1,475<br />
Total 2,658 1,296 - 5,093 99 -<br />
30 June 2010<br />
Parent Company ( * ) 945 1,850 5,343 33<br />
Directors 1 32<br />
Exec. with strat. respons.<br />
Other related parties ( * * ) 1,090<br />
Totale 2,036 1,850 - 5,343 65 -<br />
ii.<br />
Commercial transactions with related parties – Costs<br />
Euro 000’s<br />
Purchase of Rendering Sales Operating Other<br />
products of services of assets Royalties lease operations<br />
30 June <strong>2011</strong><br />
Parent Company ( * ) 978 1,061 2,132 4<br />
Directors 1,741<br />
Exec. with strat. respons.<br />
Other related parties ( * * ) 2,991 117 282<br />
Total 978 4,732 - 1,178 2,414 4<br />
30 June 2010<br />
Parent Company ( * ) 925 895 3,663<br />
Directors 1,710<br />
Exec. with strat. respons.<br />
Other related parties ( * * ) 2,323 83 280<br />
Totale 925 4,033 - 978 3,943<br />
31 Supplementary notes
TOD’S Group<br />
<strong>2011</strong> <strong>Half</strong> Year Financial Report<br />
06.30.<strong>2011</strong><br />
iii. Commercial transactions with related parties – Receivables and payables<br />
(Euro000’s) 06.30.11 06.30.10<br />
Receivables Payables Receivables Payables<br />
Parent Company ( * ) 4,496 1,721 10,032 1,314<br />
Directors 7 1,230 5 1,119<br />
Exec. with strat. respons.<br />
Other related parties ( * * ) 412 2,750 268 2,116<br />
Total 4,915 5,701 10,305 4,549<br />
(*) Companies directly or indirectly controlled by Chairman of the Board of Directors Diego Della Valle.<br />
(**) Companies where Mr. Diego Della Valle is executive with strategic responsibilities (and subsidiaries<br />
controlled by these companies).<br />
iv. Commercial transactions with unconsolidated subsidiaries<br />
Receivables and payables 06.30.11 06.30.10<br />
(Euro000’s) Receivables Payables Receivables Payables<br />
Special Purpose Entities (** * ) 406<br />
(***) F inancial balances referred to the period prior to acquisition of the activities.<br />
Given the insignificance of these amounts, they ha ve not been separately listed on the face of<br />
the financial statements. Transactions between Group companies included in the s cope of<br />
consolidation have been eliminated from the half-<strong>year</strong> condensed financial statements.<br />
Consequently, they have not been highlighted in these notes.<br />
Compensation of Directors, Statutory Auditors and General Managers<br />
Compensation of Directors, Statutory Auditors and Executives with strategi c responsibilities of<br />
TOD’s S.p.A. for the first half of <strong>2011</strong> (including compensation for the activities performed at<br />
subsidiaries) are not significantly changed in respect to the period ended at 31 st December 2010.<br />
No severance indemnity is provided for Directors and Executives with Strategic Responsibilities .<br />
32 Supplementary notes
Group<br />
<strong>Half</strong>-<strong>year</strong> Interim Report<br />
Financial Statements
TOD’S Group<br />
<strong>2011</strong> <strong>Half</strong> Year Financial Report<br />
06.30.<strong>2011</strong><br />
Consolidated Profit & Loss<br />
Euro 000’s<br />
H1 <strong>2011</strong> H1 2010 Year 2010<br />
Revenues<br />
Sales revenues 439,458 377,462 787,539<br />
Other revenues and income 8,614 9,610 18,819<br />
Total revenues and income 448,072 387,072 806,358<br />
Operating costs<br />
Change in inventories (work in progr. & finished goods) 16,640 1,888 952<br />
Cost of raw materials, supplies, and material for consumpt ion (103,222) (86,837) (178,829)<br />
Cost of services (135,571) (115,808) (238,514)<br />
Cost of use of third parties assets (30,434) (28,151) (58,714)<br />
Cost of labour (63,125) (57,862) (117,751)<br />
Other operating charges (16,744) (9,609) (20,443)<br />
Total operating cost (332,456) (296,379) (613,299)<br />
EBITDA 115,616 90,693 193,059<br />
Amortization, depreciation and write -downs<br />
Amortization of intangible assets (5,341) (3,695) (7,599)<br />
Depreciation of tangible assets (13,102) (12,093) (24,476)<br />
Other adjustments - - -<br />
Total amortization, depreciation and write -downs (18,443) (15,788) (32,075)<br />
Provision (757) (637) (1,040)<br />
EBIT 96,416 74,268 159,944<br />
Financial income and charges<br />
Financial income 8,391 10,853 19,371<br />
Financial charges (7,942) (8,152) (15,963)<br />
Total financial income (charges) 449 2,701 3,408<br />
Income (losses) from equity investments - - -<br />
Profit before taxes 96,865 76,969 163,352<br />
Income taxes (30,801) (24,548) (52,566)<br />
Profit/(Loss) for the period 66,064 52,421 110,786<br />
Non-controlling interest (655) (803) (1,710)<br />
Profit /(Loss) of the group 65,409 51,618 109,076<br />
EPS (Euro) 2.14 1.69 3.56<br />
EPS diluted (Euro) 2.14 1.69 3.56<br />
34 Financial Statements
TOD’S Group<br />
<strong>2011</strong> <strong>Half</strong> Year Financial Report<br />
06.30.<strong>2011</strong><br />
Consolidated comprehensive income<br />
Euro 000’s<br />
H1 <strong>2011</strong> H1 2010<br />
Profit (loss) for the period (A) 66,064 52,421<br />
Other Gains/(Losses)<br />
Gains/(Losses) from derivative financial<br />
instruments (cash flow hedge) 1,156 (2,003)<br />
Gains/(Losses) from foreign subsidiaries F/S translation (3,844) 2,782<br />
Total Other Gains/(Losses) net of tax (B) (2,688) 779<br />
Total Comprehensive Income (A) + (B) 63,376 53,200<br />
Attributable to Shareholders of Parent Company 62,757 52,168<br />
Attributable to non-controlling interests 619 1,032<br />
35 Financial Statements
TOD’S Group<br />
<strong>2011</strong> <strong>Half</strong> Year Financial Report<br />
06.30.<strong>2011</strong><br />
Consolidated Statements of Financial Position<br />
Euro 000’s<br />
06.30.11 12.31.10 06.30.10<br />
Non current-assets<br />
Intangible fixed assets<br />
Asset with indefinite useful life 149,024 149,024 149,024<br />
Key money 25,605 27,679 29,765<br />
Others 29,688 12,380 11,151<br />
Total intangible fixed assets 204,317 189,083 189,940<br />
Tangible fixed assets<br />
Building and lands 100,660 105,721 40,099<br />
Plant and machinery 4,311 3,962 4,757<br />
Equipment 12,902 12,573 12,380<br />
Leasehold improvements 30,351 30,595 34,380<br />
Others 22,870 21,252 20,065<br />
Total tangible fixed assets 171,094 174,103 111,681<br />
Other assets<br />
Real estate investments 44 46 47<br />
Equity investments 20 20 20<br />
Deferred tax assets 36,647 32,027 28,772<br />
Others 8,393 7,789 9,004<br />
Total other assets 45,104 39,882 37,843<br />
Total non-current assets 420,515 403,068 339,464<br />
Current-assets<br />
Inventories 227,689 203,136 205,938<br />
Trade receivables 126,468 119,560 116,907<br />
Tax receivables 7,246 3,856 3,026<br />
Derivative financial instruments 3,506 2,084 898<br />
Others 12,565 12,263 9,916<br />
Cash and cash equivalents 157,017 171,729 232,119<br />
Total current assets 534,491 512,628 568,804<br />
Assets held for sale - - -<br />
Total assets 955,006 915,696 908,268<br />
36 Financial Statements
TOD’S Group<br />
<strong>2011</strong> <strong>Half</strong> Year Financial Report<br />
06.30.<strong>2011</strong><br />
Euro 000’s<br />
(continue) 06.30.11 12.31.10 06.30.10<br />
Equity<br />
Share capital 61,219 61,219 61,219<br />
Capital reserves 214,055 214,055 214,055<br />
Treasury stock - - -<br />
Hedging and translation reserves (6,915) (4,263) (4,783)<br />
Retained earnings 277,962 231,451 338,745<br />
Accumulated earnings/losses - - -<br />
Profit attributable to the Group 65,409 109,076 51,618<br />
Total Equity attributable to the Group 611,730 611,538 660,854<br />
Non controlling interests<br />
Share capital and reserves 5,077 5,193 5,345<br />
Profit attributable to non controlling interests 655 1,710 803<br />
Total Equity attributable to non controlling interests 5,732 6,903 6,148<br />
Total Equity 617,462 618,441 667,002<br />
Non current liabilities<br />
Provisions for risks 1,515 1,369 1,073<br />
Deferred tax liabilities 28,749 27,722 24,187<br />
Retirement benefit obligation 11,233 11,419 11,450<br />
Others 20,280 - -<br />
Bank borrowings 37,758 42,805 6,032<br />
Total non-current liabilities 99,535 83,315 42,742<br />
Current liabilities<br />
Trade payables 144,347 130,008 129,463<br />
Tax payables 18,105 20,064 13,523<br />
Derivative financial instruments 1,769 2,333 5,101<br />
Others 43,277 29,106 24,649<br />
Banks 30,511 32,429 25,788<br />
Total current liabilities 238,009 213,940 198,524<br />
Liabilities held for sale - - -<br />
Total Equity and liabilities 955,006 915,696 908,268<br />
37 Financial Statements
TOD’S Group<br />
<strong>2011</strong> <strong>Half</strong> Year Financial Report<br />
06.30.<strong>2011</strong><br />
Consolidated Statements of Cash Flows<br />
Euro 000’s Period Period<br />
Jan. – Jun. 11 Jan. – Jun. 10<br />
Profit (loss) attributable to the Group 65,409 51,618<br />
Non cash adjustments<br />
Amortization, depreciation, revaluation and write -downs 21,370 13,397<br />
Change in employee severance indemnity reserve 499 558<br />
Change in deferred tax assets/liabilities (3,593) (4,482)<br />
Other changes 7 610<br />
Cash Flow (a) 83,692 61,701<br />
Changes in current assets and liabilities:<br />
Inventories (27,317) (7,658)<br />
Trade receivables (7,071) (8,747)<br />
Tax receivables (3,390) (811)<br />
Other current assets (1,724) (1,214)<br />
Trade Payables 14,339 25,542<br />
Tax payables (1,959) 9,353<br />
Other current liabilities 13,607 11,387<br />
Change in operating working capital (b) (13,515) 27,852<br />
Cash flow from operating activities (c)=(a)+(b) 70,177 89,553<br />
Net investments in tangible and intangible assets (36,819) (15,757)<br />
(Increase) reduction of equity investments - -<br />
Other changes in fixed assets 6,151 -<br />
Reduction (increase) of other non current assets (602) (1,423)<br />
Cash Flow from (used in) investment activities (d) (31,270) (17,180)<br />
Dividends paid (61,219) (45,914)<br />
Changes in long term loans 14,687 (1,217)<br />
Capital increase - -<br />
Other changes in shareholders equity (3,998) (3,785)<br />
Changes in non-controlling interests (1,171) 866<br />
Cash Flow from (used in) financing activit ies (e) (51,701) (50,050)<br />
Cash Flow from continuing operations (f)=(c)+(d)+(e) (12,794) 22,323<br />
Cash flow from assets held for sale (g) - -<br />
Net Cash Flow (h)=(f)+(g) (12,794) 22,323<br />
Net financial position at the beginning of the period 139,300 184,008<br />
Net financial position at the end of the period 126,506 206,331<br />
Change in current net financial position (12,794) 22,323<br />
38 Financial Statements
TOD’S Group<br />
<strong>2011</strong> <strong>Half</strong> Year Financial Report<br />
06.30.<strong>2011</strong><br />
Statement of changes in equity<br />
January - June <strong>2011</strong><br />
Euro 000’s<br />
Hedging and<br />
Total<br />
Share Capital translation Retained Group Minority<br />
Capital reserves reserves earnings interests interests Total<br />
Balance as of 01.01.11 61,219 214,055 (4,263) 340,527 611,538 6,903 618,441<br />
Profit/(Loss) for the period<br />
Profit and Loss account 65,409 65,409 655 66,064<br />
Directly in Equity (2,652) (2,652) (36) (2,688)<br />
Total Comprehensive Income - - (2,652) 65,409 62,757 619 63,376<br />
Dividends (61,219) (61,219) (1,790) (63,009)<br />
Capital Increase<br />
Share based payments<br />
Other (1,346) (1,346) (1,346)<br />
Balance as of 06.30.11 61,219 214,055 (6,915) 343,371 611,730 5,732 617,462<br />
January - June 2010<br />
Euro 000’s<br />
Hedging and<br />
Total<br />
Share Capital translation Retained Group Minority<br />
Capital reserves reserves earnings interests interests Total<br />
Balance as of 01.01.10 61,219 214,055 (5,333) 384,710 654,651 5,282 6 5 9 , 9 3 3<br />
Profit/(loss) for the period<br />
Profit & Loss account 51,618 51,618 803 52,421<br />
Directly in equity 550 550 229 779<br />
Total Comprehensive Income - - 550 51,618 52,168 1,032 53,200<br />
Dividends (45,914) (45,914) (725) (46,639)<br />
Capital increase<br />
Share based payments<br />
Other ( 5 1 ) ( 5 1 ) 559 508<br />
Balance as of 06.30.10 61,219 214,055 (4,783) 390,363 6 6 0 , 8 5 4 6 , 1 4 8 6 6 7 , 0 0 2<br />
39 Financial Statements
TOD’S Group<br />
<strong>2011</strong> <strong>Half</strong> Year Financial Report<br />
06.30.<strong>2011</strong><br />
Attestation of the <strong>Half</strong>-Year condensed financial statements of TOD’S Group pursuant<br />
article 154 bis of D.LGS. 58/98 and of article 81-ter of Consob Regulation n. 11971 of<br />
May 14 th 1999 and further modifications and integrations.<br />
1. The undersigned Stefano Sincini, Chief Executive Officer of TOD’S S.p.A., and Rodolfo Ubaldi,<br />
manager responsible for the drawing up of the financial <strong>report</strong>s of TO D’S S.p.A., certify, in<br />
accordance with the provisions of Article 154 -bis, subsections 3 and 4, of Legislative Decree no.<br />
58 of February 24 th , 1998:<br />
• the adequacy in terms of the company’s characteristics and<br />
• effective application<br />
of administrative and accounting procedures for preparation of the 20 11 <strong>Half</strong> Year condensed<br />
financial statements during the period January 1 st , <strong>2011</strong> to June 30 th , <strong>2011</strong>.<br />
2. They also certify that <strong>Half</strong>-Year condensed financial statements:<br />
a) have been prepared in accordance with International Financial Reporting<br />
Standards, as endorsed by the European Union through Regulation (EC) 1606/2002 of the<br />
European Parliament and Counsel, dated 19 July 2002 ;<br />
b ) correspond with the account book and ledger entries;<br />
c) give a true and fair view of the assets, liabilities, income and financial position of<br />
the issuer and entities included in the scope of consolidation.<br />
3. Interim <strong>report</strong> provides a reliable analysis of the significant events for the first six months of<br />
the current fiscal <strong>year</strong> and the impact of such events on the <strong>Half</strong> <strong>year</strong> condensed financial<br />
statements as well as a description of the main risks and uncertainties for the second half of the<br />
<strong>year</strong> in addition to a reliable analysis of the information on the significant related party<br />
transactions<br />
Sant’Elpidio a Mare, August 5 th , <strong>2011</strong><br />
Chief Executive Officer<br />
Stefano Sincini<br />
Manager responsible for drawing<br />
up of the financial <strong>report</strong><br />
Rodolfo Ubaldi<br />
40 Attestation