MYANMAR
MYANMAR
MYANMAR

Create successful ePaper yourself
Turn your PDF publications into a flip-book with our unique Google optimized e-Paper software.
8<br />
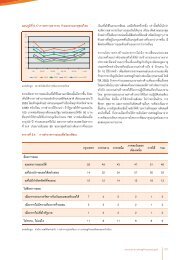
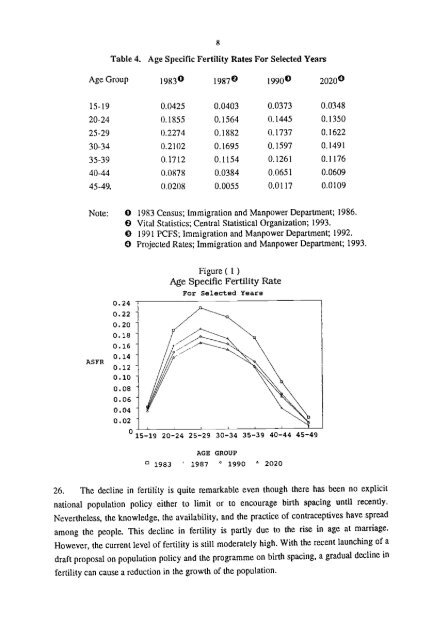
Table 4. Age Specifle Fertility Rates For Selected Years<br />
Age Group 19830 19870 1990 2020<br />
15-19 0.0425 0.0403 0.0373 0.0348<br />
20-24 0.1855 0.1564 0.1445 0.1350<br />
25-29 0.2274 0.1882 0.1737 0.1622<br />
30-34 0.2102 0.1695 0.1597 0.1491<br />
35-39 0.1712 0.1154 0.1261 0.1176<br />
40-44 0.0878 0.0384 0.065 1 0.0609<br />
45-49. 0.0208 0.0055 0.0117 0.0 109<br />
Note: 0 1983 Census; Immigration and Manpower Department; 1986.<br />
O Vital Statistics; Central Statistical Organization; 1993.<br />
o 1991 PCFS; Immigration and Manpower Department; 1992.<br />
o Projected Rates; Immigration and Manpower Department; 1993.<br />
0.24<br />
0.22<br />
0.20<br />
0.18<br />
0.16<br />
0.14<br />
ASFR 0.12<br />
0.10<br />
0.08<br />
0.06<br />
0.04<br />
0.02<br />
0<br />
Figure (1)<br />
Age Specific Fertility Rate<br />
For Selected Years<br />
15—19 20—24 25—29 30—34 35—39 40—44 45—49<br />
AGE GROUP<br />
1983 1987 ° 1990<br />
A<br />
2020<br />
26. The decline in fertility is quite remarkable even though there has been no explicit<br />
national population policy either to limit or to encourage birth spacing until recently.<br />
Nevertheless, the knowledge, the availability, and the practice of contraceptiveshave spread<br />
among the people. This decline in fertility is partly due to the rise in age at marriage.<br />
However, the current level of fertility is still moderately high. Withthe recent launching of a<br />
draft proposal on population policy and the programme on birth spacing, a gradual decline in<br />
fertility can cause a reduction in the growth of the population.