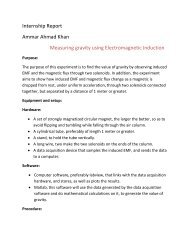
Moseley's Law and Compton Effect
Moseley's Law and Compton Effect
Moseley's Law and Compton Effect

Create successful ePaper yourself
Turn your PDF publications into a flip-book with our unique Google optimized e-Paper software.
Aleena Tasneem Khan<br />
12100127<br />
1 st April 2011
Outline<br />
• What is X-Ray Fluorescence<br />
– Characteristic X Rays<br />
– Bremsstrahlung Rays<br />
– XRF Analysis – EDXRF <strong>and</strong> WDXRF<br />
• Sample Analysis<br />
– Energy Calibration<br />
– St<strong>and</strong>ard less Analysis<br />
– St<strong>and</strong>ard Analysis<br />
• Moseley’s <strong>Law</strong><br />
– Theory<br />
– Experimental Setup<br />
– Verified Results<br />
• <strong>Compton</strong> Scattering<br />
– Theory<br />
– Experimental Setup<br />
– Verified Results<br />
– Proposed Hardware
X Ray Fluorescence<br />
• X-Ray Fluorescence: Emission of characteristic secondary X<br />
rays from a material that has been excited by bombarding<br />
with high energy X-Rays.<br />
• Characteristic X-Rays:<br />
X-Rays emitted from heavy<br />
elements when their electrons make<br />
transitions from a higher to a lower<br />
atomic energy level.<br />
• Characteristic X Rays are unique<br />
for each element as energy emitted is<br />
proportional to the binding energy of<br />
the element.
• Bremsstrahlung Radiation: The<br />
electromagnetic radiation<br />
produced due to deceleration of a<br />
charged particle (electron) when<br />
deflected by another charged<br />
particle (the atomic nucleus).<br />
• Bremsstrahlung radiations have a<br />
continuous spectrum where as<br />
intense peaks of the characteristic<br />
x rays can be seen on the<br />
spectrum.
Bremsstrahlung <strong>and</strong> Characteristic<br />
X Rays - Spectrums
XRF Analysis<br />
• XRF Analysis is of two types<br />
• Energy Dispersive XRF (EDXRF)<br />
• Uses a solid state detector <strong>and</strong> distinguishes each peak<br />
according to its energy<br />
• Wave Dispersive XRF (WDXRF)<br />
• Uses the scanning crystal as the dispersive element <strong>and</strong><br />
distinguishes each peak according to its wavelength<br />
• We have used the EDXRF spectrometer.
EDXRF Spectrometer<br />
Working Principle
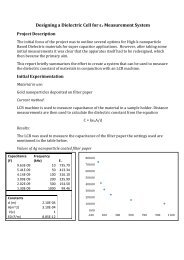
Sample Analysis<br />
• Obtaining A Spectrum<br />
• Calibration of Curve for Energy<br />
• XRF-FP Corrections<br />
• Sample Analysis<br />
• Calibration using St<strong>and</strong>ards – Intensities obtained<br />
• Calculation of Calibration Coefficients – Concentrations<br />
Obtained
Obtaining A Spectrum<br />
• We use ADMCA along with<br />
the PX4 MCA to obtain the<br />
spectrum for the sample<br />
• To Calibrate: We identify at<br />
least two peaks in the spectrum<br />
<strong>and</strong> enter the characteristic<br />
energy value for each peak.<br />
Using the “Calibrate” function of<br />
ADMCA we calibrate the spectrum in<br />
terms of energy<br />
• This Energy calibration is saved in the MCA <strong>and</strong> loaded<br />
automatically each time a new spectrum needs to be obtained.
XRF-FP Analysis<br />
• The XRF-FP software loads the spectrum obtained by<br />
ADMCA <strong>and</strong> using the initial parameters etc, corrects<br />
the spectrum.<br />
• Three steps for correction:<br />
• Corrections for escape peaks, sum peaks, background<br />
continuum, background peaks etc.<br />
• Deconvolution<br />
• Accounting for attenuation <strong>and</strong> matrix effects<br />
• Using the corrected spectrum, it then calculates the<br />
relative intensities <strong>and</strong> concentrations of each element<br />
in the sample.
XRF-FP Analysis<br />
• The following tables show the intensities <strong>and</strong><br />
concentrations of various elements in a Steel Sample.<br />
Element<br />
Concentration<br />
(wt (%))<br />
Cr 19.055 18.45<br />
Mn 1.281 1.63<br />
Fe 65.939 65.19<br />
Ni 8.67 12.18<br />
Cu 0.294 0.169<br />
Mo 2.902 2.38<br />
Proposed<br />
Concentration<br />
(wt(%))
Moseley’s <strong>Law</strong><br />
• <strong>Moseley's</strong> law is an empirical law concerning the<br />
characteristic x-rays that are emitted by atoms.<br />
• Moseley was able to show that the frequencies of<br />
characteristic X-rays emitted from chemical elements are<br />
proportional to the square of the element's atomic number<br />
• A finding which supported Bohr's model of the atom in<br />
which the atomic number is the same as the number of<br />
positive charges in the nucleus of the atom.
Verification of Results<br />
• Two different samples used for the verification of<br />
Moseley’s <strong>Law</strong>:<br />
• Steel<br />
• Silicon-Brass<br />
• A spectrum of the characteristic X Rays was obtained<br />
for each sample <strong>and</strong> calibrated. Using these energies,<br />
a graph between square root of energy <strong>and</strong> atomic<br />
number of the element was plotted.<br />
• The slope of the resulting graph gave the Rydberg<br />
Constant.
Silicon – Brass<br />
Element<br />
Atomic<br />
Number<br />
Chromium 24 5.41<br />
Energy<br />
(keV)<br />
Manganese 25 5.90<br />
Iron 26 6.40<br />
Cobalt 27 6.93<br />
Nickel 28 7.48<br />
Copper 29 8.05<br />
Zinc 30 8.64<br />
Antimony 51 26.36<br />
Lead 82 74.95<br />
Bismuth 83 77.1
Silicon - Brass
Steel<br />
Element<br />
Atomic<br />
Number<br />
Energy (keV)<br />
Cr 24 5.41<br />
Mn 25 5.90<br />
Fe 26 6.40<br />
Ni 28 7.48<br />
Cu 29 8.05<br />
Mo 42 17.48
Steel Sample
<strong>Compton</strong> Scattering<br />
• <strong>Compton</strong> scattering is the interaction of a high energy<br />
photon with an electron, <strong>and</strong> the resulting “scattered”<br />
photon which has a reduced frequency, <strong>and</strong> therefore<br />
reduced energy introducing a shift in its wavelength.<br />
m
Experimental Setup
Experimental Setup<br />
• Scattering of X Rays was observed by varying the angle<br />
at which the detector was placed. The distance<br />
between x-ray tube <strong>and</strong> the detector was kept larger<br />
than 25cm for the detector’s safety.<br />
An appreciable shift in wavelengths<br />
was seen when the angle was<br />
changed.
Results
Results
Analysis<br />
• A graph between shift in wavelength (delta lambda)<br />
<strong>and</strong> cosine of angle was plotted.
Proposed Assembly