Thermal conductivity of amorphous carbon as a ... - thermophysics.ru
Thermal conductivity of amorphous carbon as a ... - thermophysics.ru
Thermal conductivity of amorphous carbon as a ... - thermophysics.ru
You also want an ePaper? Increase the reach of your titles
YUMPU automatically turns print PDFs into web optimized ePapers that Google loves.
5<br />
Raman intensity (a.u.)<br />
4<br />
3<br />
2<br />
800°C<br />
2000°C<br />
1<br />
0<br />
600 1200 1800<br />
wave number (cm -1 )<br />
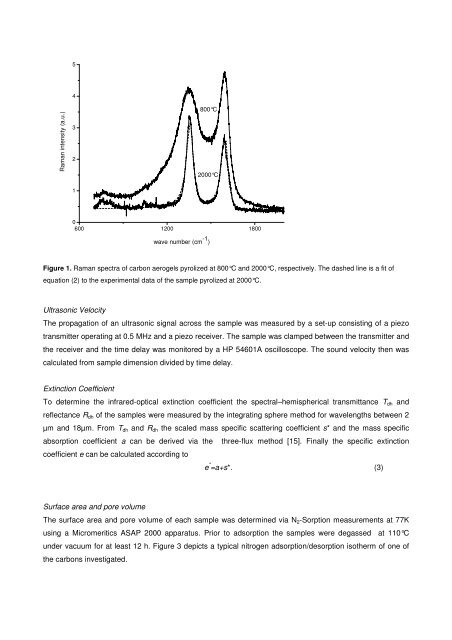
Figure 1. Raman spectra <strong>of</strong> <strong>carbon</strong> aerogels pyrolized at 800°C and 2000°C, respectively. The d<strong>as</strong>hed line is a fit <strong>of</strong><br />
equation (2) to the experimental data <strong>of</strong> the sample pyrolized at 2000°C.<br />
Ultr<strong>as</strong>onic Velocity<br />
The propagation <strong>of</strong> an ultr<strong>as</strong>onic signal across the sample w<strong>as</strong> me<strong>as</strong>ured by a set-up consisting <strong>of</strong> a piezo<br />
transmitter operating at 0.5 MHz and a piezo receiver. The sample w<strong>as</strong> clamped between the transmitter and<br />
the receiver and the time delay w<strong>as</strong> monitored by a HP 54601A oscilloscope. The sound velocity then w<strong>as</strong><br />
calculated from sample dimension divided by time delay.<br />
Extinction Coefficient<br />
To determine the infrared-optical extinction coefficient the spectral–hemispherical transmittance T dh and<br />
reflectance R dh <strong>of</strong> the samples were me<strong>as</strong>ured by the integrating sphere method for wavelengths between 2<br />
µm and 18µm. From T dh and R dh the scaled m<strong>as</strong>s specific scattering coefficient s* and the m<strong>as</strong>s specific<br />
absorption coefficient a can be derived via the three-flux method [15]. Finally the specific extinction<br />
coefficient e can be calculated according to<br />
e * =a+s*. (3)<br />
Surface area and pore volume<br />
The surface area and pore volume <strong>of</strong> each sample w<strong>as</strong> determined via N 2 -Sorption me<strong>as</strong>urements at 77K<br />
using a Micromeritics ASAP 2000 apparatus. Prior to adsorption the samples were deg<strong>as</strong>sed at 110°C<br />
under vacuum for at le<strong>as</strong>t 12 h. Figure 3 depicts a typical nitrogen adsorption/desorption isotherm <strong>of</strong> one <strong>of</strong><br />
the <strong>carbon</strong>s investigated.


