Thermal conductivity of amorphous carbon as a ... - thermophysics.ru
Thermal conductivity of amorphous carbon as a ... - thermophysics.ru
Thermal conductivity of amorphous carbon as a ... - thermophysics.ru

Create successful ePaper yourself
Turn your PDF publications into a flip-book with our unique Google optimized e-Paper software.
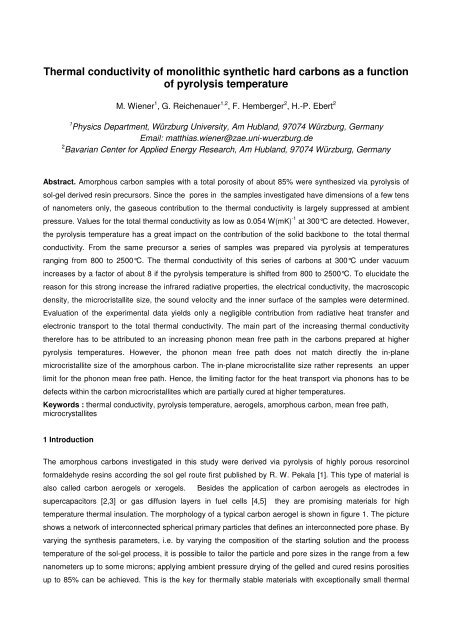
<strong>Thermal</strong> <strong>conductivity</strong> <strong>of</strong> monolithic synthetic hard <strong>carbon</strong>s <strong>as</strong> a function<br />
<strong>of</strong> pyrolysis temperature<br />
M. Wiener 1 , G. Reichenauer 1,2 , F. Hemberger 2 , H.-P. Ebert 2<br />
1 Physics Department, Würzburg University, Am Hubland, 97074 Würzburg, Germany<br />
Email: matthi<strong>as</strong>.wiener@zae.uni-wuerzburg.de<br />
2 Bavarian Center for Applied Energy Research, Am Hubland, 97074 Würzburg, Germany<br />
Abstract. Amorphous <strong>carbon</strong> samples with a total porosity <strong>of</strong> about 85% were synthesized via pyrolysis <strong>of</strong><br />
sol-gel derived resin precursors. Since the pores in the samples investigated have dimensions <strong>of</strong> a few tens<br />
<strong>of</strong> nanometers only, the g<strong>as</strong>eous contribution to the thermal <strong>conductivity</strong> is largely suppressed at ambient<br />
pressure. Values for the total thermal <strong>conductivity</strong> <strong>as</strong> low <strong>as</strong> 0.054 W(mK) -1 at 300°C are detected. However,<br />
the pyrolysis temperature h<strong>as</strong> a great impact on the contribution <strong>of</strong> the solid backbone to the total thermal<br />
<strong>conductivity</strong>. From the same precursor a series <strong>of</strong> samples w<strong>as</strong> prepared via pyrolysis at temperatures<br />
ranging from 800 to 2500°C. The thermal <strong>conductivity</strong> <strong>of</strong> this series <strong>of</strong> <strong>carbon</strong>s at 300°C under vacuum<br />
incre<strong>as</strong>es by a factor <strong>of</strong> about 8 if the pyrolysis temperature is shifted from 800 to 2500°C. To elucidate the<br />
re<strong>as</strong>on for this strong incre<strong>as</strong>e the infrared radiative properties, the electrical <strong>conductivity</strong>, the macroscopic<br />
density, the microcristallite size, the sound velocity and the inner surface <strong>of</strong> the samples were determined.<br />
Evaluation <strong>of</strong> the experimental data yields only a negligible contribution from radiative heat transfer and<br />
electronic transport to the total thermal <strong>conductivity</strong>. The main part <strong>of</strong> the incre<strong>as</strong>ing thermal <strong>conductivity</strong><br />
therefore h<strong>as</strong> to be attributed to an incre<strong>as</strong>ing phonon mean free path in the <strong>carbon</strong>s prepared at higher<br />
pyrolysis temperatures. However, the phonon mean free path does not match directly the in-plane<br />
microcristallite size <strong>of</strong> the <strong>amorphous</strong> <strong>carbon</strong>. The in-plane microcristallite size rather represents an upper<br />
limit for the phonon mean free path. Hence, the limiting factor for the heat transport via phonons h<strong>as</strong> to be<br />
defects within the <strong>carbon</strong> microcristallites which are partially cured at higher temperatures.<br />
Keywords : thermal <strong>conductivity</strong>, pyrolysis temperature, aerogels, <strong>amorphous</strong> <strong>carbon</strong>, mean free path,<br />
microcrystallites<br />
1 Introduction<br />
The <strong>amorphous</strong> <strong>carbon</strong>s investigated in this study were derived via pyrolysis <strong>of</strong> highly porous resorcinol<br />
formaldehyde resins according the sol gel route first published by R. W. Pekala [1]. This type <strong>of</strong> material is<br />
also called <strong>carbon</strong> aerogels or xerogels. Besides the application <strong>of</strong> <strong>carbon</strong> aerogels <strong>as</strong> electrodes in<br />
supercapacitors [2,3] or g<strong>as</strong> diffusion layers in fuel cells [4,5] they are promising materials for high<br />
temperature thermal insulation. The morphology <strong>of</strong> a typical <strong>carbon</strong> aerogel is shown in figure 1. The picture<br />
shows a network <strong>of</strong> interconnected spherical primary particles that defines an interconnected pore ph<strong>as</strong>e. By<br />
varying the synthesis parameters, i.e. by varying the composition <strong>of</strong> the starting solution and the process<br />
temperature <strong>of</strong> the sol-gel process, it is possible to tailor the particle and pore sizes in the range from a few<br />
nanometers up to some microns; applying ambient pressure drying <strong>of</strong> the gelled and cured resins porosities<br />
up to 85% can be achieved. This is the key for thermally stable materials with exceptionally small thermal
conductivities. However, the thermal <strong>conductivity</strong> <strong>of</strong> this type <strong>of</strong> <strong>amorphous</strong> <strong>carbon</strong> depends significantly on<br />
the pyrolysis temperature applied. In the p<strong>as</strong>t, other authors have studied the effects <strong>of</strong> high temperature<br />
treatment on the properties <strong>of</strong> hard <strong>carbon</strong>s. Hanzawa et al. and Soukup et al. [6,7] have investigated in<br />
detail the changes <strong>of</strong> microcristallite properties in <strong>carbon</strong> aerogels and gl<strong>as</strong>sy <strong>carbon</strong>, respectively. Lu et al.<br />
and Nilsson et al. [8,9] analyzed the thermal <strong>conductivity</strong> <strong>of</strong> <strong>carbon</strong> aerogels <strong>as</strong> a function <strong>of</strong> temperature,<br />
sample density and electrical <strong>conductivity</strong>, respectively. Bock et al. [10] investigated the thermal <strong>conductivity</strong><br />
<strong>of</strong> <strong>carbon</strong> aerogels <strong>as</strong> a function <strong>of</strong> sample density and temperature <strong>as</strong> well <strong>as</strong> the in-plane microcristallite<br />
size and phonon mean free path <strong>as</strong> a function <strong>of</strong> the sample density.<br />
In this work we systematically analyze the changes <strong>of</strong> material properties, like the electrical <strong>conductivity</strong>, the<br />
sample density, the microcristallite size, the sound velocity and the inner surface <strong>as</strong> a function <strong>of</strong> the<br />
pyrolysis temperature and their impact on the total thermal <strong>conductivity</strong>.<br />
Figure 1. SEM micrograph showing the typical morphology <strong>of</strong> a monolithic <strong>carbon</strong> aerogel with particle sizes around<br />
1µm and pore sizes in the 5µm range.<br />
2 Experimental<br />
2.1 Sample preparation<br />
The series <strong>of</strong> <strong>amorphous</strong> <strong>carbon</strong> investigated in this work w<strong>as</strong> derived via pyrolysis <strong>of</strong> the same organic<br />
precursor at different temperatures. The synthesis <strong>of</strong> <strong>carbon</strong> aerogels is described in detail elsewhere [11].<br />
Briefly, the precursors were synthesized by adding sodium <strong>carbon</strong>ate <strong>as</strong> a b<strong>as</strong>e catalyst to an aqueous<br />
solution <strong>of</strong> resorcinol and formaldehyde. The molar ratio <strong>of</strong> formaldehyde to resorcinol is 2:1 and the m<strong>as</strong>s<br />
ratio <strong>of</strong> resorcinol and formaldehyde in the solution w<strong>as</strong> chosen to yield a final density <strong>of</strong> about 300 kg/m 3 .<br />
First the solution w<strong>as</strong> filled in a vessel and sealed airtight; then it w<strong>as</strong> exposed to 85°C for 24h for gelling and<br />
curing. Afterwards the pore liquid within the wet gel (essentially water) w<strong>as</strong> replaced by ethanol (a liquid with<br />
lower surface tension) and the gel w<strong>as</strong> dried at ambient conditions. The resulting organic aerogel w<strong>as</strong> then<br />
cut into eight small cylinders <strong>of</strong> the same size (diameter = 21mm; height = 6mm). Each piece w<strong>as</strong> finally
pyrolized in an inert atmosphere at 800°C for the lowest and 2500°C for the highest final temperature,<br />
respectively (s. Table 1). A temperature ramp <strong>of</strong> 5°C/min w<strong>as</strong> used; no dwell time w<strong>as</strong> applied at the target<br />
temperature.<br />
2.2 Sample Characterisation<br />
Density<br />
The density <strong>of</strong> each sample w<strong>as</strong> calculated from its dimensions and weight me<strong>as</strong>ured after heat treatment.<br />
Electrical Conductivity<br />
The electrical <strong>conductivity</strong> w<strong>as</strong> me<strong>as</strong>ured with a four wire setup in order to avoid contact resistance effects<br />
[3]. The current and voltage were me<strong>as</strong>ured with a HP 3457A multimeter. The voltage w<strong>as</strong> tapped by two<br />
sharp stainless steel pins mounted onto a movable me<strong>as</strong>uring head. For each sample three me<strong>as</strong>urements<br />
were performed at different locations <strong>of</strong> the sample and the values were averaged to derive a mean value for<br />
the electrical <strong>conductivity</strong>.<br />
Microcrystallite size<br />
For the quantification <strong>of</strong> disordered graphitic st<strong>ru</strong>ctures and in particular for the characzterization <strong>of</strong><br />
microcrystallite sizes in <strong>carbon</strong> materials Raman spectroscopy is a convenient method. The spectra were<br />
me<strong>as</strong>ured using the 488 nm line <strong>of</strong> an argon ion l<strong>as</strong>er and the power <strong>of</strong> excitation w<strong>as</strong> adjusted to about 70<br />
µW in order to prevent the sample surface from degradation or heating during me<strong>as</strong>urement. In the<br />
experiment a range in wave numbers from 700 cm -1 to 2000 cm -1 w<strong>as</strong> covered. A typical Raman plot is<br />
shown in figure 2. There are two dominant bands in the spect<strong>ru</strong>m, one at around 1360 cm -1 <strong>as</strong>sociated with<br />
(2)<br />
edge planes <strong>of</strong> microcrystallites and the Raman-active E 2g mode at 1582 cm -1 [12]. According to the<br />
empirical formula <strong>of</strong> Knight and White [13] it is possible to extract the in-plane micro crystallite size L a via the<br />
following relationship<br />
L a (Å) = 44 (I 1582 /I 1360 ), (1)<br />
where I 1360 and I 1582 are the integrated intensities <strong>of</strong> the respective peaks. To determine the integrated<br />
intensities the two bands were fitted to a Breit-Wigner-Fano lineshape [14]:<br />
I [1 + 2( υ −υ<br />
)/ qΓ]<br />
2<br />
0<br />
0<br />
I ( υ)<br />
=<br />
, (2)<br />
2<br />
1+<br />
[2( υ −υ<br />
0<br />
)/ Γ]<br />
where I(υ) is the intensity, υ 0 is the wave number at the peak, I 0 is the intensity at the peak position, Γ is the<br />
peak width at half-height and 1/q is a parameter accounting for the interactions between the discrete E 2g<br />
(2)<br />
mode and a Raman-active continuum (1/q=0 for Lorenzian lineshape) [14].
5<br />
Raman intensity (a.u.)<br />
4<br />
3<br />
2<br />
800°C<br />
2000°C<br />
1<br />
0<br />
600 1200 1800<br />
wave number (cm -1 )<br />
Figure 1. Raman spectra <strong>of</strong> <strong>carbon</strong> aerogels pyrolized at 800°C and 2000°C, respectively. The d<strong>as</strong>hed line is a fit <strong>of</strong><br />
equation (2) to the experimental data <strong>of</strong> the sample pyrolized at 2000°C.<br />
Ultr<strong>as</strong>onic Velocity<br />
The propagation <strong>of</strong> an ultr<strong>as</strong>onic signal across the sample w<strong>as</strong> me<strong>as</strong>ured by a set-up consisting <strong>of</strong> a piezo<br />
transmitter operating at 0.5 MHz and a piezo receiver. The sample w<strong>as</strong> clamped between the transmitter and<br />
the receiver and the time delay w<strong>as</strong> monitored by a HP 54601A oscilloscope. The sound velocity then w<strong>as</strong><br />
calculated from sample dimension divided by time delay.<br />
Extinction Coefficient<br />
To determine the infrared-optical extinction coefficient the spectral–hemispherical transmittance T dh and<br />
reflectance R dh <strong>of</strong> the samples were me<strong>as</strong>ured by the integrating sphere method for wavelengths between 2<br />
µm and 18µm. From T dh and R dh the scaled m<strong>as</strong>s specific scattering coefficient s* and the m<strong>as</strong>s specific<br />
absorption coefficient a can be derived via the three-flux method [15]. Finally the specific extinction<br />
coefficient e can be calculated according to<br />
e * =a+s*. (3)<br />
Surface area and pore volume<br />
The surface area and pore volume <strong>of</strong> each sample w<strong>as</strong> determined via N 2 -Sorption me<strong>as</strong>urements at 77K<br />
using a Micromeritics ASAP 2000 apparatus. Prior to adsorption the samples were deg<strong>as</strong>sed at 110°C<br />
under vacuum for at le<strong>as</strong>t 12 h. Figure 3 depicts a typical nitrogen adsorption/desorption isotherm <strong>of</strong> one <strong>of</strong><br />
the <strong>carbon</strong>s investigated.
400<br />
volume adsorbed (cm 3 /g)STP<br />
350<br />
300<br />
250<br />
200<br />
150<br />
100<br />
0,0 0,2 0,4 0,6 0,8 1,0<br />
relative pressure p/p 0<br />
Figure 3. Nitrogen sorption isotherm <strong>of</strong> the <strong>carbon</strong> sample pyrolized at 1000°C.<br />
By applying different evaluation methods it is possible to distinguish between “inner” surface <strong>of</strong> the sample<br />
due to micropores (< 2nm) and the “external” surface due to meso- or macropores (> 2nm), respectively.<br />
From the isotherm the total specific surface S BET <strong>of</strong> the sample w<strong>as</strong> calculated by applying the BET- method<br />
[16] in the relative pressures range between 0.1 and 0.26. In addition, the external surface S ext (due to mesoor<br />
macropores) w<strong>as</strong> determined from the slope <strong>of</strong> the linear region <strong>of</strong> the t-plot. The micropore surface S µ<br />
w<strong>as</strong> then calculated using S µ = S BET - S ext .<br />
<strong>Thermal</strong> Conductivity<br />
The thermal properties <strong>of</strong> the series <strong>of</strong> samples were determined by the l<strong>as</strong>er fl<strong>as</strong>h method. The<br />
me<strong>as</strong>urements were performed under vacuum at 300°C in order to exclude contributions due to g<strong>as</strong>eous<br />
<strong>conductivity</strong> and adsorbed molecules at the inner surface <strong>of</strong> the porous samples. The front side <strong>of</strong> the<br />
sample w<strong>as</strong> thermally excited by a l<strong>as</strong>er fl<strong>as</strong>h pulse (NdYaG-l<strong>as</strong>er, 1064nm). The back side temperature w<strong>as</strong><br />
monitored by a MCT infrared detector <strong>as</strong> a function <strong>of</strong> time. The <strong>as</strong>sembly <strong>of</strong> the l<strong>as</strong>er fl<strong>as</strong>h apparatus used,<br />
is described in detail elsewhere [17]. From the time dependence <strong>of</strong> the signal the thermal diffusivity a is<br />
determined [18]. With known specific heat capacity c p, the thermal <strong>conductivity</strong> λ <strong>of</strong> the material can be<br />
calculated from<br />
λ(T,T P ) = a(T,T P ) ⋅ ρ(T P ) ⋅ c p (T). (4)<br />
Here T is the temperature at which the thermal me<strong>as</strong>urement is performed and T P is the temperature applied<br />
to the samples upon pyrolysis. The values for the specific heat c p below 200°C were determined under argon<br />
by temperature modulated differential scanning calorimetry (MDSC) (figure 4); above 200°C literature values<br />
were used [19]. It can be seen that the two curves coincide in the range around 200°C.
2,0<br />
specific heat capacity(J/(gK))<br />
1,5<br />
1,0<br />
0 200 400 600 800 1000 1200 1400 1600<br />
Temperature (°C)<br />
Figure 4. Specific heat capacity c p <strong>as</strong> a function <strong>of</strong> temperature. () represent experimental values determined by<br />
dynamic difference calorimetry, () are data taken from literature [19 ].The line represents a polynomial fit to the data.<br />
3 Theoretical background<br />
Generally, the heat transport through a porous solid consists <strong>of</strong> a radiative, a g<strong>as</strong>eous<br />
contribution. The radiative thermal <strong>conductivity</strong> λ rad can be calculated according to<br />
16⋅σ<br />
⋅ n<br />
3⋅<br />
ρ ⋅ e<br />
2<br />
3<br />
λ<br />
rad<br />
= ⋅T<br />
. (5)<br />
and a solid<br />
Hereby σ is the Stefan-Boltzmann constant, n ≈ 2 is the refractive index for <strong>carbon</strong>, T is the temperature, ρ is<br />
the sample density and e is the m<strong>as</strong>s specific extinction coefficient (see equation (3)).<br />
The solid thermal <strong>conductivity</strong> can be expressed in a first order approximation by the sum <strong>of</strong> electronic<br />
contribution λ el and phononic contribution λ ph , respectively. The electronic thermal <strong>conductivity</strong> for metals and<br />
semimetals can be described by the Wiedemann-Franz law [20]<br />
el<br />
= σ ⋅ L⋅T<br />
λ , (6)<br />
where σ is the electrical <strong>conductivity</strong> and L is the Lorentz number.<br />
The phononic contribution to the thermal <strong>conductivity</strong> in the solid ph<strong>as</strong>e is given by [22]<br />
λ<br />
ph<br />
1<br />
= ⋅ ρ ⋅ c<br />
3<br />
where c v ≈ c p , v ph is an average phonon velocity and l is the mean free path <strong>of</strong> the phonons.<br />
v<br />
⋅ v<br />
ph<br />
⋅ l<br />
(7)
4 Results<br />
Density<br />
The density <strong>of</strong> the series <strong>of</strong> <strong>carbon</strong>s w<strong>as</strong> determined <strong>as</strong> a function <strong>of</strong> pyrolysis temperature (figure 5). The<br />
experimental results for the different samples vary between 301 kg/m 3 and 323 kg/m 3 . However, within the<br />
given uncertainty <strong>of</strong> 4% the density can be <strong>as</strong>sumed to be independent <strong>of</strong> the pyrolysis temperature and is<br />
therefore set to (312±12) kg⋅m -3 in the further course <strong>of</strong> this paper.<br />
300<br />
250<br />
density (kg/m 3 )<br />
200<br />
150<br />
100<br />
50<br />
0<br />
600 800 1000 1200 1400 1600 1800 2000 2200 2400 2600<br />
pyrolysis temperature (°C)<br />
Figure 5. Sample densities <strong>as</strong> a function <strong>of</strong> temperature treatment. The d<strong>as</strong>hed line corresponds to the mean value <strong>of</strong> all<br />
samples.<br />
Electrical <strong>conductivity</strong><br />
The electrical conductivities <strong>of</strong> the <strong>carbon</strong>s <strong>as</strong> a function <strong>of</strong> pyrolysis temperature are shown in figure 6. For<br />
samples pyrolized up to 1250°C the electrical <strong>conductivity</strong> rises significantly from 3 S·cm -1 at 1000°C to about<br />
6.5 S·cm -1 , beyond 1250°C the electrical <strong>conductivity</strong> incre<strong>as</strong>es moderately to about 9 S·cm -1 . These values<br />
correspond to the electrical conductivities reported by Lu et al. for supercritically dried <strong>carbon</strong> aerogels with<br />
comparable densities [8]. Soukup et al. [7] also observed a tendency to saturation in electrical <strong>conductivity</strong><br />
for heat treatment temperatures above 1800°C when investigating gl<strong>as</strong>sy <strong>carbon</strong>s, the dense version <strong>of</strong><br />
<strong>carbon</strong> aerogels (figure 6).
electrical <strong>conductivity</strong> (S/cm)<br />
10<br />
8<br />
6<br />
4<br />
2<br />
20<br />
0<br />
0<br />
800 1000 1200 1400 1600 1800 2000 2200 2400 2600 2800 3000 3200<br />
pyrolysis temperature (°C)<br />
240<br />
220<br />
200<br />
180<br />
160<br />
140<br />
120<br />
100<br />
80<br />
60<br />
40<br />
electrical <strong>conductivity</strong> (S/cm)<br />
Figure 6. Electrical <strong>conductivity</strong> <strong>of</strong> <strong>carbon</strong> aerogels <strong>as</strong> a function <strong>of</strong> pyrolysis temperature (□). The d<strong>as</strong>hed line is a guide<br />
to the eye. For comparison values determined by [7] for gl<strong>as</strong>sy <strong>carbon</strong> are plotted (). Due to the higher density <strong>of</strong> the<br />
gl<strong>as</strong>sy <strong>carbon</strong> (a factor <strong>of</strong> about 5 compared to the aerogel) the electrical <strong>conductivity</strong> is significantly incre<strong>as</strong>ed (note the<br />
corresponding second axis on the right).<br />
Microcrystallite size<br />
Primary particles building the skeleton <strong>of</strong> hard <strong>carbon</strong>s consist <strong>of</strong> a disordered system <strong>of</strong> graphene<br />
microcrystallites (house <strong>of</strong> cards model) [14]. The in-plane microcrystallite sizes L a <strong>as</strong> determined via<br />
equation (1) from Raman data are given in figure 7. The average in-plane microcrystallite dimension L a<br />
expands from 28Å for a <strong>carbon</strong> sample pyrolyzed at 800°C to 47Å for a sample pyrolyzed at 2500°C.<br />
50<br />
microcristallite size L a<br />
(Angström)<br />
40<br />
30<br />
20<br />
10<br />
0<br />
600 800 1000 1200 1400 1600 1800 2000 2200 2400 2600<br />
pyrolysis temperature (°C)<br />
Figure 7. In-plane microcrystallite size L a <strong>of</strong> <strong>amorphous</strong> <strong>carbon</strong> samples <strong>as</strong> a function <strong>of</strong> pyrolysis<br />
temperature calculated from Raman data. The full line is a guide to the eye.
Ultr<strong>as</strong>onic velocity<br />
Morphological or st<strong>ru</strong>ctural changes caused by the temperature treatment affect the el<strong>as</strong>tic properties and<br />
hence the sound velocity. In figure 8 the sound velocities <strong>of</strong> the samples pyrolized at temperatures between<br />
800°C and 2500°C are shown.<br />
ultr<strong>as</strong>onic velocity (m*s -1 )<br />
800<br />
780<br />
760<br />
740<br />
720<br />
700<br />
680<br />
660<br />
640<br />
620<br />
600<br />
580<br />
560<br />
540<br />
520<br />
500<br />
600 800 1000 1200 1400 1600 1800 2000 2200 2400 2600<br />
pyrolysis temperature (°C)<br />
Figure 8. Ultr<strong>as</strong>onic velocity <strong>as</strong> a function <strong>of</strong> treatment temperature. Note that the zero is strongly suppressed. The full<br />
line is a guide to the eye.<br />
The sound propagation velocity <strong>of</strong> the sample pyrolized at 800°C is about 600 m·s -1 . For the sample treated<br />
at 1000°C the sound velocity rises to 700m/s and approaches about 720 m·s -1 for treatment temperatures <strong>of</strong><br />
1250°C and above.<br />
IR-optical extinction coefficient<br />
The me<strong>as</strong>urements were performed with a Fourier transform infrared spectrometer combined with an<br />
external integrating sphere. The results for the scaled spectral scattering coefficient s* and absorption<br />
coefficient a are shown in figure 9a for the two samples pyrolized at 800°C and 2500°C. Using a suitable<br />
averaging procedure (“Rosseland” average) the m<strong>as</strong>s specific extinction coefficient can be derived (figure<br />
9b).<br />
Surface area and pore size<br />
When incre<strong>as</strong>ing the pyrolysis temperature from 800°C to 1000°C nitrogen sorption yields an incre<strong>as</strong>e in<br />
total surface S BET from about 530 m 2·g -1 to 570 m 2·g -1 . Higher pyrolysis temperatures result in a decre<strong>as</strong>e in<br />
-1<br />
S BET down to about 150 m<br />
2·g .<br />
The micropore surface area S µ shows the same trend indicating that the<br />
BET surface area is dominated by adsorption in micropores. In contr<strong>as</strong>t, the external surface S ext is almost<br />
unaffected by the treatment in the temperature range from 800°C to 2500°C (see figure 10).
absorption and scattering coefficient a, s * (m 2 /kg)<br />
350<br />
300<br />
250<br />
200<br />
150<br />
100<br />
50<br />
0<br />
0 2 4 6 8 10 12 14 16<br />
wavelength Λ (µm)<br />
a<br />
s *<br />
specific extinction (m 2 kg -1 )<br />
240<br />
220<br />
200<br />
180<br />
160<br />
140<br />
120<br />
100<br />
80<br />
60<br />
40<br />
20<br />
<strong>carbon</strong> pyrolyzed at 2500°C<br />
<strong>carbon</strong> pyrolyzed at 800°C<br />
0<br />
0 500 1000 1500 2000 2500 3000<br />
temperature (K)<br />
(a)<br />
(b)<br />
Figure 9. (a) Scaled specific scattering coefficient s * and specific absorption coefficient a vs. wavelength Λ for samples<br />
pyrolized at 800°C ( ___ ) and 2500°C (-----), respectively. (b) M<strong>as</strong>s specific extinction coefficient for the two samples; the<br />
data were derived via Rosseland averaging <strong>of</strong> the spectral data.<br />
<strong>Thermal</strong> <strong>conductivity</strong><br />
Figure 11 depicts the values <strong>of</strong> thermal <strong>conductivity</strong> at 300°C calculated via equation (4) from the l<strong>as</strong>er fl<strong>as</strong>h<br />
results. The thermal <strong>conductivity</strong> for the sample pyrolyzed at 800°C is 0.05 W(m K) -1 at 300°C; the<br />
<strong>conductivity</strong> incre<strong>as</strong>es continuously with the treatment temperature to 0.42 W(mK) -1 for the sample<br />
pyrolyzed at 2500°C. Figure 12 shows the thermal <strong>conductivity</strong> λ <strong>of</strong> a <strong>carbon</strong> sample pyrolized at 2000°C <strong>as</strong><br />
a function <strong>of</strong> temperature. The experimental data were fitted with a linear superposition <strong>of</strong> a phonon,<br />
electronic and radiative heat transfer ( λ<br />
total<br />
3<br />
= λ + λ + λ = α ⋅ ( T ) + β ⋅T<br />
+ γ ⋅T<br />
); the temperature<br />
ph<br />
rad<br />
dependence <strong>of</strong> the respective components is given by Eqs. (5) through (7). Figure 12 clearly exhibits that the<br />
thermal transport below 1000°C is dominated by the <strong>conductivity</strong> <strong>of</strong> the solid ph<strong>as</strong>e. The electronic<br />
contribution is found to be negligible in the range investigated.<br />
The fit parameters α and β are found to be 0.19 g (m·s) -1 and 1.8·10 -11 W (m·K 4 ) -1 , respectively. Using<br />
equation (7) α yields a mean free path <strong>of</strong> 25 Å . The extinction coefficient determined from parameter β via<br />
equation (5) is 230 m 2·kg -1 ; this value is about a factor <strong>of</strong> 1.6 higher than the one determined via IRspectroscopy<br />
(figure 9); this relatively large discrepancy, however, is not indicating a systematic deviation<br />
since the experimental temperature range (figure 12) is just too small to allow for a high enough accuracy in<br />
the extraction <strong>of</strong> the radiative contribution.<br />
el<br />
C P
600<br />
500<br />
specific surface (m 2 g -1 )<br />
400<br />
300<br />
200<br />
100<br />
0<br />
600 800 1000 1200 1400 1600 1800 2000 2200 2400 2600<br />
pyrolysis temperature (°C)<br />
Figure 10. Specific surface area <strong>as</strong> a function <strong>of</strong> pyrolysis temperature <strong>as</strong> derived from nitrogen sorption me<strong>as</strong>urements:<br />
S BET( ), S µ ( ), S ext ( ).<br />
thermal <strong>conductivity</strong> (W(mK) -1 )<br />
0,50<br />
0,45<br />
0,40<br />
0,35<br />
0,30<br />
0,25<br />
0,20<br />
0,15<br />
0,10<br />
0,05<br />
0,00<br />
600 800 1000 1200 1400 1600 1800 2000 2200 2400 2600<br />
pyrolysis temperature (°C)<br />
Figure 11. The full line shows the thermal <strong>conductivity</strong> <strong>of</strong> <strong>carbon</strong> aerogels me<strong>as</strong>ured at 300°C under vacuum and<br />
pyrolized at temperatures between 800°C and 2500°C. The data were calculated from the thermal diffusivities derived<br />
via l<strong>as</strong>er fl<strong>as</strong>h me<strong>as</strong>urements. The d<strong>as</strong>hed line corresponds to the electrical contribution to the thermal <strong>conductivity</strong><br />
calculated via equation (6). The radiative contribution determined via equation (5) is too small to be visible in this<br />
representation.
thermal <strong>conductivity</strong> (W (m K) -1 )<br />
0,60<br />
0,55<br />
0,50<br />
0,45<br />
0,40<br />
0,35<br />
λ ph<br />
0,30<br />
0,25<br />
0,20<br />
0,15<br />
λ<br />
0,10<br />
rad<br />
0,05<br />
λ el<br />
0,00<br />
200 400 600 800 1000 1200 1400 1600<br />
temperature (°C)<br />
Figure 12. <strong>Thermal</strong> <strong>conductivity</strong> <strong>as</strong> a function <strong>of</strong> temperature for the <strong>carbon</strong> sample pyrolized at 2000°C. The full line is<br />
a fit <strong>of</strong><br />
λ λ + λ + λ<br />
total<br />
= to the experimental data (see also equation (5) through (7)).The d<strong>as</strong>hed line represents<br />
ph<br />
rad<br />
el<br />
the solid <strong>conductivity</strong>. The dotted line indicates the contribution due to radiative heat transfer. The electronic contribution<br />
is too small to be visible in this representation.<br />
All experimentally determined data are summarized in Table 1.<br />
Table 1. Summary <strong>of</strong> experimentally determined data for the <strong>carbon</strong> samples pyrolized at temperatures between 800°C<br />
and 2500°C.<br />
Pyrolysis<br />
Temperature<br />
/°C<br />
Micro-<br />
/ kg m -3 tivity Size L a /<br />
Electrical<br />
/ S·cm -1 Angström<br />
Density Conduc- Crystallite<br />
Ultr<strong>as</strong>onic<br />
Velocity<br />
/ m·s -1 S BET<br />
/ m 2 g -1 S ext<br />
/ m 2 g -1 S mic<br />
/ m 2 g -1 <strong>Thermal</strong><br />
Diffusivity a<br />
/ mm 2 s -1<br />
800 320 -- 28 601 532 102 430 0.126<br />
1000 323 2.84 32 695 571 97 473 0.206<br />
1250 323 6.54 38 746 386 99 287 0.305<br />
1500 307 7.2 44 716 267 98 169 0.415<br />
1750 301 8.3 45 757 159 107 51 0.550<br />
2000 303 8.72 43 717 133 110 23 0.725<br />
2250 314 9.66 48 735 120 106 14 0.925<br />
2500 315 9.19 47 732 123 101 22 0.990
5 Discussion<br />
The heat transport through a porous solid consists <strong>of</strong> a radiative, a g<strong>as</strong>eous and a solid contribution. A<br />
change <strong>of</strong> thermal <strong>conductivity</strong> with pyrolysis temperature (figure 11) in the series <strong>of</strong> samples investigated<br />
caused by a change <strong>of</strong> the g<strong>as</strong>eous contribution can be excluded because the me<strong>as</strong>urements were<br />
performed under vacuum.<br />
The values calculated for the radiative contribution to the thermal <strong>conductivity</strong> at 300°C are found to be<br />
between 0.005 W(m·K) -1 (e ≈ 140 m 2 kg -1 ; see figure 9) for the sample pyrolyzed at 800°C and 0.004W(m·K) -1<br />
(e ≈ 190 m 2 kg -1 ; see figure 9) for the sample pyrolyzed at 2500°C. Both values are small compared to the<br />
total thermal <strong>conductivity</strong> (figure 11). This is also confirmed by the thermal <strong>conductivity</strong> me<strong>as</strong>ured <strong>as</strong> a<br />
function <strong>of</strong> temperature for the aerogel pyrolized at 2000°C (figure 12): The onset for the T 3 -incre<strong>as</strong>e<br />
characteristic for radiative heat transfer (which is expected for a temperature independent extinction) first<br />
shows above 1250 °C. Therefore the contribution <strong>of</strong> radiation can not be responsible for the incre<strong>as</strong>e <strong>of</strong> the<br />
thermal <strong>conductivity</strong> at 300°C.<br />
The change in thermal <strong>conductivity</strong> therefore h<strong>as</strong> to be due to changes in the solid ph<strong>as</strong>e. However,<br />
modifications <strong>of</strong> the morphology <strong>of</strong> the porous <strong>carbon</strong> like sintering processes affecting the meso- or<br />
macroporosity obviously do not take place since otherwise the external surface <strong>of</strong> the samples investigated<br />
would not be constant (see figure 10). Similarly, the change in IR-extinction (figure 9) is mainly due to<br />
absorption while the scattering component that reflects the morphological characteristics <strong>of</strong> the samples is<br />
essentially unaffected by the pyrolysis temperature. In contr<strong>as</strong>t, a modification <strong>of</strong> the solid on a length scale<br />
<strong>of</strong> 2 nm or below is obvious by the variation <strong>of</strong> the micropore surface S µ determined by nitrogen sorption<br />
me<strong>as</strong>urements (see figure 10) and the changes <strong>of</strong> the microcrystallite size (figure 7).<br />
Generally, the solid thermal <strong>conductivity</strong> can contain both, electronic and phonic contributions. According to<br />
[8] the Wiedemann-Franz law (equation(6)) should be applicable to the type <strong>of</strong> <strong>carbon</strong> samples investigated<br />
here. The values <strong>of</strong> the electrical contribution to the thermal <strong>conductivity</strong> calculated by equation (6) yield<br />
values between 0.004 W/mK for the sample heat treated at 1000°C and 0.013 W/mK for the sample heat<br />
treated at 2500°C. The value for 1000°C corresponds to that one found out by Lu et al. [8] for a sample with<br />
similar density pyrolized at 1050°C. Although there is an obvious incre<strong>as</strong>e <strong>of</strong> the electrical contribution to the<br />
thermal <strong>conductivity</strong> caused by heat treatment, this contribution represents only a small effect compared to<br />
the experimental values for the thermal <strong>conductivity</strong> (Figs. 11 and 12).<br />
The phononic thermal <strong>conductivity</strong> can be described by the phonon diffusion model (equation (7)).<br />
Assuming that the experimentally determined sound velocity v corresponds to the propagation velocity <strong>of</strong> the<br />
acoustic phonons v ph within a solid, the phonon mean fee path l can be calculated from equation (4)<br />
according to<br />
l<br />
3a<br />
v<br />
= . (8)<br />
Via equation (8) values for the mean free path l between 6 Å and 41 Å are obtained when the pyrolysis<br />
temperature is incre<strong>as</strong>ing from 800°C to 2500°C (figure 13). These values correspond approximately to the
data mentioned in [10]. However, in contr<strong>as</strong>t to reference [10] the mean free paths l calculated in this work<br />
are without exception smaller than the microcrystallite size L a determined from Raman me<strong>as</strong>urements (figure<br />
13). This implies that the mean free path <strong>of</strong> phonons in the samples under investigation is governed by<br />
defects smaller than the microcrystallite size. A similar effect h<strong>as</strong> also been observed for the electrical<br />
<strong>conductivity</strong> in gl<strong>as</strong>sy <strong>carbon</strong>s <strong>as</strong> a function <strong>of</strong> pyrolysis temperature [7]. Small angle X-ray scattering<br />
investigation <strong>of</strong> <strong>carbon</strong> aerogels pyrolized at temperatures up to 2100°C reveal features that double in size<br />
from about 5 to 10 Å when the pyrolysis temperature is incre<strong>as</strong>ed from 1500°C to 2100°C [21]. However, it is<br />
not clear whether the observed effect is due to a growth <strong>of</strong> micropores that are not accessible to nitrogen<br />
(see figure 10 and Table 1) or a growth <strong>of</strong> the solid ph<strong>as</strong>e since the scattering only reflects a combined mean<br />
value <strong>of</strong> the extension <strong>of</strong> both ph<strong>as</strong>es. Comparing all physical properties determined <strong>as</strong> a function <strong>of</strong><br />
pyrolysis temperature (figures 5 through 10) reveals that none <strong>of</strong> them shows a significant change above<br />
1500°C, in contr<strong>as</strong>t to the effect observed for the thermal <strong>conductivity</strong> (figure 11). Only the features detected<br />
by small angle scattering show a comparable change in the temperature range above 1500 °C. This is a<br />
strong hint that these are the st<strong>ru</strong>ctural entities that are responsible for the huge incre<strong>as</strong>e <strong>of</strong> the solid thermal<br />
<strong>conductivity</strong> with pyrolysis temperature. Future investigations have to clarify this point.<br />
50<br />
45<br />
L a<br />
microcrystallite size L a<br />
(A)<br />
mean free path l (A)<br />
40<br />
35<br />
30<br />
25<br />
20<br />
15<br />
10<br />
5<br />
l<br />
600 800 1000 1200 1400 1600 1800 2000 2200 2400 2600<br />
pyrolysis temperature (°C)<br />
Figure 13. Microcrystallite size L a and mean free path l calculated via equation (8) <strong>as</strong> a function <strong>of</strong> pyrolysis temperature.<br />
6 Summary<br />
The thermal <strong>conductivity</strong> <strong>of</strong> <strong>amorphous</strong> <strong>carbon</strong> strongly depends on the maximal treatment / pyrolysis<br />
temperature. In a pyrolysis temperature range between 800°C and 2500°C the thermal <strong>conductivity</strong> at 300<br />
°C changes by a factor <strong>of</strong> about 8. The main cause for the observed effect can be identified to be the<br />
variation <strong>of</strong> the phonon mean free path. The phonon mean free path l is found to be systematically smaller<br />
than the microcrystallite size L a , i.e. the mean free path is controlled by the presence <strong>of</strong> defects which are<br />
partially cured at incre<strong>as</strong>ing pyrolysis temperature. Small angle X-ray scattering indicates that st<strong>ru</strong>ctural<br />
changes on the length scale between 0.5 and 1 nm are the key for the dr<strong>as</strong>tic incre<strong>as</strong>e <strong>of</strong> the thermal
<strong>conductivity</strong> in <strong>carbon</strong> aerogels with incre<strong>as</strong>ing pyrolysis temperature. An investigation <strong>of</strong> the samples<br />
presented here with small angle X-ray scattering is currently in progress.<br />
Acknowledgements<br />
This work h<strong>as</strong> been supported by the Bavarian Science Foundation in Munich.<br />
The authors thank Dr. M. Schreck, University <strong>of</strong> Augsburg, Germany, for performing the Raman<br />
me<strong>as</strong>urements and Dr. D. Kehr, Schunk Kohlenst<strong>of</strong>ftechnik GmbH, Gießen, Germany, for performing the<br />
high temperature treatment <strong>of</strong> the specimens and valuable discussions.<br />
References<br />
1. R. W. Pekala and F. M. Kong, “A Synthetic Route to Organic Aerogels – Mechanism, Stucture, and<br />
Properties”, 2 nd International Symposium on Aerogels (ISA 2), Montpellier (France), 1989, C4-33 - 40<br />
2. R. Saliger, “Carbon Aerogels for Application in Electrochemical Double Layer Capacitors”, Dissertation<br />
Universität Würzburg, Report E21 – 1099 -1 (1999)<br />
3. H. Pröbstle, “Kohlenst<strong>of</strong>faerogele für den Einsatz in Superkondensatoren”, Dissertation Universität<br />
Würzburg, Report E21 – 1001 – 1 (2001)<br />
4. M. Wiener, “Elektroden aus Kohlenst<strong>of</strong>faerogel für PEM-Brennst<strong>of</strong>fzellen“, Diplomarbeit Universität<br />
Würzburg, Report E21 – 1200 – 1 (2000)<br />
5. M. Glora, “Charakterisie<strong>ru</strong>ng von G<strong>as</strong>diffusionsschichten auf der B<strong>as</strong>is von Kohlenst<strong>of</strong>f-Aerogelen für<br />
PEM-Brennst<strong>of</strong>fzellen“, Dissertation Universität Würzburg, Report E21 – 0502 – 1 (2002)<br />
6. Y. Hanzawa, H. Hatori, N. Yoshizawa, Y. Yamada, “St<strong>ru</strong>ctural changes in <strong>carbon</strong> aerogels with high<br />
temperature treatment“, Carbon 40 (2002) 575-581<br />
7. L. Soukup, I. Gregora and L. J<strong>as</strong>trabik, “Raman spedtra and electrical conductiviy <strong>of</strong> gl<strong>as</strong>sy <strong>carbon</strong>”,<br />
Materials Science and Engeneering, B11 (1992) 355-357<br />
8. X. Lu, O. Nilsson, J. Fricke and R. W. Pekala, J. Appl. Phys. 73 (1993) 583<br />
9. O. Nilsson, V. Bock, R. Caps and J. Fricke, “High Temperature <strong>Thermal</strong> Properties <strong>of</strong> Carbon Aerogels”,<br />
<strong>Thermal</strong> <strong>conductivity</strong> 22, Proceedings <strong>of</strong> the Twenty-Second International Conference on <strong>Thermal</strong><br />
Conductivity, Edited by Timothy W. Tong, p. 878-887<br />
10. V. Bock, O. Nilsson, J. Blumm, J. Fricke, “<strong>Thermal</strong> properties <strong>of</strong> <strong>carbon</strong> aerogels” Journal <strong>of</strong> Non<br />
Crystalline Solids 185 (1995) 233-239<br />
11. M. Wiener, G. Reichenauer, T. Scherb, J. Fricke, „Accelerating the synthesis <strong>of</strong> <strong>carbon</strong> aerogel<br />
precursors“, Journal <strong>of</strong> Non-Crystalline Solids 350 (2004) 126-130<br />
12. R. L. McCreery, “Carbon Electrodes: St<strong>ru</strong>ctural Effects on Electron Transfer Kinetics”, Electroanalytical<br />
Chemistry, A Series in Advance, 17, edited by A. J. Bard, Marcel Dekker, Inc., (1991) 221<br />
13. D. S. Knight, W. B. White, “Characterisation <strong>of</strong> diamond films by Raman spectroscopy”, Journal <strong>of</strong><br />
Materials Research 4 (1989) 385.<br />
14. G.A.M. Reynolds, A.W.P. Fung, Z.H. Wang, M. S. Dresselhaus. R. W. Pekala, “The effects <strong>of</strong> external<br />
conditions on the internal st<strong>ru</strong>cture <strong>of</strong> <strong>carbon</strong> aerogels“, Journal <strong>of</strong> Non-Crystalline Solids 188 (1995) 27-<br />
33.
15. J. Manara, R. Caps, F. Rather, J. Fricke, Optics Communications 168 (1999) 237<br />
16. S. B<strong>ru</strong>nauer, P. H. Emmett, E. Teller, J. Am. Ceram. Soc. 60 (1938) 309<br />
17. O Nilsson, H Mehling, R Horn, J Fricke, R H<strong>of</strong>mann, S G Müller, R Eckstein, D H<strong>of</strong>mann, Determination<br />
<strong>of</strong> the thermal diffusivity and <strong>conductivity</strong> <strong>of</strong> monocrystalline silicon carbide (300-2300K), in High<br />
Temperatures – High Pressures 29 (1997) 73-79<br />
18. R. D. Cowan, Pulse Method <strong>of</strong> Me<strong>as</strong>uring <strong>Thermal</strong> Diffusivity at High Temperatures, J. Appl. Phys. 34<br />
(1963) 926<br />
19. National Bureau <strong>of</strong> Standards, Special Publication 260-89 (1984)<br />
20. P. G. Klemens, <strong>Thermal</strong> <strong>conductivity</strong> 1, edited by R. P. Tye (Academic, London, 1969), p. 1.<br />
21. G. Reichenauer, A. Emmerling, J. Fricke, R.W. Pekala, “Microporosity in Carbon Aerogels” , J. Non-<br />
Cryst. Solids 255 (1998) 210-214.<br />
22. Debye, in Vorträge über die Kinetische Theorie der Materie und der Elektrizität, B. G. Teubner, Berlin,<br />
(1914) p. 43.