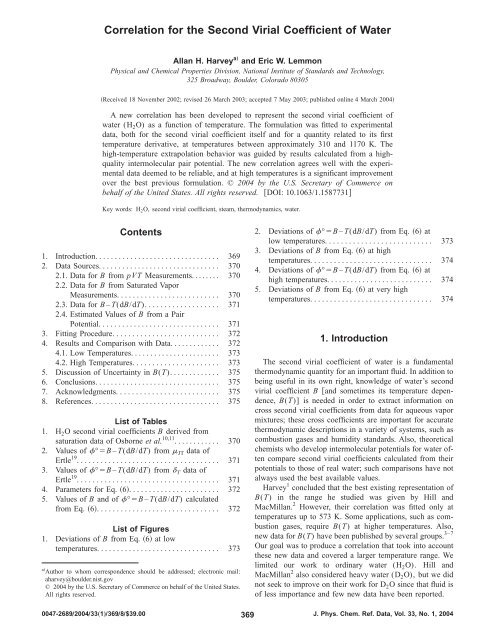
Correlation for the Second Virial Coefficient of ... - thermophysics.ru
Correlation for the Second Virial Coefficient of ... - thermophysics.ru
Correlation for the Second Virial Coefficient of ... - thermophysics.ru

You also want an ePaper? Increase the reach of your titles
YUMPU automatically turns print PDFs into web optimized ePapers that Google loves.
SECOND VIRIAL COEFFICIENT OF WATER371vided <strong>the</strong> majority <strong>of</strong> <strong>the</strong> uncertainty <strong>for</strong> <strong>the</strong> points at 423and 473 K. For <strong>the</strong> points at lower temperatures, <strong>the</strong> uncertaintyfrom and that from p s were <strong>of</strong> similar magnitude.One might think <strong>of</strong> adding a contribution from <strong>the</strong> uncertaintyin dp s /dT in Eq. 1. However, <strong>the</strong>se measurements <strong>of</strong> were also used in correlating <strong>the</strong> temperature dependence<strong>of</strong> p s . 12 There<strong>for</strong>e, any errors in and in dp s /dT will behighly correlated. Fur<strong>the</strong>rmore, because those two quantitiesappear on opposite sides <strong>of</strong> Eq. 1, <strong>the</strong>se errors would tendto cancel each o<strong>the</strong>r out in <strong>the</strong> calculation <strong>of</strong> v. An extrauncertainty component <strong>for</strong> dp s /dT is <strong>the</strong>re<strong>for</strong>e not needed.2.3. Data <strong>for</strong> B – T„dBÕdT…More in<strong>for</strong>mation on B(T) can be obtained from expansionexperiments on steam. The second virial coefficient andits temperature dependence can be combined into <strong>the</strong> function°, defined by°B – T dBdT .° is related to <strong>the</strong> low-pressure limit <strong>of</strong> <strong>the</strong> Joule–Thomson coefficient JT (T/p) h , where h is <strong>the</strong> molarenthalpy and <strong>of</strong> <strong>the</strong> iso<strong>the</strong>rmal throttling coefficient T(h/p) T by <strong>the</strong> following relationships:° lim Tp→034TABLE 2. Values <strong>of</strong> °B – T(dB/dT) from JT data <strong>of</strong> Ertle 19TK°(cm 3 •mol 1 )Uncertainty in °(cm 3 •mol 1 )431.88 1197.7 7.2486.14 768.1 13.6521.16 598.4 3.0572.25 453.8 3.7623.04 350.1 3.6673.15 278.6 3.7723.27 229.6 2.4773.22 191.3 2.2822.98 161.3 2.0873.00 137.8 1.8923.43 119.1 1.4973.40 104.0 1.21023.66 90.7 0.91073.80 79.5 0.7°c 0 p lim JT ,5p→0where c 0 p is <strong>the</strong> molar isobaric heat capacity in <strong>the</strong> ideal-gasstate. We use c 0 p as correlated by Cooper, 14 which is alsoused in <strong>the</strong> international standard equation <strong>of</strong> state <strong>for</strong>water. 13Values <strong>of</strong> ° obtained from iso<strong>the</strong>rmal throttling experimentsvia Eq. 4 have been published by Collins andKeyes 15 and by McGlashan and Wormald. 16 The latter papercontains in reanalyzed <strong>for</strong>m data from <strong>the</strong> <strong>the</strong>sis <strong>of</strong>Wormald 17 that had been used in some previous <strong>for</strong>mulations<strong>of</strong> B(T). McGlashan and Wormald diagnosed a probableheat leak that distorted <strong>the</strong> lowest-temperature values reportedby Collins and Keyes and provided corrected numbers;we use those corrected values here. The iso<strong>the</strong>rmalthrottling measurements <strong>of</strong> LeFevre et al. 18 were too scatteredto be <strong>of</strong> use in this work.In addition, Ertle 19 reported measurements <strong>of</strong> both JT and T <strong>for</strong> steam over a range <strong>of</strong> pressures at temperatures up to1073 K. At each pressure and temperature, several usuallyfour data points were reported. We converted <strong>the</strong>se data to° with Eqs. 4 and 5; <strong>the</strong> results are given in Tables 2and 3. In both tables, <strong>the</strong> uncertainties given one standarddeviation result both from <strong>the</strong> scatter among <strong>the</strong> duplicatepoints in <strong>the</strong> original data and from our estimate <strong>of</strong> <strong>the</strong> uncertaintyin <strong>the</strong> extrapolation to zero pressure; <strong>the</strong> scatter in<strong>the</strong> data is in all cases <strong>the</strong> dominant contribution.If one compares Tables 2 and 3, it is apparent that <strong>the</strong>agreement <strong>of</strong> <strong>the</strong> derived values <strong>of</strong> ° at common temperaturesis much better than would be expected based on <strong>the</strong>scatter in <strong>the</strong> reported measurements. This strongly suggeststhat <strong>the</strong> data points reported in Ertle’s JT experiments and T experiments are not completely independent. In <strong>the</strong> remainder<strong>of</strong> this work, we will restrict our attention to <strong>the</strong>points in Table 2, since <strong>the</strong> points in Table 3 are effectivelyredundant.2.4. Estimated Values <strong>of</strong> B from a Pair PotentialAs mentioned previously, high-temperature data <strong>for</strong> B(T)are scarce; <strong>the</strong> only data above 773 K are from Vukalovichet al., 9 and <strong>the</strong>ir experimental procedure and uncertainty arenot well documented. Above 1173 K, <strong>the</strong>re are no data at all.For applications such as combustion gases, it is desirable tohave a good estimate <strong>of</strong> B(T) at higher temperatures.It is possible to calculate B(T) from statistical mechanics,provided <strong>the</strong> intermolecular pair potential is known with sufficientaccuracy. For small molecules, it is now possible toderive accurate pair potentials from ab initio quantum mechanics;such potentials have been used to derive values <strong>of</strong>B(T) considered more reliable than those obtainable experimentally<strong>for</strong> helium 20 and <strong>for</strong> cross second virial coefficients<strong>of</strong> water with noble gases. 21–23 For pure water, Harvey 1 determinedthat this route to B(T), with quantum effects in-TABLE 3. Values <strong>of</strong> °B – T(dB/dT) from T data <strong>of</strong> Ertle 19TK°(cm 3 •mol 1 )Uncertainty in °(cm 3 •mol 1 )622.45 352.4 3.1673.31 279.0 4.1723.43 229.1 2.8773.42 190.9 2.4823.12 161.1 2.0873.15 137.7 1.8923.55 119.2 1.4973.52 103.8 0.91023.78 90.7 0.91073.97 79.5 0.5J. Phys. Chem. Ref. Data, Vol. 33, No. 1, 2004
372 A. H. HARVEY AND E. W. LEMMONcluded to first order, was not sufficiently accurate at low andmoderate temperatures. This was attributed in part to largerotational quantum corrections due to water’s large intermoleculartorques and small moment <strong>of</strong> inertia that at <strong>the</strong> timecould not be calculated to sufficiently high order subsequently,Schenter 24 presented a method <strong>for</strong> incorporating rotationaldegrees <strong>of</strong> freedom in a fully quantum calculation <strong>of</strong>B(T)]. Because <strong>the</strong>se quantum effects are much smaller athigh temperatures, <strong>the</strong>y can be treated to first order and stillproduce reliable values to guide <strong>the</strong> high-temperature behavior<strong>of</strong> our correlation.For this purpose, we used <strong>the</strong> SAPT-5s potential <strong>of</strong> Maset al. 25 O<strong>the</strong>r pair potentials <strong>of</strong> similarly high quality exist in<strong>the</strong> literature; 26–28 we chose SAPT-5s because computer codewas available in convenient <strong>for</strong>m and because it producedvalues <strong>of</strong> B(T) that closely matched <strong>the</strong> data <strong>of</strong> Kell et al. 5above 700 K and that agreed reasonably well with <strong>the</strong> data <strong>of</strong>Vukalovich et al. 9 <strong>Second</strong> virial coefficients, including firstorderquantum corrections, were calculated at temperaturesup to 3000 K by procedures identical to those described byHodges et al. 21 The uncertainty in <strong>the</strong> numerical evaluation<strong>of</strong> B(T) from <strong>the</strong> pair potential is less than 0.1cm 3 •mol 1 .3. Fitting ProcedureAll temperatures <strong>for</strong> experimental data were converted to<strong>the</strong> ITS-90 scale by standard procedures. Effects <strong>of</strong> temperaturescales were insignificantly small except in <strong>the</strong> processing<strong>of</strong> <strong>the</strong> saturation measurements <strong>of</strong> Osborne et al. 10,11The functional <strong>for</strong>m to which B(T) was fit was that usedpreviously <strong>for</strong> correlating cross second virial coefficients <strong>of</strong>water with nonpolar gases. 21,22 This <strong>for</strong>m obeys <strong>the</strong> necessaryboundary conditions that B(T) is bounded from aboveand goes to negative infinity in <strong>the</strong> low-temperature limit.The number <strong>of</strong> terms was increased until additional terms didnot improve <strong>the</strong> fit significantly. Data points that appeared tobe outliers were excluded if omitting <strong>the</strong>m significantly improved<strong>the</strong> root-mean-square deviation <strong>of</strong> <strong>the</strong> fit.The fit was primarily determined by <strong>the</strong> B(T) data <strong>of</strong> Eubanket al., 3 Kell et al. 5 and Osborne et al., 10,11 and to alesser extent by <strong>the</strong> B(T) data <strong>of</strong> Abdulagatov et al. 6 andVukalovich et al., 9 <strong>the</strong> values <strong>of</strong> B(T) generated from <strong>the</strong>SAPT-5s potential, 25 and <strong>the</strong> ° data <strong>of</strong> McGlashan andWormald. 16 O<strong>the</strong>r data not included in <strong>the</strong> fit will be discussedin Sec. 4.4. Results and Comparison with DataThe final equation isBT/B 0 a i T* b i,6i1where B 0 1000 cm 3 •mol 1 , T*T/100 K, and <strong>the</strong> coefficientsa i and b i are listed in Table 4. For easy reference, inTable 5 we give values <strong>of</strong> B and °B – T(dB/dT) calculatedfrom Eq. 6 at selected temperatures. The number <strong>of</strong>4TABLE 4. Parameters <strong>for</strong> Eq. 6i a i b i1 0.344 04 0.52 0.758 26 0.83 24.219 3.354 3978.2 8.3digits printed in Table 5 should not be taken as an indication<strong>of</strong> uncertainty; Section 5 should be consulted <strong>for</strong> that in<strong>for</strong>mation.In addition to comparing Eq. 6 with experimental data,we will include in our comparisons <strong>the</strong> correlation <strong>of</strong> Hilland MacMillan, 2 which was judged previously 1 to be <strong>the</strong> bestexisting correlation, at least in its temperature range <strong>of</strong> validity.We also compare with values <strong>of</strong> B(T) given by <strong>the</strong>current international standard equation <strong>of</strong> state <strong>for</strong> <strong>the</strong> properties<strong>of</strong> water and steam, as documented by Wagner andP<strong>ru</strong>ß. 13 This equation was not specifically fitted to secondvirial coefficients, so it cannot be expected to reproduceB(T) as well as correlations fitted directly to those data.TABLE 5. Values <strong>of</strong> B and <strong>of</strong> °B – T(dB/dT) calculated from Eq. 6TKB(cm 3 •mol 1 )°(cm 3 •mol 1 )300 1163.0 6980.9325 795.94 4364.0350 580.11 2938.4375 443.32 2101.9400 351.11 1578.0425 285.75 1230.9450 237.52 989.54475 200.75 814.88500 171.97 684.12525 148.94 583.45550 130.18 504.11575 114.67 440.34600 101.66 388.22625 90.64 345.02650 81.20 308.77675 73.04 278.03700 65.94 251.72725 59.72 229.00750 54.23 209.24775 49.35 191.94800 45.00 176.70850 37.58 151.17900 31.51 130.74950 26.47 114.111000 22.22 100.371100 15.49 79.121200 10.43 63.581300 6.50 51.791400 3.37 42.601500 0.84 35.251600 1.26 29.261800 4.49 20.102000 6.85 13.462500 10.57 2.903000 12.64 3.21J. Phys. Chem. Ref. Data, Vol. 33, No. 1, 2004
SECOND VIRIAL COEFFICIENT OF WATER373FIG. 1. Deviations <strong>of</strong> B from Eq. 6 at low temperatures.However, it made use <strong>of</strong> data from some <strong>of</strong> our key sources,notably <strong>the</strong> pVT data <strong>of</strong> Kell et al. 5 and <strong>the</strong> saturation data<strong>of</strong> Osborne et al. 10,11 It <strong>the</strong>re<strong>for</strong>e can be expected to givereasonable values <strong>of</strong> B(T), and it is interesting to see howaccurately such a wide-ranging equation <strong>of</strong> state can reproducesecond virial coefficients.4.1. Low TemperaturesAt low temperatures, Fig. 1 shows <strong>the</strong> relative deviationsfrom Eq. 6 <strong>of</strong> both experimental values <strong>of</strong> B and valuescalculated from <strong>the</strong> correlation <strong>of</strong> Hill and MacMillan 2 and<strong>the</strong> equation <strong>of</strong> state <strong>of</strong> Wagner and P<strong>ru</strong>ß. 13 Figure 2 is asimilar figure <strong>for</strong> °.The most striking aspect <strong>of</strong> Fig. 1 is <strong>the</strong> inconsistency <strong>of</strong><strong>the</strong> data <strong>of</strong> Hendl et al. 7 with <strong>the</strong> o<strong>the</strong>r data sources. Because<strong>the</strong> o<strong>the</strong>r three independent sources are in fairly good agreement,and because <strong>the</strong> B(T) function could not be made toagree with Hendl et al. 7 without drastically worsening <strong>the</strong>prediction <strong>of</strong> ° shown in Fig. 2, we disregarded <strong>the</strong>se data.The data point from Kell et al. 5 near 423 K appears to be anoutlier and was discarded; apart from this point, <strong>the</strong> onlydisagreement outside <strong>the</strong> stated uncertainties <strong>of</strong> <strong>the</strong> data isbetween Eubank et al. 3 and Kell et al. 5 near 498 K. Our correlationreproduces all <strong>the</strong> accepted data within <strong>the</strong>ir stateduncertainties except <strong>for</strong> <strong>the</strong> two points <strong>of</strong> Kell et al. 5 near473 and 498 K.The correlation <strong>of</strong> Hill and MacMillan 2 also per<strong>for</strong>ms wellin <strong>the</strong> temperature range <strong>of</strong> Fig. 1. The equation <strong>of</strong> state <strong>of</strong>Wagner and P<strong>ru</strong>ß 13 differs somewhat at <strong>the</strong> high-temperatureend <strong>of</strong> Fig. 1, going through <strong>the</strong> data <strong>of</strong> Kell et al.; 5 this isexpected because Kell’s pVT data were used to fit that equation.In Fig. 2, we see that our correlation is fairly consistentwith <strong>the</strong> low-temperature ° data <strong>of</strong> McGlashan andWormald. 16 It was not possible to obtain a smooth fit thatpassed through all <strong>the</strong>ir data points, especially <strong>for</strong> <strong>the</strong> pointsabove 400 K where this would have greatly increased <strong>the</strong>disagreement with data <strong>for</strong> B in Fig. 1. Equation 6 is als<strong>of</strong>airly consistent though with an apparent systematic deviationwith <strong>the</strong> data <strong>of</strong> Collins and Keyes; 15 <strong>the</strong>se points areshown without error bars because <strong>the</strong>ir uncertainty was notreported. The two points from Ertle 19 are also missed tosome extent. Again, Eq. 6 could not be made to passthrough <strong>the</strong>se without seriously degrading <strong>the</strong> fit <strong>of</strong> <strong>the</strong> B(T)data. Since <strong>the</strong> error bars we have assigned to Ertle’s datarepresent only <strong>the</strong> scatter in <strong>the</strong> measurements at each temperature,it is likely that <strong>the</strong> actual uncertainties are largerthan implied in Fig. 2, especially <strong>for</strong> <strong>the</strong> point near 430 K.The correlation <strong>of</strong> Hill and MacMillan 2 behaves similarlyto Eq. 6, although at <strong>the</strong> lowest temperatures it is less consistentwith <strong>the</strong> data <strong>of</strong> McGlashan and Wormald 16 and moreconsistent with those <strong>of</strong> Collins and Keyes. 15 Wagner andP<strong>ru</strong>ß 13 deviate significantly from <strong>the</strong> ° data <strong>of</strong> McGlashanand Wormald 16 at temperatures below about 380 K. The reason<strong>for</strong> this can be seen in Fig. 1, where Wagner and P<strong>ru</strong>ß 13follow more closely <strong>the</strong> low-temperature data <strong>of</strong> Osborneet al., 11 to which <strong>the</strong>ir equation was fitted in part. This causes<strong>the</strong>ir values <strong>of</strong> ° to be lower. In fitting Eq. 6, we chose toaccept slightly worse agreement with <strong>the</strong> two lowest B(T)points <strong>of</strong> Osborne et al. 11 though our fit still lies within <strong>the</strong>i<strong>ru</strong>ncertainties in order to be consistent with <strong>the</strong> ° data <strong>of</strong>McGlashan and Wormald. 164.2. High TemperaturesFIG. 2. Deviations <strong>of</strong> °B – T(dB/dT) from Eq. 6 at low temperatures.Figures 3 and 4 are similar deviation plots to Figs. 1 and 2,except that <strong>the</strong>y cover a higher temperature range. UnlikeFigs. 1 and 2, Figs. 3 and 4 report absolute deviations in Band ° ra<strong>the</strong>r than relative deviations; this is because B(T)passes through zero at a high temperature, making a relativedeviation meaningless.In Fig. 3, we see that <strong>the</strong>re is some inconsistency among<strong>the</strong> different data sets between about 500 and 650 K, although<strong>the</strong> differences are not much larger than <strong>the</strong> mutualuncertainties <strong>of</strong> <strong>the</strong> experiments. At <strong>the</strong> temperatures in Fig.3 where data from Eubank et al. 3 are reported, Eq. 6 givesvalues intermediate between those data and <strong>the</strong> data <strong>of</strong> Kellet al. 5 At higher temperatures, it closely follows <strong>the</strong> data <strong>of</strong>J. Phys. Chem. Ref. Data, Vol. 33, No. 1, 2004
374 A. H. HARVEY AND E. W. LEMMONFIG. 3. Deviations <strong>of</strong> B from Eq. 6 at high temperatures.FIG. 5. Deviations <strong>of</strong> B from Eq. 6 at very high temperatures.Kell et al. 5 Two <strong>of</strong> <strong>the</strong> four points from Abdulagatov et al. 6deviate from Eq. 6, but no systematic trend is evident. Athigher temperatures, Eq. 6 is consistent with <strong>the</strong> data <strong>of</strong>Vukalovich et al. 9 The smooth systematic trend <strong>for</strong> <strong>the</strong>sedata in Fig. 3 is probably due to <strong>the</strong> use <strong>of</strong> a smoothingequation by Vukalovich et al.; 9 un<strong>for</strong>tunately no uncertainties<strong>for</strong> <strong>the</strong>se values were reported.The correlation <strong>of</strong> Hill and MacMillan 2 is in fair agreementwith <strong>the</strong> data less so with <strong>the</strong> values <strong>of</strong> Kell et al. 5 upto about 800 K, after which it produces increasingly largerdeviations. This is not surprising, since it was fitted only upto 573 K. The equation <strong>of</strong> state <strong>of</strong> Wagner and P<strong>ru</strong>ß 13 agreeswith <strong>the</strong> data <strong>of</strong> Kell et al. 5 near 500 K, after which it systematicallyoverpredicts B(T), though not by a very largeamount.Figure 4 shows deviations <strong>for</strong> °. While Eq. 6 is fairlyconsistent with <strong>the</strong> data <strong>of</strong> Ertle, 19 it was not possible toobtain complete agreement with <strong>the</strong>se data without significantlydegrading <strong>the</strong> agreement with values <strong>of</strong> B shown inFig. 3. The correlation <strong>of</strong> Hill and MacMillan 2 is reasonablyconsistent with Ertle’s data in <strong>the</strong> range where <strong>the</strong> correlationFIG. 4. Deviations <strong>of</strong> °B – T(dB/dT) from Eq. 6 at high temperatures.was fitted, but deviates more at higher temperatures. Theequation <strong>of</strong> state <strong>of</strong> Wagner and P<strong>ru</strong>ß 13 disagrees more with<strong>the</strong> data <strong>of</strong> Ertle 19 at <strong>the</strong> lower temperatures in Fig. 4, but isin better agreement at <strong>the</strong> higher temperatures.Finally, we examine <strong>the</strong> behavior <strong>of</strong> Eq. 6 at very hightemperatures. Figure 5 shows <strong>the</strong> deviations from Eq. 6 <strong>of</strong><strong>the</strong> four highest-temperature points <strong>of</strong> Kell et al. 5 and <strong>of</strong> <strong>the</strong>data <strong>of</strong> Vukalovich et al. 9 It also shows values <strong>of</strong> B calculatedfrom <strong>the</strong> SAPT-5s pair potential 25 <strong>the</strong>se values wereomitted from Fig. 3 <strong>for</strong> clarity. The SAPT-5s values areconsistent with <strong>the</strong> two experimental data sets in this range,increasing our confidence in <strong>the</strong> accuracy <strong>of</strong> <strong>the</strong> pair potentialand resulting values <strong>of</strong> B(T). Equation 6 follows <strong>the</strong>SAPT-5s values closely at high temperatures up to 3000 K;we believe <strong>the</strong>se values provide as t<strong>ru</strong>stworthy an extrapolationas can be obtained <strong>for</strong> B(T). The correlation <strong>of</strong> Hill andMacMillan, 2 which was not intended <strong>for</strong> such high temperatures,is increasingly inaccurate in this region, while <strong>the</strong>equation <strong>of</strong> state <strong>of</strong> Wagner and P<strong>ru</strong>ß 13 gives reasonable behavior<strong>of</strong> B(T) at very high temperatures despite being systematicallyhigh compared to <strong>the</strong> data at intermediate temperatures.The Boyle temperature where B(T)0) <strong>for</strong> Eq.6 is 1538 K; this compares to 1408 K <strong>for</strong> Hill andMacMillan 2 and 1519 K <strong>for</strong> Wagner and P<strong>ru</strong>ß. 13After this work was completed, Abdulagatov et al. 29 publishedvalues <strong>of</strong> <strong>the</strong> quantity2T dB d2 BdT T2 dT 2derived from analysis <strong>of</strong> existing isochoric heat-capacity databetween approximately 578 and 1024 K. Their values are ingood agreement with those from Eq. 6 above 700 K. Atlower temperatures, <strong>the</strong>re is a systematic deviation <strong>of</strong> <strong>the</strong>irvalues not only from Eq. 6, but also from o<strong>the</strong>r correlations<strong>for</strong> B(T). Since B(T) in this range is fairly well determined,this suggests problems in <strong>the</strong> heat-capacity measurements. Inreporting <strong>the</strong>ir comprehensive equation <strong>of</strong> state <strong>for</strong> water,Wagner and P<strong>ru</strong>ß 13 commented on apparent inconsistenciesbelow 725 K in some <strong>of</strong> <strong>the</strong>se isochoric heat-capacity data.J. Phys. Chem. Ref. Data, Vol. 33, No. 1, 2004
SECOND VIRIAL COEFFICIENT OF WATER3755. Discussion <strong>of</strong> Uncertainty in B„T…While a <strong>for</strong>mal uncertainty analysis is impractical <strong>for</strong> acorrelation fitted to a variety <strong>of</strong> data such as this, we canmake reasonable estimates <strong>of</strong> <strong>the</strong> quality <strong>of</strong> <strong>the</strong> correlation.The uncertainty in B(T) is governed by <strong>the</strong> scatter and uncertaintiesin <strong>the</strong> original experimental data, including regionswhere data from different sources are not mutuallyconsistent.At temperatures below 500 K, <strong>the</strong> uncertainty in B(T) canbe estimated from Fig. 1. Below 350 K, a reasonable estimate<strong>of</strong> uncertainty is given by <strong>the</strong> error bars on <strong>the</strong> data <strong>of</strong>Osborne et al. 11 Between 350 and 500 K, it appears thatB(T) is determined to within 2% or better. The values <strong>of</strong> °shown in Fig. 2 generally confirm this analysis, although afew ° points between 400 and 450 K are not consistentwith <strong>the</strong> B(T) measurements.Between approximately 500 and 650 K, <strong>the</strong> deviation betweendifferent data sets is illustrated in Fig. 3, and we haveno way to reconcile <strong>the</strong> disagreement. It seems that <strong>the</strong>re isan uncertainty <strong>of</strong> about 1.5 cm 3 •mol 1 <strong>for</strong> B(T) in this region.At higher temperatures, <strong>the</strong> data <strong>of</strong> Kell et al. 5 havesmall reported uncertainties, but <strong>the</strong> fact that many <strong>of</strong> <strong>the</strong>irdata do not agree with Eubank et al. 3 within those uncertaintiesat lower temperatures suggests caution. However, <strong>the</strong>agreement with Vukalovich et al. 9 where <strong>the</strong> sources overlapnear 773 K is encouraging. We can <strong>the</strong>re<strong>for</strong>e estimatean uncertainty <strong>of</strong> 1 cm 3 •mol 1 <strong>for</strong> B(T) between 650 and800 K.At higher temperatures, we have only <strong>the</strong> data <strong>of</strong>Vukalovich et al. 9 and <strong>the</strong> calculations from <strong>the</strong> SAPT-5spotential. 25 Because <strong>of</strong> <strong>the</strong>ir agreement see Fig. 5, itisreasonable to estimate an uncertainty <strong>of</strong> 1 cm 3 •mol 1 <strong>for</strong>B(T) up to 1200 K. At even higher temperatures, all we cansay with certainty is that <strong>the</strong> SAPT-5s potential should providea physically reasonable extrapolation. Since <strong>the</strong> magnitude<strong>of</strong> B is small on <strong>the</strong> order <strong>of</strong> 10 cm 3 •mol 1 ) at <strong>the</strong>sehigh temperatures, and since B(T) at high temperatures isrelatively insensitive to details <strong>of</strong> <strong>the</strong> attractive well <strong>of</strong> <strong>the</strong>potential <strong>the</strong> most difficult part to get quantitatively correct,1cm 3 •mol 1 is also a reasonable estimate <strong>of</strong> <strong>the</strong> uncertainty<strong>of</strong> B(T) at higher temperatures, up to 3000 K.A final consideration is <strong>the</strong> validity <strong>of</strong> extrapolation <strong>of</strong> Eq.6 to low temperatures. The lowest temperatures <strong>for</strong> whichdata were fitted were 323 K <strong>for</strong> B and 313 K <strong>for</strong> °. Theuncertainty in Eq. 6 and <strong>the</strong> underlying data increasesrapidly at low temperatures, as can be seen by <strong>the</strong> sizes <strong>of</strong><strong>the</strong> error bars at <strong>the</strong> lowest temperatures in Figs. 1 and 2.Since ° contains dB/dT, <strong>the</strong> good reproduction <strong>of</strong> lowtemperature° data means that limited extrapolation <strong>of</strong>B(T) to lower temperatures is reasonable. However, due to<strong>the</strong> increasing uncertainties, we do not recommend <strong>the</strong> use <strong>of</strong>Eq. 6 or any correlation <strong>for</strong> B(T)] below 300 K. At lowertemperatures, Eq. 6 by const<strong>ru</strong>ction will give correct qualitativebehavior, but it cannot be considered quantitative.6. ConclusionsEquation 6 provides a reliable representation <strong>of</strong> B(T) <strong>for</strong>water at temperatures above 300 K. The upper temperaturelimit <strong>of</strong> <strong>the</strong> experimental data on which Eq. 6 is based is1173 K, but <strong>the</strong> incorporation in <strong>the</strong> fit <strong>of</strong> values <strong>of</strong> B generatedfrom a high-quality intermolecular pair potential hasallowed us to produce a correlation that we believe can bereliably extrapolated to 3000 K. The correlation may be differentiatedto produce reliable values <strong>of</strong> dB/dT and <strong>the</strong> importantquantity °B – T(dB/dT).The best previous correlation that <strong>of</strong> Hill andMacMillan 2 represents <strong>the</strong> data similarly well in <strong>the</strong> regionwhere it was fitted below 573 K, but its accuracy deterioratesat higher temperatures. The international standard equation<strong>of</strong> state <strong>for</strong> water 13 gives reasonable values <strong>of</strong> B(T)throughout <strong>the</strong> temperature range, but <strong>the</strong> B(T) data at hightemperatures above about 500 K and <strong>the</strong> ° data at lowtemperatures below about 400 K are not represented within<strong>the</strong>ir uncertainties.There are some regions where new high-quality datawould be desirable to reduce <strong>the</strong> uncertainty in B(T). Attemperatures above about 470 K, <strong>the</strong> existing data sets 3,5,6show some significant disagreement, and above 800 K itwould be desirable to have some independent validation <strong>of</strong><strong>the</strong> data <strong>of</strong> Vukalovich et al. 9 At temperatures between about400 and 500 K, <strong>the</strong> data 16,19 <strong>for</strong> ° appear to be somewhatinconsistent with <strong>the</strong> data <strong>for</strong> B(T).The behavior <strong>of</strong> Eq. 6 at very high temperatures could beimproved if a more accurate pair potential <strong>for</strong> water becameavailable. A possible deficiency <strong>of</strong> <strong>the</strong> SAPT-5s potential 25 isthat, like almost all o<strong>the</strong>r proposed potentials, it assumes <strong>the</strong>water molecules are rigid. In reality, higher vibrational androtational states are activated at high temperatures, causingsome stretching <strong>of</strong> <strong>the</strong> molecules. Since <strong>the</strong>se effects wouldbe quite small except at very high temperatures which are <strong>of</strong>less practical interest, and since incorporating intramoleculardegrees <strong>of</strong> freedom would significantly complicate <strong>the</strong>calculation <strong>of</strong> B(T), we do not believe it is worth worryingabout <strong>the</strong> influence <strong>of</strong> molecular flexibility on B(T) <strong>for</strong> waterat this time.7. AcknowledgmentsThe authors thank W. Wagner <strong>for</strong> providing <strong>the</strong> data <strong>of</strong>Ertle 19 in electronic <strong>for</strong>m, I. M. Abdulagatov <strong>for</strong> making Ref.29 available prior to publication, and M. P. Hodges <strong>for</strong> calculatingB(T) from <strong>the</strong> SAPT-5s potential.8. References1 A. H. Harvey, in Steam, Water and Hydro<strong>the</strong>rmal Systems: Physics andChemistry Meeting <strong>the</strong> Needs <strong>of</strong> Industry, Proc. 13th Int. Conf. on <strong>the</strong>Properties <strong>of</strong> Water and Steam, edited by P. R. Tremaine, P. G. Hill, D. E.Irish, and P. V. Balakrishnan NRC Research Press, Ottawa, Canada,2000, p.571.2 P. G. Hill and R. D. C. MacMillan, Ind. Eng. Chem. Res. 27, 8741988.J. Phys. Chem. Ref. Data, Vol. 33, No. 1, 2004
376 A. H. HARVEY AND E. W. LEMMON3 P. T. Eubank, L. L. J<strong>of</strong>frion, M. R. Patel, and W. Warowny, J. Chem.Thermodyn. 20, 10091988.4 W. Warowny and P. T. Eubank, Fluid Phase Equil. 103, 771995.5 G. S. Kell, G. E. McLaurin, and E. Whalley, Proc. R. Soc. London, Ser. A425, 491989.6 I. M. Abdulagatov, A. R. Bazaev, R. K. Gasanov, and A. E. Ramazanova,J. Chem. Thermodyn. 28, 1037 1996.7 H. Hendl, E. Bich, and E. Vogel, J. Chem. Thermodyn. 29, 765 1997.8 G. S. Kell, G. E. McLaurin, and E. Whalley, J. Chem. Phys. 48, 38051968.9 M. P. Vukalovich, M. S. Trakhtengerts, and G. A. Spiridonov, ThermalEng. 14, 861967.10 N. S. Osborne, H. F. Stimson, and D. C. Ginnings, J. Res. Natl. Bur.Stand. 18, 3891937.11 N. S. Osborne, H. F. Stimson, and D. C. Ginnings, J. Res. Natl. Bur. Stand.23, 1971939.12 W. Wagner and A. P<strong>ru</strong>ß, J. Phys. Chem. Ref. Data 22, 783 1993.13 W. Wagner and A. P<strong>ru</strong>ß, J. Phys. Chem. Ref. Data 31, 387 2002.14 J. R. Cooper, Int. J. Thermophys. 3, 351982.15 S. C. Collins and F. G. Keyes, Proc. Am. Acad. Arts Sci. 72, 283 1938.16 M. L. McGlashan and C. J. Wormald, J. Chem. Thermodyn. 32, 14892000.17 C. J. Wormald, Ph.D. Thesis, University <strong>of</strong> Reading, 1964.18 E. J. LeFevre, M. R. Nightingale, and J. W. Rose, Proceedings <strong>of</strong> <strong>the</strong> 8thInternational Conference on <strong>the</strong> Properties <strong>of</strong> Water and Steam EditionsEuropéennes Thermiques et Industries, Paris, 1974, p. 461.19 S. Ertle, Dissertation, Technische Universität München, Germany, 1979.20 J. J. Hurly and M. R. Moldover, J. Res. Natl. Inst. Stand. Technol. 105,667 2000.21 M. P. Hodges, R. J. Wheatley, and A. H. Harvey, J. Chem. Phys. 116, 13972002.22 M. P. Hodges, R. J. Wheatley, and A. H. Harvey, J. Chem. Phys. 117, 71692002.23 K. Patkowski, T. Korona, R. Moszynski, B. Jeziorski, and K. Szalewicz, J.Mol. St<strong>ru</strong>ct.: THEOCHEM 591, 231 2002.24 G. K. Schenter, J. Chem. Phys. 117, 6573 2002.25 E. M. Mas, R. Bukowski, K. Szalewicz, G. C. Groenenboom, P. E. S.Wormer, and A. van der Avoird, J. Chem. Phys. 113, 6687 2000.26 C. Millot, J.-C. Soetens, M. T. C. Martins Costa, M. P. Hodges, and A. J.Stone, J. Phys. Chem. A 102, 754 1998.27 C. J. Burnham and S. S. Xan<strong>the</strong>as, J. Chem. Phys. 116, 1500 2002.28 N. Goldman, R. S. Fellers, M. G. Brown, L. B. Braly, C. J. Keoshian, C.Le<strong>for</strong>estier, and R. J. Saykally, J. Chem. Phys. 116, 10148 2002.29 A. I. Abdulagatov, A. B. Kaplun, A. B. Meshalkin, I. M. Abdulagatov, andG. V. Stepanov, J. Chem. Thermodyn. 34, 2049 2002.J. Phys. Chem. Ref. Data, Vol. 33, No. 1, 2004