Science Focus 2 TEST Chapter 7 - Pearson Australia Media ...
Science Focus 2 TEST Chapter 7 - Pearson Australia Media ...
Science Focus 2 TEST Chapter 7 - Pearson Australia Media ...

You also want an ePaper? Increase the reach of your titles
YUMPU automatically turns print PDFs into web optimized ePapers that Google loves.
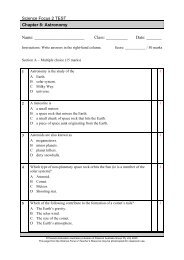
<strong>Science</strong> <strong>Focus</strong> 2 <strong>TEST</strong><br />
<strong>Chapter</strong> 7: Plant systems<br />
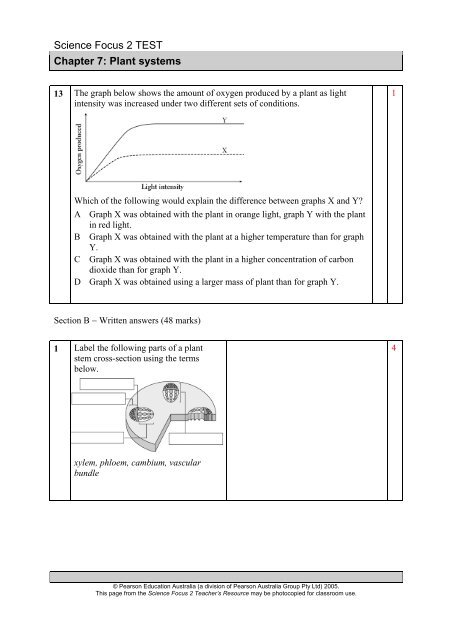
13 The graph below shows the amount of oxygen produced by a plant as light<br />
intensity was increased under two different sets of conditions.<br />
1<br />
Which of the following would explain the difference between graphs X and Y?<br />
A Graph X was obtained with the plant in orange light, graph Y with the plant<br />
in red light.<br />
B Graph X was obtained with the plant at a higher temperature than for graph<br />
Y.<br />
C Graph X was obtained with the plant in a higher concentration of carbon<br />
dioxide than for graph Y.<br />
D Graph X was obtained using a larger mass of plant than for graph Y.<br />
Section B − Written answers (48 marks)<br />
1 Label the following parts of a plant<br />
stem cross-section using the terms<br />
below.<br />
4<br />
xylem, phloem, cambium, vascular<br />
bundle<br />
© <strong>Pearson</strong> Education <strong>Australia</strong> (a division of <strong>Pearson</strong> <strong>Australia</strong> Group Pty Ltd) 2005.<br />
This page from the <strong>Science</strong> <strong>Focus</strong> 2 Teacher’s Resource may be photocopied for classroom use.