Science Focus 2 TEST Chapter 7 - Pearson Australia Media ...
Science Focus 2 TEST Chapter 7 - Pearson Australia Media ...
Science Focus 2 TEST Chapter 7 - Pearson Australia Media ...

Create successful ePaper yourself
Turn your PDF publications into a flip-book with our unique Google optimized e-Paper software.
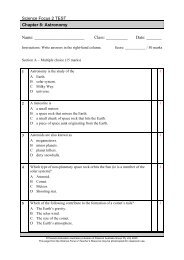
<strong>Science</strong> <strong>Focus</strong> 2 <strong>TEST</strong><br />
<strong>Chapter</strong> 7: Plant systems<br />
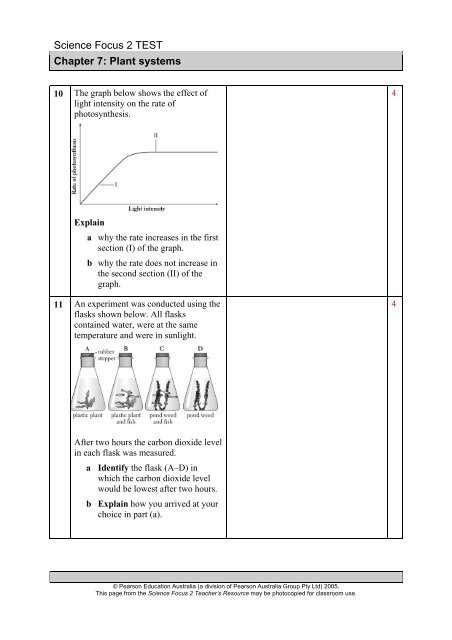
10 The graph below shows the effect of<br />
light intensity on the rate of<br />
photosynthesis.<br />
4<br />
Explain<br />
a why the rate increases in the first<br />
section (I) of the graph.<br />
b why the rate does not increase in<br />
the second section (II) of the<br />
graph.<br />
11 An experiment was conducted using the<br />
flasks shown below. All flasks<br />
contained water, were at the same<br />
temperature and were in sunlight.<br />
4<br />
After two hours the carbon dioxide level<br />
in each flask was measured.<br />
a Identify the flask (A–D) in<br />
which the carbon dioxide level<br />
would be lowest after two hours.<br />
b Explain how you arrived at your<br />
choice in part (a).<br />
© <strong>Pearson</strong> Education <strong>Australia</strong> (a division of <strong>Pearson</strong> <strong>Australia</strong> Group Pty Ltd) 2005.<br />
This page from the <strong>Science</strong> <strong>Focus</strong> 2 Teacher’s Resource may be photocopied for classroom use.