Measuring Output VSWR For An Active Levelled Source
Measuring Output VSWR For An Active Levelled Source
Measuring Output VSWR For An Active Levelled Source

Create successful ePaper yourself
Turn your PDF publications into a flip-book with our unique Google optimized e-Paper software.
original output signal and the reflected signal the phase of the returned signal is varied by some form of<br />
extendable transmission line or sliding the short or mismatch inside a fixed line. As the phase of the<br />
reflected signal is varied the combined output signal will peak when the signals are in phase, original<br />
output and reflected signals adding; and show a minima when they are in anti-phase, the reflected signal<br />
subtracting from the original output signal. The maximum to minimum level of the combined output signal<br />
gives the peak to peak value of the reflected signal. Therefore by changing the phase relationship of the<br />
two signals the original and reflected can be separated. It is possible to automate this process but it is<br />
slow and still requires a number of lines to cover the required frequency range. This technique can be<br />
used for validation purposes, but is not ideally suited for manufacturing or service centre use.<br />
With modern frequency synthesised sources such as the 9640A there is a simpler way to cause a phase<br />
variation in order to detect the maxima and minima and hence the reflected signal level. If another signal<br />
generator is used to inject a signal which has a small fixed frequency offset, say 10 Hz from the UUT<br />
output frequency, the original and reflected signals will add and subtract at a rate of 10 Hz. The second<br />
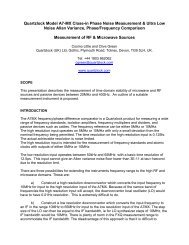
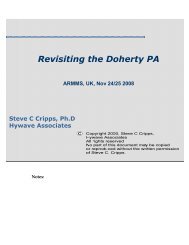
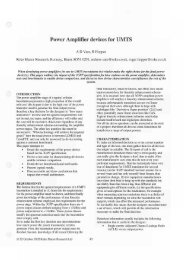
generator (another 9640A) is connected to the UUT with a return loss bridge, which also allows<br />
connection of a detector, as shown in Figures 2 and 4. If the resultant signal is detected with a spectrum<br />
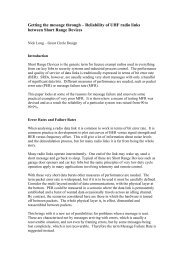
analyser the ‘zero span’ mode can be used to observe the variation in amplitude with time, using the<br />
cursors to measure the maxima and minima. With the UUT replaced by an open and a short, a reference<br />
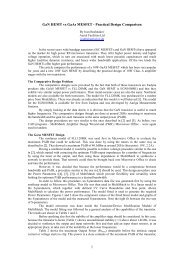
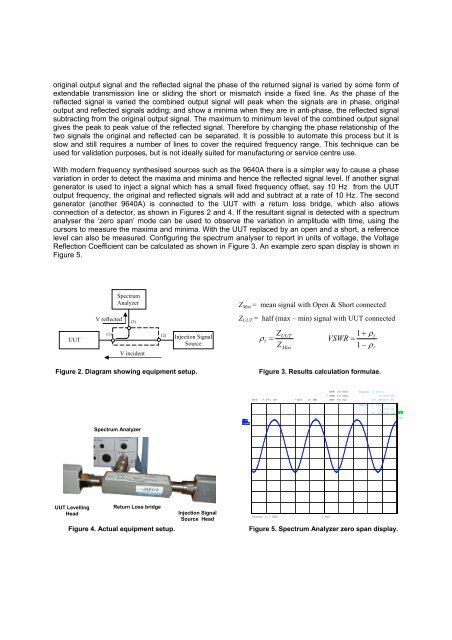
level can also be measured. Configuring the spectrum analyser to report in units of voltage, the Voltage<br />
Reflection Coefficient can be calculated as shown in Figure 3. <strong>An</strong> example zero span display is shown in<br />
Figure 5.<br />
Spectrum<br />
<strong>An</strong>alyzer<br />
Z Max = mean signal with Open & Short connected<br />
V reflected<br />
(3)<br />
Z UUT = half (max – min) signal with UUT connected<br />
UUT<br />
(1)<br />
V incident<br />
(2)<br />
Injection Signal<br />
<strong>Source</strong><br />
ρ l<br />
Z<br />
=<br />
Z<br />
UUT<br />
Max<br />
1 + ρl<br />
<strong>VSWR</strong> = 1 − ρ<br />
l<br />
Figure 2. Diagram showing equipment setup.<br />
Figure 3. Results calculation formulae.<br />
RBW 20 kHz<br />
Marker 2 [T1 ]<br />
* VBW 10 kHz<br />
4.930 mV<br />
Ref 7.071 mV<br />
* Att 10 dB<br />
SWT 50 ms<br />
29.166667 ms<br />
Marker 1 [T1 ]<br />
6.473 mV<br />
Spectrum <strong>An</strong>alyzer<br />
1 AP<br />
CLRWR<br />
1<br />
21.955128 ms<br />
A<br />
SGL<br />
2<br />
UUT Levelling<br />
Head<br />
Return Loss bridge<br />
Figure 4. Actual equipment setup.<br />
Injection Signal<br />
<strong>Source</strong> Head<br />
Center 2.7 GHz<br />
5 ms/<br />
Figure 5. Spectrum <strong>An</strong>alyzer zero span display.