SANDWICH PLATE SYSTEM RISERS FOR STADIA Dale ... - SPS
SANDWICH PLATE SYSTEM RISERS FOR STADIA Dale ... - SPS
SANDWICH PLATE SYSTEM RISERS FOR STADIA Dale ... - SPS
- No tags were found...

You also want an ePaper? Increase the reach of your titles
YUMPU automatically turns print PDFs into web optimized ePapers that Google loves.
INTRODUCTION<br />
<strong>SANDWICH</strong> <strong>PLATE</strong> <strong>SYSTEM</strong> <strong>RISERS</strong><br />
<strong>FOR</strong> <strong>STADIA</strong><br />
<strong>Dale</strong> Braun 1 , Stephen J. Kennedy 1 ,<br />
D.J. Laurie Kennedy 1 and David E. Allen 2<br />
Presented to:<br />
SSRC 2002 Annual Stability Conference<br />
24-27 April 2002<br />
Seattle, Washington, USA<br />
Intelligent Engineering (IE) has developed and patented the Sandwich<br />
Plate System (<strong>SPS</strong>), in which two metal plates are bonded to and form a<br />
sandwich with a compact polyurethane elastomer core. The elastomer<br />
provides continuous support to the plates and precludes local plate<br />
buckling and the need for stiffeners. The flexural stiffness and strength<br />
of the sandwich plate is tailored to meet particular static and dynamic<br />
structural requirements by selecting appropriate thicknesses for the<br />
sandwich elements.<br />
The CANAM-MANAC Group Inc, fabricated the steel for a double-Lshaped<br />
prototype riser section designed by Intelligent Engineering<br />
(Canada) Limited, and shown in Figure 1, in their plant in Ville de St.<br />
Georges, Quebec. The elastomer was injected by BASF Livonia, MI,<br />
USA. Both static and dynamic tests were carried out in May 2001 in<br />
the fabrication shop in Ville de St. Georges by a team with members<br />
from Intelligent Engineering 1 , Elastogran Olching, BASF Livonia,<br />
1 D. Braun, S.J. Kennedy and D.J.L. Kennedy, Intelligent Engineering<br />
(Canada) Limited, 72 Chamberlain Avenue, Ottawa, Ontario, Canada,<br />
K1S 1V9<br />
2<br />
David E Allen, Consultant, 1212-211 Wurtemburg Street, Ottawa,<br />
Ontario, Canada, K1N 8R4<br />
1
BASF Ludwigshafen and CANAM-MANAC and additional dynamic<br />
tests were carried out at BASF Toronto in November 2001. The<br />
relatively light <strong>SPS</strong> double riser unit proved most satisfactory exhibiting<br />
great strength and very good dynamic performance as described herein.<br />
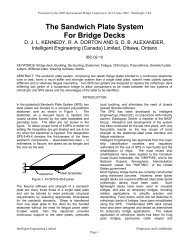
Figure 1. End view of test specimen in fabrication shop<br />
TEST SPECIMEN<br />
As fabricated, the steel plates of the 12.2 m or 40-foot long specimen<br />
with two treads, each 0.836 m or 2.74 feet wide, were nominally 3.8<br />
mm thick and the core was 32 mm thick for a total sandwich thickness<br />
of about 40 mm or 1.6 inches. The <strong>SPS</strong> designation of 4-32-4 represents<br />
the thickness in millimetres of the components. The prototype was<br />
divided into four longitudinal cavities of 3.05 m length into which the<br />
elastomer, designed to swell slightly on setting and thus to provide an<br />
optimum bond with the grit blasted steel, was injected. The injection<br />
time per cavity was just over four minutes.<br />
As seen in Figure 1, raker supports were also provided so that the riser<br />
was positioned as it would be for use in a sports stadium. The figure<br />
also shows a vertical “skirt” below the toe of the lower tread and a<br />
horizontal “skirt” adjoining the top edge of the upper riser. These were<br />
provided to correspond to the support that would be given to the riser<br />
by adjacent units in the field. With the two treads and the web of the<br />
top skirt, three horizontal surfaces are available for loading. Finite<br />
element analyses show that the two skirt reactions amounted to 25.5%<br />
of the total uniformly applied load or conversely that the two riser units<br />
of the specimen supported 74.5% of the total load. The total mass of<br />
the test specimen is estimated, based on measured dimensions and<br />
volumes of elastomer, to be 4950 kg consisting of 1280 kg of<br />
elastomer, 2110 kg of steel in the double–L risers, and 1560 kg in the<br />
two skirts. This mass (equivalent to a weight of 48.56 kN or 10.92<br />
kips) was supported as self-weight in the test. In a stadium, the skirts<br />
would not be present, but 22 seats per row, with an estimated weight of<br />
5.2 psf, would be. Therefore, the total dead load (excluding the weight<br />
of the skirts) of 8620 pounds over a total horizontal projected area of<br />
220 square feet for the two treads is 39.2 psf. (The estimated weight of<br />
6-inch thick concrete risers with seats, as has been proposed for this<br />
span, is about 125 psf or 3.2 times that of the 4-32-4 <strong>SPS</strong> risers).<br />
LOADING<br />
The prototype was loaded in two different ways. For the static load<br />
tests, to load the risers even beyond the specified live load of 100 psf,<br />
1800 concrete building blocks were used. A random sample of 100<br />
blocks was weighed in 20 groups of five on a balance. The mean<br />
weight of five blocks was 144.35 pounds. The balance was checked<br />
against an electronic scale, taken as the standard, which gave a<br />
calibration factor of 0.9893. Thus a block was taken to weigh<br />
[144.35/5] x 0.9893 = 28.56 lb or to have a mass of 12.96 kg. The 1800<br />
2
locks represent an effective distributed load supported by the tread<br />
area or riser load of 174 psf or 8.33 kPa as compared to a common<br />
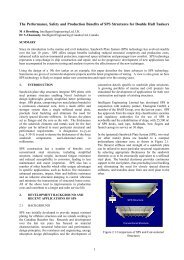
specified load of 100 psf or 4.8 kPa for sports stadia. Figure 2 shows<br />
the fully loaded specimen with the 1800 blocks stacked six high in five<br />
rows of sixty blocks each comprising two rows on each tread and one<br />
row on the upper skirt. By first loading three rows only (the two of the<br />
upper tread and the inner row on the lower tread) and then by adding<br />
the two remaining rows, a total of 12 load steps were achieved within<br />
the six layers. It was impractical to load the risers further.<br />
weight of the two skirts as they would not be present in the actual<br />
structure, is 45 530 pounds. Thus, the riser specimen was loaded to<br />
1.02 of the total factored load level in the static test. (The National<br />
Building Code of Canada load factors are 1.25 for dead load and 1.5 for<br />
live load resulting in a factored load of 43 770 pounds and a prototype<br />
load of 1.06 times the total factored load level).<br />
The second method of loading was with three rows of 22 people each.<br />
This basic loading was applied in two different settings. First,<br />
CANAM-MANAC workers stood evenly spaced along the two treads<br />
and on the top skirt as shown in Figure 3. On average, these workmen<br />
weighed 190.7 pounds each (a mass of 86.5 kg). Allowing for the load<br />
carried by the top and bottom skirts, as described previously, the<br />
Figure 2. Loading with concrete building blocks<br />
The total weight supported in the test, including the self-weight of the<br />
risers and skirts of 10 910 pounds, was 62 320 pounds of which 74.5%<br />
or 46 370 pounds was supported by the risers themselves. With dead<br />
and live load factors of 1.2 and 1.6 respectively, as specified in ASCE<br />
7-98 Minimum Design Loads for Buildings and Other Structures, the<br />
total factored load to be supported on 220 square feet, excluding the<br />
Figure 3. Three rows of 22 workers, 42.6 psf or 2.04 kPa<br />
3
uniformly distributed load on the risers amounted to 42.6 psf or 2.04<br />
kPa. Second, a like number of BASF office personnel in Toronto sat on<br />
folding chairs in two rows with a third row standing on the top skirt as<br />
shown in Figure 4. The average weight was 177.7 pounds or the mass<br />
was 80.6 kg equivalent to 39.7 psf or 1.90 kPa. These loadings are<br />
respectively about 1.22 and 1.13 times heavier than the static live load<br />
of 35 psf usually associated with full sports stadia. The loadings with<br />
people provide a basis for the qualitative evaluation of the riser under<br />
loads simulating field conditions as discussed later and for the<br />
quantitative evaluation of vibration characteristics.<br />
specimen at both tread-riser junctions and under the bottom skirt. A<br />
limited number of strain gauges were also used to provide back-up<br />
measurements but these data are not reported here.<br />
Two accelerometers, provided and operated by Elastogran GmbH, were<br />
used to measure the vibration response of the test specimen. One was<br />
capable of measuring vertical accelerations and the second of<br />
measuring the response in three dimensions. The accelerometers were<br />
mounted on the unloaded face of the upper tread at mid-span. The<br />
specimen was excited dynamically in several ways and the vibration<br />
response recorded electronically. When loaded with blocks, the<br />
specimen was excited by a blow of a hammer, by a person jumping<br />
lightly, or by lifting one end of the riser from the floor with the<br />
overhead crane and then letting it fall. When loaded with workers,<br />
rhythmic movements of the workers, a heel drop, or one person<br />
jumping from one level to another were used.<br />
STATIC TESTS<br />
Figure 4. Three rows of 22 people, 39.7 psf or 1.90 kPa<br />
INSTRUMENTATION<br />
In the static tests, the vertical and horizontal deflections at mid-span<br />
were measured using mechanical dial gauges on the underside of the<br />
When the riser prototype is loaded vertically under gravity loads, such<br />
as with the weight of the concrete blocks, it deflects vertically<br />
downward and horizontally towards the rear. This occurs because the<br />
principal flexural axes are inclined to the horizontal with the major axis<br />
(at an angle of 31.8° to the horizontal and intersecting the treads at<br />
about their mid-width and mid-thickness). The vertical load has<br />
components parallel to the major and minor principal axes and the<br />
resulting bending moments cause deflections about the two axes that<br />
are inversely proportional to the respective flexural stiffnesses.<br />
In Figure 5 are plotted the mean vertical and horizontal mid-span<br />
deflections against the total load supported by the risers themselves, i.e.<br />
the total applied load multiplied by 0.745 to obtain that portion carried<br />
by the risers and thus excluding the portion supported by the top and<br />
bottom skirts. Under uniform loading it is anticipated that all identical<br />
riser treads would deflect the same amount. Hence, it is valid to<br />
4
consider the mean deflections, thus eliminating any deviations from<br />
uniformity of either the riser geometry or the loading. The deflections<br />
plotted are the net deflections of the risers with respect to the rakers.<br />
Applied load on riser, kPa<br />
10<br />
8<br />
6<br />
4<br />
2<br />
0<br />
horizontal<br />
vertical<br />
0 5 10 15 20 25 30<br />
Mean midspan deflection, mm<br />
Figure 5. Load midspan deflection curves<br />
The load-deflection curves are linear to the maximum test value that is<br />
slightly in excess of the factored load level. The slight irregularities in<br />
the plots are attributed to the loading sequence where, in the load steps<br />
with partial layers, the load is not quite uniformly distributed from top<br />
to bottom across the width of the risers. The horizontal deflection is<br />
about 0.53 times the vertical deflection. The maximum deflection, the<br />
vector sum of the two components, at the maximum load is<br />
approximately 30 mm or 1/400 of the span centre-to-centre of supports.<br />
At the specified load level of 4.8 kPa or 100 psf, the deflection is only<br />
17.0 mm or 1/700 of the span. Finite element analyses based on<br />
measured geometry and nominal mechanical stiffness properties for the<br />
elastomer and steel essentially confirm the measured deflections with<br />
calculated deflections about 10% greater than the measured values.<br />
This difference is considered to be due to a combination of two factors.<br />
First, the calculated deflections are based on nominal values of the<br />
flexural stiffnesses or EI. These are likely less than the actual values for<br />
the heavily rolled thin steel used in the risers. Second, slight<br />
inaccuracies in the testing carried out in the field could have occurred in<br />
less than ideal laboratory conditions.<br />
The prototype carried the factored load without any inelastic action. No<br />
buckling of the very thin steel plates, supported laterally by the<br />
elastomer to which they are bonded, occurred. The load that could be<br />
carried at failure would be greater by that needed to take the riser cross<br />
section to incipient yielding of the steel and is likely to be that to cause<br />
full plastification of the cross section (other tests on flat <strong>SPS</strong> flexural<br />
specimens have shown this to be the case). This latter load is the true<br />
measure of the strength of the <strong>SPS</strong> riser prototype. The <strong>SPS</strong> riser<br />
prototype is considered to have a strength considerably in excess of that<br />
needed to carry the factored loads.<br />
The maximum deflection at the specified load level of only 1/700 of the<br />
span, more than meets common deflection criteria for building floors of<br />
1/300 of the span.<br />
DYNAMIC TESTS<br />
To determine the dynamic properties of the <strong>SPS</strong> risers, vibrations were<br />
induced by heel drop tests, by a person jumping from one tread to<br />
another or even by dropping one end of the riser a few centimetres to<br />
the floor. These tests were carried out with the risers loaded with<br />
different numbers of layers of concrete blocks, or with people.<br />
Observations were made as load was added to the specimen and again<br />
as the load was reduced. The raw data were low-pass filtered, at 10 Hz,<br />
to remove high frequency vibrations and noise that do not affect human<br />
reaction to vibration.<br />
5
Figure 6 gives the measured fundamental natural frequency as a<br />
function of the load carried by the risers. The natural frequency<br />
decreases from about 6 Hz or more when unloaded to 2.7 Hz at an<br />
applied load of 8.33 kPa. This trend follows the well-known<br />
relationship that the natural frequency is inversely proportional to the<br />
square root of the mass. At the specified load level of 4.8 kPa the<br />
natural frequency is about 3.2 Hz and at the likely load level of 1.7 kPa<br />
or 35 psf it is about 5 Hz or more.<br />
10<br />
9<br />
8<br />
7<br />
6<br />
5<br />
4<br />
Excitation by:<br />
human movement<br />
crane drop<br />
Acceleration, g<br />
0.08<br />
0.06<br />
0.04<br />
0.02<br />
0<br />
-0.02<br />
-0.04<br />
-0.06<br />
-0.08<br />
0.03<br />
1.5 2.0 2.5 3.0 3.5 4.0 4.5 5.0 5.5<br />
Time, seconds<br />
(a) Jump on unloaded riser<br />
3<br />
2<br />
1<br />
0<br />
Likely live<br />
load, 1.7 kPa<br />
Specified live<br />
load, 4.8 kPa<br />
0 1 2 3 4 5 6 7 8 9 10<br />
Load on risers, kPa<br />
Figure 6. Resonant frequency versus load on risers<br />
Figures 7a and 7b show 10 Hz low-pass filtered vibration records of<br />
acceleration versus time for two cases, one with two persons on the<br />
risers producing a negligible load, and the other with 66 people<br />
producing a load on the risers of 1.90 kPa. Excitation was caused by a<br />
person jumping from one tread to another and by a heel drop<br />
respectively. The damping ratio was calculated over a vibration decay<br />
time period where the peak acceleration had decreased to about one<br />
Acceleration, g<br />
0.02<br />
0.01<br />
0<br />
-0.01<br />
-0.02<br />
-0.03<br />
0 0.2 0.4 0.6 0.8 1 1.2 1.4 1.6 1.8 2<br />
Time, seconds<br />
(b) Heel drop on fully loaded riser<br />
Figure 7. Acceleration–time curves<br />
6
tenth of the peak acceleration at the start of the time interval from the<br />
relationship:<br />
⎡ ⎛ y ⎤<br />
0<br />
⎞<br />
⎢ln<br />
⎜<br />
⎟⎥<br />
1 ⎢ ⎝ y1<br />
⎠<br />
β =<br />
⎥<br />
π ⎢ − ⎥<br />
[1]<br />
2 f<br />
n<br />
t<br />
1<br />
t<br />
0<br />
⎢ ⎥<br />
⎢⎣<br />
⎥⎦<br />
where f n is the natural frequency and y 0 and y 1 are the peak<br />
accelerations at the beginning and end of the vibration decay time<br />
period t 1 -t 0 selected to give a value of y 0 /y 1 of approximately 10. The<br />
damping ratio, taken as the average of that computed from the positive<br />
and negative peaks in Figure 7 was determined to be 2.1% with the<br />
seats unoccupied and 14.1% with the seats occupied. The value of<br />
2.1% as compared to about 1% for bare steel or pre-stressed concrete<br />
alternatives suggests superior performance for the <strong>SPS</strong> risers. This is<br />
attributed to the inherent energy-absorption characteristics of the<br />
elastomer itself. For the fully loaded stands, the “soft” mass of the<br />
people increases the damping significantly as the damping ratio shows.<br />
Acceleration, g<br />
0.15<br />
0.1<br />
0.05<br />
0<br />
-0.05<br />
-0.1<br />
0.15<br />
0 1 2 3 4 5<br />
Time, seconds<br />
(a) Excitation frequency 2.3 Hz<br />
Figures 8(a) and 8(b) are acceleration-time records of simulated rock<br />
concerts in which half the people sat and stamped with one foot while<br />
the other half “jounced” in a standing position by inducing vertical<br />
movement with forward and backward knee movements. The figures<br />
are for two beat frequencies of 2.3 and 2.75 Hz as noted. Third and<br />
fourth beat frequencies of 2.0 and 2.6 Hz, not reported here, gave<br />
similar results. The peak accelerations, from all acceleration-time<br />
records, reach 0.10 g to 0.13 g. The vibrations were clearly perceptible<br />
to three inactive observers in the stands but were considered acceptable<br />
by all observers for all beat frequencies. The vibrations felt similar for<br />
all frequencies because of the high damping provided by the mass of<br />
the spectators. The acceleration-time records show that acceleration<br />
nearly dies out in the short time interval between excitations, such that<br />
there is very little resonance build-up.<br />
Acceleration, g<br />
0.1<br />
0.05<br />
0<br />
-0.05<br />
-0.1<br />
0 1 2 3 4 5<br />
Time, seconds<br />
(b) Excitation frequency 2.75 Hz<br />
7
Figure 8. Acceleration–time records of simulated rock concerts<br />
This reduction is also seen by comparing the vibration decay time<br />
period of approximately 0.6 seconds in Figure 7(b) with 3 seconds in<br />
7(a). For an excitation frequency of 2.3 Hz, second harmonic resonance<br />
build-up was expected at a frequency of 4.6 Hz, but this did not occur.<br />
The vibration, therefore, is primarily the repeated impact responses<br />
rather than continuous resonance vibration.<br />
The frequency spectra in Figures 9(a) and 9(b) of the acceleration-time<br />
records of Figures 8(a) and 8(b) respectively, show that most of the<br />
vibration occurs at multiples (harmonics) of the beat frequency. The<br />
broader spikes in the frequency spectrum for 2.3 Hz in Figure 9(a),<br />
indicates that the participants were not in step and, as a result, the<br />
vibration was more variable and less harmonic than in Figure 9(b). This<br />
also reduced the resonance build-up that was expected to occur at the<br />
second harmonic of 4.6 Hz.<br />
in turn attached by springs of the requisite stiffness to the ground,<br />
should be carried out to assess the overall dynamic performance of the<br />
system. The effective damping ratio of the structure occupied by<br />
people and vibrating at its natural frequency, however, would need to<br />
be re-evaluated.<br />
Acceleration, g<br />
0.015<br />
0.01<br />
0.005<br />
0<br />
0 2 4 6 8 10<br />
Frequency, Hz<br />
In a moving “wave” test in which all persons stood up quickly, raised<br />
their arms and then sat down, no vibrations were felt because all<br />
persons participated and there were no passive observers.<br />
Walking tests were conducted when there were only a few persons on<br />
the risers when the damping was a minimum. The data for one test with<br />
a person walking with a step frequency of 1.7 to 1.9 Hz indicated a<br />
peak acceleration of 0.03g but was more disturbing to an observer than<br />
the higher accelerations during the “rock concert” vibrations. However,<br />
for a completed stadium with risers well connected to one another, the<br />
mass to be excited would be considerably larger than for the test.<br />
Consequently the walking acceleration would be reduced<br />
correspondingly. This should be assessed by a finite element dynamic<br />
analysis of a typical complete riser section.<br />
Acceleration, g<br />
0.03<br />
0.02<br />
0.01<br />
0.00<br />
(a) Excitation frequency 2.3 Hz<br />
0 2 4 6 8 10<br />
Frequency, Hz<br />
(b) Excitation frequency 2.75 Hz<br />
For a stadium with risers on flexible supports, dynamic analyses of riser<br />
sections attached to a mass of the requisite weight at each support and<br />
Figure 9. Frequency spectra<br />
8
ATTACHMENT OF SEATS<br />
As is the case for prestressed concrete risers, the seats are attached to<br />
the vertical face by threaded anchor rods epoxied into blind holes<br />
drilled into the elastomer. In this case the length of embedment is<br />
limited to the thickness of the elastomer core and one face- plate, that is<br />
36 mm. In Figure 10 one of the two anchor rods, on the left side of the<br />
seat as faced, is visible.<br />
The normal configuration is that each side has two anchor rods which<br />
are arranged horizontally for interior supports and vertically for end<br />
supports. The anchor rods are subject to tension when the seats are<br />
loaded and the standard test is to determine the pull-out strength of the<br />
connection by pulling on extended threaded anchor rods. Failure occurs<br />
when the epoxy shears off at the crests of the threads. Thus it was not<br />
unexpected that failure loads for anchors epoxied into elastomer where<br />
about the same as those epoxied into the same depth of concrete. Fortyfour<br />
tests done on either pairs of anchor rods or some special tests on<br />
single rods gave test strengths per anchor bolt ranging from 2000 to<br />
6000 pounds with a mean of 4630 pounds and a rather large coefficient<br />
of variation of 0.244. Taking seat dimensions of 3.5 inches from the<br />
lower extremity to the centre line of the anchor rods in the horizontal<br />
configuration and 19.75 inches from the lip of the seat to the riser face,<br />
the load applied on the lip of a seat to cause pull-out of a pair of<br />
anchors would have minimum and mean values of 700 pounds and<br />
1640 pounds respectively. Using limit states design principles, based<br />
on a reliability index of 3.5 and taking the nominal strength as 4500<br />
pounds, a resistance factor of 0.62 is established to give a factored pullout<br />
resistance per rod of 2800 pounds. The specified load per seat,<br />
applied at the lip, using a live load factor of 1.6, is thus 620 pounds or<br />
several times the weight of a large man, more than ample to allow for<br />
the dynamic effect of a person stepping down from one row to another.<br />
SUMMARY<br />
Figure 10. Seat attachment to vertical face of riser<br />
In the static tests, the prototype displayed considerably more strength<br />
than required as exemplified by the linearly elastic behaviour to slightly<br />
above the factored load level. No buckling of the thin steel faceplates,<br />
which are supported laterally by the elastomer, occurred. There is<br />
reserve strength beyond this that could be considerable, but was not<br />
determined in the field tests where testing procedures were limited.<br />
Further inelastic finite element analyses are planned. The mid-span<br />
deflection at the full specified load level of 4.8 kPa or 100 psf was a<br />
meagre 1/700 of the span as compared with a deflection limit of 1/300<br />
commonly specified for building floors.<br />
The observed dynamic performance was very good as compared to that<br />
expected of all-steel or pre-stressed concrete alternatives. The natural<br />
frequency of the risers with a. span of 40 feet on stiff supports,<br />
decreases with increasing load from a value of 6 Hz or more when<br />
unloaded to approximately 5 Hz at the likely live load of 1.7 kPa and<br />
just over 3 Hz at the full specified load level of 4.8 kPa. The damping<br />
9
atio was established at about 2% of critical for the bare stands and<br />
about 14% when fully occupied. The damping ratio for the bare stands<br />
compares favourably with that of about 1% for steel or prestressed<br />
concrete structures of like span. The soft mass of spectators increases<br />
the damping ratio considerably.<br />
basis, some further weight savings may be achieved while still meeting<br />
the required strength and dynamic performance. Both the static and<br />
dynamic performance are considered more than acceptable and at least<br />
comparable to that of all-steel or precast concrete alternatives. Seats can<br />
be anchored adequately by epoxy to the vertical riser face.<br />
In simulated rock concerts it was not possible to induce resonance<br />
build-up because the induced vibrations nearly died out between<br />
impacts due to high damping provided by the occupants. The vibration<br />
therefore, is primarily the repeated impact responses rather than<br />
continuous resonance vibration. The vibrations were clearly perceptible<br />
to three inactive observers in the stands but were considered acceptable<br />
by all observers at the simulated rock concert for all beat frequencies.<br />
Walking tests on the bare stands when the damping was a minimum<br />
indicated a peak acceleration of 0.03g and was more disturbing to an<br />
observer than the “rock concert” vibrations. However, risers well<br />
connected to one another in a completed stadium would have<br />
considerably reduced accelerations because of the increased mass to be<br />
accelerated.. This could be assessed by a finite element dynamic<br />
analysis of a typical complete riser section.<br />
ACKNOWLEDGEMENTS<br />
The risers were fabricated by CANAM-MANAC Group, Inc in St.<br />
Georges QC, Canada and the elastomer injected there by BASF Corp,<br />
Livonia MI, USA. The dynamic measurements were made by Daniel<br />
Francke of BASF Ludwigshafen, Germany. David Allen was<br />
responsible overall for the dynamic testing, supervised the testing,<br />
provided advice and interpreted the test results. The assistance of all<br />
participants is gratefully acknowledged.<br />
For a stadium with risers on flexible supports, dynamic analyses of riser<br />
sections attached to a mass of the requisite weight at each support and<br />
in turn attached by springs of the requisite stiffness to the ground,<br />
should be carried out to assess the overall dynamic performance of the<br />
system. This, however, would require a re-evaluation of the effective<br />
damping ratio of the occupied structure vibrating at its natural<br />
frequencies.<br />
The 4-32-4 <strong>SPS</strong> prototype riser as tested provides a viable lightweight<br />
alternative to pre-stressed concrete risers weighing, including the fixed<br />
seats, only 39.2 psf or about 30% of the latter. In a production line<br />
10