samtel
samtel
samtel

You also want an ePaper? Increase the reach of your titles
YUMPU automatically turns print PDFs into web optimized ePapers that Google loves.
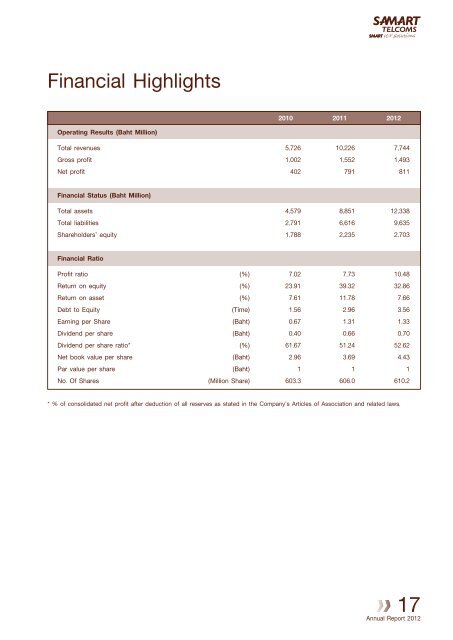
Financial Highlights<br />
<br />
2010 2011 2012<br />
Operating Results (Baht Million)<br />
Total revenues 5,726 10,226 7,744<br />
Gross profit 1,002 1,552 1,493<br />
Net profit 402 791 811<br />
<br />
Financial Status (Baht Million)<br />
Total assets 4,579 8,851 12,338<br />
Total liabilities 2,791 6,616 9,635<br />
Shareholders’ equity 1,788 2,235 2,703<br />
<br />
Financial Ratio<br />
Profit ratio (%) 7.02 7.73 10.48<br />
Return on equity (%) 23.91 39.32 32.86<br />
Return on asset (%) 7.61 11.78 7.66<br />
Debt to Equity (Time) 1.56 2.96 3.56<br />
Earning per Share (Baht) 0.67 1.31 1.33<br />
Dividend per share (Baht) 0.40 0.66 0.70<br />
Dividend per share ratio* (%) 61.67 51.24 52.62<br />
Net book value per share (Baht) 2.96 3.69 4.43<br />
Par value per share (Baht) 1 1 1<br />
No. Of Shares (Million Share) 603.3 606.0 610.2<br />
<br />
* % of consolidated net profit after deduction of all reserves as stated in the Company’s Articles of Association and related laws.<br />
17<br />
Annual Report 2012