EPDs), Carlsberg
EPDs), Carlsberg
EPDs), Carlsberg

You also want an ePaper? Increase the reach of your titles
YUMPU automatically turns print PDFs into web optimized ePapers that Google loves.
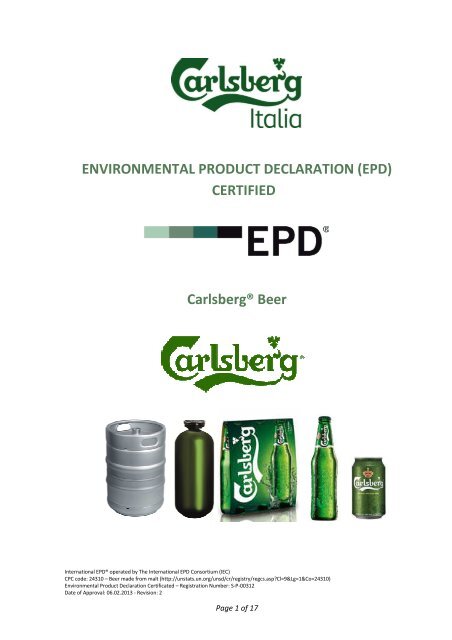
ENVIRONMENTAL PRODUCT DECLARATION (EPD)<br />
CERTIFIED<br />
<strong>Carlsberg</strong>® Beer<br />
International EPD® operated by The International EPD Consortium (IEC)<br />
CPC code: 24310 – Beer made from malt (http://unstats.un.org/unsd/cr/registry/regcs.asp?Cl=9&Lg=1&Co=24310)<br />
Environmental Product Declaration Certificated – Registration Number: S-P-00312<br />
Date of Approval: 06.02.2013 - Revision: 2<br />
Page 1 of 17
1. SCOPE OF THE DECLARATION<br />
This document, known as an EPD (Environmental Product Declaration), is aimed at those interested<br />
in understanding and verifying the environmental impact generated through the entire life cycle of<br />
<strong>Carlsberg</strong> ® beer. The document provides a reliable quantification and certification of the<br />
environmental performance of the product, according to a scientific methodology that contemplates<br />
the impacts of the product’s life cycle, the Life Cycle Assessment – LIFE CYCLE ASSESSMENT (ISO<br />
14040-14044).<br />
2. ORGANIZATIONAL DESCRIPTION<br />
The story of <strong>Carlsberg</strong> Italy dates back almost two centuries to 1876, when Angelo Poretti founded<br />
the Induno Olona establishment that took the name Poretti Industries.<br />
It was only after the war that Poretti industries, one of the cornerstones of beer production in Italy,<br />
attracted the interest of an international group that in the 1970s began to broaden their horizons:<br />
the United Breweries Group A/S (which later took the name of the <strong>Carlsberg</strong> Group), was born from<br />
the merger in 1970 of two historical Danish companies, <strong>Carlsberg</strong> and Tuborg. In 1975 the industries<br />
signed with the Danish group the first agreement for the production and marketing of the Tuborg<br />
and <strong>Carlsberg</strong> brands.<br />
This innovative agreement proved decisive for the fortune of Poretti industries, as the <strong>Carlsberg</strong><br />
Group acquired the company’s shares over the years and in 1998 became <strong>Carlsberg</strong> Italy, and in 2002<br />
became wholly Danish.<br />
Today, <strong>Carlsberg</strong> Italy manufactures and sells approximately 1 million and 500 thousand hectolitres<br />
of beer through the following brands: <strong>Carlsberg</strong>, Tuborg, BAP Chiara Originale, BAP Bock Chiara and<br />
BAP Bock Rossa (covered by certified <strong>EPDs</strong>), <strong>Carlsberg</strong> Elephant, <strong>Carlsberg</strong> Special Brew, Tuborg Light,<br />
Corona-Extra, Splügen, Holsten, Tucher, Negra Modelo, Modelo Especial, Devil's Kiss, Super Devil's<br />
Kiss, Grimbergen and Feldschlösschen.<br />
<strong>Carlsberg</strong> Italy, moreover, through the acquisition of numerous companies of beverage distributors<br />
throughout Italy, has created <strong>Carlsberg</strong> Ho.Re.Ca, the distribution network dedicated to the Ho.Re.Ca<br />
(Hotellerie-Restaurant-Café) channel that offers an extensive catalogue of products and services able<br />
to meet all the various needs and strategies of sales outlets.<br />
From the 9th February 2005 the production factory of Induno Olona, in which are produced<br />
<strong>Carlsberg</strong> Italia beers, has incorporated an environmental management system conforming to ISO<br />
14001: 2004, certified by Lloyds's Quality Assurance register (certificate of approval No.: LRC<br />
141249/14).<br />
The environmental management system applies to:<br />
"the production of beer from the receiving of raw materials up to the consignment of the finished<br />
product to the pallet".<br />
Page 2 of 17
3. PRODUCT DESCRIPTION<br />
3.1. Characteristics<br />
The characteristics of the product covered by this statement is the beer brand <strong>Carlsberg</strong>®, produced<br />
by <strong>Carlsberg</strong> Italy at its plant in Induno Olona and intended for sale at pubs, bars, restaurants and<br />
points of sale of mass retail channels.<br />
The identifier of the product according to the classification CPC (Central Product Classification) is:<br />
Beer made from malt – CPC 24310.<br />
The same product is evaluated in three different distribution scenarios:<br />
• Steel kegs of 25 l;<br />
• Draught Master Modular 20 (DM Modular 20) drums of 20Ltr;<br />
• Disposable glass bottles of 33 cl, loose for sale on Ho.Re.Ca channel, in selling unit of 3 bottles<br />
for mass retail channel<br />
• 33cl aluminium cans<br />
For the three distribution scenarios, the shelf life of the beer within specific containers was<br />
considered as follows:<br />
• 6 months for beer kept in steel kegs;<br />
• 9 months for beer stored in DM Modular 20 drums;<br />
• 15 months for beer in glass bottles;<br />
• 12 months for beer in aluminium cans.<br />
Regarding the annual consumption of beer per year, the size of the container, as well as the shelf life<br />
have an impact on the quantity of product purchased from outlets, and therefore on the frequency<br />
of supply of each store.<br />
The composition of the product as supplied in three different containers, is as follows:<br />
Steel keg (100 l – 4 kegs)<br />
DM Modular 20 keg (100 l – 5 kegs)<br />
Beer 100 kg 75,76% Beer 100 kg 95,43%<br />
Keg (99,9% steel, completely<br />
recycled)<br />
32 kg 24,24%<br />
Keg (70,7% PET, 20% PP, 4,7%<br />
nylon, 3,1% ink, 1,5% other<br />
Glass bottle – Mass retail channel (100 l – 303<br />
bottles)<br />
Glass Bottle - Ho.Re.Ca (100 l – 303 bottles)<br />
Beer 100 kg 59,09% Beer 100 kg 59,11%<br />
Bottle (glass, 68% recycled) 65,15 kg 38,50% Bottle (glass, 68% recycled) 65,15 kg 38,51%<br />
Cap POC (aluminium) 0,60 kg 0,36% Cap POC (aluminium) 0,60 kg 0,36%<br />
Label (paper) 0,13 kg 0,08% Label (paper) 0,13 kg 0,08%<br />
Tray (paperboard) - 75g for 24<br />
bottles<br />
Shrink wrap (PE) - 25,1 g for<br />
24 bottles<br />
Packaging for selling unit<br />
(paperboard) - 20,5g for 3<br />
bottles<br />
0,95 kg 0,56%<br />
0,32 kg 0,19%<br />
2,07 kg 1,22%<br />
Packaging (paperboard) –<br />
261g for 24 bottles<br />
3,30 kg 1,95%<br />
33cl Can (100 l - 303 Cans)<br />
Beer 100 kg 94,98%<br />
Can (aluminium, 27%<br />
recycled)<br />
3,21 kg 3,05%<br />
Cap (aluminium) 0,78 kg 0,75%<br />
Tray (paperboard) – 80 g for<br />
24 cans<br />
Shrink wrap (PE) – 21,5 g for<br />
24 cans<br />
1,01 kg 0,96%<br />
0,27 kg 0,26%<br />
3.2. Functional Unit<br />
The functional unit is represented by 100 l of beer drummed/bottled and delivered to final<br />
consumers (pubs, bars, restaurants, mass retail channel points of sale).<br />
The functional unit is based on the production during the reference year 2011, and represents the<br />
reference unit of all results of this Declaration.<br />
3.3. Declaration of Contents<br />
<strong>Carlsberg</strong> is a beer made from malt only, at low fermentation, belonging to the Lager segment. The<br />
organoleptic characteristics are those of a refined and elegant beer 1 ; the hops which characterize<br />
<strong>Carlsberg</strong> exalt the fragrance of aromas in its special characteristics. The following are the product<br />
characteristics:<br />
1 All characteristics reported in this chapter refers to a classification used in beer world, developed by a trade magazine in 1994 with<br />
Assobirra partnership and with brewer technician association AITB support.<br />
Page 4 of 17
PRODUCT CHARACTERISTICS<br />
PRODUCT SPECIFICS<br />
COMMERCIAL CAT. Superpremium ALCOHOL CONTENT 5.0% alc. vol.<br />
LEGAL CAT. Beer ATTENUATION 70%<br />
STYLE Lager REAL EXTRACT 3.30%<br />
COLOR TYPE Clear COLOR 7.0<br />
FOAM Fine BITTER UNITS (BU) 20<br />
ASPECT<br />
Limpid<br />
COLOR Straw NUTRITIONAL INFORMATION PER 100<br />
AROMA INTENSITY<br />
Normal<br />
ml OF PRODUCT<br />
AROMA ELEGANCE Normal ENERGY 41 kcal (171 kJ)<br />
CARBONATION Moderate PROTEIN 0.2 g<br />
BODY Light FAT 0.0 g<br />
BITTERNESS Moderate CARBOHYDRATES 3.3 g<br />
BALANCED TASTE<br />
Correct<br />
STRENGTH OF AFTERTASTE Restricted<br />
DURATION OF AFTERTASTE Sufficient<br />
RAW MATERIALS<br />
Water<br />
Malt<br />
Hops<br />
3.4. Description of the Production Process<br />
Beer production can be divided into three main phases: cooking the wort, fermentation and<br />
filtration.<br />
During the first stage, which takes place in the cooking room, the barley malt is milled until a certain<br />
type of flour is obtained. This is then mixed with hot water, thereby obtaining the wort (the brew).<br />
The liquid part of the wort is separated from the solid part through filtration and grains, through<br />
which a waste product is obtained, recovered and sold on as animal feed. In this respect, the<br />
environmental impacts associated with the percentage of barley malt, which contributes to the<br />
production of spent grains, have already been allocated and therefore are not borne by the present<br />
LCA study. Allocation of environmental impacts of spent grains is based on mass.<br />
The next step is to filter the wort cooking inside appropriate boilers. This is essential for the type of<br />
beer to be produced and the sterilization of the wort. It is during this phase that hops are also added.<br />
During boiling, insoluble complexes are formed that constitute the so-called trub, that is eliminated<br />
through clarification.<br />
The next stage is that of fermentation. The wort is cooled down to temperatures which allow<br />
fermentation to occur, oxygen is then injected in the process at an early stage, which takes place<br />
under aerobic conditions.<br />
Next is the addition of yeast and the fermentation process itself. From this process we have the<br />
production of CO2, which is almost entirely recovered to be used in other production phases in which<br />
it is required.<br />
At the end of fermentation, the beer is left in maturing tanks so that residues of yeast can settle on<br />
the bottom.<br />
Page 5 of 17
The final phase is that of filtration, where the beer undergoes a series of operations to remove<br />
residues of yeast and other murky substances present, therefore, such a stabilisation process is<br />
designed to make the beer unalterable before being drummed or bottled.<br />
3.5. The Boundaries of the Analysed System<br />
The system boundaries analysed in the LCA study include all phases of the life cycle of production of<br />
beer, from the cultivation of ingredients to the disposal of drums and bottles after consumption.<br />
In particular, the system includes the following life cycle phases:<br />
• "upstream processes 2 ":<br />
• the production phase and the transport of kegs, bottles and cans (including all related<br />
packaging materials, of all typologies and with the highest degree of detail achievable);<br />
• the production phase and transport of raw materials and additives for the beer<br />
production process;<br />
• "core processes”:<br />
• the beer production phase;<br />
• the beer kegging and bottling phases;<br />
• “downstream processes”:<br />
• the phases of distribution of the finished product;<br />
• maintenance activities of plants located at final points of sale;<br />
• consumption occurring during usage phase of beer lines;<br />
• the end of life phases (transport to disposal and collection centres, landfill disposal and<br />
potential recovery of materials and energy 3 ).<br />
Emissions associated to production of used electricity are ascribed to phases where consumption<br />
occurs.<br />
Excluded from the system boundaries are the environmental loads associated with construction and<br />
maintenance of production facilities.<br />
To assure the homogeneity of the results, a unique distribution scenario of finished product has been<br />
adopted, defined on the base of weighted average distances for each route on all distribution<br />
channels actually used during the reference year.<br />
2<br />
In the "General Programme Instructions" of the international EPD ® IEC (www.environdec.com) "upstream processes" are considered as<br />
those which include the acquisition of raw materials and semi-finished or intermediate components, "core process" those undertaken in<br />
the establishment of production of products covered by the EPD, "downstream processes" processes related to the use phase and end of<br />
life scenario.<br />
3 For plastic, glass, paper and aluminium end of life scenarios, national percentages published on annual reports of Consorzio Recupero<br />
Plastica (Co.Re.Pla) (“Relazione sulla Gestione”, 2011), Consorzio Recupero Vetro (Co.Re.Ve) (“Risultati 2011 – Raccolta e Riciclo del<br />
Vetro”), Consorzio Nazionale Recupero e Riciclo degli Imballaggi a Base Cellulosica (COMIECO) (“XVI Rapporto Comieco”, 2011) and<br />
Consorzio Imballaggi Alluminio (CiAl) (Risultati 2011) have been used.<br />
Page 6 of 17
The boundaries of the system are schematically represented in the figure below:<br />
3.6. Time Periods and Data Sources<br />
The comparability between <strong>EPDs</strong> of different products must also be ensured on the basis of time. To<br />
this end, it is clarified that the LCA study that gave rise to this EPD refers to the production of beer<br />
<strong>Carlsberg</strong> ® in the establishment in Induno Olona in one calendar year. The base year for the data<br />
and indicators presented in this EPD is 2011.<br />
The data used for the LCA were directly measured at the establishment of Induno Olona and supplied<br />
directly by the main suppliers of the plant. According to General Programme Instructions “other<br />
generic” data do not exceed 10%.<br />
Excluded from the system, due to their contribution lower than 1% on total impacts, are:<br />
o The supply of yeast;<br />
o Additives of the beer recipe;<br />
Page 7 of 17
4. DECLARATION OF ENVIRONMENTAL PERFORMANCE<br />
All data quantities below relate to the functional unit chosen for the EPD: 100L of beer<br />
bottled/barrelled and delivered to final consumers (at pubs, bars, restaurants).<br />
RESOURCES USE 4<br />
Steel Kegs<br />
DM Modular<br />
20 kegs<br />
Glass<br />
Bottles<br />
Aluminium<br />
Cans<br />
NON RENEWABLE RESOURCES<br />
Material Resources kg 3,49 3,04 32,69 26,72<br />
Of which:<br />
Crude Oil (feedstock) kg 0,01 1,16 2,00 3,78<br />
Sodium Chloride (NaCl) kg 0,86 0,40 5,88 0,91<br />
Iron (Fe) kg 1,88 0,64 0,82 0,47<br />
Limestone (CaCO3) kg 0,41 0,19 6,19 0,53<br />
Potassium Chloride (KCl) kg 0,01 0,01 0,01 0,01<br />
Gas (feedstock) kg 0,01 0,32 0,43 0,52<br />
Sand (SiO2) kg 0,10 0,07 12,32 0,07<br />
Resources for Energy Conversion Purposes MJ 2.018,80 1.444,76 2.655,68 1.859,25<br />
Of which:<br />
Gas<br />
MJ 735,76 642,41 1171,27 934,77<br />
kg 13,64 11,91 21,71 17,32<br />
Oil<br />
MJ 1.051,16 565,40 939,42 581,16<br />
kg 23,36 12,56 20,88 12,91<br />
Nuclear MJ 140,07 147,47 214,83 194,64<br />
Coal<br />
MJ 88,16 86,38 326,65 145,99<br />
kg 3,15 3,08 11,66 5,21<br />
RENEWABLE RESOURCES<br />
Material Resources kg 15,40 17,02 21,17 18,34<br />
Of which:<br />
Biomass (including water) kg 15,39 15,41 15,35 15,25<br />
Resources for Energy Conversion Purposes MJ 21,87 25,97 86,65 384,20<br />
Of which:<br />
Biomass (solid) 5 MJ 0,49 0,96 3,31 2,44<br />
kg 0,06 0,11 0,37 0,28<br />
GROSS ENERGY REQUIREMENT (GER)<br />
Energy Resources - TOTAL MJ 2.275,44 1.787,37 3.134,77 2.698,58<br />
Electric Energy (core process) MJ 187,90 111,00 229,41 162,05<br />
Electric Energy (use phase) MJ 0,12 0,12 0,00 0,00<br />
WATER USE<br />
Water l 1.076,25 738,92 1.127,77 1.042,19<br />
NOTE: the table shows individually the resources that contribute at least 5% of the total for each<br />
subcategory. Difference between total value of subcategory and the sum of single resources is due to<br />
resources that individually contribute to less than 5%.<br />
4 Resources use data unbundled in upstream processes, core process and downstream processes are reported in Annex 1<br />
5 Including biomass feedstock energy, calculated from its calorific value<br />
Page 8 of 17
POTENTIAL IMPACTS<br />
BEER IN STEEL KEG<br />
Impact Categories<br />
Entire Life Upstream Core Downstream<br />
Cycle processes process Processes<br />
Global Warming Potential (kg CO2 eq.) 141,44 49,48 18,89 73,06<br />
Acidification Potential (kg SO2 eq.) 1,82 1,26 0,06 0,49<br />
Ozone depletion potential (kg CFC 11 eq.) 0,00 0,00 0,00 0,00<br />
Ground level ozone Potential (kg C 2 H 4 eq.) 0,77 0,72 0,00 0,04<br />
Eutrophication potential (kg PO4 -3 eq.) 22,89 22,88 0,00 0,00<br />
BEER IN DM MODULAR 20 KEG<br />
Impact Categories<br />
Entire Life Upstream Core Downstream<br />
Cycle processes process Processes<br />
Global Warming Potential (kg CO2 eq.) 99,60 57,26 11,81 30,52<br />
Acidification Potential (kg SO2 eq.) 1,62 1,35 0,07 0,21<br />
Ozone depletion potential (kg CFC 11 eq.) 0,00 0,00 0,00 0,00<br />
Ground level ozone Potential (kg C 2 H 4 eq.) 0,74 0,72 0,00 0,02<br />
Eutrophication potential (kg PO4 -3 eq.) 22,81 22,81 0,00 0,00<br />
BEER IN GLASS BOTTLE<br />
Impact Categories<br />
Entire Life Upstream Core Downstream<br />
Cycle processes process Processes<br />
Global Warming Potential (kg CO2 eq.) 197,36 143,22 21,24 32,90<br />
Acidification Potential (kg SO2 eq.) 2,28 1,98 0,08 0,22<br />
Ozone depletion potential (kg CFC 11 eq.) 0,00 0,00 0,00 0,00<br />
Ground level ozone Potential (kg C 2 H 4 eq.) 0,77 0,74 0,01 0,02<br />
Eutrophication potential (kg PO4 -3 eq.) 22,24 22,24 0,00 0,00<br />
BEER IN ALUMINIUM CAN<br />
Impact Categories<br />
Entire Life Upstream Core Downstream<br />
Cycle processes process Processes<br />
Global Warming Potential (kg CO2 eq.) 134,31 97,34 16,22 20,75<br />
Acidification Potential (kg SO2 eq.) 1,74 1,54 0,06 0,14<br />
Ozone depletion potential (kg CFC 11 eq.) 0,00 0,00 0,00 0,00<br />
Ground level ozone Potential (kg C 2 H 4 eq.) 0,74 0,72 0,00 0,01<br />
Eutrophication potential (kg PO4 -3 eq.) 22,30 22,30 0,00 0,00<br />
Page 9 of 17
OTHER INDICATORS<br />
WASTE PRODUCTION<br />
BEER IN STEEL KEG<br />
Entire Life Upstream<br />
Downstream<br />
Core Process<br />
Cycle Processes<br />
Processes<br />
Total (kg) 5,35 1,00 1,45 2,9<br />
of which non dangerous (kg) 5,02 0,96 1,44 2,62<br />
of which dangerous (kg) 0,33 0,04 0,01 0,28<br />
BEER IN<br />
Entire Life Upstream<br />
Downstream<br />
Core Process<br />
DM MODULAR 20 KEG Cycle Processes<br />
Processes<br />
Total (kg) 4,17 0,81 1,66 1,70<br />
of which non dangerous (kg) 4,00 0,78 1,65 1,57<br />
of which dangerous (kg) 0,17 0,04 0,01 0,12<br />
BEER IN GLASS BOTTLE<br />
Entire Life Upstream<br />
Downstream<br />
Core Process<br />
Cycle Processes<br />
Processes<br />
Total (kg) 33,62 11,34 1,66 20,62<br />
of which non dangerous (kg) 33,31 11,17 1,64 20,5<br />
of which dangerous (kg) 0,31 0,17 0,01 0,13<br />
BEER IN ALUMINIUM CAN<br />
Entire Life Upstream<br />
Downstream<br />
Core Process<br />
Cycle Processes<br />
Processes<br />
Total (kg) 35,35 32,36 1,20 1,79<br />
of which non dangerous (kg) 35,09 32,18 1,19 1,72<br />
of which dangerous (kg) 0,27 0,18 0,01 0,08<br />
MATERIALS SUBJECT TO RECYCLING<br />
BEER IN STEEL KEG Steel (kg) 32,00<br />
BEER IN DM MODULAR 20 KEG Plastic materials (PET and PE) (kg) 0,50<br />
BEER IN GLASS BOTTLE Glass (kg) 43,13<br />
BEER IN ALUMINIUM CAN Aluminium (kg) 3,99<br />
5. RESULTS INTERPRETATION<br />
The chart and graph shown below are useful to understand the environmental performance related<br />
to the life-cycle of the beer brand <strong>Carlsberg</strong>® in the three distribution scenarios. It should be<br />
remembered that, for a strict comparison of environmental performance, indicators noted above<br />
should be compared with those related to competing products referring to the same functional unit.<br />
Page 10 of 17
RESOURCES CONSUMED (in g)<br />
WATER CONSUMPTION (litres)<br />
ENERGY CONSUMPTION (GER)<br />
(in MJ)<br />
GLOBAL WARMING<br />
POTENTIAL (GWP100)<br />
(kg CO2 eq.)<br />
ACIDIFICATION (kg SO2 eq.)<br />
GROUND LEVEL OZONE<br />
POTENTIAL (kg C 2 H 4 eq.)<br />
EUTROPHICATION (kg PO 4 -3 )<br />
TOTAL WASTE (kg)<br />
TOTAL DANGEROUS WASTE<br />
(kg)<br />
Steel Kegs<br />
DM<br />
Modular 20<br />
Kegs<br />
Glass<br />
Bottles<br />
DM<br />
Modular<br />
20 Kegs<br />
Aluminium<br />
Cans<br />
DM<br />
Modular<br />
20 Kegs<br />
18.887,24 20.061,58 53.861,50 20.061,58 45.058,59 20.061,58<br />
6,22% -62,75% -55,48%<br />
1.076,25 738,92 956,07 738,92 1.042,19 738,92<br />
-31,34% -22,71% -29,10%<br />
2.275,44 1.787,37 3.134,77 1.787,37 2.698,58 1.787,37<br />
-21,45% -42,98% -33,77%<br />
141,44 99,6 197,36 99,6 134,31 99,6<br />
-29,58% -49,53% -25,84%<br />
1,82 1,62 2,28 1,62 1,74 1,62<br />
-10,99% -28,95% -6,90%<br />
0,77 0,74 0,77 0,74 0,74 0,74<br />
-3,90% -3,90% 0,00%<br />
22,89 22,81 22,24 22,81 22,30 22,81<br />
-0,35% 2,56% 2,29%<br />
5,35 4,17 33,62 4,17 35,35 4,17<br />
-22,06% -87,60% -88,20%<br />
0,33 0,17 0,31 0,17 0,27 0,17<br />
-48,48% -45,16% -37,04%<br />
Page 11 of 17
6. INFORMATION FROM THE ORGANISATION<br />
The distribution technology in DM Modular 20 kegs in PET is associated with new dispensing<br />
equipment developed by <strong>Carlsberg</strong> Italy that replaces that traditionally used. Whilst the latest drums<br />
dispense beer through applying CO 2 pressure inside the drums, DM Modular 20 technology provides<br />
for the application of air pressure outside the body, thereby eliminating the use of CO 2 cylinders.<br />
Managers of final sales outlets must dispose of the DM Modular 20 kegs, once exhausted, in the<br />
differentiated recycling of plastics, according to the directions of the local authorities. There is<br />
currently no system for returnable glass bottles, which must be disposed of in separate glass<br />
recycling as indicated by the local authorities.<br />
<strong>Carlsberg</strong> Italy s.p.a., in accordance with the commitments set out in its environmental policy,<br />
approved under the environmental management system certificate ISO 14001, aims at pursuing<br />
pollution prevention, minimization of environmental impacts linked to production processes,<br />
optimizing the use of natural resources and continuous improvement of its environmental<br />
performance, has extended the use of the innovative solution DM Modular 20 to all produced and<br />
marketed brands, thus enhancing the environmental performance, as demonstrated by data<br />
presented in this EPD.<br />
At present <strong>Carlsberg</strong> Italy s.p.a. has undergoing studies on new distribution opportunities of finished<br />
product through PET kegs of different dimension, subjected to Life Cycle Design studies, to limit<br />
environmental impacts of product life cycle.<br />
7. CHANGES COMPARED TO PREVIOUS EPD ISSUE<br />
Changes in indicators compared to the previous issue of this EPD are due to an improvement in<br />
primary data collection carried out by means of an in-depth analysis of LCA study related to direct<br />
impacts associated with individual micro production phases, conducted in 2012 at Induno Olona (VA)<br />
<strong>Carlsberg</strong> Italy s.p.a plant. Percentage variations of main indicator compared to previous EPD issue<br />
are reported in Annex 2.<br />
Aluminium cans distribution scenario was missing in previous EPD issue.<br />
8. INFORMATION FROM THE CERTIFICATION BODY<br />
This EPD was approved by the certification body RINA Services S.p.a. (www.rina.org), accredited from<br />
ACCREDIA (Registration Number 001H), in compliance with the requirements of the standard<br />
"General Programme Instructions" of the international system EPD ® IEC (www.environdec.com) and<br />
of PCR 2011:21.<br />
RINA Services S.p.a is member of international certification network IQNet (www.iqnetcertification.com).<br />
PCR Review conducted by:<br />
Fabio Iraldo<br />
Independent audit of declaration and data, in compliance with standard ISO 14025:<br />
□ Internal<br />
X External<br />
□ EPD process certification<br />
Page 12 of 17
Third part auditor:<br />
Rina Services S.p.A., Via Corsica 12, 16128 Genova, Italy, Tel: +39 010 53051, Fax: +39 010<br />
5351000, www.rina.org<br />
ACCREDIA Registration number: 001H<br />
Information:<br />
Reference Product Category Rules (PCR): PCR 2011:21<br />
Registration number: S-P-00312 Expiry Date: 22.12.2014<br />
It should be remembered that EPD developed according to different programmes may not be<br />
comparable.<br />
This EPD and all regarding information are available on website: www.environdec.com.<br />
9. REFERENCES<br />
For LCA study and EPD declaration fulfilment the following documents were used:<br />
o General Programme Instructions (GPI) for Environmental Products Declarations;<br />
o PCR 2011:21;<br />
o LCA Analysis and Comparison between Distribution Scenario of <strong>Carlsberg</strong>, Tuborg, BAP Chiara<br />
Originale, BAP Bock Chiara and BAP Bock Rossa Beers (17.01.2013, Rev. 2);<br />
o Software Boustead Model 5.11 Database;<br />
o Databases required from reference PCR;<br />
o ELCD Database - European Life Cycle Database (http://lca.jrc.ec.europa.eu);<br />
o Ecoinvent Database (http://www.ecoinvent.ch);<br />
o “The Carbon Footprint of Fat Tire® Amber Ale”, THE CLIMATE CO 2 NSERVANCY.<br />
For disposal of kegs and bottles within differentiated waste collection, managers of final sales outlets<br />
must refer to directions of local authorities<br />
Contacts for environmental product declaration:<br />
Claudia Marsegaglia – <strong>Carlsberg</strong> Italia S.p.a<br />
tel: +39 02 93536911<br />
e-mail: claudia.marsegaglia@carlsberg.it<br />
Fabio Iraldo – IEFE Bocconi<br />
tel: +39 02 58363820<br />
e-mail: fabio.iraldo@unibocconi.it<br />
In realizing this EPD and the LCA study, which forms the scientific basis, <strong>Carlsberg</strong> Italia S.p.a. avails<br />
itself of technical and methodological support of a research team of IEFE – Università Bocconi of<br />
Milan, coordinated by Prof. Fabio Iraldo and composed by Matteo Donelli and Andrea Fontanella.<br />
Page 13 of 17
10. GLOSSARY<br />
LCA: Life Cycle Assessment, is a methodology governed by the ISO 14040 series that aims to quantify<br />
the energy and environmental load of the life cycle of a product or activity, through the<br />
quantification of energy and waste materials and emissions (solid, liquid and gaseous) released into<br />
the environment from the extraction of raw materials to final waste disposal.<br />
FUNCTIONAL UNIT: is the measurement unit to which all results listed in the EPD refer. That<br />
measurement serves as the basis for comparison to compare the data presented in two or more<br />
EPD’s for products belonging to a specific category of homogeneous goods/services, i.e. the same<br />
PCR.<br />
GREENHOUSE EFFECT: atmosphere global warming phenomenon, calculated for the next 100 years,<br />
due to the emission into the atmosphere of greenhouse gases such as carbon dioxide (CO2),<br />
methane (CH4), nitrogen protoxide (N2O), etc.<br />
ACIDIFICATION: lowering the pH of the soil, lakes, forests, due to the release of acidic substances<br />
into the atmosphere, with harmful effects on living organisms (e.g. "acid rain")<br />
EUTROPHICATION: the reduction of required oxygen in water bodies and ecosystems due to the<br />
excessive intake of nutrients such as nitrogen and phosphorus<br />
OZONE DEPLETION: degradation of stratospheric ozone layer, which acts as a barrier against the<br />
ultraviolet component of solar rays, due to particularly reactive compounds, which originate from<br />
chlorofluorocarbons (CFCs) or by chlorofluoromethanes (CFM). The substance used as a reference for<br />
the ODP (Ozone Depletion Potential) is trichlorofluoromethane, or CFC-11.<br />
GROUND LEVEL OZONE: formation of ozone in the earth’s surface due to the release into the<br />
atmosphere of unburnt hydrocarbons and nitrogen oxides in the presence of solar radiation. This<br />
phenomenon is harmful to living organisms, and is often found in large urban centres<br />
GROSS ENERGY REQUIREMENT (GER): is an indicator, expressed in MJ or kWh, of the total energy<br />
extracted from the environment throughout the entire life cycle of a functional unit of a<br />
product/service. Contributing to this indicator are dimensions of energy consumed for manufacturing<br />
processes to produce fuels used in processes, for the phases of transport, in addition to the share of<br />
energy contained and "frozen" in potentially combustible materials.<br />
SHELF LIFE: The length of time a food product can be preserved, that is the time, after packaging, a<br />
product, remains safe in pre-defined environmental conditions.<br />
Page 14 of 17
ANNEX 1 – Resources Use in four distribution scenarios unbundled in Upstream Processes,<br />
Core Process and Downstream Processes<br />
BEER IN STEEL KEG<br />
BEER IN DM MODULAR 20 DRUM<br />
Full Life Cycle<br />
Upstream<br />
Processes<br />
Core<br />
Process<br />
Downstream<br />
Processes<br />
Full Life Cycle<br />
Upstream<br />
Processes<br />
Core<br />
Process<br />
Downstream<br />
Processes<br />
NON RENEWABLE RESOURCES<br />
Material Resources kg 3,49 0,53 1,00 1,95 3,04 1,76 0,47 0,81<br />
Of which:<br />
Crude Oil (feedstock) Kg 0,01 0,00 0,00 0,00 1,16 1,15 0,00 0,00<br />
Sodium Chloride (NaCl) Kg 0,86 0,03 0,77 0,05 0,40 0,05 0,32 0,02<br />
Iron (Fe) kg 1,88 0,38 0,00 1,50 0,64 0,02 0,00 0,62<br />
Limestone (CaCO3) kg 0,41 0,08 0,02 0,31 0,19 0,05 0,01 0,13<br />
Potassium Chloride (KCl) kg 0,01 0,01 0,00 0,00 0,01 0,01 0,00 0,00<br />
Gas (feedstock) kg 0,01 0,00 0,01 0,00 0,32 0,32 0,00 0,00<br />
Sand (SiO2) kg 0,10 0,00 0,10 0,00 0,07 0,00 0,07 0,00<br />
Resources for Energy<br />
Conversion Purposes<br />
MJ 2.018,80 801,44 231,91 985,44 1.444,76 880,91 153,25 410,61<br />
Of which:<br />
Gas<br />
MJ 735,76 511,17 179,50 45,09 642,41 535,99 87,70 18,72<br />
kg 13,64 9,47 3,33 0,84 11,91 9,93 1,63 0,35<br />
Oil<br />
MJ 1.051,16 124,06 24,51 902,59 565,40 153,17 35,99 376,24<br />
kg 23,36 2,76 0,54 20,06 12,56 3,40 0,80 8,36<br />
Nuclear MJ 140,07 120,36 13,15 6,56 147,47 131,83 12,92 2,72<br />
Coal<br />
MJ 88,16 42,05 13,15 32,95 86,38 57,13 16,28 12,97<br />
kg 3,15 1,50 0,53 1,12 3,08 2,04 0,58 0,46<br />
RENEWABLE RESOURCES<br />
Material Resources kg 15,40 15,33 0,05 0,02 17,02 16,95 0,06 0,01<br />
Of which:<br />
Biomass (including water) Kg 15,39 15,33 0,04 0,02 15,41 15,34 0,06 0,01<br />
Resources for Energy<br />
Conversion Purposes<br />
MJ 21,87 9,59 8,25 4,03 25,97 13,10 11,19 1,68<br />
Of which:<br />
Biomass (solid) 6 MJ 0,49 0,28 0,15 0,05 0,96 0,77 0,17 0,02<br />
kg 0,06 0,03 0,02 0,01 0,11 0,09 0,02 0,00<br />
WATER<br />
Water l 1.076,25 198,38 818,05 59,83 738,92 375,45 338,72 24,75<br />
Note: possible inconsistencies in decimal numbers between the total use of resources in column "Full Life<br />
Cycle" and the sum of the three disaggregated values “upstream processes”, “core processes” and<br />
“downstream processes” are due to rounding of values to second decimal place.<br />
6 Including biomass feedstock energy, calculated from its calorific value<br />
Page 15 of 17
BEER IN GLASS BOTTLE<br />
BEER IN ALUMINIUM CAN<br />
Full Life Cycle<br />
Upstream<br />
Processes<br />
Core<br />
Process<br />
Downstream<br />
Processes<br />
Full Life Cycle<br />
Upstream<br />
Processes<br />
Core<br />
Process<br />
Downstream<br />
Processes<br />
NON RENEWABLE RESOURCES<br />
Material Resources kg 32,69 31,19 0,65 0,86 26,72 25,72 0,47 0,54<br />
Of which:<br />
Crude Oil (feedstock) kg 2,00 2,00 0,00 0,00 3,78 3,78 0,00 0,00<br />
Sodium Chloride (NaCl) kg 5,88 5,35 0,50 0,02 0,91 0,58 0,32 0,01<br />
Iron (Fe) kg 0,82 0,16 0,00 0,67 0,47 0,05 0,00 0,42<br />
Limestone (CaCO3) kg 6,19 6,04 0,01 0,14 0,53 0,43 0,01 0,09<br />
Potassium Chloride (KCl) kg 0,01 0,01 0,00 0,00 0,01 0,01 0,00 0,00<br />
Gas (feedstock) kg 0,43 0,42 0,00 0,00 0,52 0,51 0,01 0,00<br />
Sand (SiO2) kg 12,32 12,25 0,07 0,00 0,07 0,00 0,07 0,00<br />
Resources for Energy<br />
Conversion Purposes<br />
MJ 2.655,68 1.952,18 264,01 439,49 1.859,25 1.383,81 196,34 279,10<br />
Of which:<br />
Gas<br />
MJ 1.171,27 954,77 196,80 19,70 934,77 778,12 144,22 12,43<br />
kg 21,71 17,69 3,65 0,37 17,32 14,42 2,67 0,23<br />
Oil<br />
MJ 939,42 500,24 35,92 403,26 581,16 297,16 27,80 256,21<br />
kg 20,88 11,12 0,80 8,96 12,91 6,60 0,62 5,69<br />
Nuclear MJ 214,83 197,93 14,08 2,82 194,64 182,14 10,73 1,77<br />
Coal<br />
MJ 326,65 295,97 16,94 13,75 145,99 123,92 13,35 8,71<br />
kg 11,66 10,57 0,60 0,49 5,21 4,42 0,48 0,31<br />
RENEWABLE RESOURCES<br />
Material Resources kg 21,17 21,10 0,06 0,01 18,34 18,29 0,05 0,00<br />
Of which:<br />
Biomass (including water) Kg 15,35 15,28 0,06 0,01 15,25 15,20 0,04 0,01<br />
Resources for Energy<br />
Conversion Purposes<br />
MJ 86,65 73,51 11,43 1,71 384,20 374,52 8,74 0,94<br />
Of which:<br />
Biomass (solid) 7 MJ 3,31 3,11 0,18 0,02 2,44 2,30 0,13 0,01<br />
kg 0,37 0,35 0,02 0,00 0,28 0,26 0,02 0,00<br />
WATER<br />
Water l 956,07 507,06 422,78 26,23 1.042,19 599,88 425,78 16,54<br />
Note: possible inconsistencies in decimal numbers between the total use of resources in column "Full Life<br />
Cycle" and the sum of the three disaggregated values “upstream processes”, “core processes” and<br />
“downstream processes” are due to rounding of values to second decimal place.<br />
7 Including biomass feedstock energy, calculated from its calorific value<br />
Page 16 of 17
ANNEX 2 – Percentage changes of main indicators compared to previous EPD issue.<br />
Steel<br />
kegs<br />
DM M20<br />
kegs<br />
Glass<br />
Bottles<br />
Aluminium<br />
Cans<br />
Global warming pot. -14% -18% -6% -<br />
Acidification pot. -8% -8% -4% -<br />
Ozone depletion pot. 0% 0% 0% -<br />
Ground level ozone pot. -2% -2% -2% -<br />
Eutrophication -1% -1% -1% -<br />
Gross Energy Requirement -20% -23% -15% -<br />
Water consumption +4% -37% -26% -<br />
Waste -10% -1% -55% -<br />
Page 17 of 17