1 - Internal Revenue Service
1 - Internal Revenue Service
1 - Internal Revenue Service

You also want an ePaper? Increase the reach of your titles
YUMPU automatically turns print PDFs into web optimized ePapers that Google loves.
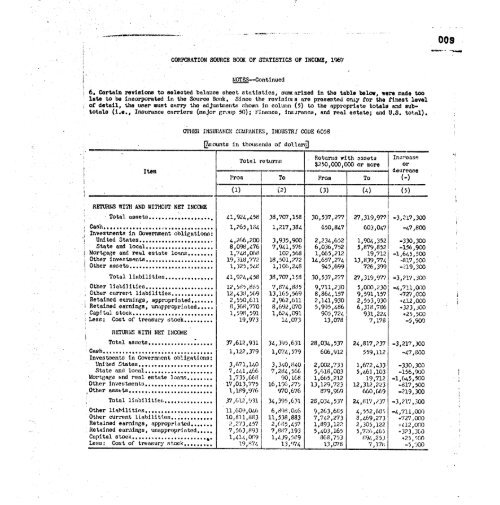
009<br />
CORPORATION SOURCE BOOK OF STATISTICS OF INCOME, 1967<br />
NOTES--Continued<br />
6. Certain revisions to selected balance sheet statistics, sumrarized in the table below, were made too<br />
late to be incorporated in the Source Book. Since the revisions are presented only for the finest level<br />
of detail, the user must carry the adjustments shown in column (5) to the appropriate totals and subtotals<br />
(i.e., Insurance carriers (major group 50); Finance, insurance, and real estate; and U.S. total).<br />
OTHER INSURANCE COMPANIES, INDUSTR1 CODE 6058<br />
•<br />
Item<br />
[Amounts in thousands of dollars]<br />
Returns with assets<br />
Total returnn<br />
$250,000,000 or more<br />
--- -------<br />
From To From To<br />
Increase<br />
or<br />
deerease<br />
(-)<br />
• ...,<br />
(1) (2)<br />
_-<br />
(3) (4) (5)<br />
RETURNS WITH AND WITHOUT NET INCOME<br />
Total assets 41,924,458 38,707,158 30,537,277 27,319,977 -3,217,300<br />
Cash 1,265,184 1,217,384 650,847 603,047 -47,800<br />
Investments in Government obligations:<br />
United States 4,266,200 3,935,900 2,234,652 1,904,352 -330,300<br />
State and local 8,098,476 7,941,576 6,036,752 5,879,852 -156,900<br />
Mortgage and real estate loans 1,748,068 102,568 1,665,212 19,712 -1,645,500<br />
Other investments 19,318,772 18,501,272 14,657,274 13,839,774 -817,500<br />
Other assets 1,325,548 1,106,248 945,699 726,399 -219,300<br />
Total liabilities 41,924,458 38,707,158 30,537,277 27,319,977 -3,217,300<br />
Other liabilities ... 12,585,885 7,874,885 9,711,230 5,000,230 -4,711,000<br />
Other current liabilities 12,438,569 13,165,569 8,864,157 9,591,157 +771,000<br />
Retained earnings, appropriated 2,550,611 2,962,611 2,141,930 2,553,930 +412,000<br />
Retained earnings, unappropriated 8,368,770 8,692,070 5,995,486 6,318,786 +323,300<br />
CapJtal stock 1,598,591 1,624,091 905,724 931,224 +25,500<br />
Less: Cost of treasury stock 19,973 14,073 13,078 7,178 -5,900<br />
RETURNS WITH NET INCOME<br />
•<br />
Total assets 37,612,931 34,395,631 28,034,537 24,817,237 -3,217,300<br />
Cash 1,122,379 1,074,579 606,912 559,112 -47,800<br />
Investments in Government obligations:<br />
United States 3,671,140 3,340,840 2,002,733 1,672,433 -330,300<br />
State and local 7,441,466 7,284,566 5,618,003 5,461,103 -156,900<br />
Mortgage and real estate loans 1,735,668 90,168 1,665,212 19,712 -1,645,500<br />
Other investments 17,013,775 16,196,275 13,129,723 12,312,223 -817,500<br />
Other assets 1,189,976 970,676 879,969 660,669 -219,300<br />
Total liabilities 37,612,931 34, 395,631 28,034,537 24,817,237 - 3, 217 ,300<br />
Other liabilities 11,600 ,046 6,898,046 9,263,685 4,552,685 -4,711,000<br />
Other current liabilities 10,81 . 1,883 11,538,883 7,742,273 8,469,273 +727.000<br />
Retained earnings, appropriated 2,273,457 2,015,457 1,893,122 2,305,122 +412,000<br />
Retained earaings, unappropriated 7,563,893 7,887,193 5,403,165 5,726,465 +323,300<br />
Capital stock 4. 1,414,089 1,439,589 868,753 894, 2 53 +25,500<br />
Less: Cost of treasury stock 19,874 13, 974 13,078 7,176 -5,900
![l..l.l.L. 4DB.DI3-l]t] xxxxxxxxxxxxxxxx - Internal Revenue Service](https://img.yumpu.com/51302394/1/190x245/llll-4dbdi3-lt-xxxxxxxxxxxxxxxx-internal-revenue-service.jpg?quality=85)